Final report for LNE16-354R
Project Information
No-till and cover crops on dairy farms conserve soil and protect soil and water quality, but require management strategies for: i. manure nutrient conservation, ii. reduced reliance on herbicides for crop termination and weed control; and iii. control of pests associated with no-till and cover crops such as slugs. Dairy farm sustainability is threatened by fluctuations in milk price and feed costs. Many dairies have increased herd numbers more than land area and import more nutrients in feed and fertilizer than they export in farm products contributing to a nutrient imbalance. Our objective was to address these no-till management needs and enhance dairy farm sustainability. With input from an advisory panel, our interdisciplinary research and extension team designed two diverse, 6-year, no-till crop rotations to produce all the feed and forage for a typical-sized PA dairy farm (65 milking cattle on 240 acres) with continuous plant cover, crop diversity, and IPM. Initiated in 2010 at 1/20th the scale (12 acres) using farm scale equipment at the Penn State Univ. Agronomy Research farm, each 6-yr rotation compared enhanced conservation practices: i. the “pest rotation” compared a combination of reduced-herbicide (RH) weed control practices to standard herbicides (SH) and used integrated pest management to manage slug and insect pests; ii. the “manure rotation” compared shallow-disk manure injection to the typical no-till, surface manure application practice, as well as a nested comparison of cover/green manure or forage crops. Crop yield and quality were used to simulate milk production for a virtual dairy herd and whole farm performance of two dairy cropping scenarios (standard no-till practices vs. enhanced conservation practices) was simulated and compared. A no-till, corn-soy rotation with pre-emptive insect control practices was also included to assess efficacy of IPM with the diverse rotations. We also compared the impact of two types of tillage as compared to no-till on soil health indicators: i annual conservation tillage was initiated in 2016 in a split-plot in the corn-soy rotation, and ii. conventional tillage to terminate perennial forages once every 6 years in the pest rotation.
Over ten years manure injection maintained similar crop yields and quality and reduced inorganic N fertilizer inputs. As a green manure for corn following winter wheat, red clover interseeded in wheat performed better than hairy vetch and triticale planted after wheat. Rye silage double-cropped after corn silage utilized and conserved fall manure nutrients and increased total forage production. In the pest rotation, weed biomass was greater in the summer annual crops in the RH than the SH treatment. But rotating to the perennial forage particularly with oat companion reduced weed biomass to similar levels and forage yields were similar or greater in the first production year. Soybean yields were reduced in the RH in multiple years, but returns on investment were similar or greater in the RH than SH system. The diverse rotations and IPM provided similar slug and insect pest control, and maintained similar or greater corn grain yields compared to the pre-emptive pest control in the corn-soy rotation. Compared to no-till, conservation tillage reduced soil health in the top 0-5 cm. Conventional tillage once in six years reduced soil health indicators the year after tillage in the top 0-5 cm, but after six years with two years of perennial forages soil health was similar. Compared to benchmark PA dairy farms, producing all of the dairy forage and feed on farm with these conservation cropping systems reduced feed costs and farm economic performance was strong for the five years that we have completed economic analyses. Research results and recommendations were shared widely every year for the past 10 years through field tours, extension events, scientific meetings, residential education classes; and via scientific and extension publications. Over 33 undergraduate students benefited from agricultural research training and experience, and 18 graduate students conducted their research within the project and many are working as agricultural educators and consultants today. With some modifications and funding from the USDA ARS LTAR network in partnership with Penn State this project will continue.
There are two major objectives of this project:
i. to identify how to enhance the sustainability of dairy cropping systems and dairy farms in the Northeast by integrating best management practices with innovative practices and technologies
ii. to promote adoption of the cropping system practices by farmers.
Cooperators
- (Educator)
- (Educator and Researcher)
- (Educator and Researcher)
Research
The injected manure (IM) and the reduced herbicide (RH) cropping system treatments will produce similar crop yields to the broadcast manure (BM) and standard herbicide (SH) treatments in the manure and pest rotations. These enhanced best management cropping systems (IM and RH) will produce similar milk production and dairy farm profitability to the more typical best management cropping system practices (BM and SH).
Soil Fertility
Manure has been identified as a source of P that can accelerated eutrophication in water bodies. In most cases excess phosphorus is applied when manure is applied based on nitrogen demand of crops. In Pennsylvania, dairy farms often grow forages and import grain, enabling them to increase animal units per hectare. Over time, manure application to soil often results in high P and K accumulation and reduced the need for inorganic fertilizers.
In this study, we hypothesized that frequency and methods of manure application influence soil P and K concentration. Even with the low animal stocking rate (0.5 AEU) of the dairy farm we are simulating, dairy manure is applied frequently to crops with low or high P and K removal. Therefore, we evaluated if different frequencies of dairy manure application over time to crops with low or high P and K removal in three different crop rotations increased soil fertility levels and decreased off-farm fertilizer needs after just six years.
Lysimeter and Satellite study
Master’s student Jonathan Binder began is working on winter cover crop management after corn silage and manure application timing as tools for nutrient conservation. On the lysimeter plots we are testing the hypothesis that applying manure in fall prior to planting winter rye and harvesting it spring for silage will increase rye nitrogen and phosphorus uptake compared to a rye cover crop that is killed earlier in the spring. We hypothesize that removing the rye from the plots as silage will decrease nitrogen and phosphorus losses to the environment compared to the rye cover crop treatment. We also hypothesize that by harvesting the rye as silage there will be a higher total combined forage (rye + corn) yield for the plots with rye silage compared to the plots with rye cover.
In a satellite experiment that a continuation of previous master’s student Rachel Milliron’s research, we are exploring nutrient carryover of fall applied manure for the following year’s corn silage crop. We are testing the hypothesis that prioritizing rye planting in the fall will lead to greater rye nutrient uptake compared to prioritizing manure application in the fall. We also hypothesize that injecting manure will conserve N compared to broadcasting manure. Our third hypothesis is that harvesting rye silage will lead to greater overall forage production compared to corn silage with a rye cover crop. Finally, we hypothesize that winter rye harvested as silage will take up more N and P compared to rye that is terminated earlier in the spring as a cover crop.
Integrated Weed Management to Control Glyphosate-Resistant Weeds
In fall 2017, Haleigh Summers began her Masters in Agronomy. She is analyzing the eight years of weed data from the Pest rotation of this Sustainable Dairy Cropping Systems Project. We hypothesize that although weed populations tended to be higher in the reduced herbicide treatment that they would be similar to the standard herbicide treatment by the spring of the production year of alfalfa and orchardgrass, and that they would not be significantly higher in the later years of the rotation compared to the early years. Haleigh Summer is also studying integrated weed management to control Glyphosate-resistant weeds. Her experiments are designed to identify some strategies for a no-till Pennsylvania dairy farmer who has a problem with glyphosate-resistant weeds. The hypothesis of her first experiment is that glyphosate-resistant weeds will be best controlled using several integrated weed management practices instead of just a chemical management approach. In a second experiment, she is comparing control of glyphosate-resistant marestail in soybeans with several burndown and post-emergence herbicide programs in soybeans with and without a rye cover crop. She will conduct a partial budget analyses to better help farmers choose a more cost-effective herbicide program if have glyphosate-resistant marestail.
Monitoring Profitability of Double Cropping Winter Annuals and Corn Silage on Dairy Farms in Northern and Western Pennsylvania
Graduate student Eric Rank is evaluating farm profitability of double-cropping winter annuals and corn silage on case-study dairy farms in Northern and Western Pennsylvania.
Milk prices have remained low during the last two years and producing enough forage to meet all of the cattle needs is important for the economic sustainability of a farm. Double cropping has been widely adopted by farmers in the southern and eastern parts of Pennsylvania where land is becoming less available for farmers. In the colder regions of Pennsylvania, particularly the northern and western area of the state, double cropping is less common, leaving many fields bare throughout the winter, and soil and nutrients escape into watersheds. Without an economic incentive for change, many farmers will not plant a winter cover crop. Planting a winter annual that is harvested for silage in the spring and then double cropped with corn, is one way to benefit the environment, while providing an economical incentive for farmers to implement the practice of double cropping. This research is assessing the economic benefits of double cropping using four case study farms in northern and western Pennsylvania that are currently double cropping. The case studies we produce and this research is also serving as an extension outreach because it actively interacts with farmers, while conducting research.
Hypothesis: Dairy farmers in Northern and Western Pennsylvania are more profitable in the short-term and long-term when double cropping corn with a winter annual crop for silage compared to mono-cropping corn.
Integrated Pest Management (Scouting) and Pesticide Management
During the 2017 growing season, Entomology Masters student Sarah McTish continued to test the hypothesis that employing IPM in the diverse dairy crop rotations with perennials and cover crops conserve and provide habitat for predator populations that help to reduce and maintain low pest populations below the economic threshold as compared to the corn-soybean rotations that employ pre-emptive pest control practices. We also started to monitor potential neonicotinoid runoff that appears to occur in field cropping systems that are regularly planted with seeds coated with neonicotinoid insecticides. Here, we report from the 2017 growing season slug damage, European corn borer damage, potato leafhopper populations, and predation activity. We also report our first year of tracking runoff of the neonicotinoid thiamethoxam from lysimeter plots at our Rock Springs site.
Nitrite Ammonification in Manures and Soils under Adaptive Management for Climate Change (USDA-Nitrite ammonification project)
In efforts to reverse decades of soil organic matter losses, conserve soil, and improve soil health, more farmers are adopting reduced-tillage, cover-cropping, and animal manure addition. Paradoxically, management practices intended to conserve soil and reduce agricultural carbon dioxide (CO2) emissions may result in greater emissions of nitrous oxide (N2O), a gas with 300 times the greenhouse gas (GHG) potential of CO2. This project aims to gain knowledge of how soils and manures can be managed to counteract denitrification and to promote a bacterial process known as nitrite ammonification (NA), the end product of which (ammonium) is not lost directly to the atmosphere. We hypothesize that NA occurs to a significant extent in soils managed using no-till practices and labile carbon (C) amendments, either with animal or green manures. Specific objectives of the USDA-Nitrite ammonification project project are to 1) measure bacterial groups and labile C substrates in manures from dairies of varying size and manure handling systems; 2) measure GHG and temporal and spatial changes in NA and denitrification in no-till soils; 3) conduct soil mesocosm studies to determine relationships between substrates, physicochemical conditions, microbial processes, and GHG to understand conditions favoring NA over denitrification.
Denitrification is known to be the major contributor of N2O in agricultural soils. During this process microbes respire nitrate under oxygen depleted (low redox conditions) to derive energy resulting in N2O as an intermediate product. An alternative nitrate respiring pathway that competes with denitrification is dissimilatory nitrate reduction to ammonia also known as NA. This process entails the reduction of nitrate to ammonium instead of N2O under even lower redox potentials through a nitrite intermediate. Promoting NA in soils could regulate high denitrification rates in soil and hence minimize nitrogen (N) leakage from agroecosystems.
In Pennsylvania, dairy cows produce an estimated 5.5 million tons of reclaimable manure each year and manures contain NA bacteria that has potential to improve N retention in soils amended with manures. Thus manure applications may be enriching soils with NA bacteria and our project is an early step toward insights on managing manures and soil redox potential for N retention. We conducted a pilot study in 2016 where we hypothesized that soils after manure application would have higher abundance of NA microbes as compared to soil before manure application.
5. Hypotheses
The injected manure (IM) and the reduced herbicide (RH) cropping system treatments will produce similar crop yields to the broadcast manure (BM) and standard herbicide (SH) treatments in the manure and pest rotations. These enhanced best management cropping systems (IM and RH) will perform similarly in milk production and dairy farm profitability to the more typical best management cropping system practices (BM and SH).
2019 New Weed Management Rotation Comparison
In 2019, we began testing a new combination of Integrated Weed Management (IWM) practices to test the hypothesis that increased crop diversity and lengthened crop growing season will enable reduced herbicides relative to standard herbicide management. The IWM rotation compares the utilization of both cultural and mechanical weed control to a more standard herbicide control program utilized in the SH rotation. Specifically, the IWM split terminates perennial alfalfa and orchardgrass in spring to extend weed competition in spring prior to corn planting while the SH treatment terminates the alfalfa and orchardgrass in the fall prior to corn planting. In the IWM split, the rye planted after the corn silage entry is harvested as ryelage allowing a longer growth and for weed suppression as well as removing weed biomass from the ryelage harvest itself. Sorghum sudangrass follows the ryelage which again allows for weed suppression via two to three cuttings for forage. The soy after rye cover is planted green, again allowing for increased growth for weed suppression and increased habitat for beneficial predatory insects. Finally, oats are added to the first-year alfalfa and orchardgrass to help suppress weeds as the slower growing perennial crops establish. We hypothesized that these weed suppression methods would allow for four less herbicide applications compared with the SH rotation.
2019 Weed Rotation Planting Green Experiment Hypotheses
Planting green was integrated into the IWM of the Weed rotation in fall 2018 as an integrated weed management tactic. Planting green is a practice where cover crop termination is delayed until at or after cash crop planting. Treatments include a standard cover crop termination (early killed) and planting green practice.
Soybean yield will not differ when comparing planting green practices to standard cover crop termination.
Total late season weed biomass will not differ when comparing planting green to standard cover crop termination.
The higher cover crop biomass in planting green practices will reduce summer annual weed densities and heights at post-emergent timing when compared to standard cover crop termination.
Dairy Farm Comparison
In 2018, we added an additional hypothesis that a dairy farm that employs the diversified conservation practices we have been simulating will perform similarly in milk production and profitability to a typical “Business as Usual” Pennsylvania dairy farm. This modification enabled us to merge with the USDA ARS-LTAR (Agricultural Research Service Long Term Agriculture Research Network) to sustain the project beyond the NESARE USDA funding that ended in December 2019. We substituted a “Business as Usual” dairy cropping system for the PEST SH management plots to simulate a typical Northeastern dairy farm that grows only the forages for the same-sized dairy herd. The Weed Management rotation was added in 2019 and replaced the PEST RH plot management.
Long-Term Weeds Analysis in the Pest Rotation
We hypothesized that compared to relying on herbicides for weed control in no-till, reducing herbicide inputs and relying on cultural and mechanical weed control would: increase weed dry matter (biomass) result in greater weed biomass over time, but not affect cash crop yield iv. or returns to investment.
Herbicide Resistant Weed Management: Integrated Weed Management Experiment and Marestail Experiment
In fall of 2017, Agronomy MS student Haleigh Summers initiated two satellite experiments to evaluate integrated weed management practices that a dairy farm could adopt to control glyphosate herbicide resistant weed species. Seeds of marestail and pigweed to simulate Palmer amaranth or waterhemp were supplemented in microplots in the experiment in fall 2017. When marestail seeds did not germinate in spring, she supplemented them again in spring 2018. Although populations were lower than expected, pigweed seeds did germinate. Supplemented marestail never germinated; therefore, in spring 2018 we established a separate experiment in a field with a resident marestail population to evaluate spring glyphosate-resistant marestail control strategies.
Herbicide Resistant Weed Control with Integrated Weed Management Experiment
Hypotheses:
- Rotating to a perennial forage crop with regular cuttings will reduce the amount and size of pigweed plants by means of mechanical control by the end of the first year.
- A spring-planted oats nurse crop in alfalfa will perform similarly to a post-emergence herbicide application.
- A fall-planted cover crop will reduce the size and density of weeds in the cash crop the following year, whether it is fall-planted oats with alfalfa or rye cover crop with soybean.
- Termination of a fall-planted rye cover crop at soybean planting (“planting green”) will allow the rye to grow larger than if termination occurs two weeks before planting, and therefore be more effective at shading out small weed seedlings.
Marestail Experiment
Hypotheses:
- As expected, based on herbicide product labels, plants shorter than 10-cm are more susceptible to herbicide than taller plants.
- Herbicides that include high rates of active ingredients that specifically control broadleaves will more effectively control taller plants than glyphosate and other herbicides.
- Diverse management practices such as tillage and frequent mowing will be effective strategies to reduce weed biomass in a field
- Diverse control strategies, whether herbicide or mechanical, will be most effective at reducing total weed biomass when applied early in the season.
Integrated Pest Management and Pesticide Management
Similar to previous years, we tested the central hypothesis that compared to crop rotations with little crop diversity and pre-emptive pesticides, crop rotations with greater crop diversity and integrated pest management (IPM) that conserves natural enemies and habitat for beneficial organisms will interrupt pest populations, increase predator populations, and will maintain pest populations below the economic threshold.
Incorporating Cover Crop and Soil Organic Matter Nitrogen Availability into a Fertilizer Recommendation Tool
The increasing use of the winter cover crop (CC) as a nitrogen (N) management tool has necessitated a practical understanding of its effects on succeeding cash crops. In not realizing the need to increase fertilizer application to maintain yield in the face of N immobilization, or the opportunity to decrease fertilizer application to credit CC-N supply, growers may fail to realize the full economic and environmental benefits of CCs. Traditionally, N fertilizer recommendations have been based on yield targets, where a fixed N recommendation is calculated from the desired yield. Some regional N recommendation systems, such as the Penn State Agronomy Guide (Agro. Guide), contain credits for historical manure applications and previous legume crops. However, the difficulty of estimating N supply from CCs and soil organic matter (SOM) has prevented their incorporation into current N fertilizer recommendation systems. The pre-sidedress nitrate test (PSNT) uses early season nitrate levels to tailor N fertilizer recommendations to N mineralization rates. However, considering the change in N cycling dynamics resulting from CC and SOM interactions, and the fact that CCs were not included in the development of the PSNT, the PSNT might not effectively account for N mineralization dynamics following CCs. Charles White led previous work to develop a system of linear equations, and a resultant graphical tool, that can predict CC- and SOM-N supply to a cash crop.
The objective of this research is to advance and test the N supply tool’s capability to predict an N fertilizer requirement for corn based on an accounting of N supplied by CCs and SOM. We hypothesize that the N supply tool’s fertilizer recommendation will be sufficient to sustain N-supply to corn, such that yields will be equal to or better than corn fertilized using the locally-adapted yield-based N recommendation or the PSNT-derived N fertilizer recommendation. To provide a robust test of the N supply tool, Master’s student Anthony Colin finished his second year of research within the rye silage corn grain cropping sequence of the DCS project’s manure rotation.
Soil Health Indicator Hypotheses
We hypothesized that compared to no-till, annual conservation tillage (chisel-disk) in a corn-soybean crop rotation without cover crops or perennials would reduce indicators of soil health such as labile carbon, percent organic matter, total carbon sequestration and water stable aggregates in the top 0-5 cm of soil immediately after tillage.
Occasional full tillage within a no-till crop rotation that integrates perennials and cover crops and primarily employs no-till will not permanently reduce soil health indicators. Specifically, we hypothesized that in the PEST rotation implementing full tillage (primary and secondary tillage with a moldboard plow and chisel disk) once in the 6 year rotation will initially reduce labile carbon, percent organic matter, total carbon sequestration and water stable aggregates in the top 0-5 cm of soil immediately after tillage, but that these indicators will recover to similar levels in later years in the rotation that in other years employs no-till and integrates perennial alfalfa and orchardgrass forage, double and cover crops .
The effects of termination timing on microbial nitrogen cycling dynamics
Research has primarily focused on identifying how changes to the termination time of the forage, alfalfa/orchard grass (AO), impacts microbial nitrogen cycling dynamics. In previous years of the experiment the AO was chemically terminated in the spring of the 3rd year. However, with wetter springs, it is becoming increasingly difficult to terminate the AO in the spring and still plant corn in May, as some orchardgrass recovers. Further, in one year armyworm infestation in the orchardgrass reached the economic threshold. Therefore, the project has been evaluating terminating the AO in the late fall of the 2nd year which some farmers do to be able to plant earlier in the following spring. Currently, the SDCS plots include a fall terminated AO and a spring terminated AO in the manure rotation. Our main objectives and hypotheses are as following:
O1: Determine if there are differences in nitrous oxide (N2O) emissions in the fall terminated AO (2nd year) compared to the spring terminated AO (3rd year).
H1: In the fall, after fall termination of AO, N2O emissions will be highest in the fall-terminated, but overall N2O emissions will be highest in the spring terminated AO.
O2: Evaluate whether termination time of AO impacts microbial nitrogen cycling gene abundances
H2: Spring termination will have the greatest impact on microbial nitrogen cycling gene abundances compared to fall termination. Microbes will be more active in the spring due to the higher temperatures expected and changes in the community is expected as carbon and nitrogen become available from terminated AO.
6. Materials and Methods
We initiated two diverse, 6-year dairy crop rotations using farm-scale equipment at 1/20th scale of 240 acres on 12 acres of Penn State’s Agronomy Research Farm near University Park, PA. Cropping system strategies include no till, manure injection, cover crops, a cover crop roller, perennial legumes, green manure crops, and winter canola. Within each crop rotation we have evaluated innovative management strategies to address no-till management challenges: i. no-till manure management to conserve manure nutrients and reduce losses to the environment with shallow-disk manure injection; and ii. Reducing herbicide and insecticide use with cultural and mechanical integrated weed management practices, and biological and integrated pest management practices for insect and slug management. To examine the effect of diverse rotations managed with IPM practices on insect pests and beneficial insect populations, a corn-soybean grain rotation was also included for comparison purposes at the experimental site on an additional 2 acres. In the corn-soybean rotation, we compare the manure management strategies (injected or broadcast manure), inorganic fertilizer, and in 2016 we included a minimum chisel-disk tillage (Chisel) treatment to evaluate the effects of tillage on soil health parameters. In 2010, our USDA ARS team also established twelve lysimeter plots (50 x 90 ft.) on a slope to compare total nutrient losses and crop uptake between manure and crop management strategies on an additional 1.3 acres.
Until 2018, the NESARE experiment was a nested split-split plot, full crop entry design. All crop phases of each rotation are planted each year on 0.25 acre plots that are replicated four times (12 crop entries for the 2-year rotations, 2 crop entries for the corn-soybean rotation X 4 replications = 56 plots). Each crop entry is the main plot (120 ft. x 90 ft.) that is divided in half (60 ft by 90 ft) to compare the management strategies over time (ex. injected manure or broadcast manure). In 2014 and 2015 we compared green manure crops (red clover vs. crimson clover); the manure rotation has nested split-split plots (30 x 90 ft.) within both manure management strategies. According to the results of our dairy nutrition model, which develops rations for the virtual dairy herd, the farm was already producing sufficient high-quality forage in the manure rotation and there was a need for more low-quality forage production for dry cows and heifers. Therefore, we replaced red clover with rye silage while still having the crimson clover green manure crop at the split-split plots. Crimson clover and rye silage are planted after two or three cuts of sorghum sudangrass, respectively. Typically, we were not able to harvest sorghum sudangrass a third time in early fall, because crimson clover needed to be planted by the end of August to ensure successful establishment. Therefore, in 2018, the crimson clover green manure was removed from the rotation and replaced by rye silage which is harvested for forage the following spring prior to corn planting.
In the PEST rotation there were nested split-split plots (30 x 90 ft.) within the reduced herbicide treatment in the soybean and corn crops that compared two post-planting weed control strategies (high-residue cultivator or post-emergent herbicide). Since the cultivator required wider row spacing (30 inch, 76 cm) than is typical for no-till soybeans, we had also included split-split plots in the soybean standard herbicide treatment to compare the soybean row spacing of 30 inch (76 cm) to a more typical 15 inch (38 cm) row spacing.
In 2018, to compare the performance of the diversified conservation dairy cropping system to a typical Northeastern dairy farm rotation and to secure new and continued future funding from the USDA Long-Term Agricultural Research (LTAR) network, we added a business as usual (BAU) rotation. The BAU farm represents the common Northeast dairy farm that has increased its herd size but has not proportionally increased land area. Therefore, the farm grows all of the herd’s forages and imports feed crops such as corn grain and soybean. To produce all of the forages for the same size 65 milking cow herd as our other experimental dairy farm rotations, the BAU dairy farms half as much land (49 ha.), and therefore applies manure more frequently to corn fields in spring and fall. To do this, we modified the SH pest control rotation to include the 6 yr-dairy rotation (3 yrs alfalfa+grass/3 yr corn silage with cereal rye cover). After consultation with the Advisory panel, we decided it is most representative to apply the dairy manure in the BAU rotation to the three corn entries in both spring and the following fall as well as the fall before planting alfalfa and orchardgrass (Fig. 1). The transition to the BAU rotation in spring 2018, included extending the growing period of the third year of the Alfalfa + Orchardgrass crop, replacing both canola and soybeans with additional corn silage, and relying solely on surface manure application (see 2020 Cropping Schematic, Fig. 1). Similar to the Control rotation, the BAU corn had Bt traits and the seed was coated with neonicotinoid insecticides. Corn and alfalfa were also sprayed with preventative post-plant insecticide applications after planting. The susceptible-BAU first year alfalfa was also sprayed with an insecticidal spray about 10-14 days after each cutting. In 2018, all soybeans in the RH treatment were planted at a row spacing of 30 inches and the SH treatment was replaced with BAU corn. In 2018, we compared the Pest/BAU rotation alfalfa and orchardgrass forage and corn silage crop entries that were paired in side-by side 60 ft x 90 ft main management-plots.
New Weed Management Rotation Comparison
In 2019, we began testing a new combination of new Integrated Weed Management (IWM) practices to test the hypothesis that increased crop diversity and lengthened crop growing season will allow for reduced herbicides relative to the standard or BAU Weed rotation. To this end we converted the Reduced Herbicide (RH) PEST 2018 rotation into the new Weed management comparison by splitting the original 60’ wide plots into two 30’ wide plots: the Integrated Weed Management (IWM) rotation and the Standard Weed (SH) rotation (see 2020 schematic, Figure 1). The IWM rotation employs both cultural and mechanical weed control tactics to more standard herbicide control program in the SH rotation. Specifically, the IWM split terminates perennial alfalfa and orchardgrass in spring with herbicide to extend weed competition until spring while the SH treatment terminates the alfalfa and orchardgrass in the fall prior to corn planting. In the IWM split, the rye planted after the corn silage entry is harvested as ryelage allowing longer spring growth for weed suppression as well as removing weed biomass during the ryelage harvest. Sorghum sudangrass follows the ryelage which via two to three forage harvests provides multiple mechanical weed control events. Soybean after rye cover is planted green, allowing for increased growth for weed suppression and increased habitat for beneficial predatory weed seed insects. Finally, oats are added to the first-year alfalfa and orchardgrass to help suppress weeds as the slower growing perennial crops establish. These weed suppression methods should allow for four less herbicide applications compared with the SH rotation. We sampled weed biomass prior to harvesting two crop entries in the: i. rye prior to corn silage followed by rye or rye silage to sorghum sudangrass and ii. prior to the soybean harvest.
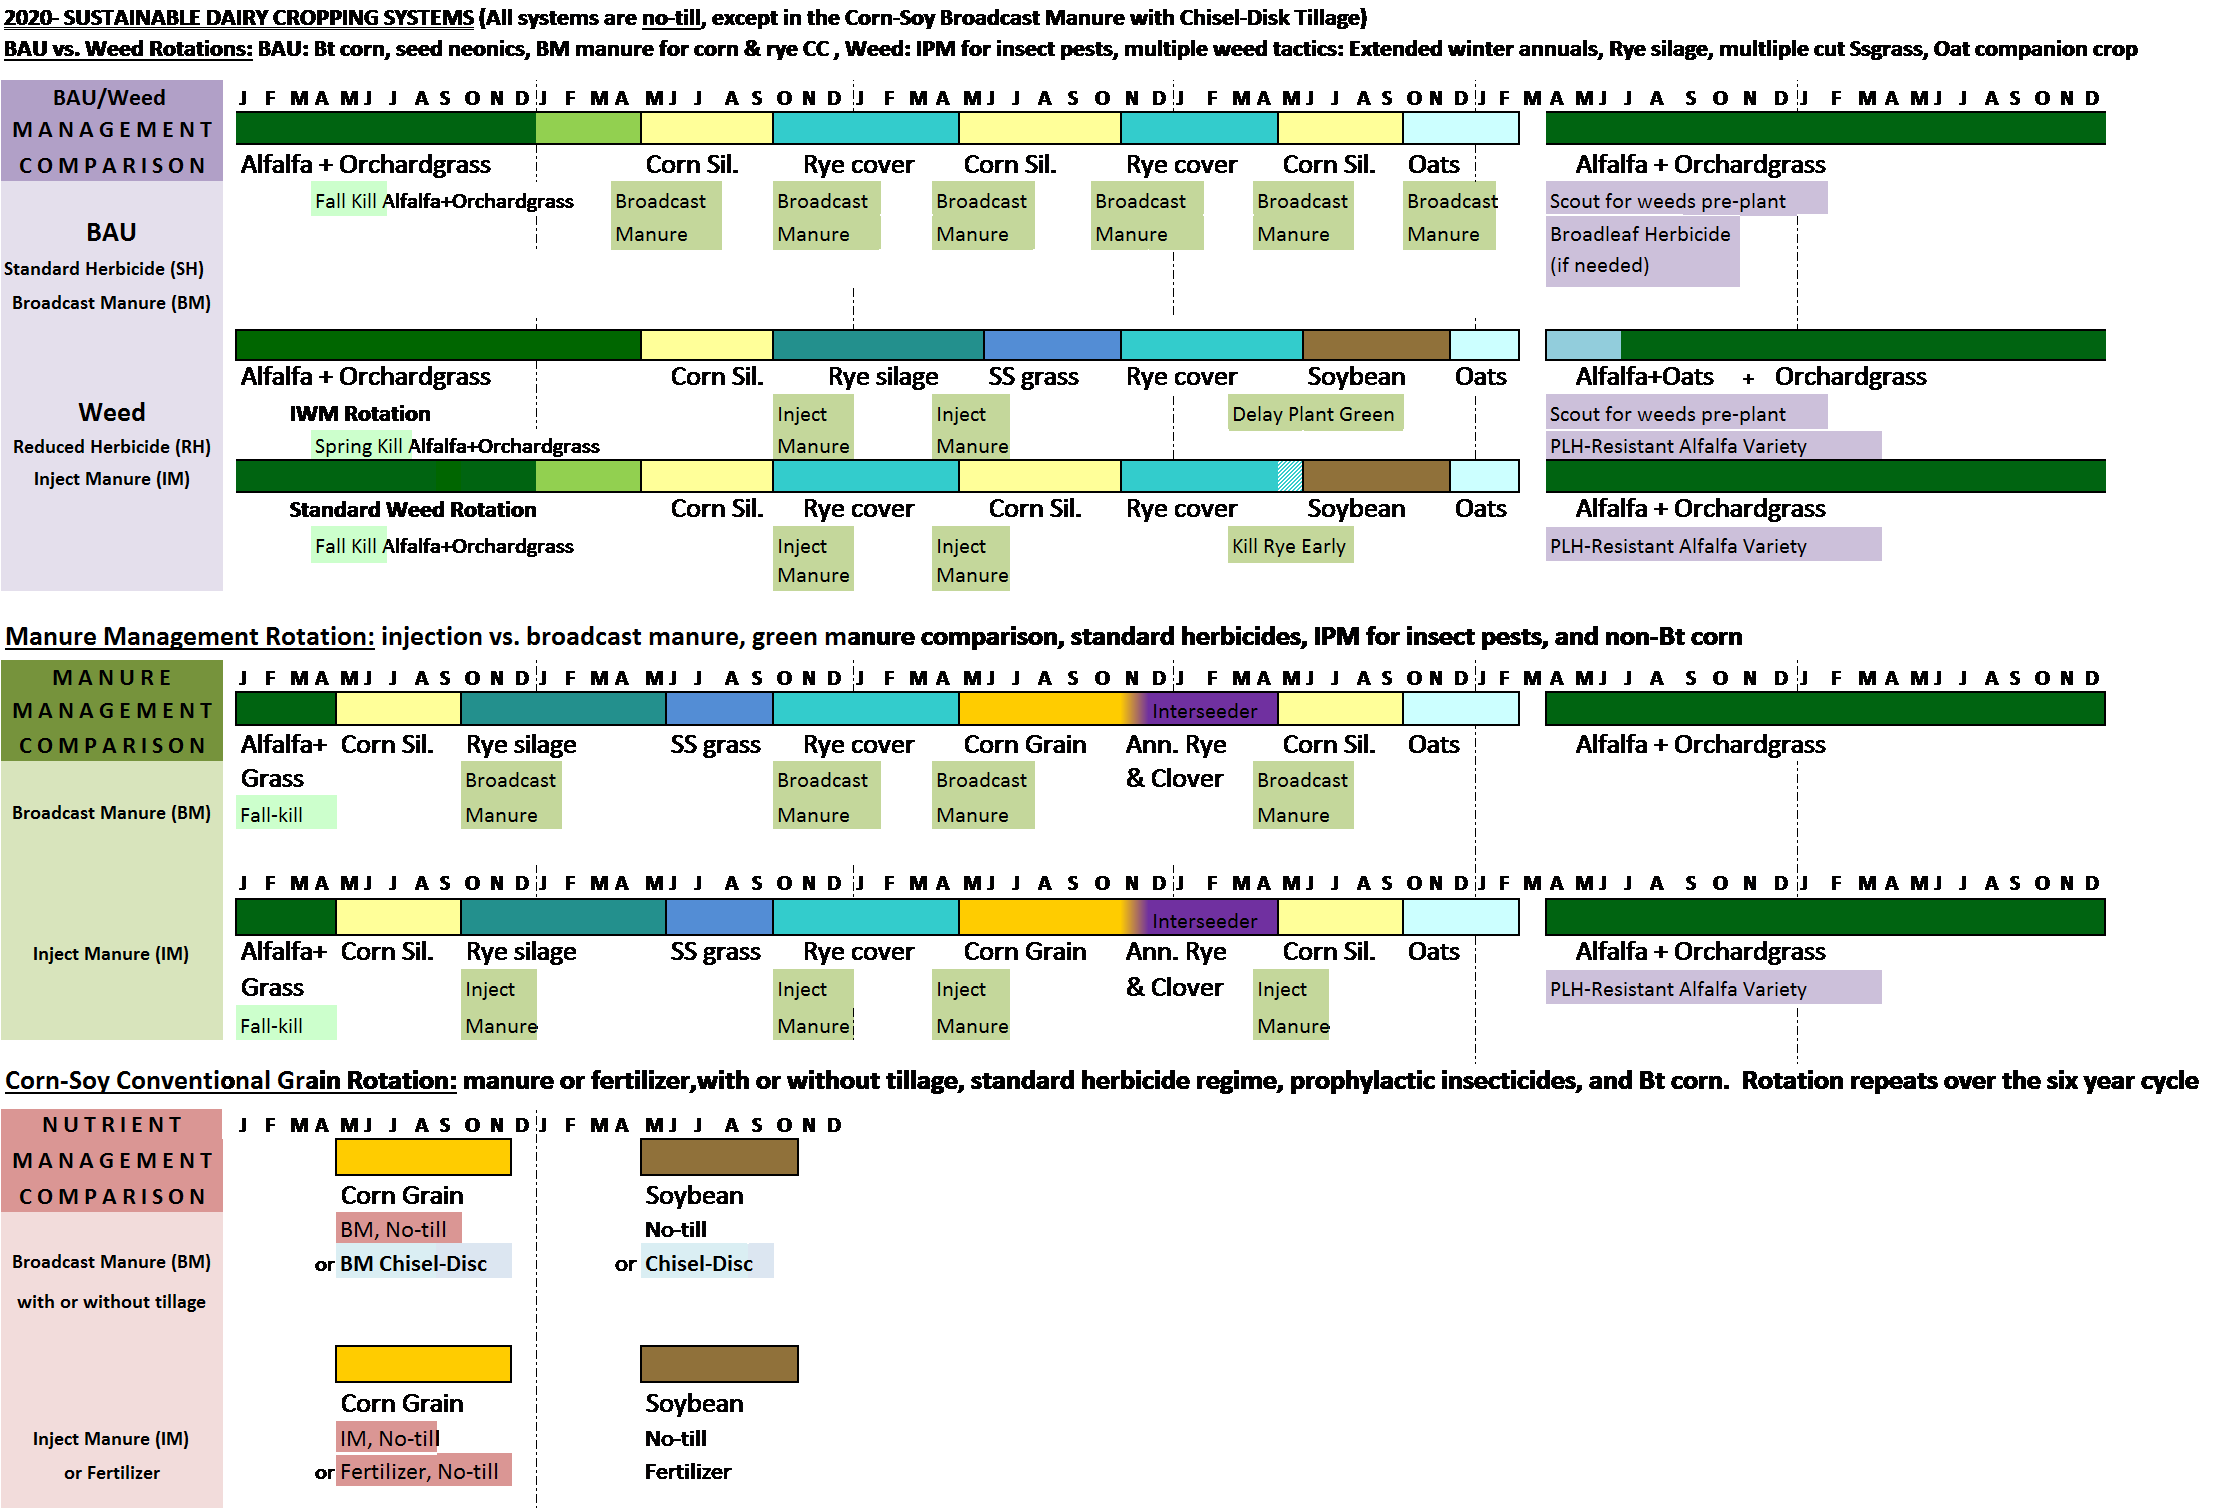
Figure 1. 2019-2020 NE SARE Dairy Cropping Systems Schematic
2019 New Weed Rotation Planting Green Experiment
The treatments were compared in a split-plot design with four replicates. The cover crop in the standard cover crop termination treatment (early killed) was terminated 3 weeks prior to soybean planting. The cover crop in the planting green treatment was terminated on the same day as soybean planting. Cereal rye was drilled at 135 kg ha-1 in both treatments on October 17, 2018. Artificial weed seedbanks of approximately 400 common lambsquarters (Chenopodium album) seeds, 800 redroot pigweed (Amaranthus retroflexus) seeds, and 200 large crabgrass (Digitaria sanguinalis) seeds were established in a 1 m² microplot within each plot. Early killed plots were sprayed with 32 fl oz/ac of glyphosate (Roundup PowerMax) and 16 fl oz/ac of 2-4,D ester on April 30, 2019. Rye biomass samples were collected just prior to termination and soybeans were planted using a no-till planter equipped with a ZRX integrated roller system on May 22, 2019. One day after planting, both treatments were sprayed with 22 fl oz/ac of Roundup PowerMax and early killed plots were sprayed with 3.75 fl oz/ac of Fierce on May 22, 2019. The artificial weed seedbanks were excluded from the Fierce pre-emergence herbicide application. Summer annual weed density and heights from the artificial weed seedbanks were recorded on July 2, 2019. Late season weed biomass samples were collected randomly within each plot on August 15, 2019. All biomass was dried and weighed. Soybeans were harvested on October 11, 2019. Data were analyzed in R (v. 3.6.1) with treatment as a fixed effect and block as a random effect. Analysis of variance was used to test rye biomass, weed densities, weed biomass, and soybean yield responses to treatments. Treatment LSMEANS were considered significantly different at P ≤ 0.05.
We are evaluating multiple performance indicators: crop yield and quality, soil health, nutrient conservation, greenhouse gas emissions, weed and insect populations; and farm profitability. Crop yields were collected for each crop entry point in the BAU, MANURE, PEST, and Weed rotation in each year. We continue to collect three subsamples for forage or feed for quality analysis from each of our main management treatments in the MANURE rotation, as well as the BAU and Weed management rotation at every crop harvest in the NESARE Dairy Cropping Systems Trial. We simulate making corn, alfalfa-grass, sorghum sudangrass, and rye silage and soybean roasting in the laboratory prior to submitting them to Dairy One for forage quality analysis. Data were analyzed with a mixed ANOVA model using SAS JMP Pro 14 with main management and crop phase within a rotation as fixed effects and blocks as random. Treatment LSMEANS were considered significantly different at P ≤ 0.05.
Dairy Farm Comparison
The dairy scientist, Virginia Ishler uses the quality and yield data to develop rations for the virtual dairy herd, and a dairy nutrition model to simulate a dairy herd’s milk production under the three different cropping system scenarios: i. the BAU farm with imported feed crops, ii. the enhanced conservation cropping systems (the inject manure and reduced herbicide managements until 2019) compared to the, iii. more typical conservation practices (broadcast manure and standard herbicide managements until 2018 or the broadcast manure and reduced herbicide management in 2018). Starting in 2019, we began comparing the BAU farm performance to the conservation manure and new weed management rotations: i. the enhanced conservation cropping systems (IM and IWM management) compared to the, ii. more typical conservation practices (BM and SH).
The cropping year for the Virtual Dairy Operation began in 2010 with the assumption that a crop farmer was transitioning into dairy. The operation had the storage structures for ensiled feeds and basic facilities to house animals. The hay-crop season started in May 2010 and youngstock were started on feed in August 2010. The lactating herd was brought in on October 2010 after corn silage was harvested.
Long-Term Weeds Analysis in the Pest Rotation
This experiment began in 2010 and was completed in 2019. Treatments included a standard herbicide treatment and a reduced herbicide treatment compared in a split-plot within a diversified six-year dairy crop rotation (Fig. 2). Herbicides were reduced by: banding herbicide over the corn and soybean crop rows, using inter-row cultivation, reducing the number of herbicide applications, planting an annual companion crop with the perennial forage rather than using herbicide, and plowing once in six years to terminate the perennial forage.
There were three 3-year phases of weed management with changes to improve the cropping system performance or integrate new research questions (Fig. 2). The experiment is a full-entry crop experiment with each phase of the six-year rotation planted each year in a randomized complete block design with four replications. Beginning in 2013, plots were split again to create split-splits in row crops for both treatments. The SH treatment added a split of 38-cm row soybeans as opposed to 76-cm rows in soybeans. The RH treatment added a split where POST herbicide was broadcast rather than cultivation in both corn and soybean crops. Weed biomass data were collected at 10-15 weeks after planting in soybean and corn crops, at each forage harvest in the establishment year, and the first harvest of second year forage. Over the nine years, herbicides were reduced: i. in soybean by 4% in the RH-POST and 32% in the RH-Cult, ii. in corn by 30% in RH-POST and 44% in RH-Cult, and iii. in forage establishment by 37% in the RH treatment compared to the SH treatment. we also rotated modes of action to reduce the selection pressure for herbicide resistant weeds.
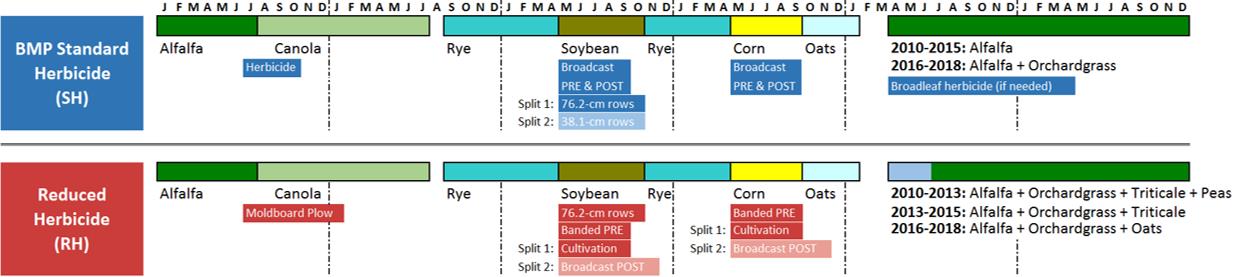
Figure 2: Six-year crop rotation with Reduced Herbicide (RH) and Standard Herbicide (SH) treatments
All data were analyzed with PROC MIXED of SAS® 9.4. Weed biomass was transformed by taking the log of one plus the biomass to normalize the distribution. Data were analyzed with repeated measures of each plot (9-m x 27-m) by year with an autoregressive structure and the Kenward-Rogers approximation. Treatment, year, crop, and the interactions of these terms were fixed effects, while block and the interaction of block and treatment were random effects. The SLICE test was used to test our hypotheses and when there were significant interactions to conduct a partitioned F-test analysis of the LSMEANS for an analysis of the simple or main effects. Treatments were considered significantly different at p<0.05. When the split-treatments of RH-POST and SH-narrow were included, we only compared split-treatments to RH-Cult and SH-wide respectively and did not include Phase 1 in this analysis.
We compared the weed biomass among the three phases by replacing year with phase in the same statistical PROC MIXED model of the log-transformed weed biomass to test the hypothesis that weed biomass would increase more in the RH treatment over time. We used the SLICE test when there were significant interactions to conduct a partitioned F-test analysis of the LSMEANS for an analysis of the simple or main effects, to test if weed biomass was greater in the RH treatment in later phases of the experiment.
Due to the different scales of crop yield, yield data for each crop were analyzed separately with year, treatment, and the interactions of these terms were fixed effects, while block and the interaction of block and treatment were random effects and the Satterthwaite approximation was used. Total annual forage harvest was summed and analyzed for perennial forage crop yields and annual weed biomass. A statistical test revealed 2010 to be an outlier year for the forage establishment year, most likely due to the high annual seeding rate, so we removed 2010 from the statistical analysis of the forage crops.
Herbicide Resistant Weed Management: Integrated Weed Management Experiment and Marestail Experiment
Herbicide Resistant Weed Control with Integrated Weed Management Experiment
This experiment is a nested split-plot design with four blocks in 2018 and five times in 2019. In the soybean treatment, there are three nested treatments of: i. no cover crop, ii. a rye cover crop terminated 10-14 days before soybean planting, and iii. a rye cover crop terminated at soybean planting. All soybean treatments received a burndown of 1.3 kg/ha of glyphosate. Emerged pigweed was covered at burndown application timing to simulate glyphosate-resistance. In the alfalfa treatment there are four randomized nested treatments of with or without an oat cover crop and with or without an oat nurse or companion crop. All alfalfa treatments were planted with a no-till drill on May 1, 2018 and April 24, 2019 and all soybean treatments were planted on May 24, 2018 and May 16, 2019.
One square meter in each plot was supplemented with pigweed seeds at a rate of 1,500 seeds/m2 to simulate a Palmer amaranth or waterhemp population. At each alfalfa harvest, this weed-supplemented microplot was harvested and then sorted into alfalfa, oats, pigweed, and other weeds. The harvested biomass was then dried and weighed. All soybean plots were treated with 0.6 kg ha-1 glufosinate (for post-emergent weed control on July 3, 2018 and June 28, 2019. In soybeans, density counts were taken in each supplemented microplot before and after herbicide applications. Ten weeks after planting, the pigweed biomass was harvested and dried from each supplemented microplot. Data were were log-transformed and analyzed with SAS 9.4 PROC MIXED with crop and treatment as fixed effects and block as a random effect and we used the Satterthwaite approximation. Two-sided F-tests for homogeneity of variance of pigweed biomass in soybean and total annual pigweed biomass in alfalfa, other weed biomass, cover crop biomass, alfalfa yield, and soybean yield and weed density counts, proved years could be combined due to similar variances (Mclntosh 1983). Year was included as a random variable with block nested in year. Weed biomass measured in multiple alfalfa harvests and density counts in soybean were analyzed with repeated measures and the Kenward-Roger approximation. Least square means were determined, and Tukey’s least significant difference was used to compare treatments at p<0.05. The slice test was used for pre-planned contrasts to test hypotheses: i. planting a fall cover crop prior to spring crop establishment compared to no cover crop and ii. spring planting an oat nurse crop with alfalfa compared to not including an oats nurse crop with or without a cover crop.
Marestail Experiment
This experiment is a randomized complete block design with five blocks. Treatments are listed in Table 1. Burndown herbicides were applied on May 17, 2018 and May 8, 2019. Soybean plots were no-till planted in 76-cm rows at 494,000 seeds ha-1 with a no-till planter on May 24, 2018 and May 23, 2019, except the 2018 Chisel disc plots which were planted on May 25, 2018. Burndown application before soybean occurred early to accommodate the label requirements for applying 2,4-D prior to planting Xtend soybean. Oats were planted on May 29, 2018 and April 23, 2019. After the oat harvest and a burndown application, sorghum sudangrass was planted on July 11, 2018 and July 9, 2019 and POST applications on soybean were made on July 2, 2018 and June 25, 2019.
Oats were harvested on July 10, 2018 and July 9, 2019 and sorghum sudangrass was harvested on August 24 and October 3, 2018 and August 10, 2019. We only harvested sorghum sudangrass once in 2019 due to a cold spring and less growth. Soybean plots were harvested on November 12, 2018 and November 20, 2019 and adjusted to 13% moisture. Due to regulations, Enlist soybean plots were destroyed before flowering in 2018; so, we were unable to harvest weed biomass or soybean yield in those plots.
Marestail plants were classified into one of four size categories i. small (not bolting, less than 5-cm wide), ii. medium (not bolting, greater than 5-cm wide), iii. large (bolting, shorter than 10-cm), and iv. extra-large (bolting, taller than 10-cm) and marked. These marked plants were reassessed before and after each management strategy such as an herbicide application, mowing, or tillage. At ten weeks after planting soybeans, all weeds were harvested for their biomass and sorted into marked marestail, unmarked marestail, and other weeds. This biomass was then dried and weighed. Missing plants were not included in this calculation and data were analyzed with SAS 9.4 PROC MIXED with weed control program and size as fixed effects and block as a random effect. Biomass data was transformed by adding 1 and taking the log prior to analysis. Tukey’s test was used to compare treatment differences among LSMEANS and were considered significantly different at p < 0.05. When interactions were significant, the slice test was used and treatments were considered significantly different when p<=0.05.
In 2019, when soybean competition with weeds was reduced by deer damage, soybean biomass was included as a covariate to explain weed biomass. Because there was not a soybean biomass covariate in 2018, years could not be combined and were analyzed separately. Deer damage was not uniform across control programs in 2019; so, we only compared the strategies when analyzing total weed biomass. Reported values are back transformed. Control efficacy of marked horseweed plants was analyzed using the lme4 program in R (R Core Team 2018) with an empirical logit link function and a binomial response distribution (Collett 2000; Bolker et al. 2009; Warton and Hui 2011; Stroup 2015). Size was treated as a split-plot in program or strategy and both were modeled as fixed effects, and block and the interaction of program or strategy x block as random effects. Estimates of control efficacy of programs or strategies were compared with Tukey HSD and considered different at p< 0.05. Reported values were back-transformed to report predicted probabilities
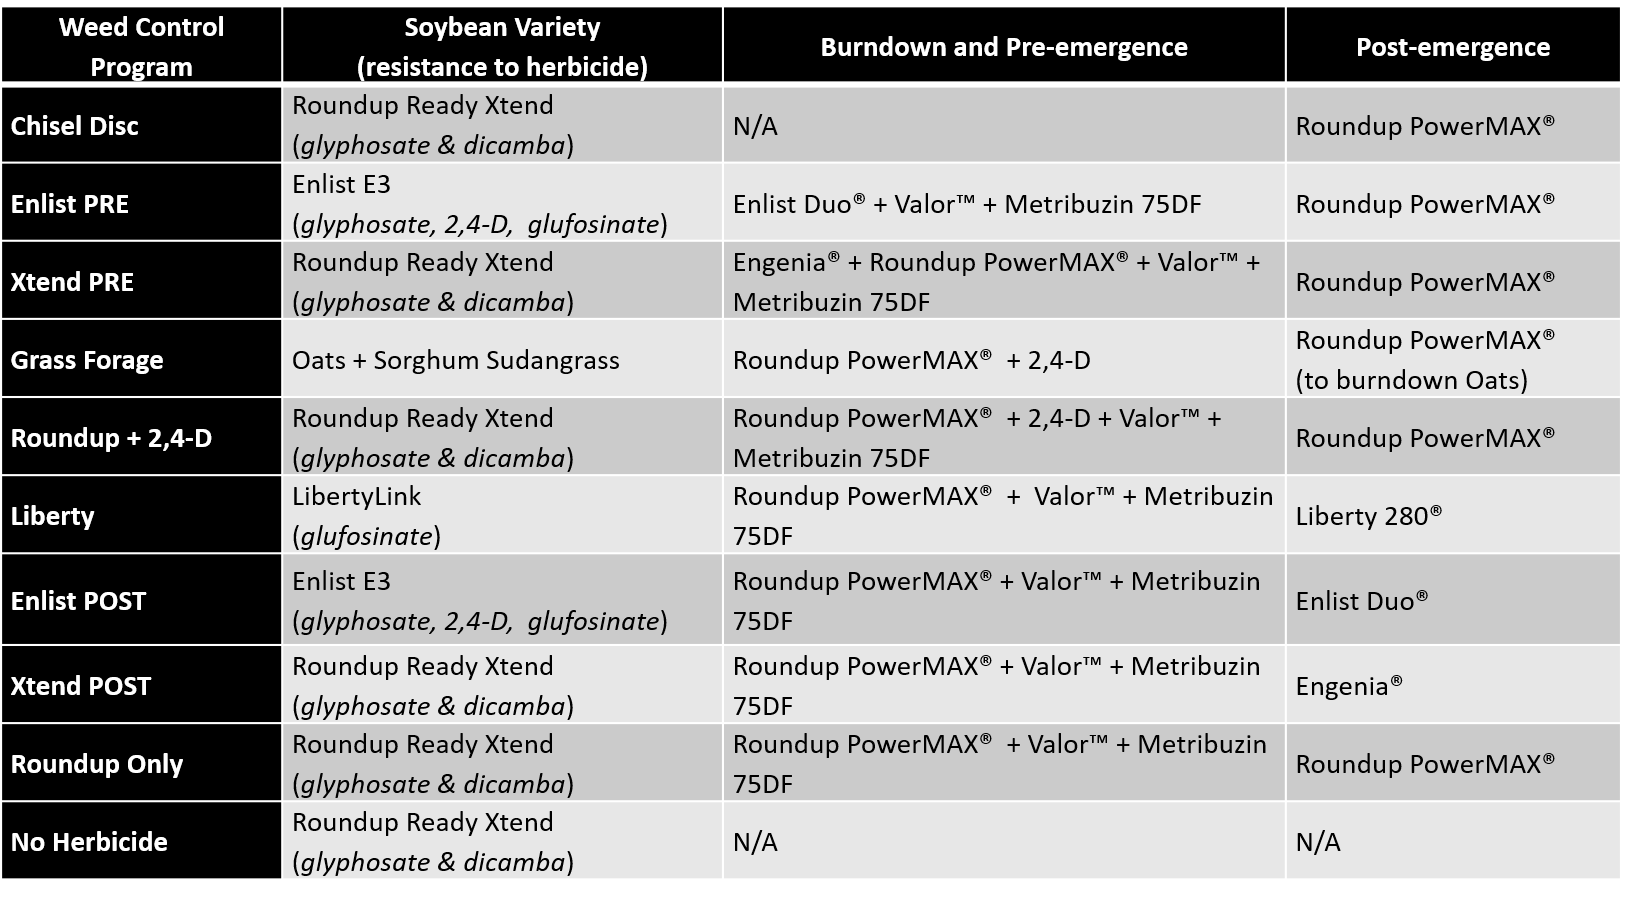
Table 1: Weed control program treatment differences of soybean variety, burndown, pre-emergence and post-emergence herbicides
Integrated Pest Management and Pesticide Management
During the 2019 growing season, we continued to monitor pest and predator populations.
Both the BAU and Control rotations were planted with transgenic Bt seeds coated with neonicotinoid insecticides. In these two rotations corn and alfalfa were also sprayed with preventative post-plant insecticide applications. In the BAU rotation, we sampled three corn entries, two following rye and one following alfalfa. Within the Corn-soybean Control rotation, we also compared the pest populations in corn among the three no-till nutrient treatments (IM, BM, and inorganic fertilizer: Fert) to the BM treatment that was chisel-disked in both the corn and soybean production years. The Weed and Manure rotations were planted with non-Bt/untreated seeds and were not sprayed with a preventative insecticide post-plant. These rotations relied on IPM for insect pest control.
Early Damage in Corn
To assess early damage in corn (slug, cutworm, and army worm), two 10-ft-row sections were randomly selected in each split-split plot of corn. Within that 10-ft section, each individual plant was assessed for damage and given a rating between 0 and 4 depending on proportion of leaf area removed by early season pests (0: no damage, 1: <25%, 2: 25-50%, 3: 50-75%, 4: >75%). This assessment was done at the V2 growth stage.
European Corn Borer (ECB) Damage
European corn borer (ECB) damage assessments were completed close to corn harvest to quantify damage from both first- and second-generation European corn borers. We assessed damage in rows four and eight of each corn split-split. In each of these rows, we sampled two plants every 20 feet and counted the number of entry holes. Through this process, we sampled 6 plants per row, or 12 plants per split-split. In addition to counting entry holes, we also tallied the number of lodged plants while walking through the rows.
To test the hypothesis that crop diversity, IPM, pest scouting and pest control practices that conserve natural enemies could control pests similarly to pre-emptive pest control in crop rotations with less diversity, we compared multiple measures of slug, early season caterpillars, predation of pests, slug predators, corn crop damage and plant establishment in the first three years (Phase 1) and the second three years (Phase II) of the experiment. We conducted analysis of variance with GLM in R, and used the LSMEANS package to perform planned contrasts of the diverse IPM (HiDiv-IPM) cropping systems compared to the low diversity pre-emptive (LoDiv-PP) pesticide control corn-soy cropping system, and considered treatments statistically significant when P<0.05.
For the last four years of the experiment (2016-2019), we compared corn pest damage ratings (due to slugs and early season insect pests) and the proportion of plants that established at the V2 stage with ANOVA for a mixed model using SAS JMP Pro 14 with treatments as fixed effects and year and blocks as random. Analyses were conducted for treatments and corn entries within a rotation as well as across the HiDiv-IPM and LoDiv-PP systems. At the V5 stage we only have complete data from 2017 and 2018, and we conducted the ANOVA with a mixed model with SAS JMP Pro 14 analysis, but year was a fixed effect. Treatment LSMEANS were considered significantly different at P ≤ 0.05 and we used Tukey’s separation of means test for LSMEANS that were considered significantly different at P ≤ 0.05. We also compared European Corn Borer damage between HiDiv-IPM and LoDiv-PP the cropping systems with ANOVA for a mixed model with SAS JMP Pro 14 analysis. Treatment LSMEANS were considered significantly different at P ≤ 0.05 and we used Tukey’s separation of means test for LSMEANS that were considered significantly different at P ≤ 0.05
Incorporating Cover Crop and Soil Organic Matter Nitrogen Availability into a Fertilizer Recommendation Tool
The CC C:N ratio is a determinant factor in the mineralization or immobilization of CC- and SOM-N. The tool’s equations first predict C:N ratio using SOM levels, nitrate-N available to the CC at planting, growing degree days between planting and termination as a measure of CC maturity, and the proportional seeding rate of non-legume CC species in the CC. The fall and spring CC C:N ratio, N content of the CC, and SOM are then used to predict SOM- and CC-N supply, which is expressed as relative yield (RY). This relative yield represents the predicted yield of a corn crop receiving only N supplied by CCs and SOM divided by the yield potential (YP) of a fully N-sufficient corn crop. The next step is to translate the potential management advantages of this pre-season prediction of N supply into an actionable N fertilizer recommendation (NFR) using the physiological N requirement (Nr) of corn. We propose Eq. 1. as a means of doing this.
Eq. 1 FR = Nr [YP – ( RY*YP)]
Treatments in the previous year’s rye silage to corn grain sequence were constrained to a comparison of the PSNT and N supply tool (CC Tool). In 2018, the fertilizer recommendations were calculated using a 10.04 Mg ha-1 yield goal. In 2019, we reduced the yield goal to 8.6 Mg ha-1 based on a linear regression of previous yields by planting date. Additional plot space allowed us to include a treatment from the PSU Agronomy Guide (Agro Guide) and an additional PSNT treatment calculated using the same 10.04 Mg ha-1 yield goal used previously. The lower-yield-goal PSNT (PSNT 137), higher-yield-goal PSNT (PSNT 160), N supply tool (CC Tool), and Penn State Agronomy Guide (Agro Guide) recommendations were each applied to 15 X 90 ft (6-row) plots.
To calculate the N fertilizer recommendations from the CC Tool and PSNT recommendation systems, samples were taken between rye planting in October 2018 and the V6 growth stage of the corn grain in June 2019. We took 15 soil samples (0-20 cm depth) per plot in November of 2018. SOM (%) was determined by the Penn State Agricultural Analytical Services Lab via loss on ignition for input into the CC Tool. The rye silage was topdressed with 89.9 kg ha-1 N in April and harvested mid-May of 2019. To adjust for the effect of fertilization on CC C:N ratio, 20 mg kg-1 nitrate-N was used in the CC Tool calculations. We based this adjustment on previous experience for typical soil nitrate values under fertilized conditions. GDD accumulation of 1763 (deg F; base 32) was calculated using the Network for Environment and Weather Applications (NEWA) Degree Day Calculator. Manure was broadcast on May 24th, 2019, 12 days before corn grain was planted. Using availability factors from the Agro. Guide, we subtracted 37.6 kg ha-1 N from the CC Tool recommendation. To account for the harvest of the rye silage, we used a CC biomass N content of 0 Kg ha-1 N. All treatments received 3.8 kg ha-1 N at planting, but this was only subtracted from the Agro Guide and CC Tool rates. PSNT soil samples (0-30 cm depth) were collected in June, subsampled and extracted using 2M KCl, and analyzed for nitrate-N colorimetrically on a microplate spectrophotometer using the Griess reaction with vanadium(III) as a reducing agent. Lastly, to calculate the Agro. Guide recommendation, we multiplied our yield goal, 8.6 Mg ha-1, by 17.84 kg N Mg-1 grain. In addition to subtracting the same spring manure-N availability credit, we calculated and subtracted 14.6 kg ha-1 N of plant-available N from the Agro. Guide recommendation to account for the historical frequency of manure application within this rotation. Treatment rates were side dressed as UAN 30% N solution in July.
To assess sufficiency of recommendation methods, yield was estimated by harvesting two representative rows from each plot in late November of 2019. Yields were analyzed both by year and across years with SAS 9.4 PROC MIXED. Yield was a fixed effect using stand counts taken in October as a covariate, and block was a random effect. Differences determined by Fisher’s LSD were considered significant when p<0.05.
Soil Health Indicator Research
Routine soil data has been collected every three years during the dairy cropping systems project, beginning in 2010 (collection years were 2010, 2013, 2016, and 2019). In the Control or Corn-Soy rotation in 2016 we initiated yearly chisel-disking treatment in one of the 30 ft x 90 ft split-split plots in the corn-soy rotation that had been receiving broadcast manure prior to corn planting. In 2016 we began chisel-disking these split-split plots prior to planting soybean and in the corn phase after broadcasting manure and prior to planting corn. One of the other 30 ft x 90 ft split-split-plots that had been receiving in-organic fertilizer prior to corn since 2012 was converted to a broadcast manure prior to corn and no-till treatment and the other two 30 ft x 90 ft split-split-plots corn year nutrient treatments were continued: no-till with synthetic fertilizer application and no-till with manure injection.
In the BAU/Weed management rotations, no-till (BAU) plots that were SH until 2018 were converted to the BAU and compared to the Weed rotation plots that from 2010 to 2019 in August had received full tillage (moldboard plow followed by chisel-disk) to terminate alfalfa and orchardgrass once every six years.
In early spring 2019 prior to field operations, five soil samples were collected at 0-5 cm and 5-15 cm per split-split plot in the Corn-soybean, Control rotation and 10 samples in the BAU and WEED split plot (main management level) were collected and combined for soil labile carbon and percent organic matter analysis. For water stable aggregate (WSA) stability, ten soil samples were collected to 15 cm that were stored in sealed plastic boxes until they could wet sieved to obtain 1-2 mm macroaggregates which were then air-dried at room temperature for 24 hours. We measured % WSA with a modified standard wet-sieving technique. We used slaking instead of misting for rewetting the air-dried aggregates, because slaking is more rigorous and would detect the differences among the crop treatments better than misting and we increased the duration of wet-sieving to five minutes. Four grams of the air-dried 1-2 mm aggregates were transferred to the 0.26 mm size sieve of the standard sieving machine. Samples were then submerged in distilled water for 5 minutes before the sieving started. The sieves were raised and lowered for 5 minutes @ 36 cycles minute-1 with a stroke length of 1.0 cm. Material that passed through the sieve after 5 minutes was collected in the metal can, oven dried, and weighed to estimate unstable aggregates. The soil that remained on the sieve was then subjected to in 0.2 M sodium-hexametaphosphate solution to disperse sand from the stable aggregate soil fraction. Disrupted aggregates were gently pushed through the smallest screen with water and a rubber policeman. Sand or coarse material was collected on the screen, washed into pre-weighed weigh boats, dried, weighed, and subtracted from the amount of aggregates collected after wet sieving to calculate the percentage of sand-corrected aggregate stability.
Labile carbon or active carbon was estimated according to the POXC (Permanganate Oxidizable Carbon) method developed by Weil, et al. 2003 but was modified for 2.5 g soil sample. In a 50 mL graduated polypropylene conical centrifuge tube 2.0 mL of a 0.2M KMnO4 with distilled water to the 20 mL mark were swirled into a solution with 2.5 g of dry soil. The sample was shaken by hand for 2 minutes (about 120 strokes/minute) and then allowed to stand for 10 minutes in a rack that was protected from sunlight. A standard curve was created using 0.01M and 0.02M KMnO4 standard solutions. Then 0.05 ml of the liquid from the settled soil - KMnO4 sample was transferred to a tube of distilled water that was brought up to the 50 mL mark and shaken and the absorbance of the sample was read. To estimate the amount of C oxidized, we assumed that 1 mol MnO4 is consumed (reduced from Mn+7 to Mn+4) in the oxidation of 0.75 mol (9000 mg) of C:
POXC (mg kg–1) = (0.02 Mol/L – (a+b*absorbance))*(9000 mg C/Mol)*(0.02 L soln./0.0025 kg soil)
where, 0.02 Mol/L is the initial solution concentration, a is the intercept and b is the slope of the standard curve, 9000 is mg C (0.75 Mol) oxidized by 1 Mol of MnO4 changing from Mn+7 to Mn+4, 0.02 L is the volume of KMnO4 solution reacted, and 0.0025 is the kg of soil used.
Percent soil carbon was analyzed at the USDA-ARS Pasture lab with an Elementar Vario Max elemental analyzer with combustion analysis of carbon to CO2 and measured with a gas chromatograph. The percent carbon was converted to percent organic matter using the conversion factor from Ranney, 1969 (% organic matter = 0.35 + 1.80 x % soil carbon). Total soil carbon was calculated by correcting soil percent carbon for soil bulk density that was sampled in the treatments in fall 2019.
The effects of termination timing on microbial nitrogen cycling dynamics
Nitrous oxide emissions were measured in fall of 2019 before fall termination (FT) into the beginning of December. A Gasmet portable gas analyzer was used to take the N2O field measurements from both the fall terminated (FT) and spring terminated (ST) plots. Measurements were converted to grams of N2O-N per hectare per day (g N2O-N/ha/day) for analyses. Mixed linear models were performed to determine if termination time (i.e. fall versus spring), day of measurement (DOY) or termination*DOY had a significant effect on N2O emissions using SAS (SAS Institute, USA).
Rhizosphere soil was sampled in the FT and ST plots before FT, and before ST to assess changes to the microbial N cycling gene abundances in the spring in the FT and ST plots. Rhizosphere samples were extracted by taking approximately 10 cm * 10 cm samples from the field, removing roots from the cores, and then washing the roots to remove the closely adhered soil particles. Samples were centrifuged to pellet the soil, DNA was extracted, and quantitative PCR (qPCR) was performed to quantify three nitrogen cycling genes, nirK, nosZI, and nrfA.
8. Research Results and Accomplishments in 2019
Weather
Across the 10 years, temperatures varied relative to the thirty-year average, with some warmer than typical April temperatures but also cooler average monthly temperatures in some months in 2011, 2013, 2014, 2017, and particularly 2018. Rainfall totals were less consistent across years, with wet springs in 2011 and 2019, rainy summers in 2013, 2015, 2017, and especially 2018 which was Pennsylvania’s wettest year in recorded history. In 2019, the weather in 2019 returned to more historically normal conditions as indicated by the 30 year normal data (Fig. 3)
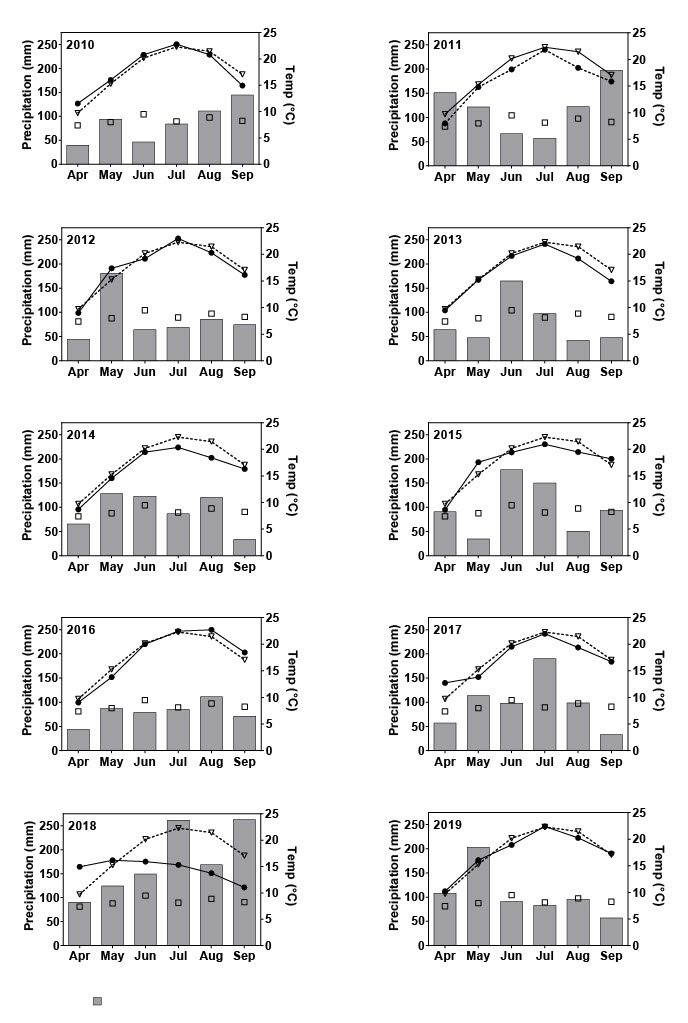
Figure 3. Yearly bar graphs represent total monthly precipitation (mm, bars) and lines represent monthly average air temperature (C, black circles) collected from 2010-2019 at the Natural Resources Conservation Service (NRCS) weather station site at Rock Springs, Centre County, Pennsylvania (4043 N; 7756 W. The weather station is 1220 feet high above sea level and adjacent to NE SARE Dairy cropping systems research site. The 30-year normal data also depicts total month precipitation (mm) (open squares) and average monthly air temperature (C) (open triangles with dashed line) from 1981-2010. Data was obtained from the National Oceanic and Atmospheric Administration’s Climate Data Online webpage using meteorological data from the State College, PA weather station (Station ID: GHCND:USC00368449)
Weed Rotation/BAU Rotation: Yields
In the split Weed rotation, yields of the paired alfalfa, corn silage, and soy crop entries did not differ significantly between the IWM and SH splits (Table 2). However, alfalfa yields in the Weed rotation were significantly smaller compared with the corresponding yields from the Business As Usual (BAU) rotation (Table 2) which may be due to nutrients provided by the manure application in the BAU in fall 2018. There was no significant difference in corn silage yields between the Weed and BAU rotations.
|
Crop |
BAU |
Weed (IWM) |
Weed (STD) |
SE |
P-Value (Overall) |
P-Value (IWM vs STD) |
|
|
|
|
-Mg ha-1 - |
|
|
|
|
Alfalfa Yr1 |
3.98 |
1.71 |
1.59 |
0.23 |
>0.001 |
0.63 |
|
Alfalfa Yr2 |
10.94 |
9.00 |
|
0.83 |
0.03 |
|
|
Alfalfa Yr3 |
12.38 |
10.91 |
|
0.46 |
0.04 |
|
|
Corn Silage (after Alfalfa) |
14.26 |
13.05 |
13.40 |
0.72 |
0.22 |
0.68 |
|
Corn Silage (after Rye) |
14.65 |
|
14.67 |
0.56 |
0.98 |
|
|
Rye Silage |
|
3.26 |
|
0.12 |
|
|
|
Sorghum sudangrass |
|
6.31 |
|
0.63 |
|
|
|
Soybean |
|
3.82 |
3.77 |
0.13 |
|
0.78 |
Table 2. Summary of forage and grain yield comparisons between Business As Usual (BAU) and Weed rotations during 2019 growing season. All yields are presented in dry matter basis. Main management treatments were considered significant when P < 0.05.
Manure Rotation: Nitrogen Fertilizer Amendments and Yields
Manure management strategies did not influence forage or grain yields in the Manure Rotation in 2019 (Table 3). As in the past, corn silage and grain yields did not differ between the IM and BM treatments, even though the PSNT tests typically indicated that the IM treatment corn grain required less side-dress N than the BM treatment and the corn silage side-dress N was similar or 40 lb/A greater in the IM. When manure was applied in fall to rye silage planted after corn silage, we top-dressed the BM treatment in spring 2014, but not the IM treatment which resulted in greater rye silage and subsequent double-cropped sorghum sudangrass yields in the BM treatment that year. This indicated that both rye silage and sorghum sudangrass treatments would respond to some additional spring top-dress N. Therefore, since spring 2015 the IM treatment was top-dressed with 30 lb/A less than BM rye silage, and ryelage yields have not differed. These inorganic N amendment differences across all crops in the 6 year manure rotation over the first 9 years (2010-2018) resulted in on average a 35% reduction of side-dress & top-dress inorganic N fertilizer applied in the IM compared to the BM treatment, while maintaining similar or occasionally greater yields of corn, ryelage and sorghum sudangrass in the IM treatments with the exception of 2014 (when only the BM treatment was top-dressed in spring).
Rye silage was harvested after corn silage and after sorghum sudangrass. Rye silage planted after corn silage received fall manure application whereas rye silage planted after sorghum sudangrass did not, however the resulting yields were not significantly different between the manure treatments.
|
Crop |
Year |
IM |
BM |
SE |
P-Value |
|
|
|
--- Mg ha-1 --- |
|||
|
Alfalfa+grass Yr 1 |
2013 |
4.84 |
4.20 |
0.36 |
0.20 |
|
|
2014 |
10.14 |
10.66 |
0.41 |
0.16 |
|
|
2015 |
7.85 |
7.20 |
0.25 |
0.05 |
|
2016 |
7.96 |
8.90 |
0.39 |
0.29 |
|
|
2017 |
8.98 |
9.51 |
0.40 |
0.26 |
|
|
|
2018 |
6.07 |
5.59 |
0.24 |
0.04 |
|
|
2019 |
3.71 |
3.80 |
0.19 |
0.52 |
|
Alfalfa+grass Yr 2 |
2013 |
5.57 |
5.58 |
0.35 |
0.93 |
|
|
2014 |
14.90 |
15.32 |
0.52 |
0.23 |
|
|
2015 |
11.58 |
11.29 |
0.44 |
0.72 |
|
2016 |
13.36 |
14.78 |
0.39 |
0.04 |
|
|
2017 |
18.12 |
17.38 |
0.41 |
0.33 |
|
|
|
2018 |
10.91 |
11.41 |
0.18 |
0.08 |
|
|
2019 |
10.58 |
10.54 |
0.50 |
0.82 |
|
Corn silage after Alf+grass Yr 2 |
2016 |
14.90 |
16.00 |
1.21 |
0.58 |
|
2017 |
14.30 |
14.20 |
0.53 |
0.92 |
|
|
|
2018 |
13.28 |
14.18 |
0.66 |
0.23 |
|
|
2019 |
15.07 |
15.01 |
0.24 |
0.89 |
|
Corn silage after ann. Rye (Int.) |
2014 |
15.50 |
15.96 |
0.80 |
0.25 |
|
|
2015 |
14.90 |
16.30 |
0.40 |
0.11 |
|
2016 |
13.50 |
12.10 |
0.33 |
0.06 |
|
|
2017 |
12.40 |
11.40 |
0.63 |
0.37 |
|
|
|
2018 |
12.16 |
12.21 |
0.25 |
0.92 |
|
|
2019 |
13.67 |
11.98 |
0.40 |
0.05 |
|
Corn grain |
2013 |
9.97 |
10.57 |
0.20 |
0.13 |
|
|
2014 |
10.02 |
10.34 |
0.46 |
0.80 |
|
|
2015 |
9.33 |
8.85 |
0.40 |
0.82 |
|
Corn grain after RC/CC |
2016 |
9.79 |
9.80 |
0.33 |
0.99 |
|
Corn grain after rye |
2017 |
9.28 |
8.48 |
0.37 |
0.35 |
|
2018 |
6.74 |
7.52 |
0.25 |
0.10 |
|
|
|
2019 |
9.27 |
7.24 |
0.52 |
0.08 |
|
Corn grain after CC |
2017 |
8.97 |
9.00 |
0.37 |
0.99 |
|
Rye silage |
2014 |
6.29 |
6.89 |
0.24 |
0.02 |
|
|
2015 |
6.85 |
6.74 |
0.48 |
0.16 |
|
|
2016 |
8.47 |
7.80 |
0.11 |
0.19 |
|
Rye silage after corn silage |
2017 |
8.16 |
7.64 |
0.28 |
0.01 |
|
2018 |
2.46 |
2.17 |
0.42 |
0.43 |
|
|
|
2019 |
3.93 |
3.82 |
0.17 |
0.68 |
|
Rye silage after sorghum sudangrass |
2017 |
4.04 |
4.64 |
0.42 |
0.28 |
|
2018 |
2.30 |
2.30 |
0.17 |
0.99 |
|
|
|
2019 |
2.83 |
3.02 |
0.21 |
0.59 |
|
Sorghum sudangrass |
2014 |
4.54 |
5.53 |
0.35 |
0.05 |
|
|
2015 |
5.01 |
4.88 |
0.43 |
0.83 |
|
Sorghum sudangrass before rye |
2016 |
9.20 |
8.26 |
0.26 |
0.08 |
|
2017 |
9.99 |
9.58 |
0.66 |
0.33 |
|
|
2018 |
4.56 |
4.60 |
0.18 |
0.89 |
|
|
|
2019 |
5.74 |
6.31 |
0.20 |
0.17 |
|
Sorghum sudangrass before crimson clover |
2016 |
4.24 |
4.62 |
0.24 |
0.40 |
|
|
2017 |
8.34 |
8.35 |
0.45 |
0.98 |
|
|
2018 |
4.70 |
4.72 |
0.23 |
0.94 |
Table 3. Summary of forage and grain yield comparisons between injected (IM) and broadcast (BM) manure management practices in the Manure rotation during 2013-2019 growing seasons. All yields are presented in dry matter basis. Main managements are considered significant when P < 0.05.
Comparison of Corn grain and Soybean Yield tillage and nutrient treatments comparison in the Control Corn Soybean rotation Corn grain yield only differed significantly (p=0.01) among the treatments in 2016, when the chisel-disk with broadcast manure yielded 20% less than the BM-NT and fertilizer treatment and the injected manure treatment did not differ any of the treatments, although in 2018 the yields trended similarly (p=0.06, Table 4). While soybean yields did not differ among the treatments in any year.
|
|
Corn Grain |
|
||||||||||||||||||||||
|
|
BMCh |
BMNT |
Fert |
IM |
Std Err |
P Pvalue |
|
|||||||||||||||||
|
Year |
(Mg ha-1) |
|||||||||||||||||||||||
|
2016 |
7.89 b |
9.39 a |
9.53 a |
8.8 ab |
0.59 |
0.01 |
|
|||||||||||||||||
|
2017 |
6.5 |
6.71 |
7.41 |
5.78 |
0.67 |
0.24 |
|
|||||||||||||||||
|
2018 |
5.29 |
7.52 |
7.82 |
6.74 |
0.57 |
0.06 |
|
|||||||||||||||||
|
2019 |
7.01 |
7.47 |
7.53 |
7.59 |
0.45 |
0.79 |
|
|||||||||||||||||
|
|
SOYBEAN |
|
||||||||||||||||||||||
|
|
BMCh |
BMNT |
Fert |
IM |
Std Err |
P value |
||||||||||||||||||
|
Year |
(Mg ha-1) |
|
|
|||||||||||||||||||||
|
2016 |
4.93 |
4.63 |
4.44 |
4.93 |
0.28 |
0.26 |
|
|||||||||||||||||
|
2017 |
3.74 |
3.95 |
3.59 |
3.35 |
0.23 |
0.33 |
|
|||||||||||||||||
|
2018 |
3.19 |
3.04 |
3.07 |
3.03 |
0.1 |
0.63 |
|
|||||||||||||||||
|
2019 |
3.72 |
3.9 |
3.86 |
3.67 |
0.16 |
0.44 |
|
|||||||||||||||||
Table 4. Corn grain and soybean yield of the four treatments in the Corn-Soybean Rotation from 2016 to 2019. The BMCh was Chisel-disked every year (prior to corn and soybean) and three no-till treatments that prior to corn planting received: surface broadcast manure, inorganic fertilizer, or injected manure in the years that corn was planted. a, b indicate treatments that were significantly different at P < 0.05.
Comparison of Corn grain and Soybean Yield across rotations
We also compared corn grain yields between the diverse (Manure) and low-diversity Corn-Soy (C-S) rotations. Yields were averaged across main management strategies nested within each rotation for all corn entries. Corn grain yield in 2019 did not differ significantly between the Manure and the C-S rotations (Table 5).
|
Corn grain |
||||||||
|
Year |
MANURE (M) |
CORN-SOY (C-S) |
(C-S) |
M vs. C-S |
||||
|
|
IM |
BM |
SE |
IM |
BM |
SE |
p-value |
|
|
(Mg ha-1) |
(Mg ha-1) |
|||||||
|
2013 |
9.97 |
10.56 |
0.50 |
7.72 |
8.29 |
0.50 |
0.39 |
0.03 |
|
2014 |
10.02 |
10.34 |
0.46 |
8.19 |
8.18 |
0.46 |
0.80 |
0.01 |
|
2015 |
9.42 |
8.70 |
0.60 |
8.02 |
9.29 |
0.60 |
0.19 |
0.30 |
|
2016 |
9.80 |
9.79 |
0.41 |
8.79 |
9.37 |
0.41 |
0.27 |
0.25 |
|
2017 |
9.12 |
8.75 |
0.60 |
5.77 |
6.70 |
0.57 |
0.24 |
0.01 |
|
2018 |
7.20 |
7.18 |
0.30 |
7.28 |
6.40 |
0.44 |
0.27 |
0.43 |
|
2019 |
9.27 |
7.24 |
0.51 |
7.59 |
7.47 |
0.53 |
0.77 |
0.25 |
Table 5. Summary of corn grain yield comparison across rotations from 2013 to 2019. Rotation treatments were considered significant when P < 0.05.
Soybean yields were also compared between the diverse PEST rotation for 2013 through 2018 and the SH treatment of the Weed rotation in 2019 to the Corn-Soy (C-S) rotation. Yields were averaged across main management strategies nested within each rotation for all soybean entries. Soybean yield was only smaller in 2018 in the PEST rotations than the Corn-Soy rotation and did not differ significantly in all other years (Table 6).
|
Soybean |
||||||||
|
|
PEST (P) |
CORN-SOY (C-S) |
(C-S) |
P vs. C-S |
||||
|
|
RH |
SH/BAU |
SE |
IM |
BM |
SE |
p-value |
|
|
Year |
(Mg ha-1) |
(Mg ha-1) |
||||||
|
2013 |
3.08 |
3.31 |
0.25 |
3.25 |
3.04 |
0.25 |
0.16 |
0.75 |
|
2014 |
3.35 |
3.41 |
0.11 |
3.32 |
3.54 |
0.11 |
0.31 |
0.61 |
|
2015 |
3.46 |
4.01 |
0.25 |
3.86 |
3.45 |
0.25 |
0.28 |
0.81 |
|
2016 |
3.74 |
4.6 |
0.30 |
5.00 |
4.33 |
0.30 |
0.31 |
0.26 |
|
2017 |
4.23 |
4.52 |
0.06 |
3.85 |
4.54 |
0.25 |
0.30 |
0.42 |
|
2018 |
2.81 (HR) |
2.86 (PH) |
0.06 |
3.05 |
3.11 |
0.08 |
0.50 |
<0.01 |
|
2019 |
3.82 (IWM) |
3.77 (SH) |
0.13 |
3.67 |
3.90 |
0.13 |
0.29 |
0.91 |
Table 6: Summary of soybean grain yield comparison across rotations from 2013 to 2019. Rotation treatments were considered significant when P < 0.05.
2019 Weed Rotation
Weed sampled biomass did not differ significantly among the Weed rotation IWM and SH treatments and the BAU treatment at 10-15 weeks after planting prior to harvest in the sorghum sudangrass after rye silage and the paired corn silage after rye crop (data not shown).
Planting Green Experiment in the New Weed Rotation
Planting green significantly increased rye biomass at soybean planting (Figure 4). Summer annual weed density was significantly reduced (Figure 5) and summer annual weed heights decreased in planting green compared to the early killed treatment (Figure 6). Both early killed with pre-emergence herbicide application and planting green treatments resulted in less than 10 kg ha-1 of late season weed biomass and were not statistically different. Soybean yield was not significantly different between treatments.
Our first-year results support our hypothesis and demonstrate that delaying cereal rye termination increased rye biomass and surface mulch when rolled at soybean planting. The surface residue can alter weed germination cues and provide a physical barrier that must be penetrated for successful weed establishment. Since planting green produced more rye biomass, factors that limit germination and establishment may be intensified when compared to the early killed treatment, explaining observed differences in summer annual weed density and height. The higher rye biomass in the planting green treatment permitted a reduction in herbicide inputs while providing weed suppression that was not different when compared to the early killed plots.
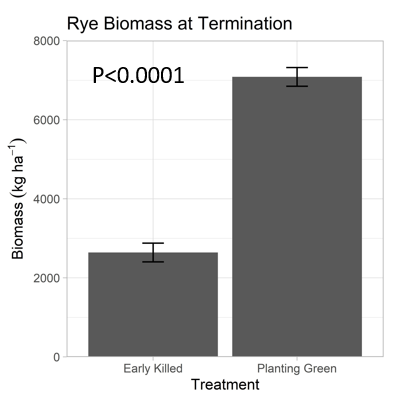
Figure 4. Rye biomass across both treatments at soybean planting.
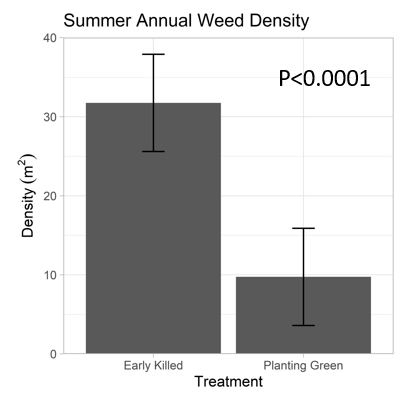
Figure 5. Summer annual weed density within artificial weed seedbanks across both treatments at 6 WAP.
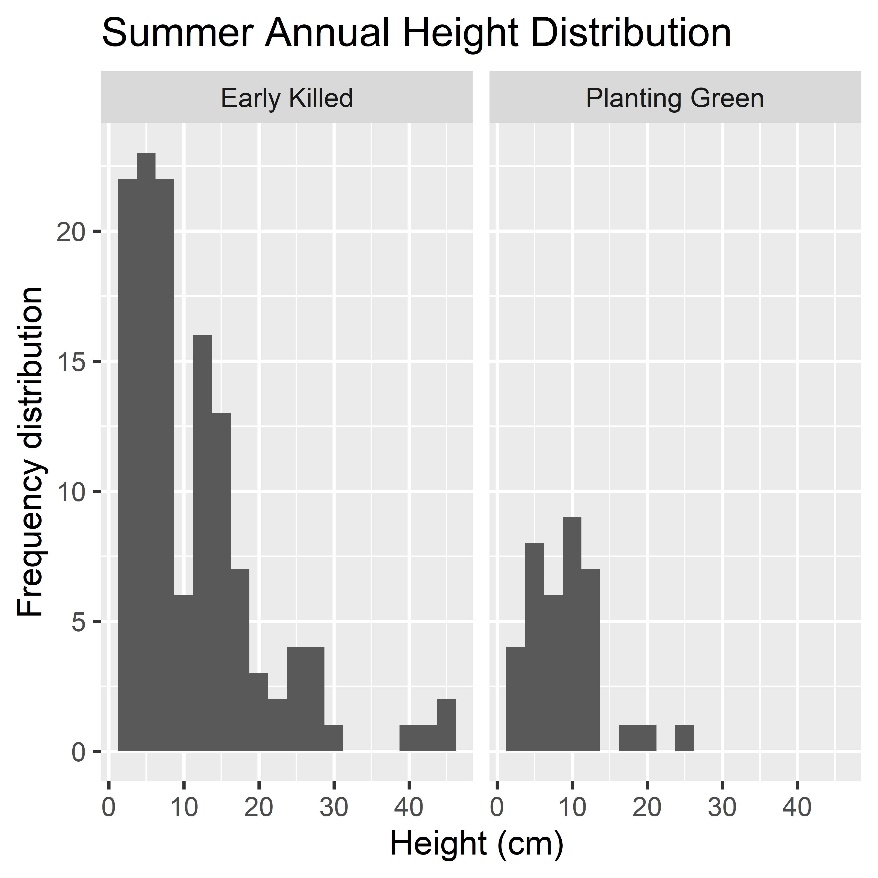
Figure 6. Summer annual weed height distribution within artificial weed seedbanks across both treatments at 6 WAP.
Virtual Dairy Farm Comparisons
The benchmark for a herd milking two times per day is greater than 75 pounds. Based on the quality of feed harvested for both the BMSH and IMRH scenarios, starting with an average milk production per day average of 75 pounds was realistic. In the IMRH scenario peas/triticale was produced that provided 3 months of feed for the dry cows and heifers. This was significant as it resulted in carry over of corn silage into the fall of 2011 and winter of 2012 compared to the BMSH scenario, which did not have that additional feed. This resulted in increased milk production in 2012 due to the advantage of maintaining a heavy corn silage-based ration for the milking herd. Also, the hay-crop forage for the IMRH system had lower quality haylage compared to the BMSH system and more concentrate was fed at 40 to 43% of the total ration dry matter (Table 7).
In 2012 with the BMSH system, there was no carryover of corn silage in the fall. As a result, fresh corn silage was fed and negatively impacted milk production. This is a common occurrence on real dairy operations. The lack of corn silage carryover impacted milk production for much of 2013. Because of weather conditions affecting corn silage tonnage, acreage was adjusted so more corn silage could be produced, and the herd would have ample carryover so fresh silage would not be fed. Due to limited inventory in 2013, corn silage impacted the ration and only minimal improvements were observed in 2014 for the BMSH scenario.
The adjustments in acreage for more corn silage improved the BMSH scenario. Beginning in 2015, forage quality versus forage quantity was a greater factor affecting animal performance. The 2014 corn silage was very low in starch content and was not as high quality as in previous years. The alfalfa/grass mixture in the IMRH scenario was high in fiber. The BMSH had excellent quality alfalfa silage, which helped improve milk production in 2015. Since the IMRH lactating cows had always been on a heavy corn silage and alfalfa grass mixture diet, their production has remained steady over the project years. After the corn silage quantity was addressed, this provided a ration of continued heavy corn silage feeding for the BMSH system and coupled with excellent quality alfalfa silage provided a production boost in 2015, 2016 and 2017. However, in 2017, the BMSH was transitioned to alfalfa-grass mixed haylage, which showed similar production to the IMRH towards the end of the year.
For the years that we have completed simulating the dairy rations and milk production, overall the two diversified dairy farms have performed similarly in milk production. We are still in the process of calculating and comparing their long-term economic performance.
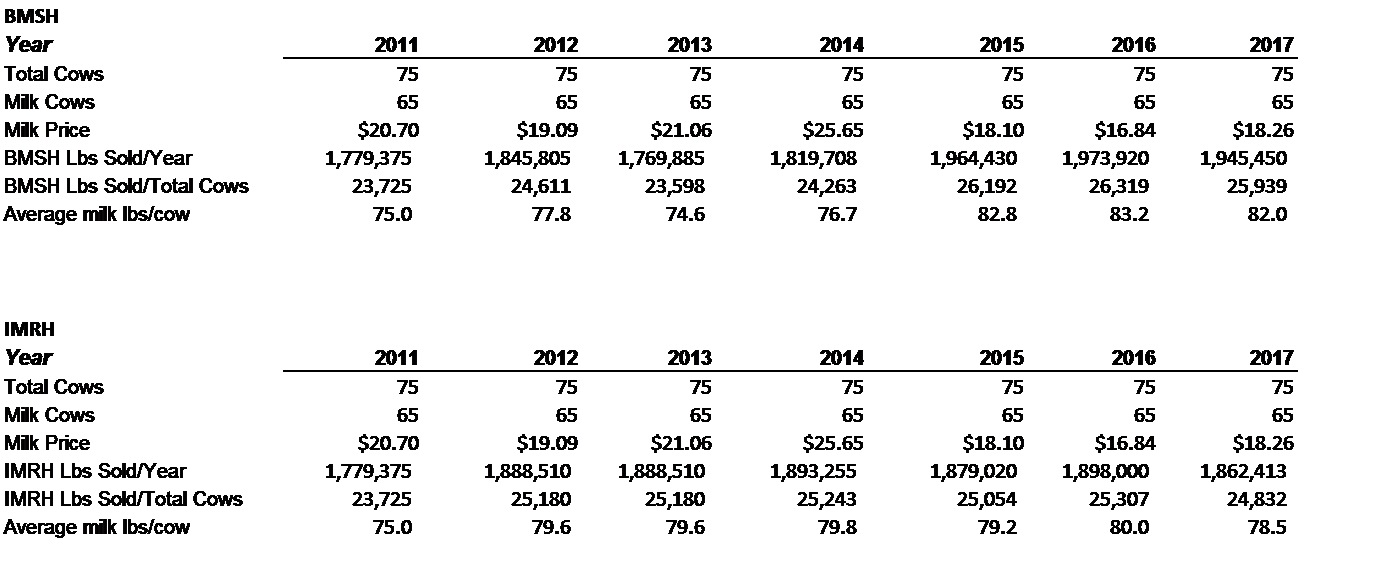
Table 7: Virtual dairy herd cows, milk produced and sold, and milk price from 2011-2017
Long-Term Weeds Analysis in the Pest Rotation
In most years of the row crops (six of eight years in soybeans and seven of nine years in corn), the weed biomass in RH averaged 92 times larger than in SH (Fig. 7a and 7b). However, the weed biomass in the SH plots was consistently low, never exceeding 5 g m-2. In the forage crops, the treatments only differed in three of eight years in the forage establishment year and twice in the first year of forage production (Fig. 7c and 7d). In phase 3, oats replaced the previous companion crops of triticale and peas or triticale alone from phase 1 and 2 respectively, which may have provided better weed control in RH relative to SH. Adding orchardgrass to the SH treatment in phase 3 may also have allowed for greater weed biomass in SH. By contrast, in For. Prod., SH had more weeds twice in eight years.
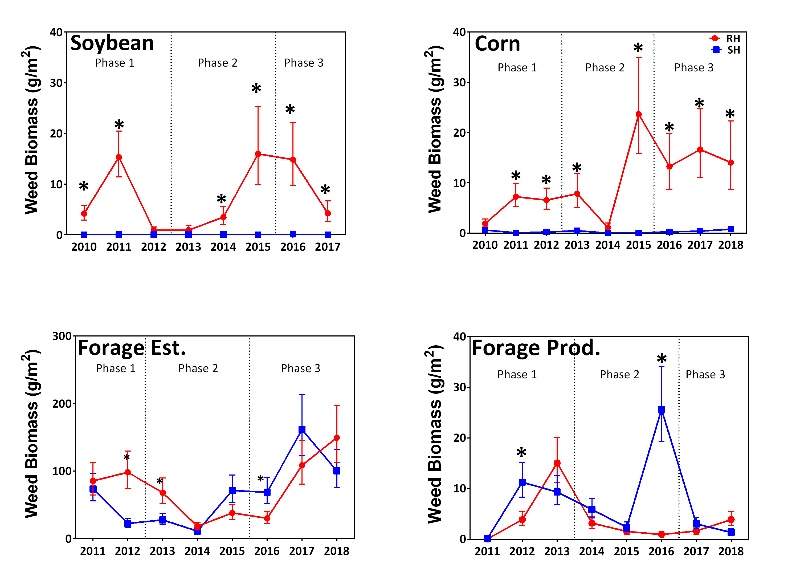
Figure 7: Weed biomass in Standard Herbicide (SH) and Reduced Herbicide (RH) treatments across Soybean (A), Corn (B), Forage Establishment Year (C) and First Year Forage Production (D). The SLICE test to perform a partitioned F-test analysis of the LSMEANS of the 3-way interaction for the simple effects of treatment. Asterisks denote significant differences between treatments in a year at p<0.05. Weed biomass was back-transformed from the log transformation.
Long-term Impacts
When we tested the hypothesis that weed biomass would increase in the RH treatment over the phases, the three-way interaction of phase x crop x treatment was significant (p<0.0001). Weed biomass in the SH treatment in corn and soybean crops was similar across the three phases (Fig. 8). In the RH treatment, weed biomass in soybean was 11% greater in phase 3 than phases 1 and 2, and in corn weed biomass was more than two and three times greater in phases 2 and 3 than phase 1, respectively. This indicates that weed biomass did increase over time in the RH treatment was correct for the annual row crops.
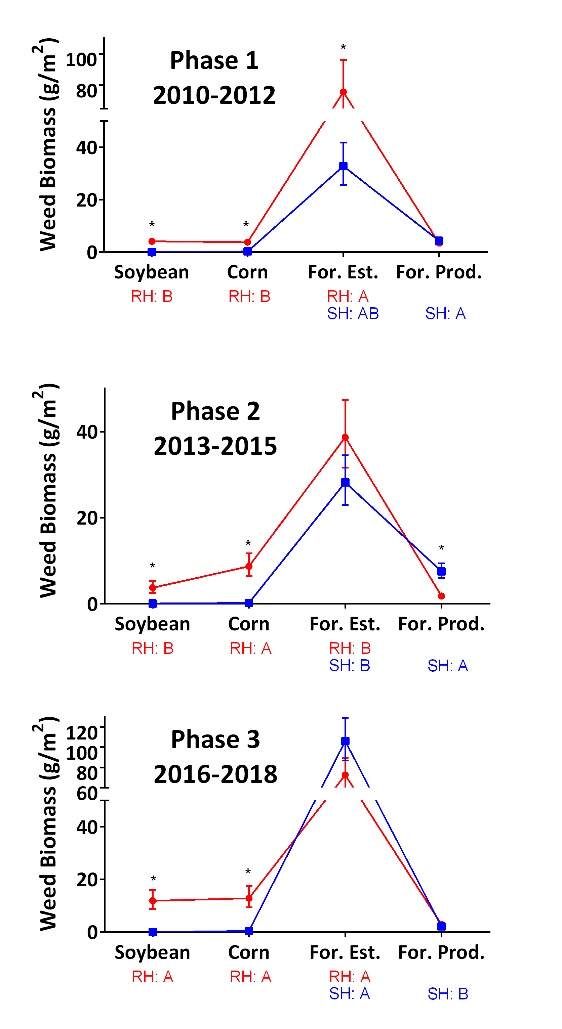
Figure 8: Average weed biomass of soybean, corn, establishment year of forage, and first year of forage production by phase. Reduced Herbicide (RH) is red, and standard herbicide (SH) is blue. Significant differences of simple effects were determined with the SLICE test of PROC MIXED to perform a partitioned F-test analysis of phase x crop x treatment interaction. Weed biomass was back-transformed from the log transformation.* indicates significant differences between the RH and SH treatments at p<0.05. Different letters indicate phases that differ within the same crop and treatment at p<0.05. Soybean and Corn SH treatments, as well as Forage Production RH treatments did not differ among phases.
In For. Est., weed biomass in the SH treatment did not differ between phases 1 and 2, but weed biomass in phase 3 was almost 4 times greater than in phase 2. By contrast, in the RH treatment weed biomass was similar between phases 1 and 3 and was smaller in phase 2 compared to phases 1 and 3 by 52% (Fig. 8). Due to large weed biomass in the RH treatments in 2013 and 2015, both RH and SH received a POST application in the forage establishment year (Table 1) which could explain why weed biomass was smaller in RH these years. The SH treatment in Phase 3 contained orchardgrass, while the SH treatments in phases 1 and 2 did not. The same herbicides were used in all three phases. This suggests that the orchardgrass reduced weed control, possibly due to early growth and herbicide interception or reduced weed competition relative to alfalfa later in the season.
Weed biomass in For. Prod. was 100% smaller in phase 3 of SH compared to phases 1 and 2. The RH treatment of the first year of forage production did not have weed biomass differences across phases, confirming the weed control benefits of rotating to a perennial forage. By rotating from summer annuals to perennials, the weed biomass in both treatments declined to similarly low levels in most years of the first production year (Figures 7 and 8).
Yield and Return to Investment
In five of eight years, SH soybeans yielded 23% greater than RH (Fig. 9). Yield differences in 2011 and 2012 were attributed to population differences due to slugs and cold, wet soil (Snyder et al. 2016). In 2015-2017, the narrow-row soybean yield averaged 13% greater than all other soybean treatments (p=0.005). We do not attribute this yield difference to weeds as weed biomass in the SH-narrow and SH-wide soybean never differed. Others have also reported soybean yield benefits associated with narrow rows. Corn yields only differed between treatments once, in 2011, the RH corn yielded 6% less than SH corn (p=0.03). It is not clear why yields differed between treatments this year, but it is possible that larger weed biomass in RH reduced yields compared to SH.
Forage establishment year yield differed between treatments in four of eight years but was not consistently greater for one treatment. In 2011 and 2012, RH yield averaged 26% greater than SH (p<0.01) most likely due to the large biomass of annual peas and triticale that averaged 97% of the total biomass in the first harvest of 2011-2012, when RH alfalfa averaged only 8 g m-2 in the first harvest, while SH alfalfa averaged 101 g m-2. However, this is not the case for all companion crops, as we observed a yield decrease when triticale was added in 2013 and 2014 and no yield impact in 2015-2018, suggesting that the annual(s) chosen for the companion crop has a large effect on the possibility of a yield increase. From 2013-2014, RH yielded 32% less on average than SH (p<0.001), when in the first harvest, triticale averaged 64% of total biomass (data not shown), and RH yield averaged 28% and 21% lower than SH in the first and second harvests respectively, suggesting the perennials needed time to recover after early competition from the annual triticale. However, by the third cut, RH and SH yields did not differ. Because weed biomass was similar between the treatments in those years, this suggests that weeds did not reduce yield, and instead, we can attribute yield loss to triticale.
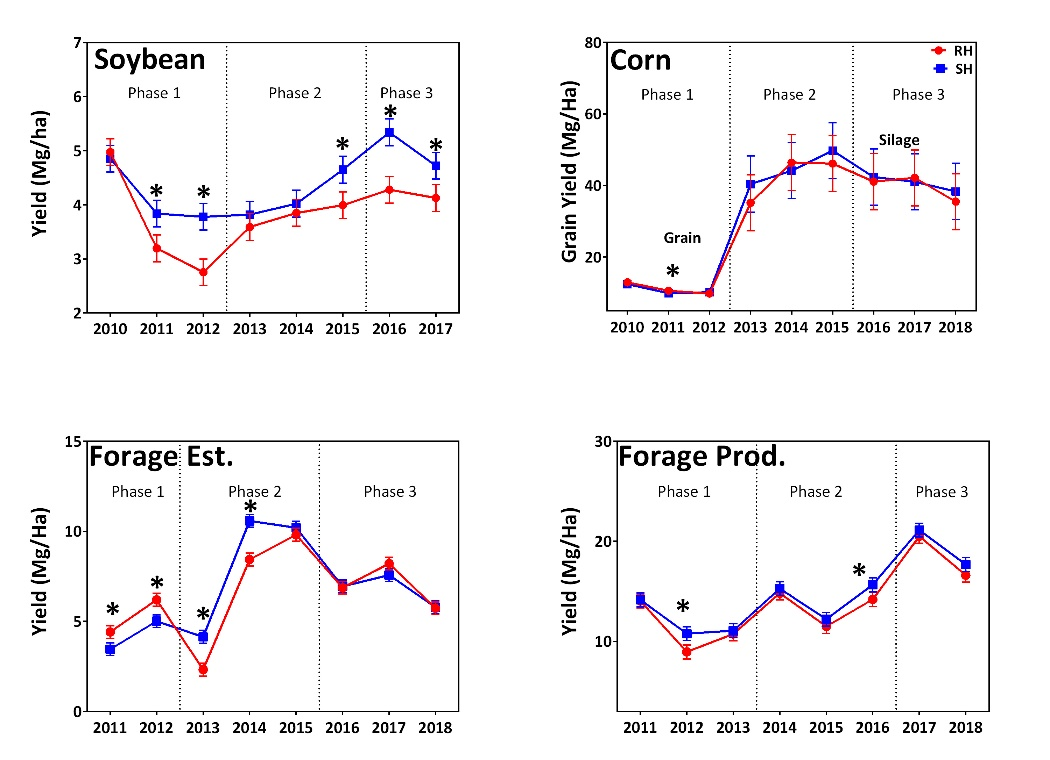
Figure 9: Yield in Standard Herbicide (SH) and Reduced Herbicide (RH) treatments across Soybean (A), Corn (B), Forage Establishment Year (C) and First Year Forage Production (D). Asterisks denote significant differences between treatments in a year at p<0.05.
In the forage first year production, SH annual yield was larger than RH in two of eight years. In 2012, RH yield was 83% of SH yield (p=0.004), possibly due to early harvest of the RH forage to control potato leafhopper while the SH forage received two insecticide applications. It is possible 2016 annual yields were reduced in RH due to weed pressure, as that was the only year with a difference in weed biomass. However, we do not have an explanation for why weed biomass differed in 2016.
In Phase 1, returns to investment for RH-Cult were 32% greater than SH in corn (p=0.029, Table 8), due to the reduced herbicide cost. There were no differences in return to investments between RH and SH in each phase for both the soybean crop and the first year of forage production. Interestingly, return to investments for SH-Narrow were not different in Phase 3, when the yield was larger while all other management practices were equal to SH-Wide. In Phase 3 of the forage establishment year, returns to investment of RH were 32% more than SH (p=0.007).
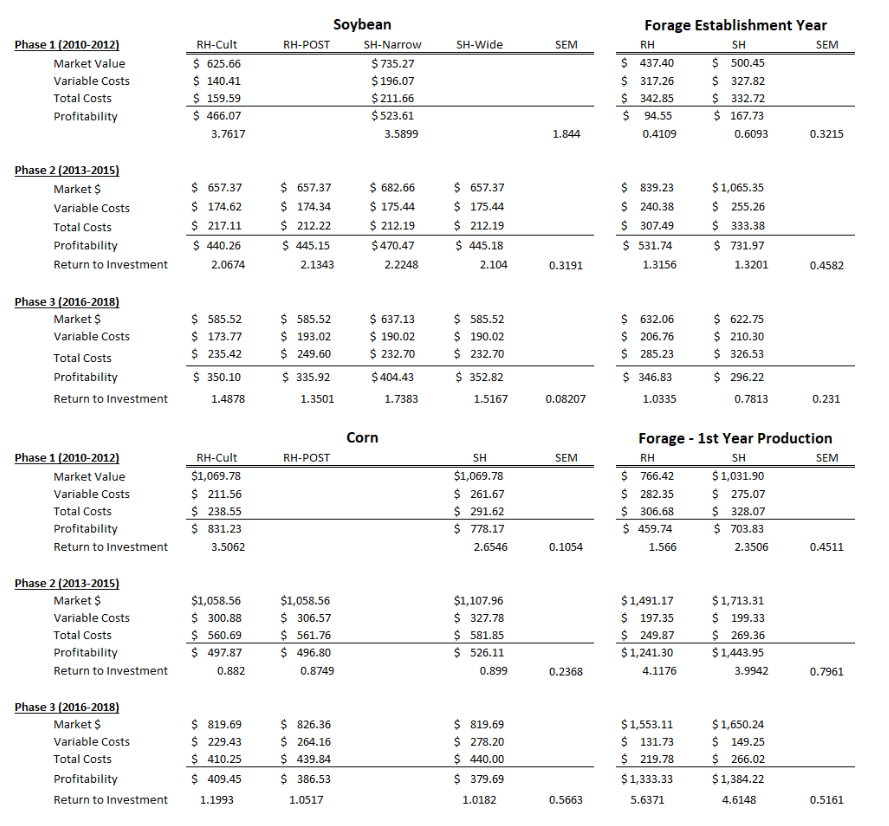
Table 8: Market Value, Variable Costs, Total Costs, Profitability, and Return to Investment for Soybean, Corn, Forage Establishment Year, and First Year of Forage Production for Standard Herbicide (SH) and Reduced Herbicide (RH) with Cultivation (Cult) or broadcast postemergence herbicide (POST) per hectare. Letters denote significant differences between treatments by crop and phase when p<0.05 for the interaction.
Herbicide Resistant Weed Management: Integrated Weed Management Experiment and Marestail Experiment
Herbicide Resistant Weed Control with Integrated Weed Management Experiment
Pigweed biomass between the alfalfa and soybean treatments without cover or nurse crops was similar, however, alfalfa had 35 times more other weed biomass than soybean (Table 9). This is likely because we did not apply herbicides on the oats cover crop or after planting, allowing for weeds to germinate prior to planting alfalfa or during the growing season, while the soybean crop was treated with both burndown and POST applications. Many farmers would have applied a burndown herbicide prior to planting alfalfa, so it is possible that this combination of a burndown herbicide prior to rotating to alfalfa would have reduced other weeds, specifically winter annual weeds. While not in an overwhelming amount, perennial weeds such as dandelion and Canada thistle were present in these fields, and these weeds probably would not have been controlled by spring-applied herbicides or frequent mowing. We also summed alfalfa weed biomass across three harvests, making it difficult to compare to one harvest of soybean. These results indicate that rotating to a perennial forage without any herbicide applications did not significantly reduce pigweed biomass and increased other weed biomass.
Within alfalfa, oats cover crop or nurse crop significantly decreased pigweed biomass by at least 1400% in the first two harvests without reliance on herbicides. In soybean, late cover crop termination: i. increased rye biomass by 280%, ii. decreased pigweed density by 5.5 times compared to no cover and 17.8 times compared to early-termination; and iii. reduced pigweed biomass by 16 times compared to an early-terminated cover crop.
Alfalfa with a cover crop (A-C+N and A-C) had 44% greater yields than alfalfa without a cover crop (A-N and A-None). Most of this yield increase was in the first harvest due to cover crop biomass. Soybean yield did not differ across the three cover crop treatments (p=0.054).
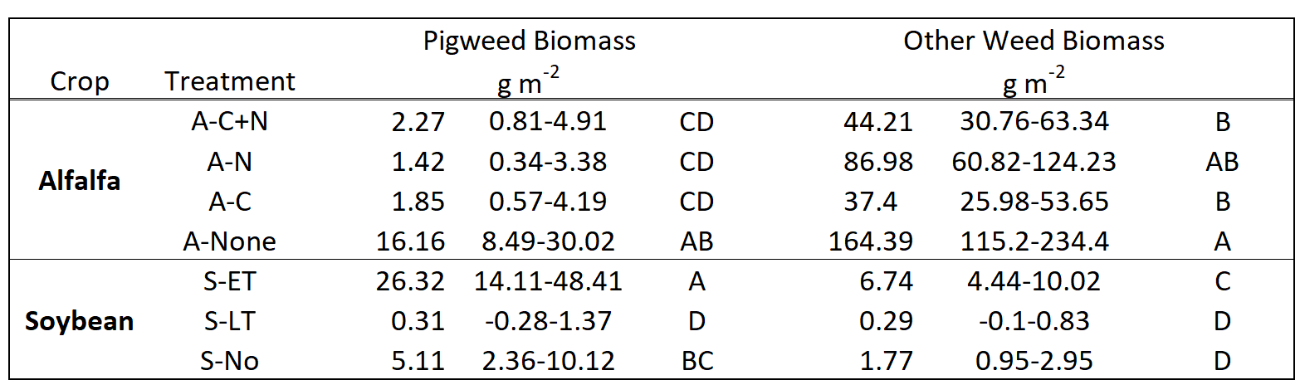
Table 9: Pigweed and other weed biomass in alfalfa totaled over three harvests and 10 WAP in soybean treatments averaged over 2018 and 2019, with confidence intervals. Letters represent Tukey mean comparisons for weeds in both alfalfa and soybean at p<0.05.
In summary, we found that a large-biomass cover crop with soybean provided excellent control of other weeds, or rotating to a perennial forage with an oat cover or nurse crops can be used for pigweed control. These offer options to dairy farmers who will likely have to contend with glyphosate-resistant Palmer amaranth and waterhemp populations in the future.
Marestail Experiment
In 2018, Roundup-only had 200% greater horseweed biomass than mechanical, core-burndown, and core-POST programs. Few plants initially in the rosette stages survived. In 2018, mechanical and core-burndown programs significantly reduced bolting horseweed survival compared to roundup-only, while the core-POST programs did not (Table 10).
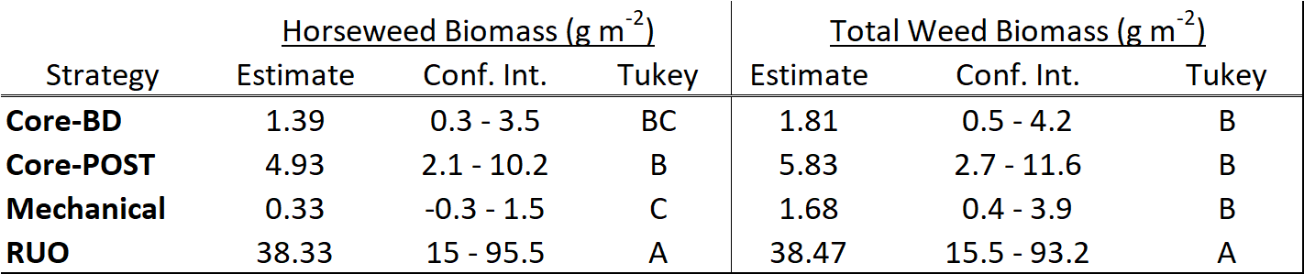
Table 10: 2018 Horseweed and total weed biomass estimates and confidence intervals (Conf. Int.) by Strategy. Letters denote Tukey groupings with an alpha of 0.05. Data were back-transformed from log-transformation.
Deer damage in 2019 resulted in significant soybean damage and so we included soybean biomass as a covariate (which was significant p=0.0428) in the analysis of horseweed biomass. Due to the spatial inconsistencies of the deer damage and insufficient data across the soybean biomass range,we pooled weed biomass data across the control programs within each strategy and drew conclusions about only the strategy results.
Likely due to the significant deer defoliation of soybeans and lack of soybean-weed competition, late weed emergence was significant, and the Core-POST management and Mechanical programs (particularly the forage program) provided better weed control than the Roundup-only and the Core-burndown strategies. The core-POST had less horseweed biomass than core-burndown, mechanical, and RUO (Table 11, p<0.001).
Table 11: 2019 horseweed and total weed biomass estimate and confidence interval (Conf. Int.) by strategy. Letters denote Tukey groupings with an p < 0.05. Data were back-transformed from log-transformation.
Marked Horseweed Plant Size Survival
Results from marked horseweed plants show that core-burndown was more effective than core-POST in 2018, and the opposite was true in 2019. In 2018, core-burndown controlled more plants than RUO, but had similar control to RUO in 2019. The inconsistency between years for these two hypotheses were possibly due to either population susceptibility differences or reduced soybean competition, but it is difficult to determine without additional data. A RUO only program is not effective on plants that are taller than 10-cm. There was a general trend of increased survival with XL horseweed plants, except in the mechanical strategy. In both years, the mechanical program was successful at controlling all marked plants, performing better than core-burndown.
In summary in this experiment we found that glyphosate alone is no longer effective and diverse management practices are important. We identified a number of different options for weed control that dairy farmers could use, and almost all have similar profitability except for the annual forage treatment. The chisel disc program performed consistently well at controlling both horseweed and total weed biomass, suggesting no-till farmers should consider adding a shallow tillage operation.
Integrated Pest Management and Pesticide Management
European Corn Borer (ECB) Damage
In 2019, we found no entries with ECB damage above the economically damaging threshold. These results are consistent with previous years, although we have been planting corn without Bt traits since 2010. The low ECB damage is likely because most corn in our region has Bt traits which has contributed to reducing the regional ECB population.
Summary of Pest Analysis from Phases 1 and 2 (2010-2015)
Here we report a summary of our analysis of the first six years (Phases 1 and 2) of the project. More information can be found in Busch et al. 2020 listed in the publications, as well as our previous reports for LNE09-291 and LNE13-329. In the first two phases of the experiment, corn plants damaged due to slugs at V2 stage varied among years but did not differ significantly between the LoDiv-PP and HiDiv-IPM cropping systems on average over the three years of each phase. By contrast, caterpillar damage from black cutworm and true armyworm to corn plants at V2 was greater in four of six years and plant establishment was significantly reduced on average in the HiDiv-IPM cropping systems compared to the LoDiv-PP cropping system in the first two phases (Fig. 10).
In early stages of corn growth, slug activity density also varied among years and was greater in 2013 in the HiDiv-IPM cropping system than in LoDiv-PP. But in other years and on average over the two phases slug activity density did not differ significantly between the LoDiv-PP and HiDiv-IPM systems. The HiDiv-IPM had more the twice as many slug predators per trap as the LoDiv-PP cropping system (Fig 11), and we measured greater predation of sentinel prey in the HiDiv-IPM than the LoDiv-PP cropping system in phase 2. Larger predator populations and predation in the HiDiv-IPM may explain the similar slug activity density and slug damage over between the cropping systems. Further, when both rotations were harvested for grain in phase 2 and could be compared, corn grain yield was greater in the HiDiv-IPM cropping systems than in the LoDiv-PP cropping system (Fig. 10, from Busch et al. 2020). Factors other than early season pest damage and corn populations likely contributed to this yield advantage as corn in the HiDiv-IPM system was preceded by two years of alfalfa and orchardgrass which likely contributed to improved nutrient availability and soil quality compared to the corn following soybean in the LoDiv-PP. In summary, these results from the first six years support our hypothesis that managing diverse cropping systems with IPM can provide similar slug control and produce similar corn yields as multiple pre-emptive pest control tactics employed in low diversity cropping systems.
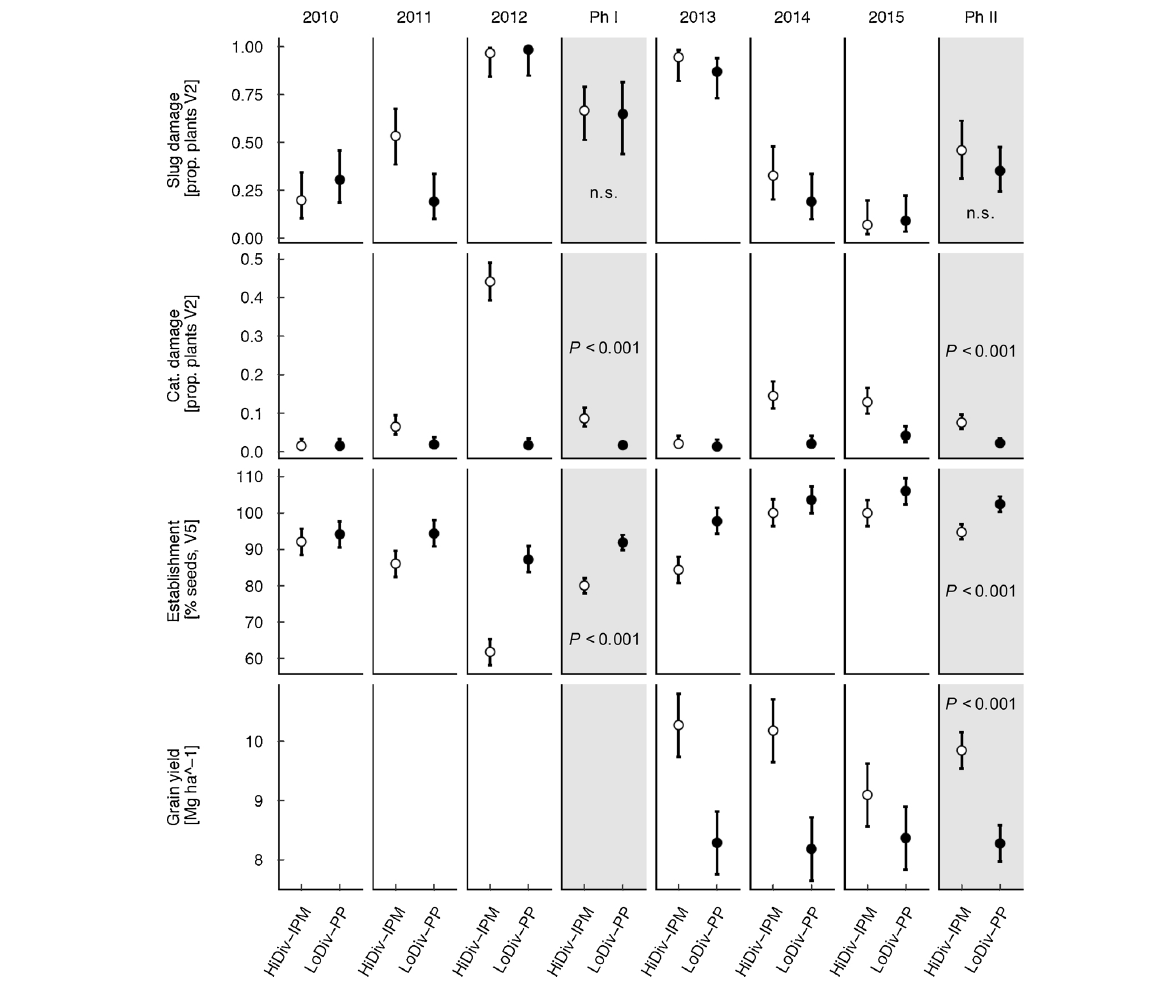
Figure 10: Means and 95 % confidence intervals for corn plant damage at V2 from slugs and caterpillars, corn plant establishment and corn grain yield under the low diversity, pre-emptive pesticide (LoDiv-PP; black circles) cropping system to the high diversity,IPM (HiDiv-IPM; white circles) cropping system, with results from planned contrasts of cropping systems within the first three years (Ph I) and second three years (Ph II).
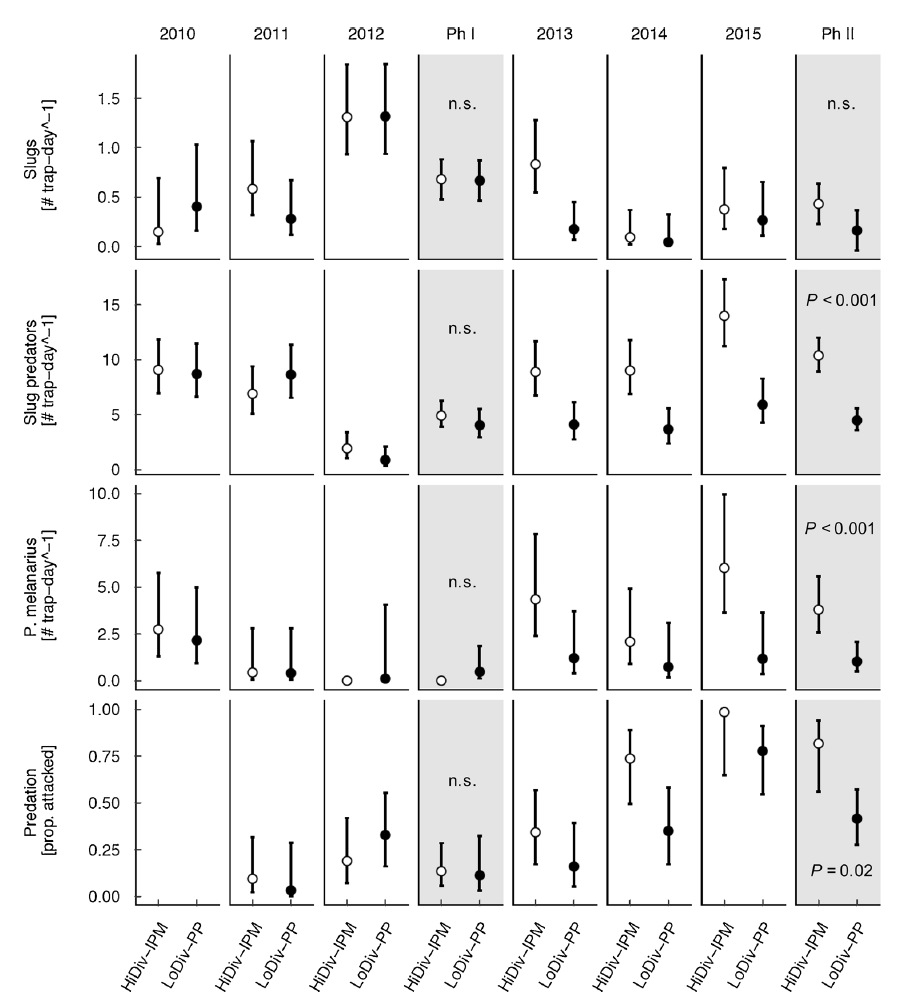
Figure 11: Means and 95 % confidence intervals of early season slugs, slug their predators and predation over the first six years comparing a low diversity, pre-emptive pesticide (LoDiv-PP; black circles) cropping system to the high-diversity, IPM (HiDiv-IPM; white circles) cropping system, with results of planned contrasts of cropping systems within the first three years (Ph I) and second three years (Ph II).
2016-2019. Early Season Corn Pest Damage and Plant Establishment
LoDiv (Corn-Soy) Cropping System under Conservation Tillage or No-Till Treatments
Within the LoDiv-PP cropping system (Corn-Soy), on average over four years (2016-2019), the broadcast manure chisel treatment (BMCh) had less pest damage than the broadcast manure no-till treatment (BMNT) in the V2 stage; and in the V5 stage, the BMCh also suffered less damage than all three of the no-till treatments (Table 12). Most of this pest damage was due to slugs, and the “decomposing manure food web” associated with broadcast manure might increase predator abundance and reduce spring corn damage. However, there is growing evidence that surface manure residue can promote slug abundance which may enhance corn damage despite higher predator abundance. Further, slug abundance is often reduced by soil disruption such as chisel plowing, and slug herbivory is typically problematic in no-till systems. Despite significantly lower pest damage in the chisel-disk treatments, corn plant establishment at the V2 and V5 stages did not differ among the conservation till and any of the no-till Corn-Soy treatments (Table 12), perhaps in part because the corn damage ratings were relatively small (less than 1.2 on a scale of 0 to 4).These results suggest that although conservation tillage may reduce pest and particularly slug damage relative to no-till within simple rotations with pre-emptive pest control practices, it does not necessarily improve plant establishment. Further, as we reported earlier reduced slug damage did not result in greater corn grain yields, as the one time that corn grain yield differed among the Corn-Soybean tillage treatments was in 2016 when it was 20% smaller in the chisel-disc treatment (Table 4).
HiDiv-IPM Manure Rotation
Within the diverse HiDiv-IPM cropping system, corn damage and plant establishment did not differ between the broadcast and injected manure treatments across the three corn entries that were preceded by different crops (Table 13). At the V2 stage damage across the corn entries averaged over the four years did not differ. However, at the V5 stage in 2017 and 2018, however corn after the split-plots of rye silage or crimson clover cover crop (Rye Sil/CrimClv) suffered less pest damage than corn after perennial alfalfa and orchardgrass (AOG) or interseeded annual ryegrass and red clover cover crops (Int) that were interseeded into corn for grain the previous year. By contrast, plant establishment at V5 was significantly lower in the corn after Rye Sil/CrimClv than the corn after the interseeded cover crops, and didn’t differ from corn after alfalfa and orchardgrass. In 2017, fall armyworm infestation reached economic threshold in the corn after alfalfa and orchardgrass. Although we applied Intrepid (an insect growth regulator that targets lepidopterous insects without harming natural enemies), the plant establishment decline from V2 to V5 in the AOG corn (Table 13) was likely due to this armyworm infestation.
When we compared early season pest damage and establishment averaged across all of the corn entries treatments and entries in the LoDiv-PP and HiDiv-IPM averaged across manure managements at the V2 stage from 2016-2019, the LoDiv-PP BMNT experienced more damage than all of the treatments except the BMCh in the corn after the intereseeded cover crops. And the LoDiv-PP BMNT had less damage than the average of BM and IM of corn planted alfalfa and orchardgrass (AOg) and the Interseeded cover crops in the HiDiv-IPM manure rotation in addition to the BMCh. Yet again the proportion of corn plants that established at the V2 and V5 stages did not differ across the cropping systems (Tables 12 and 13) and corn yield did not differ between the HiDiv-IPM and LoDiv-PP systems except in 2017 at the V5 stage when it was greater in the HiDiv-IPM system (Table 5). These results from the last four years of this 10 year study again indicate that diverse cropping systems managed with IPM can provide similar early season pest control, similar plant populations and corn yields as low diversity cropping systems that employ multiple pre-emptive pest control tactics. In the long run, these preventative pest control tactics (i.e., Bt traits, insecticide-coated seeds, and an insecticide broadcast across fields after planting) all have costs that are likely to be avoided with IPM. An IPM framework allows growers to spend money on input costs only when it makes economic sense to control a pest population. Averaged across years, therefore, an IPM program should incur lower input costs for pest control. Moreover, in IPM systems, natural enemies have real value because they contribute meaningfully to biological control. IPM-based systems like the two more diverse rotations with continuous plant cover and pest control tactics that conserve and protect pest predators, like we have been studying, tend to increase diversity and abundance of pest predators over time, decreasing pest populations.
Table 12: Slug and insect pest corn plant damage and proportion of corn plants established in treatments in the Control (Corn-Soy) rotation at the V2 from 2016-2019 and V5 stage in 2017-2019. a,b letters indicate treatments that were significantly different at P < 0.05.
|
Stage |
BM Ch |
BM NT |
Fert |
IM |
StdErr |
p-value |
|
||||||||||
|
|
Damage rating (scale 0-5) |
|
|
|
|||||||||||||
|
V2 |
0.6 b |
1.3 a |
0.86 ab |
0.88 ab |
0.27 |
0.0002 |
|||||||||||
|
V5 |
0.65 b |
1.09 a |
1.04 a |
1.06 a |
0.09 |
0.006 |
|||||||||||
|
|
Proportion of plants established |
|
|
||||||||||||||
|
V2 |
0.82 |
0.81 |
0.85 |
1.14 |
0.15 |
0.30 |
|
||||||||||
|
V5 |
0.87 |
0.8 |
0.86 |
0.86 |
0.03 |
0.19 |
|
||||||||||
Table 13: Slug and insect pest corn damage and proportion of corn plants established after three different prior crops in the Manure rotation at the V2 from 2016-2019 and V5 stage in 2017-2019. a,b letters indicate treatments that were significantly different at P < 0.05.
|
Stage |
Alf+Orch |
Inter Cover |
RyeSil/ CrimClvr |
StdErr |
p-value |
|||||
|
|
Damage rating (scale 0-5) |
|
|
|||||||
|
V2 |
0.97 |
1.07 |
0.97 |
0.12 |
0.28 |
|
||||
|
V5 |
1.2 a |
1.2 a |
0.94 b |
0.06 |
0.009 |
|
||||
|
|
Proportion of plants established |
|
|
|||||||
|
V2 |
0.84 a |
0.78 b |
0.76 a |
0.07 |
0.007 |
|
||||
|
V5 |
0.79 ab |
0.83 a |
0.72 b |
0.02 |
0.002 |
|
||||
Incorporating Cover Crop- and Soil Organic Matter-Nitrogen Availability into a Fertilizer Recommendation Tool
Prior to subtracting N credits, the Agro Guide produced the highest N fertilizer recommendations at 153 kg ha-1 N (Fig. 12). Barring one 0 kg ha-1 N recommendation in 2018, the PSNT 160 ranged between 95 and 114 kg ha-1 N across years. The CC Tool produced the lowest recommendations, ranging between 43 and 59 kg ha-1 N. These trends largely held true following the subtraction of plant-available N, barring the Agro. Guide which fell within the range of PSNT 160 recommendations (Table 14).
Yields were not significantly different between the CC Tool and PSNT 160 in 2018, averaging 8.3 and 8.5 Mg ha-1 respectively (Fig. 13). However, the CC Tool was significantly lower than the other three recommendation systems in 2019, by approximately 2.4 Mg ha-1. This significant difference remained when yields were analyzed across years (Data not shown). Future analyses will determine if the 100% fertilizer recovery efficiency assumed by the CC Tool’s recommendation equation can be refined to increase the accuracy of recommendations.
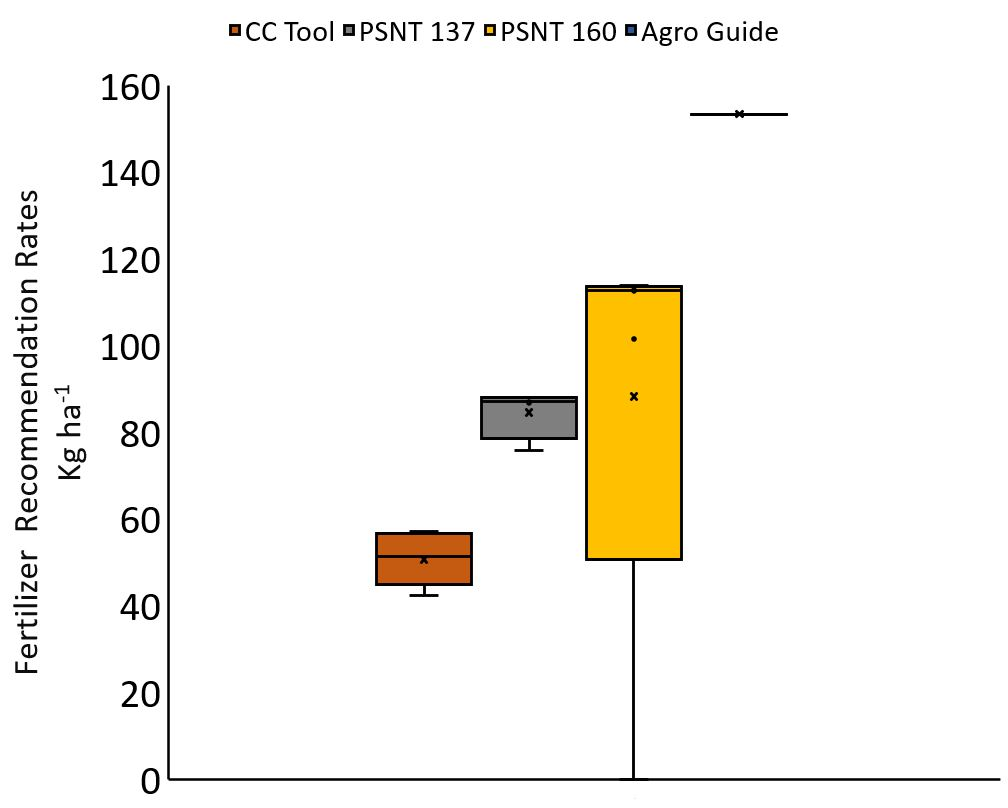
Figure 12. Nitrogen fertilizer recommendation rates. Rates shown are before the subtraction of calculated plant-available manure-N.
|
Treatment |
2018 |
2019 |
|
|
----- Kg ha-1 N ----- |
|
|
Agro Guide |
- |
97.44 |
|
CC Tool |
12.99 |
16.52 |
|
PSNT 137 |
- |
84.64 |
|
PSNT 160 |
100.8 |
110.4 |
Table 14. Average nitrogen fertilizer recommendation rates applied as sidedressed UAN 30. Rates shown are after the subtraction of plant-available N.

Figure 13. Treatment effect on corn grain yield. Red bars represent the yield potential used for each treatment. Data were subjected to analysis of variance (ANOVA) and mean differences were determined with Fisher’s LSD, α = 0.05
Soil Health Indicator Results
Within the corn-soybean control rotation where a chisel-disk treatment was initiated in 2016, in the top 0-5 cm of soil, the chisel-disked treatment had 25% less labile carbon compared to injection manure, no-till treatment (Fig. 14). Although there were no significant differences among the chisel-disked treatment and the broadcast manure or synthetic fertilizer treatments. The chisel-disked treatment also had 22% less soil organic matter (Fig. 15) and 20% less total soil carbon (Fig. 16) when corrected for bulk density than all of the other no-till treatments. In addition, the chisel-disked treatment also had significantly less (26%) wet aggregate stability in the top 15 cm compared to the no-till broadcast manure treatment (Fig. 17), but there no significant differences among the chisel-disked soil and the injected manure or synthetic fertilizer treatments. Soil bulk density was not significantly different between the treatments in the corn-soy control rotation (data not shown, p=0.52).

Figure 14: Soil labile carbon (mg/kg soil) in the 0-5cm soil depth in 2019 corn plots that had broadcast manure and were chisel-disked every year since 2016 or not-tilled with three different fertility treatments: inorganic fertilizer, injected manure or broadcast manure. Different letters indicate treatments that differed significantly at p<0.05
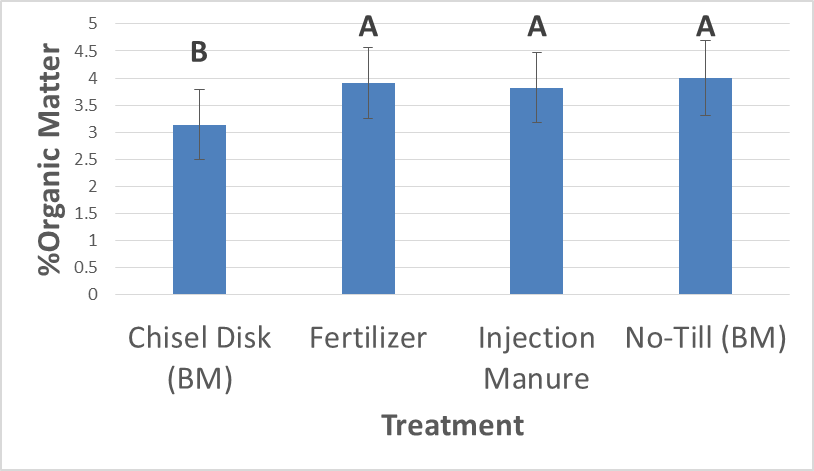
Figure 15: Percentage of organic matter (mg/kg soil) in the 0-5cm soil depth in 2019 corn plots that had broadcast manure and were chisel-disked every year since 2016 or not-tilled with three different fertility treatments: inorganic fertilizer, injected manure or broadcast manure. Different letters indicate treatments that differed significantly at p<0.05.
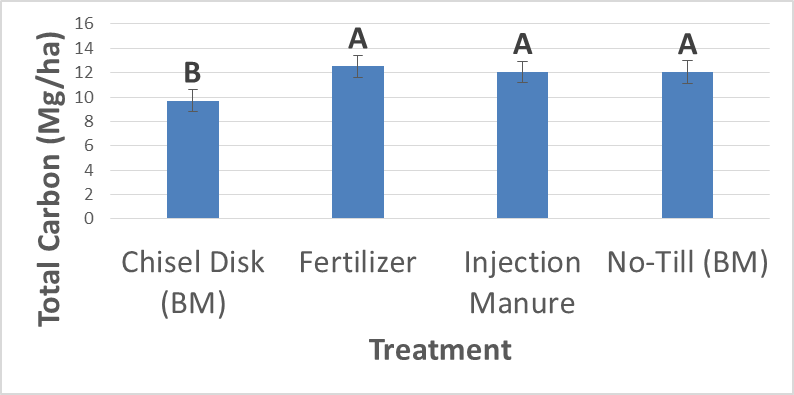
Figure 16: Total carbon (Mg/ha) in the 0-5 cm soil depth in 2019 corn plots that had broadcast manure and were chisel-disked every year since 2016 or not-tilled with three different fertility treatments: inorganic fertilizer, injected manure or broadcast manure. Different letters indicate treatments that differed significantly at p<0.05
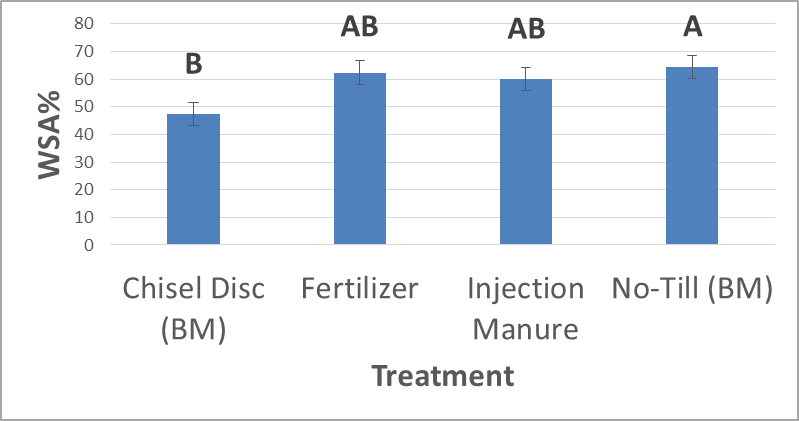
Figure 17: Percentage of water stable aggregates in the 0-15 cm soil depth in 2019 corn plots that had broadcast manure and were chisel-disked every year since 2016 or not-tilled with three different fertility treatments: inorganic fertilizer, injected manure or broadcast manure. Different letters indicate treatments that differed significantly at p<0.05
In the PEST rotation, the treatment that was moldboard plowed once every six years had 32% lower labile carbon than the no-till treatment in the first year after tillage in the top 0-5 cm of soil. However, labile carbon levels in the tilled treatment recovered with time, particularly after two years of perennial alfalfa and orchardgrass (Fig.18). Similarly, in the first year after tillage the full tillage treatment in the top 0-5 cm had 29% less percent organic matter (Fig. 19), 40% less total carbon in the soil (Fig.20), and 26% less aggregate stability (Fig.21) compared to the continuous no-till, but eventually they recovered after two years perennial alfalfa and orchardgrass to levels that were not significantly smaller. Between the first year after tillage and the end of the six-year rotation, we observed a 35% increase in aggregate stability. Soil bulk density did not differ significantly between treatments (data not shown). Though the treatment that was tilled once every six years had less labile carbon, total carbon and aggregate stability the year after tillage, later in the rotation and particularly after two years of perennial legume and grasses, the tilled treatment did not differ significantly from the no-till treatment. Based on these findings, occasional tillage may be a viable option when used in conjunction with perennial crops as soil health appeared to recover within three years.
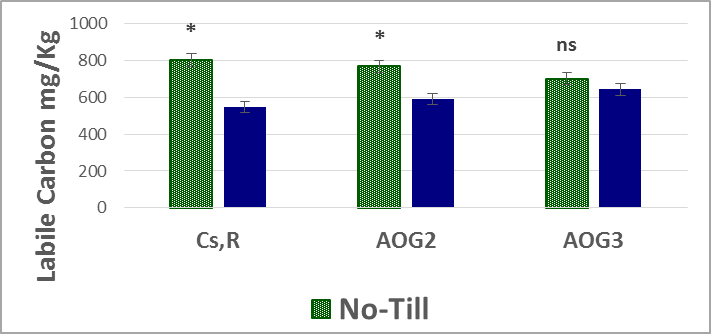
Figure 18: Soil labile carbon (mg/kg soil) in the 0-5 cm soil depth in 2019 corn plots that were full filled or no-tilled in August the year prior to planting corn silage (Cs,R), or four years prior in established alfalfa and orchardgrass (AOG2) or five years prior in established alfalfa and orchardgrass (AOG3). Different letters indicate treatments that differed significantly at p<0.05
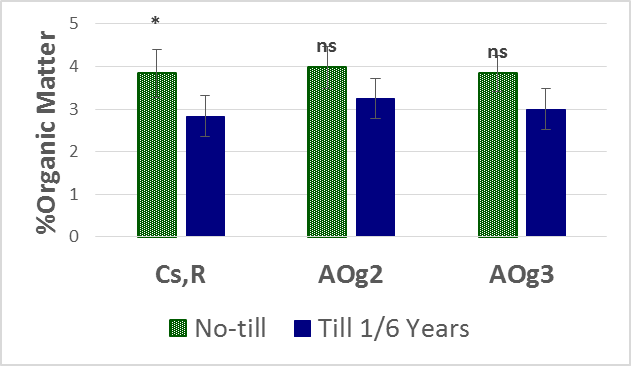
Figure 19: Percentage of carbon (mg/kg soil) in the 0-5 cm soil depth in 2019 corn plots that were moldboard plowed and chisel-disked compared to no-tilled in August the year prior to planting corn silage (Cs,R), or four years prior in established alfalfa and orchardgrass (AOG2) or five years prior in established alfalfa and orchardgrass (AOG3). Different letters indicate treatments that differed significantly at p<0.05
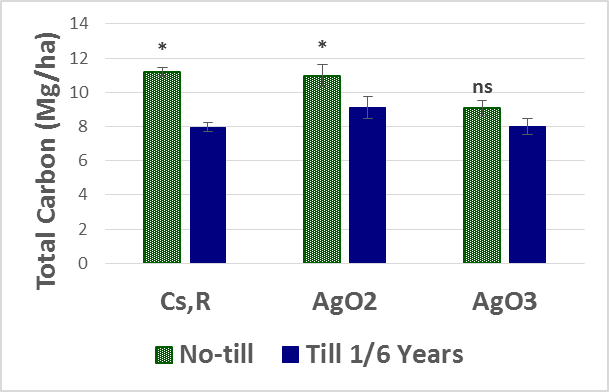
Figure 20: Total carbon (Mg/ha) in the 0-5 cm soil depth in 2019 corn plots that were moldboard plowed and chisel-disked compared to no-tilled in August the year prior to planting corn silage (Cs,R), or four years prior in established alfalfa and orchardgrass (AOG2) or five years prior in established alfalfa and orchardgrass (AOG3). Different letters indicate treatments that differed significantly at p<0.05
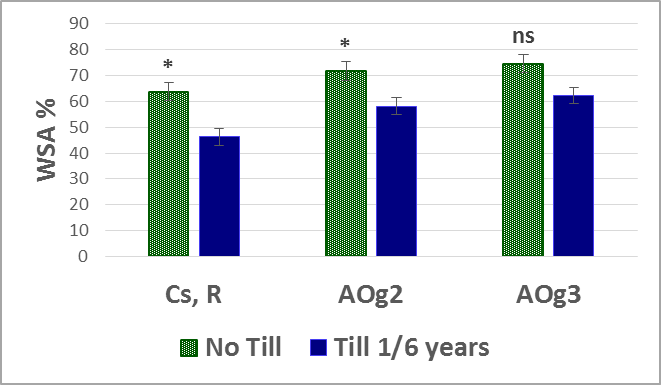
Figure 21: Percentage of water stable aggregates in the 0-15 cm soil depth in 2019 corn plots that were moldboard plowed and chisel-disked compared to no-tilled in August the year prior to planting corn silage (Cs,R), or four years prior in established alfalfa and orchardgrass (AOG2) or five years prior in established alfalfa and orchardgrass (AOG3). Different letters indicate treatments that differed significantly at p<0.05
The effects of termination timing on microbial nitrogen cycling dynamics
Average N2O emissions for the fall terminated (FT) and spring terminated (ST) AO plots are shown in Figure 22. There was a significant interaction between termination*DOY. Days where either FT was higher than ST or ST was higher than FT are represented by astericks (*). Out of the 26 days of N2O measurements, 4 days had significantly different N2O between FT and ST. Cumulative N2O emissions in the FT and ST plots were similar with 318 and 301 g N2O-N/ha emitted, respectively. Results from the first year of the experiment indicate that termination time of AO does not affect N2O emissions.
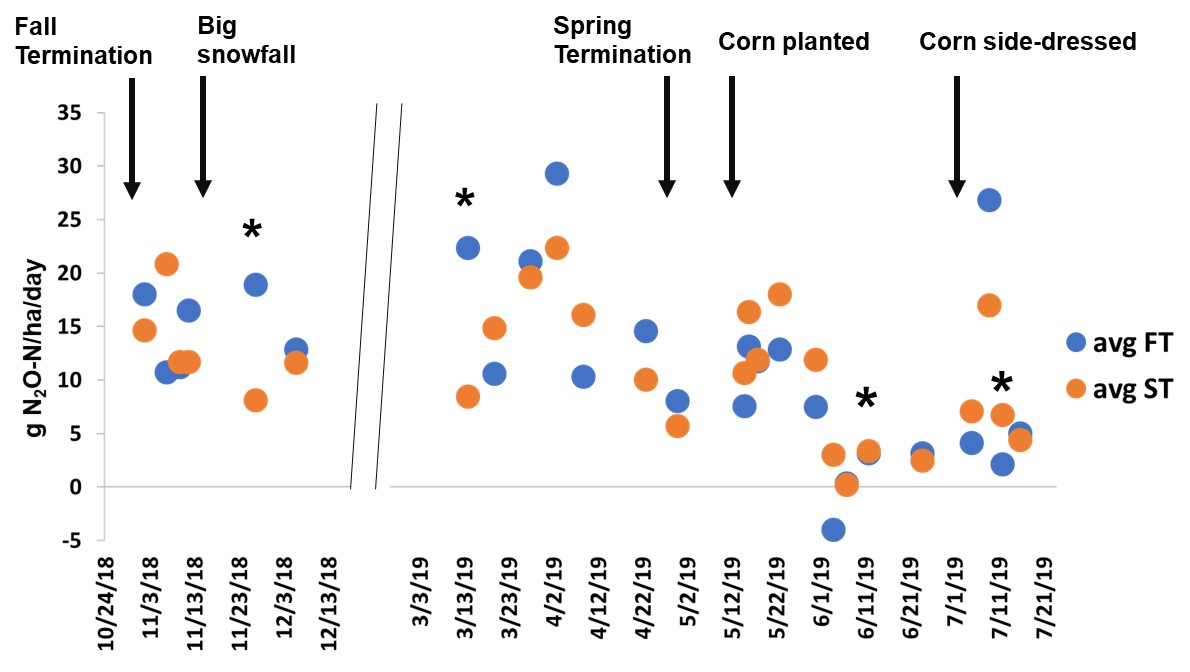
Figure 22. Average N2O emissions in the fall terminated (FT) and spring terminated (ST) plots. Measurements taken in the early winter (Oct-Dec, 2018) and in late-winter through summer (March -July 2019). * indicates days that had significant differences in N2O emissions.
Gene copy numbers of nirK were significantly higher in the spring sampling of both treatments compared to the fall sampling. Still, the highest nirK gene copy numbers were in the FT treatment in the spring. For both nosZI and nrfA, there were not differences in the ST treatment between the fall or spring sampling, but there was a significantly higher quantify of nosZI and nrfA in the FT treated plots in the spring. These preliminary results indicate a potential shift in microbial N cycling gene abundances, with higher abundances of N cycling genes in the FT treatments in the spring. While we still need to perform 16S rRNA qPCR to normalize N cycling gene abundances based on total bacterial populations, we speculate that terminating AO in the fall is changing the functional potential of the soil microbiome. Further investigation is needed to determine how or if these functional changes in microbes impact the health or yield of the crop grown after AO.
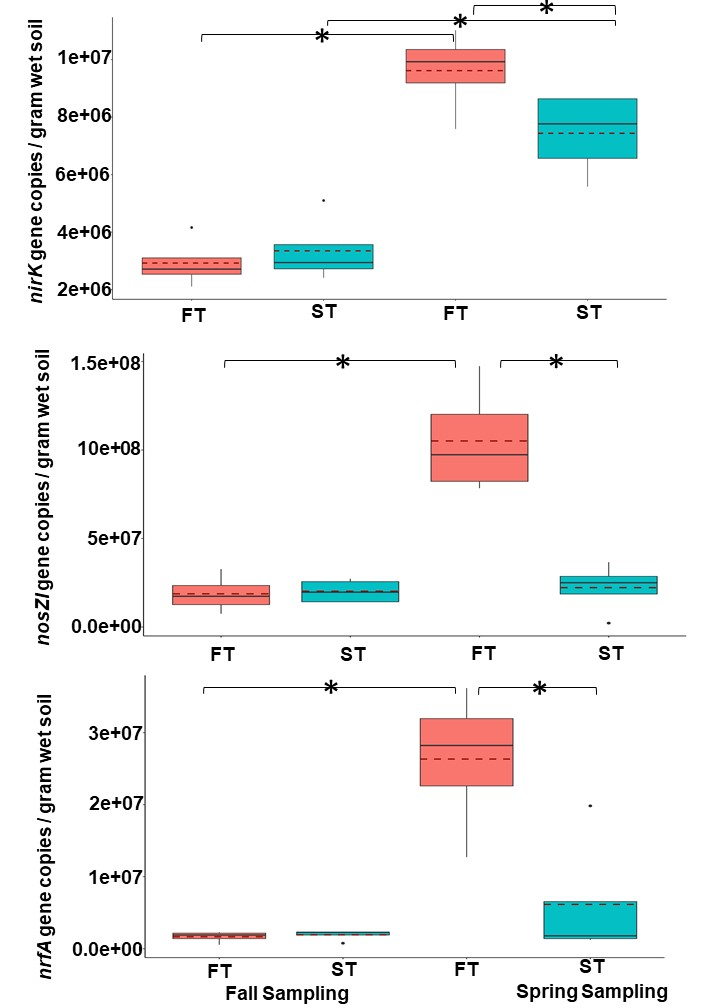
Figure 23. Gene copy numbers for nirK (top), nosZI (middle) and nrfA (bottom) of the FT and ST treatments in the fall and spring samples. Red dotted lines represent the mean gene copy numbers and * represent statistical differences (p<0.05).
- Research Conclusions
In the manure rotation, shallow disk manure injection with no-till provided multiple benefits compared to surface broadcast manure that was not incorporated: i. manure injection maintained similar crop yields and quality and reduced inorganic N fertilizer input by 35% over nine years summarized to date. ii. phosphorus losses in both surface and subsurface flows were significantly reduced from injected manure lysimeter plots compared to surface broadcast plots, especially in a year with frequent, high precipitation events following two years of manure applications, and P accumulation on the soil surface (Jahanzad et al., 2019); iii. manure injection reduced NH3-N (92-98%) losses. However, cumulative N2O emissions were greater with manure injection by 84%–152% compared with broadcast manure. N2O emissions were less than 2% of applied N and at least 3 orders of magnitude lower than NH3 volatilization (Duncan, et al., 2014).
Within the manure rotation, in a winter wheat/green manure/corn rotation sequence, red clover under-seeded in winter wheat provided multiple benefits over hairy vetch and triticale, including weed control with less herbicide, fall forage, larger subsequent corn yield and greater net returns (Snyder et al., 2016a). Double-cropping winter cereal rye after corn silage provided multiple dairy farm benefits including increased retention and utilization of manure nutrients, increased forage production and potential enhanced farm economic viability. Cereal ryelage contained and removed more fall manure N (ranging from 31% to 3.3 fold more) and P (47%) than rye cover. Double-cropped rye and corn silages produced 20%-44% more total forage depending than sole-cropped corn silage preceded by rye cover depending when the manure was applied in two different, 2-year experiments (Milliron et al., 2019; Binder et al., forthcoming).
Fall manure injection compared to broadcasting prior to planting winter rye resulted in higher subsequent corn silage yield following rye cover crop, and in some cases ryelage conserved more manure-N, often resulting in greater forage crude protein (Milliron et al., 2019; Binder et al.,2020). With fall manure injection spring top-dress N on rye silage was reduced by 38% and achieved similar ryelage yields. Injecting manure in late fall (November) compared to early fall (prior to rye planting) conserved more manure N in ryelage, in soil before corn, and greater corn yield after rye cover crop (Milliron et al., 2019).
We conducted a 2-year case study of four farms located in northern and western Pennsylvania where growing seasons are shorter and double-cropping winter annual silage and corn silage is not common. The cost to produce winter annual silage was greater than the purchase price of winter annual silage on 3 of 4 farms. Differences appeared to be due to a combination of small winter annual silage yield, large crop production expenses and farmer management, indicating the need for farmers to assess costs of production (Ranck et al, 2019), and opportunities to assist farmers to identify strategies to reduce costs of production through educational and technical assistance.
In the pest rotation, weed biomass was greater in the summer annual crops in the reduced herbicide-practices (RH) than the standard herbicide (SH) treatment. Rotating to the perennial forage particularly with oat companion reduced weed biomass to similar levels, and forage yields were similar or greater in the first production year. In five of eight years, soybean yields were greater in the standard herbicide treatment, two were primarily due to higher soybean populations (Snyder et al, 2016b) and in three of the five years soybean yield was greater in the more narrow-row standard herbicide treatment (Summers, 2020). Return to investment only differed between the two weed management systems in phase 1 for corn when the RH post-cultivation had 22% more returns on investment than the SH, and in Phase 3 of the forage establishment when RH had 32% more returns on investment, likely due oat companion crop that increased yield (Summers, 2020). On average over 9 years, herbicide use was reduced by: i. 44% with post-cultivation or 30% with post-herbicide in corn; ii. 37% in the alfalfa establishment year, and 100% when alfalfa was terminated. On average over 8 years in soybean herbicide use was reduced by 32% with post-cultivation or 4% with post-herbicide. Compared to the standard herbicide, the Environmental Impact Quotient (EIQ) for the reduced herbicide treatments was reduced by 48% in the post-cultivation corn, 52% in the established forage year across the nine years, and 68% over the eight years in post-cultivation soybean (Summers, 2020). These results suggest that integrated weed management with reduced herbicides can be effective particularly in crop rotations include rotating from summer annuals to perennials.
Additional weed research on control of herbicide-resistant weeds evaluated multiple management tactics including herbicide-tolerant soybean varieties, cultural and mechanical strategies to control winter annual horseweed and other weeds. For horseweed, we found that mechanical control strategies performed similarly to using diverse modes of herbicide action at burndown and post-herbicide applications, providing another non-chemical management strategy that reduces selection pressure for herbicide-resistance. We also compared cultural tactics for controlling herbicide-resistant summer-annual pigweed species by using cover crops, rotating to a frequently harvested perennial forage crop, delaying cover crop termination, or using a nurse crop. Delayed cover crop termination before soybean increased rye cover crop biomass, reduced pigweed density at two of three time points, and reduced end-of-season pigweed biomass better than early-termination or no cover crop, while also controlling total weed biomass better than early-termination of the cover crop. In alfalfa, oats cover crop did not winterkill, causing the cover crop to grow more than expected and with the spring-seeded alfalfa that was planted without any herbicides. Plots that contained oats had greater yield in the first harvest, and less pigweed biomass than pure alfalfa without a cover crop, with the oats cover crops providing the best total weed suppression. These studies confirm the benefits of using a diverse and multiple IWM control tactics including shallow tillage, increasing cover crop biomass, and rotating to a perennial forage.
Integrated pest management and the diverse rotations provided similar slug and insect pest control, and maintained similar or greater corn grain yields compared to the pre-emptive pest control in the corn-soy rotation over the 9 years. Despite higher black cutworm and armyworm damage in some corn (4 of 33 corn rotation phases over 4 of 9 years), in the diverse rotations, IPM managed insect pests and maintained similar or higher corn grain yields compared to the corn-soy rotation with pre-emptive pest control practices (Busch et al., 2020). Early in the season, pest predation levels in corn have often been greater in the diverse rotations managed with IPM rotations than in the corn-soy rotation managed with pre-emptive pesticides (Busch et al., 2020). Each year European corn borer did not reach economic thresholds in non-Bt corn, which had the same or higher yields as “sister” Bt corn varieties in the Corn-Soy rotation. We also learned that seed neonicotinoid treatments did not harm slugs or reduce slug herbivory of crop seedlings; but slugs that consumed neonicotinoid-seed treated soybeans were toxic to predatory-beetles in a laboratory study. Additional research revealed that seed neonicotinoid treatments were associated with reduced slug predatory beetle populations, increased slug activity, increased soybean damage and reduced soybean yields (Douglas et al., 2015).
Compared to no-till, conservation tillage in the corn-soybean control rotation reduced soil health in the top 0-5 cm. In the pest rotation, conventional tillage once in six years also reduced soil health indicators the year after tillage in the top 0-5 cm, but after six years with two years of perennial forages soil health indicators did not differ significantly. This suggests that soil health can be maintained with occasional tillage in crop rotations that primarily use no-till and integrate perennial forages, double and cover crops.
Compared to benchmark PA dairy farms, producing all of the dairy forage and feed on farm with these conservation cropping systems reduced feed costs and farm economic performance was strong for the five years that we have completed economic analyses. Relative to a computer-modeled typical PA dairy farm that produces the same amount of milk and all of the forage crops on half as much land with imported feed crops, the enhanced conservation dairy farming scenario reduced total fossil energy inputs per Mg of milk produced by 18%, largely by importing 77% less feed crops that would have been grown elsewhere (Malcolm et al., 2015)
To assess the effect of the enhanced conservation dairy cropping scenarios at the watershed scale, we used a Topo-Soil and Water Assessment Tool (Topo-SWAT) to simulate nutrient and sediment loading processes. We compared a typical PA dairy farm that produces all of the forage crops with 66% no-till and 33% cover cropping. Compared to the typical PA dairy farm with some BMPs, the enhanced conservation dairy cropping scenarios reduced the number of in-stream peaks of nutrients and sediment, and average concentration of sediment (31%), organic N (41–53%), nitrate-N (23%), organic P (36–45%), and soluble P (32–43%) concentration; and the injected manure conservation farming scenario was the most effective (Amin et al., 2018). We also used the Topo-SWAT to evaluate cost-effective BMPs to meet the Chesapeake Bay TMDL for the Spring Creek Watershed where the experiment is located. We evaluated eight BMPs recommended for Spring Creek in the watershed implementation plan, and found that applying just five of the BMPs (no-till, manure injection, cover cropping, riparian grass buffers and 15% reduction in nitrogen inputs) achieved equal or greater sediment and N and P load reductions as the federal requirements for 74% of the cost (Amin et al., 2019).
References cited above that do not appear in the below 2019 and 2018 Publications list:
Douglas, M., R. and J. F. Tooker. 2012. Slug (Mollusca: Agriolimacidae, Arionidae) ecology and management in no-till field crops, with an emphasis on the mid-Atlantic Region. J. Integ. Pest Mngmt. 3(1): 2012. 1-9. doi.org/10.1603/IPM11023
Douglas, M.R., J. R. Rohr and J. F. Tooker. 2015. Neonicotinoid insecticide travels through a soil foodchain, disrupting biological control of non-target pests and decreasing soya bean yield. Journal of Applied Ecology. 52: 250–260. doi: 10.1111/1365-2664.12372
Duncan, E.W., P.J. A. Kleinman, D.B. Beegle, C.A. Rotz. 2017. Coupling dairy manure storage with injection to improve nitrogen management: whole-farm simulation using the integrated farm system model. Agriculture & Environmental Letters. doi:10.2134/ael2016.12.0048
Duncan, E.W., P.J.A. Kleinman, G.J. Folmar, L. Saporito, G.W. Feyereisen, A.R. Buda, L. Vitko, A. Collick, P. Drohan, H. Lin, R.B. Bryant, and D.B. Beegle. 2017. Field scale lysimeters to assess management impacts on runoff. Trans. ASABE. doi: 10.13031/trans.11901
Duncan E.W., C.J. Dell, P.J.A. Kleinman, D.B. Beegle. 2016. Nitrous oxide and ammonia emissions from injected and broadcast-applied dairy slurry. J. Environ. Qual. doi:10.2134/jeq2016.05.0171
Malcolm, G. M., G.T. Camargo, V. A. Ishler, T.L. Richard, and H. D. Karsten. 2015. Energy and Greenhouse Gas Analysis of Northeast US Dairy Cropping Systems. Agriculture, Ecosystems, and Environment. 199:407-417. doi.org/10.1016/j.agee.2014.10.007
NASS (National Agricultural Statistics Service) USDA. 2017 Census of Agriculture, Pennsylvania. Chpt. 1 Table 47. https://www.nass.usda.gov/Publications/AgCensus/2017/Full_Report/Volume_1,_Chapter_1_State_Level/Pennsylvania/st42_1_0047_0047.pdf
Snyder, E. M., H.. D. Karsten, W. S. Curran, G. M. Malcolm, and J. A. Hyde. 2016a. Green Manure Comparison between Winter Wheat and Corn: Weeds, Yields and Economics. 2016. Agronomy J. 108:1-11. doi: 10.2134/agronj2016.02.0084.
Snyder, E. M., W. S. Curran, H. D. Karsten, G. N. Malcolm, S. W. Duiker, and J. A. Hyde 2016b. Assessment of an integrated weed management system in no-till soybean (Glycine max L.) and corn (Zea mays L.). Weed Science In-Press. doi.org/10.1614/WS-D-16-00021.1
Appendix I: NE SARE 2019 management tables presenting planting and harvesting information for the pest, manure, and control rotations.
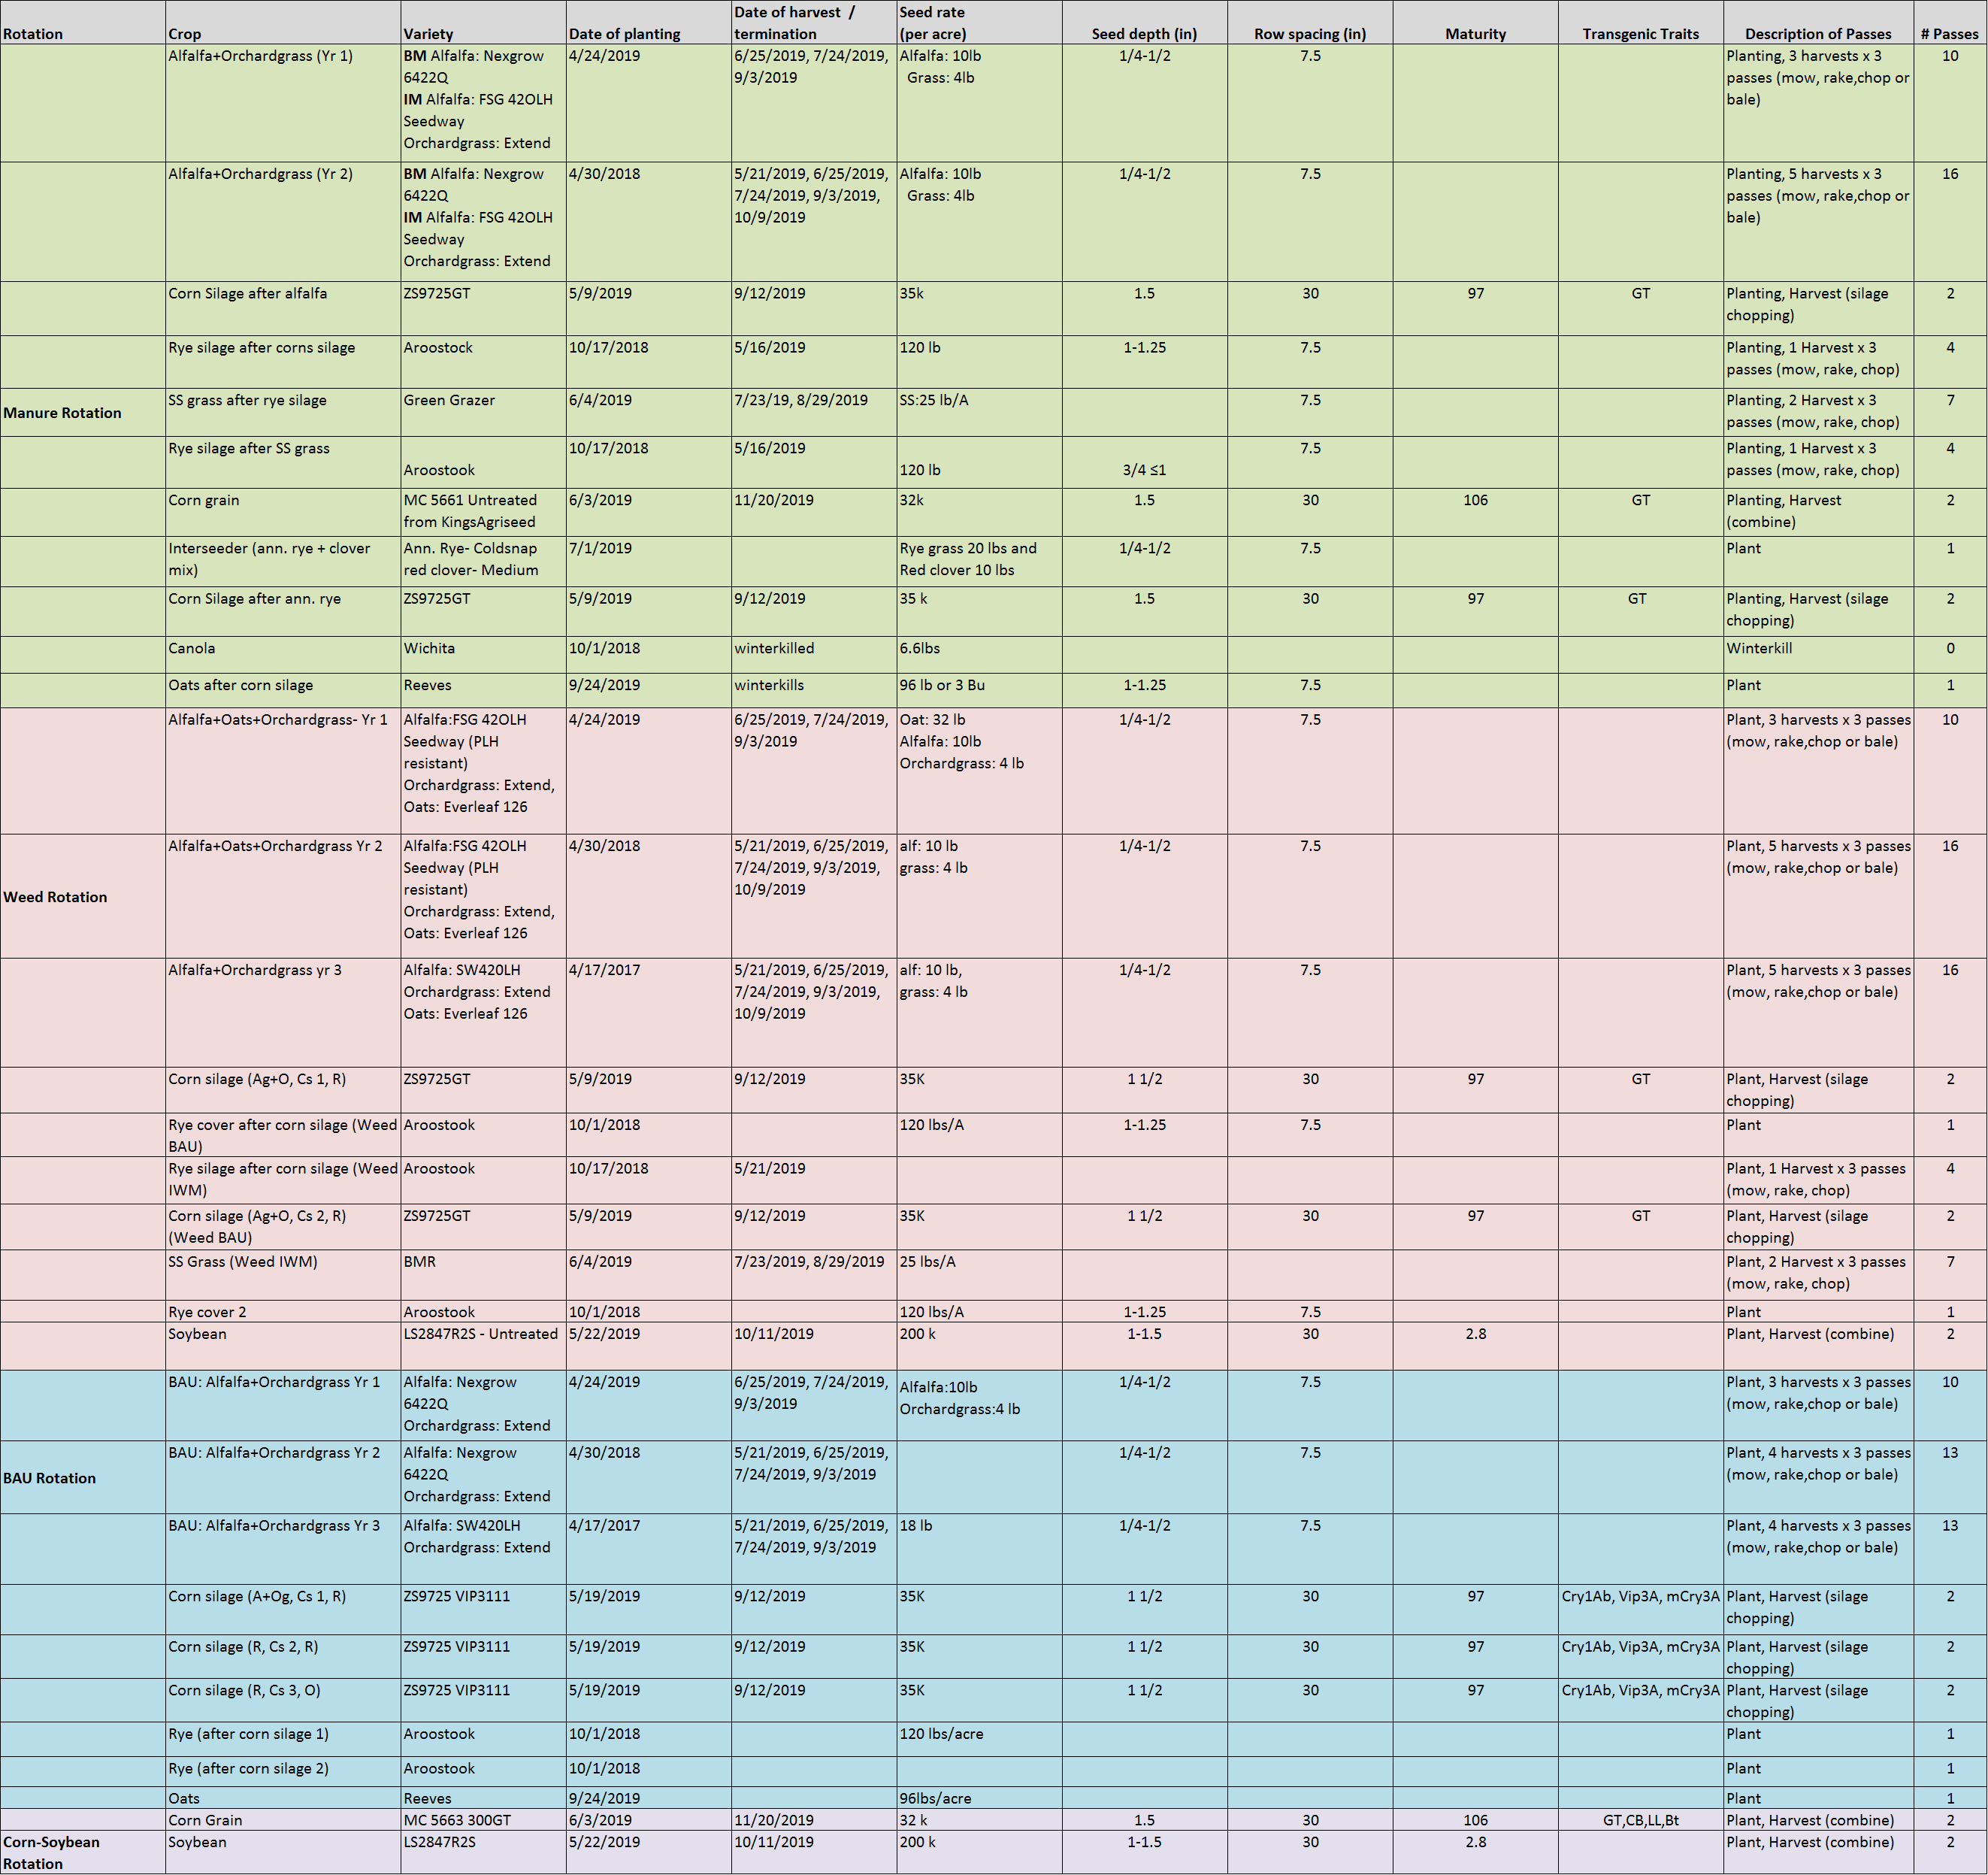
Appendix II: NE SARE 2019 management tables presenting nutrient management information for the pest, manure, and control rotations.
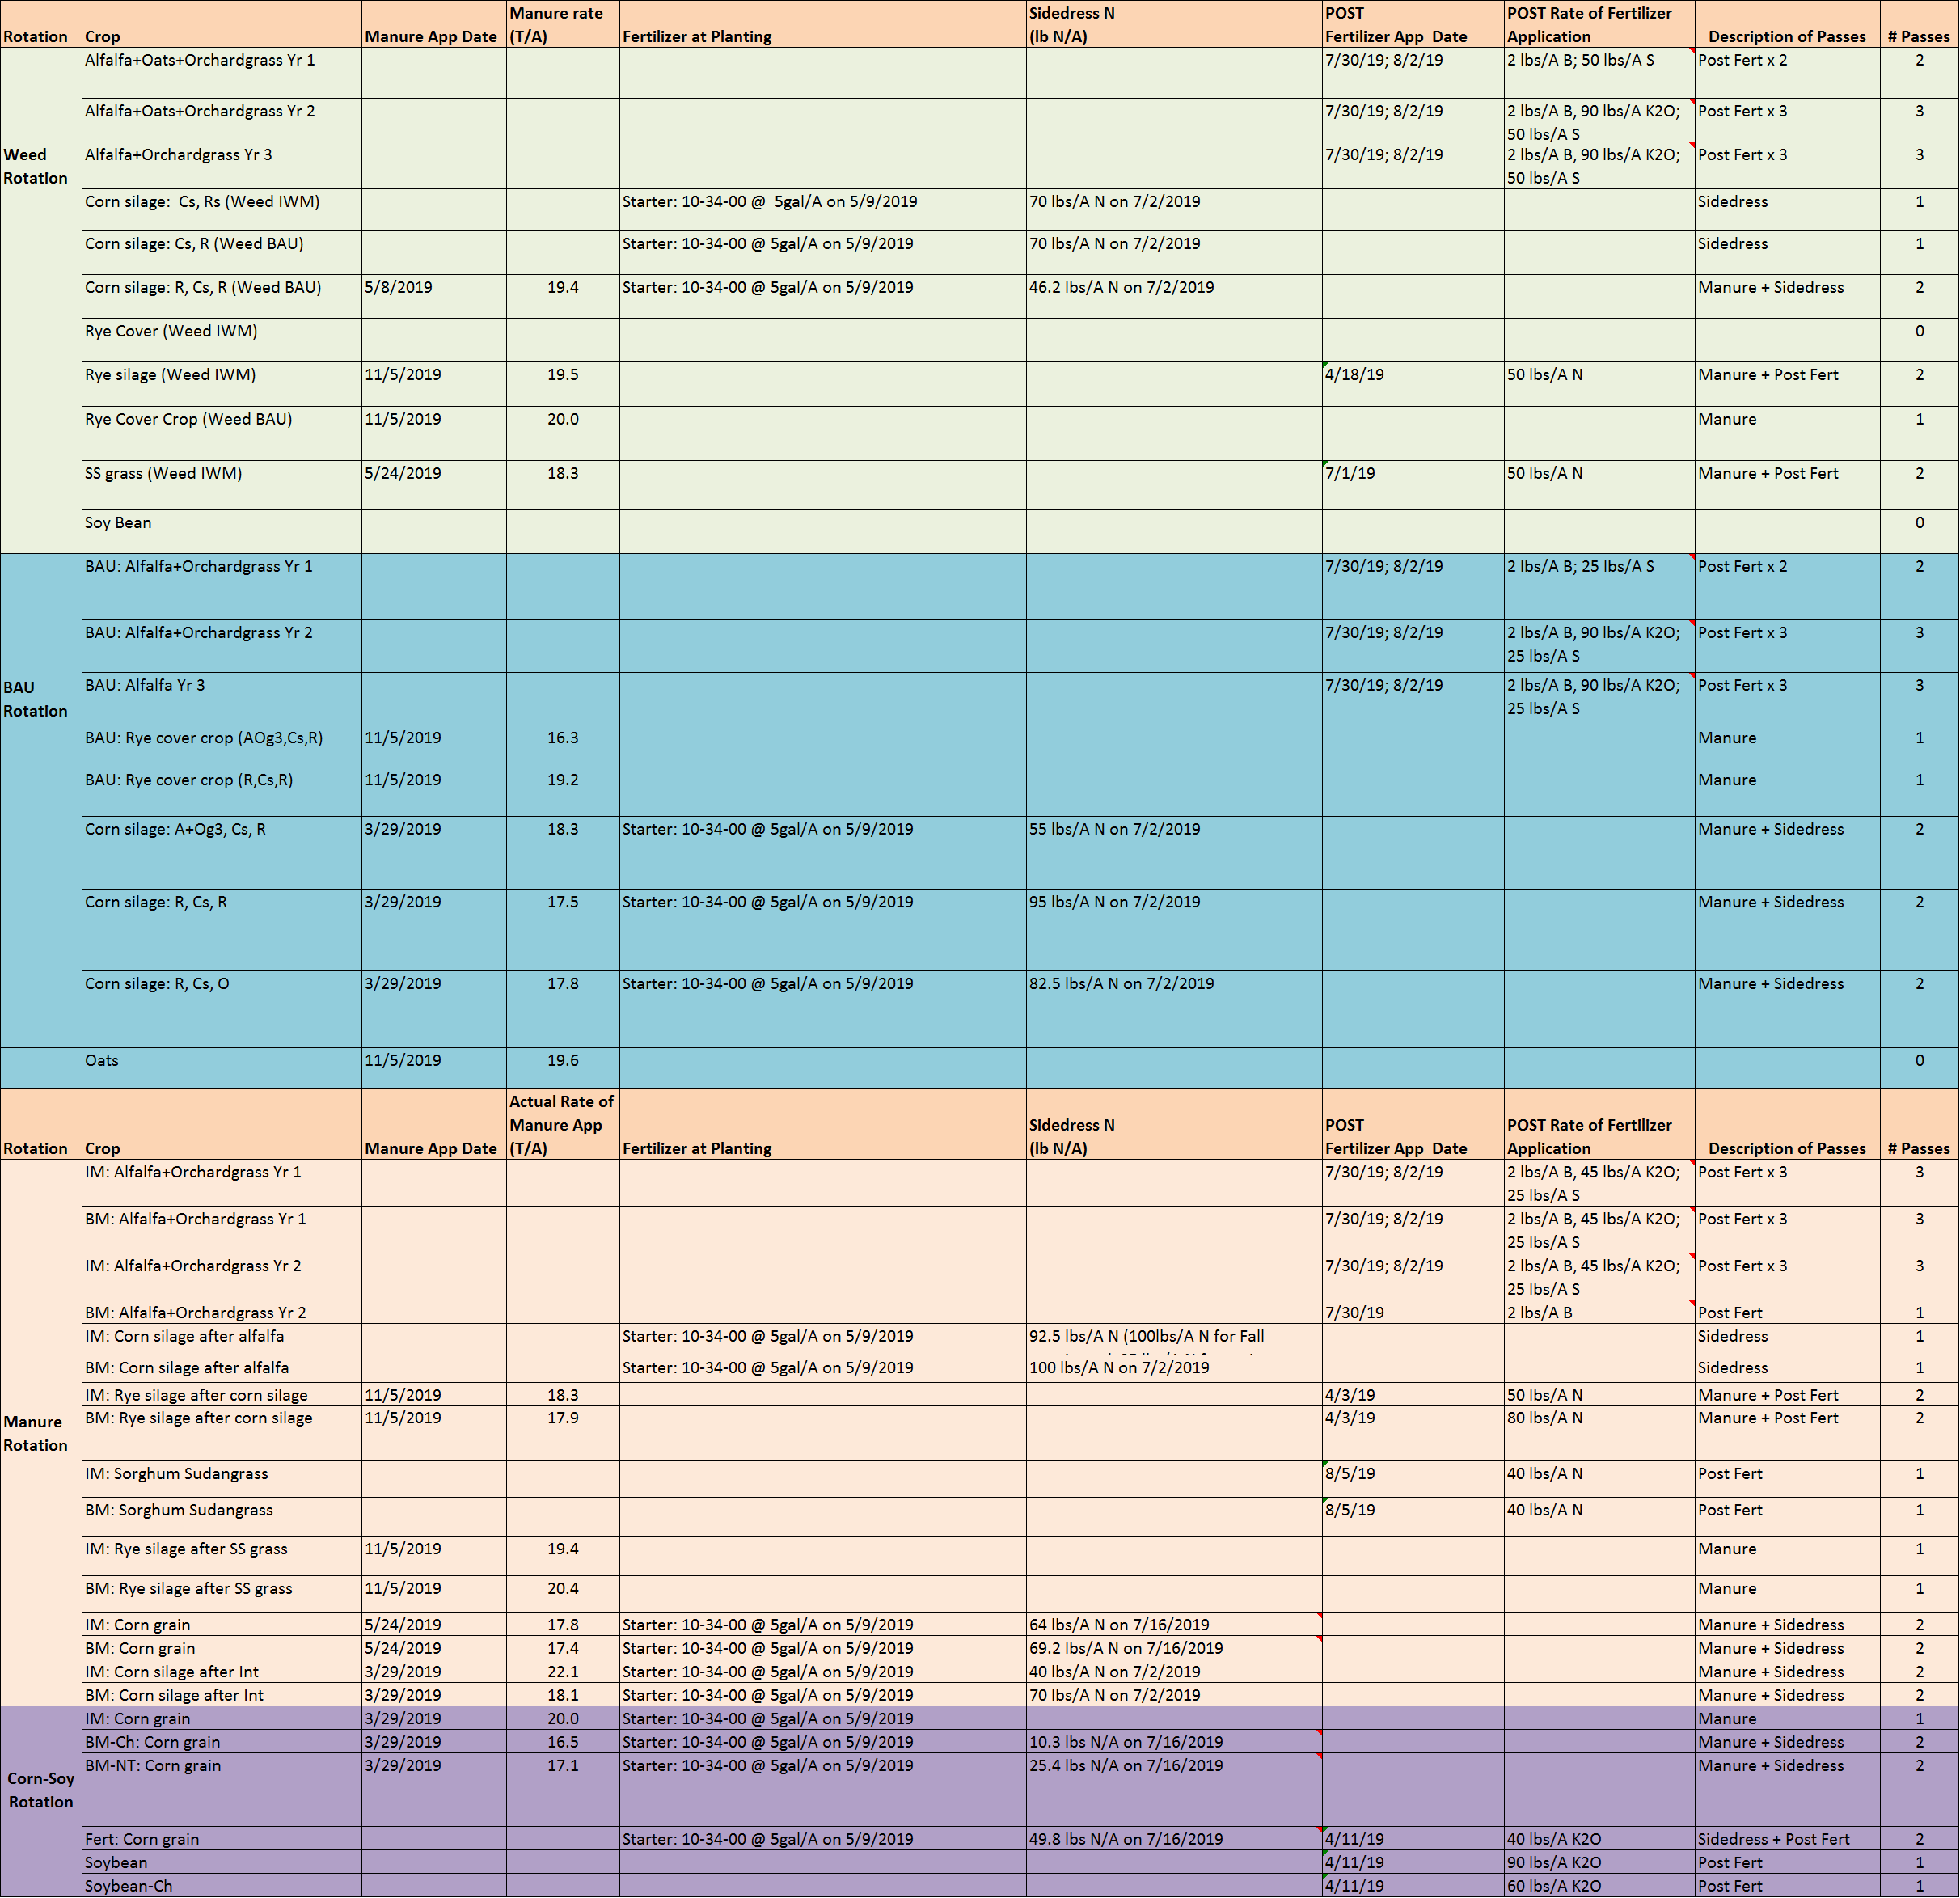
Appendix III: NE SARE 2019 management tables presenting pest management information for the pest, manure, and control rotations.
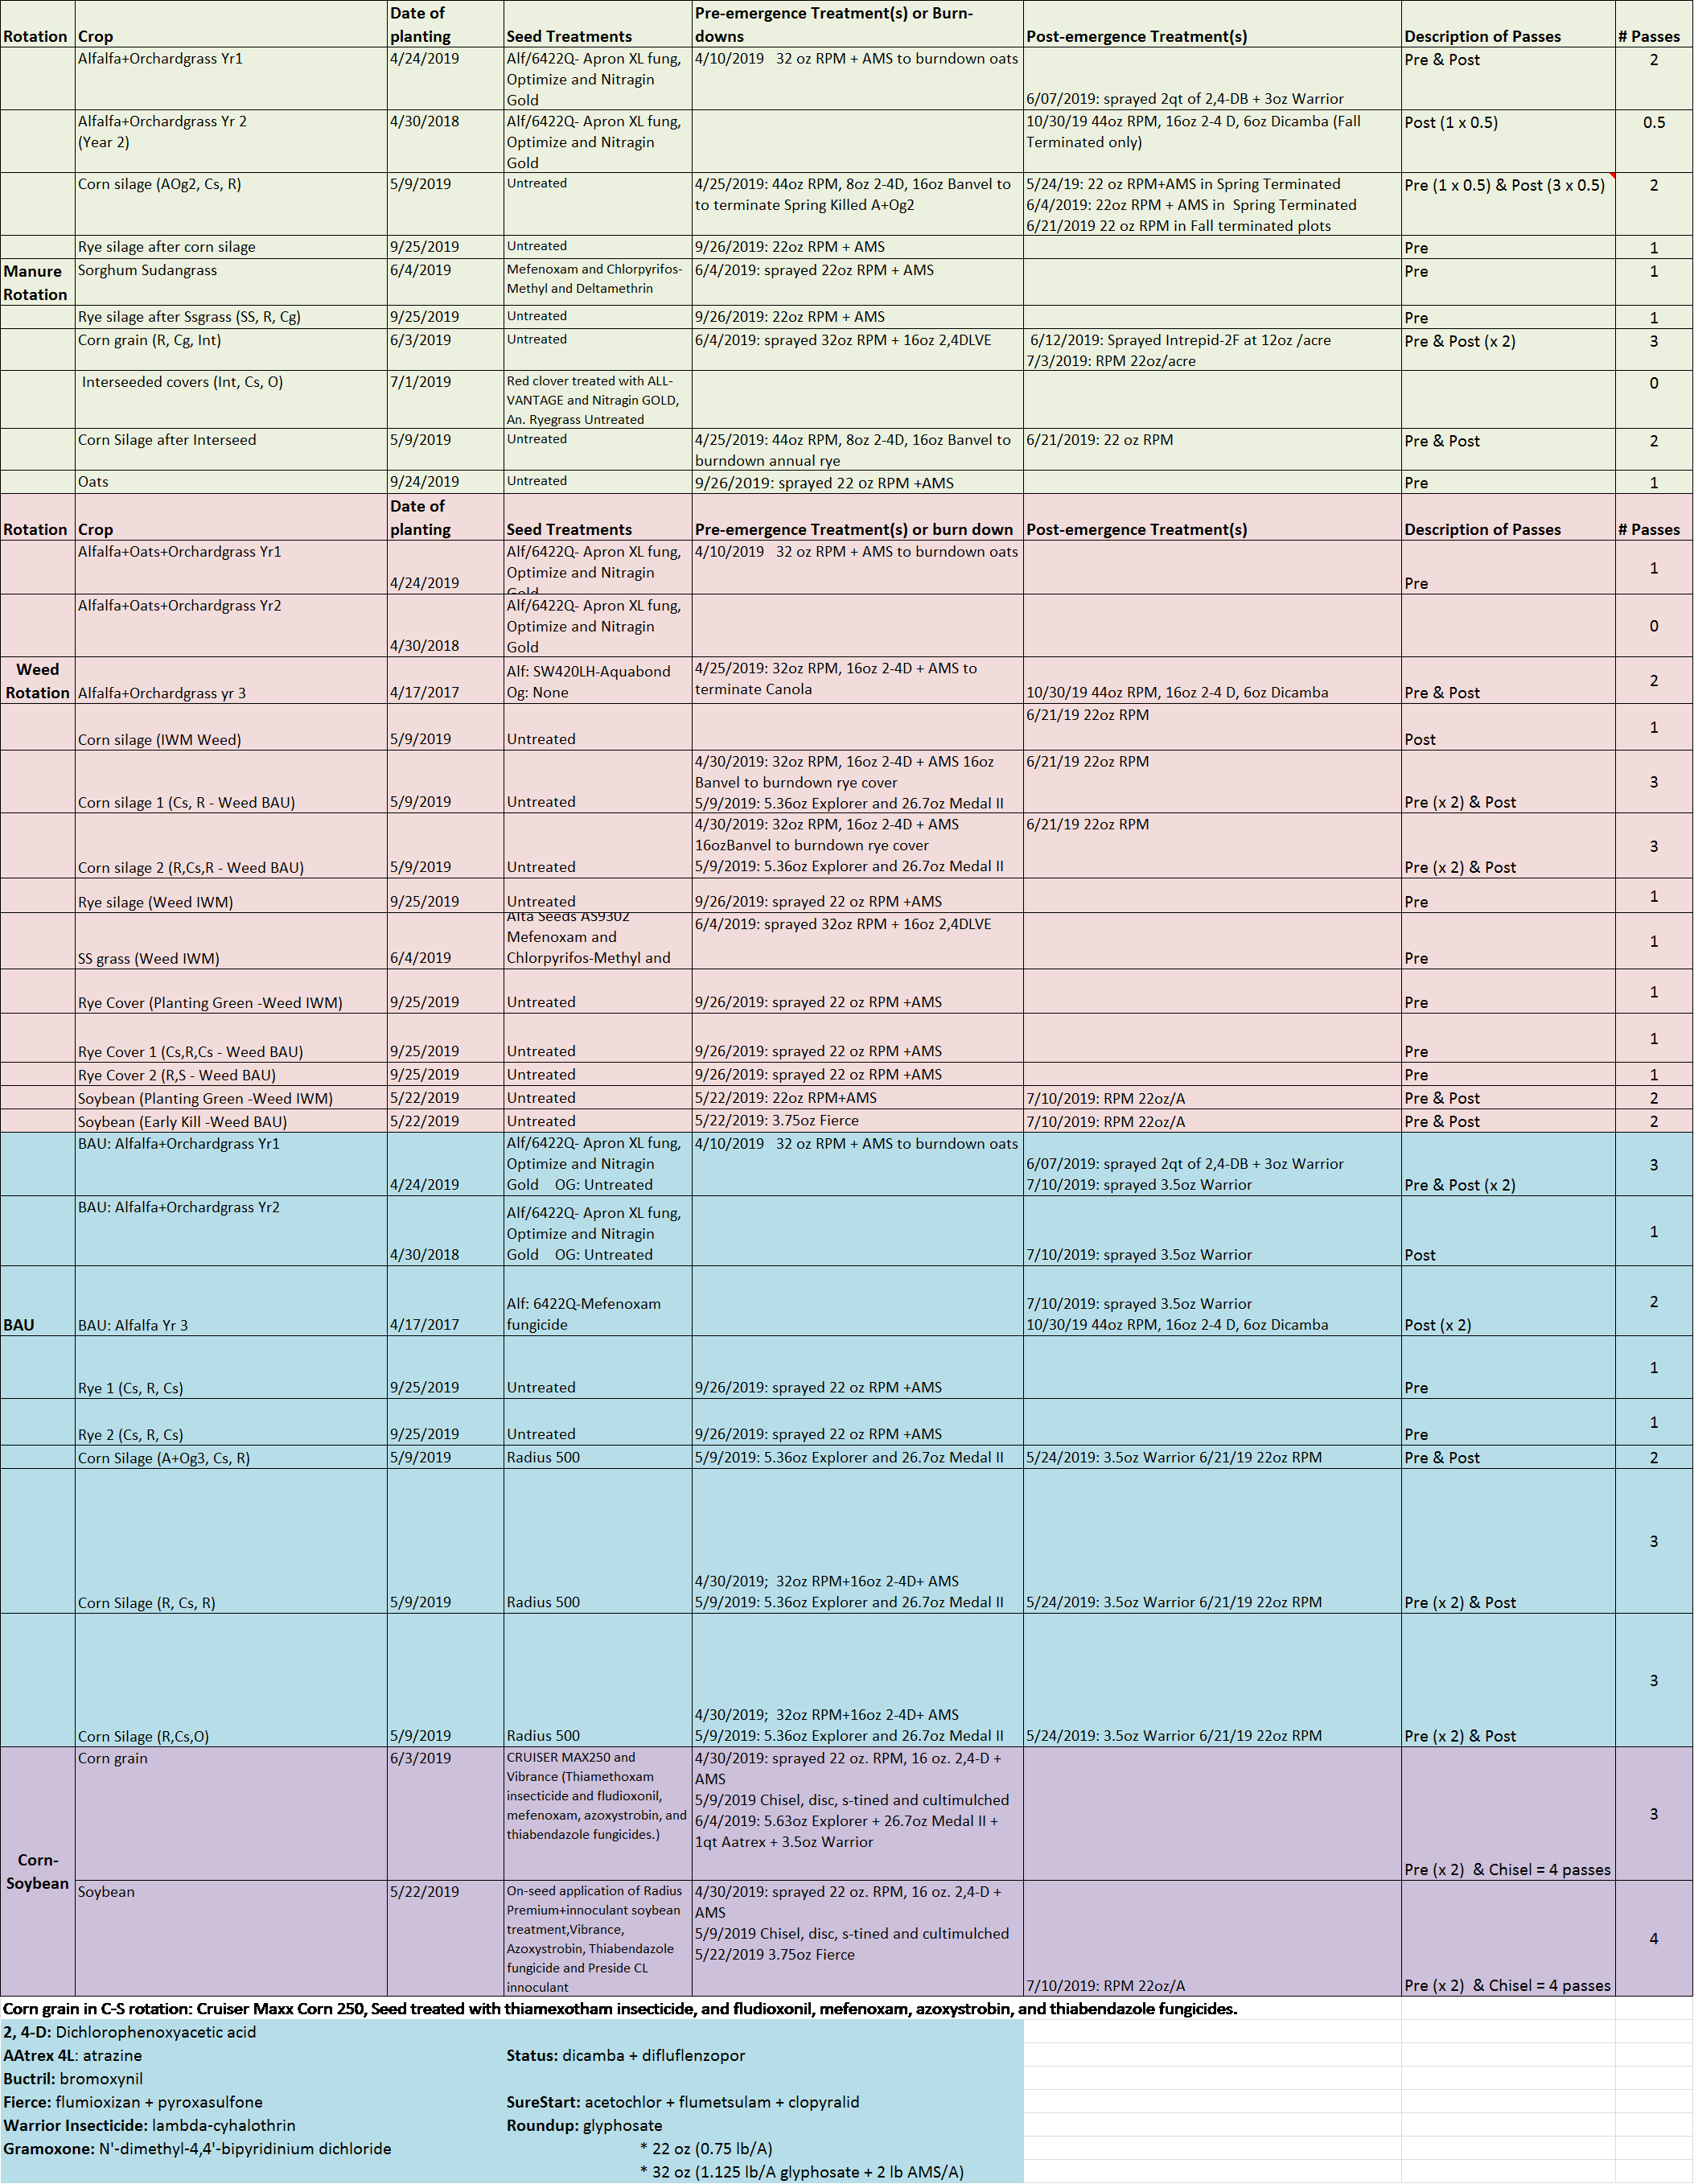
Education & Outreach Activities and Participation Summary
Educational activities:
NE Climate Hub Virtual Tour of the Field and Project with Photos and Videos: https://www.climatehubs.usda.gov/hubs/northeast/project/sustainable-dairy-cropping-penn-state
Project Website with multiple Extension fact sheets and bulletin links: https://plantscience.psu.edu/research/areas/crop-ecology-and-management/cropping-systems
Participation Summary:
Outreach activities and Participation Summary
- Activities
We have hosted multiple outreach activities (see Table of Presentations in Outreach description), written fact sheets and are in the process of developing and offering additional outreach education products. Extension and scientific publications are also listed in the Outreach section. We hosted multiple tours at our research site about this project that included: i. October 11, to the National Dairy Grazing Apprentice Program Educators hosted by PASA, ii. July 29, 2019 to the National NRCS CEAP Soil and Water Conservation Conference tour which included some ARS LTAR national program leaders, iii. August 13 & 14, 2019, two field tours hosted in conjunction with Ag Progress Days at the Penn State Russell E. Larson Agricultural Research Center at Rock Springs, PA. The first event provided Commercial Manure Hauler Continuing Education Credits to 67 attendees. The August 14 event had 37 attendees and was part of the general Ag Progress Days tour schedule (see Outreach Description). We also presented our results to the Advisory Panel members on December 19, 2019.
Commercial Manure Hauler Survey Results (August 13, 2019)
Forty nine of the 67 participants (73%) completed the survey.

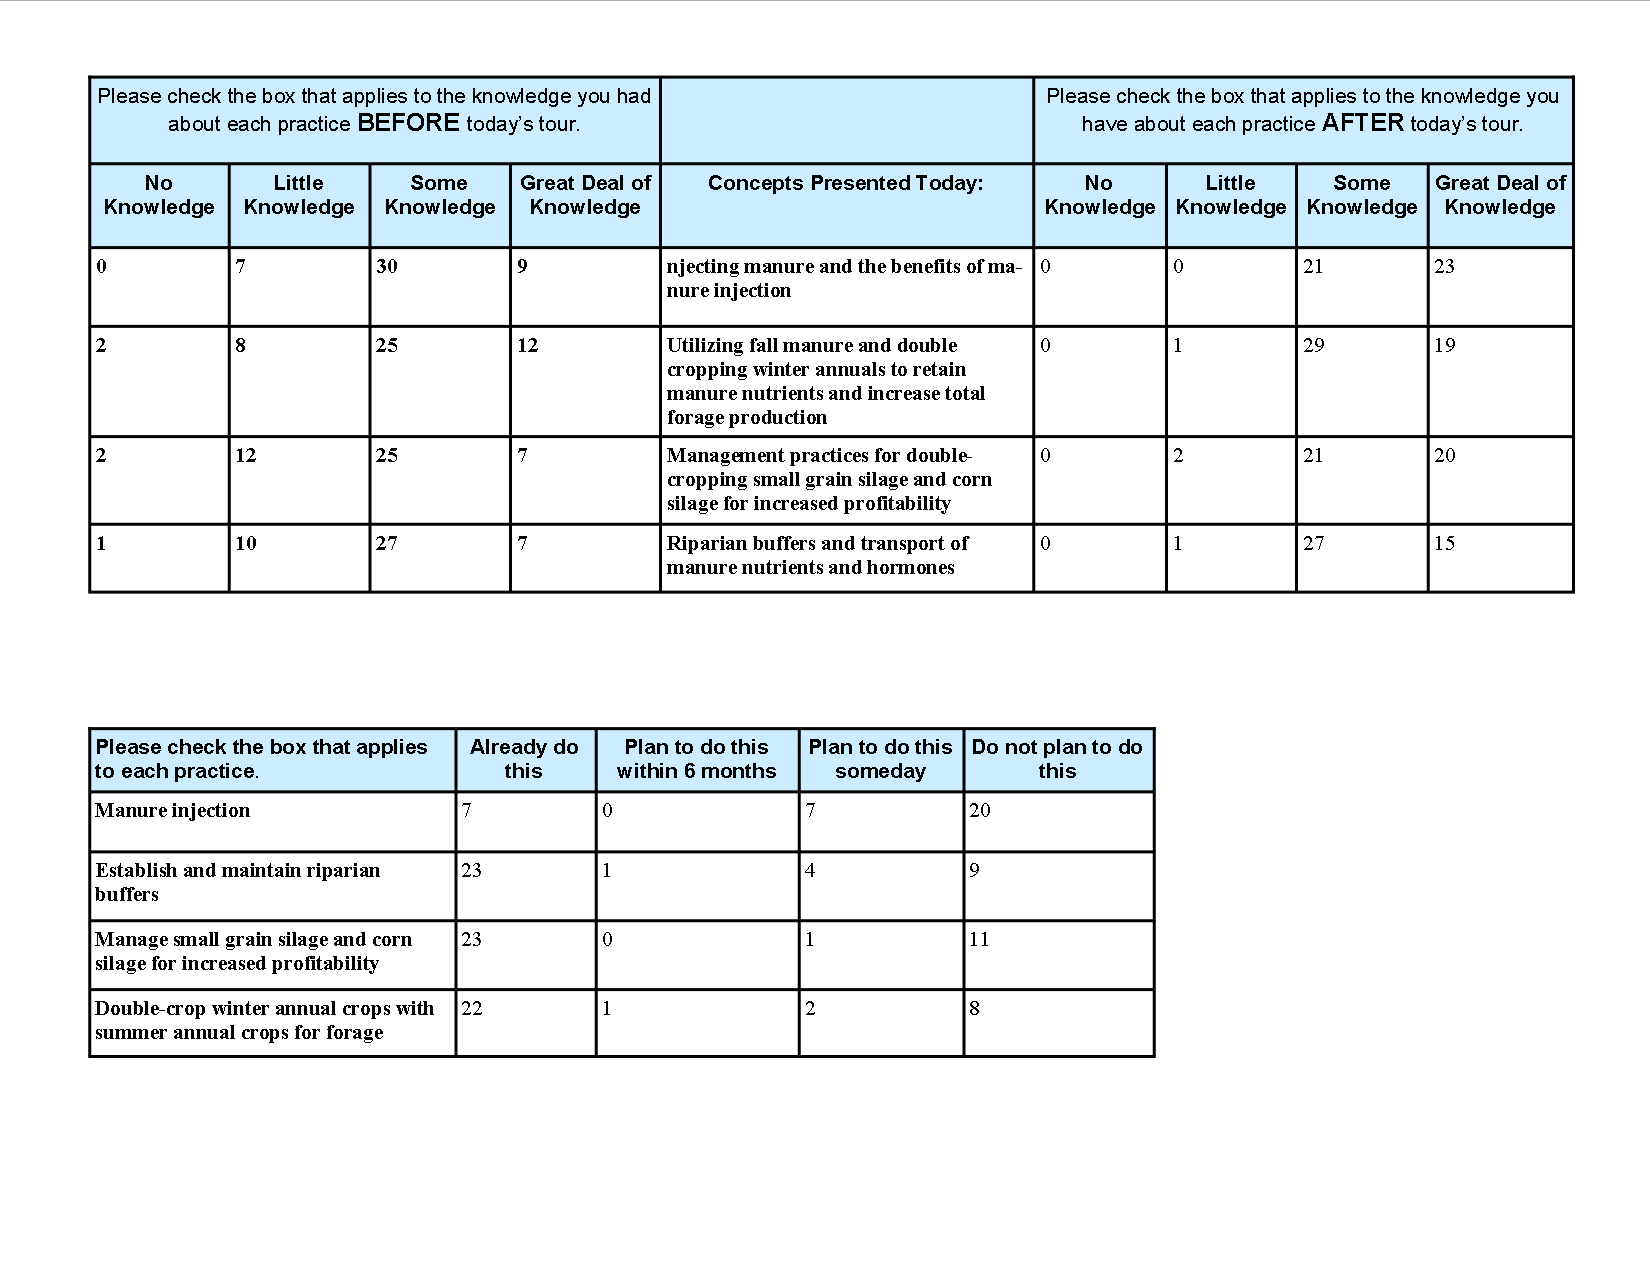
Ag Progress Days Survey Results (Aug 14, 2019)
Twenty of 37 (54%) participants completed the survey.
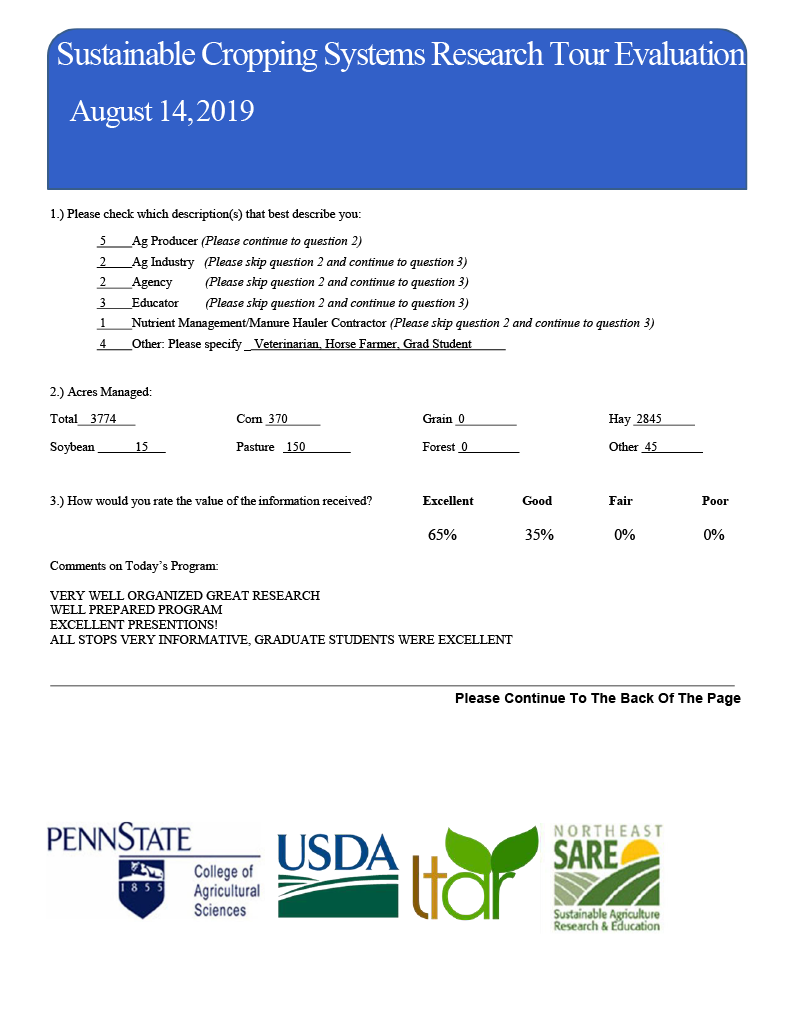
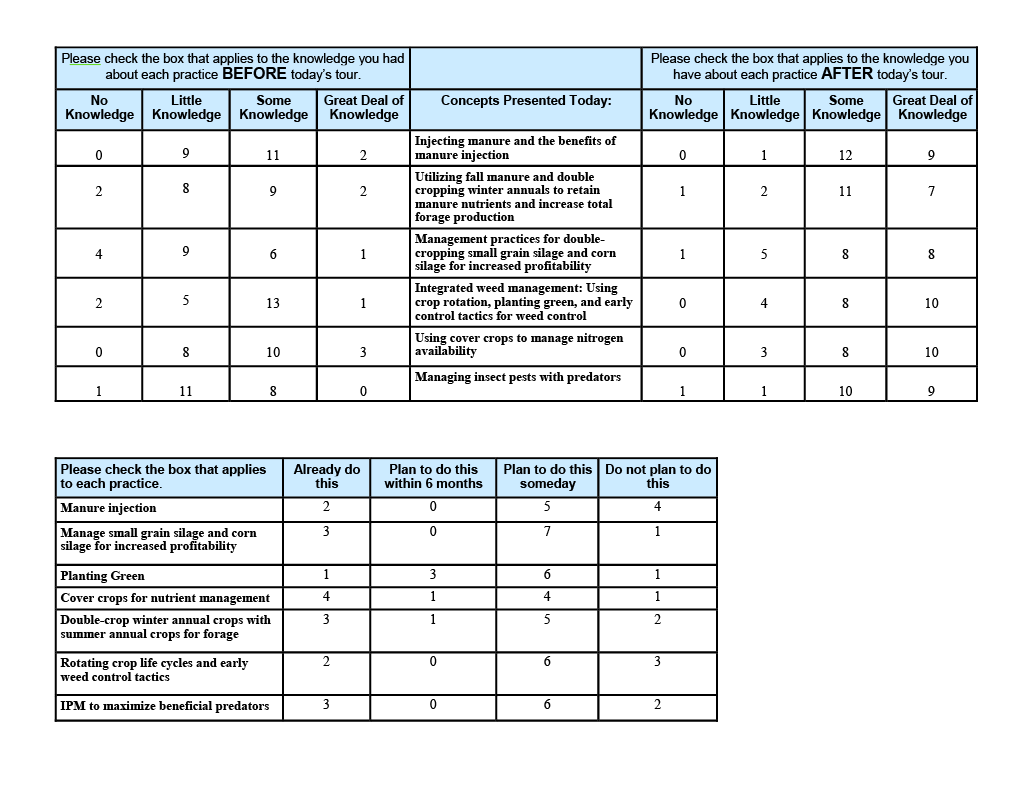
- Participants
Project team members, Project Advisory Panel members, Pennsylvania Cooperative Extension County educators, the regional NRCS director, and a private crop consultant.
- Outreach Description
Presentations and publications
Information that we have learned from the NESARE Sustainable Dairy Cropping Systems is presented in several outreach and extension type activities including field days, workshops, fact sheets, field visits, online videos, symposiums, and regional and national scientific meetings. Each project year, we have reported our project team’s outreach activities in the annual reports and final reports for phases 1 (project #LNE09-21) and 2 (project #LNE13-329) of this long term project. Rather than list them all here again, we refer the reader to those earlier reports and list the 2019, 2017 and 2018 publications and outreach activities here.
|
Date |
Event |
Title |
Location |
# Attendees |
|
1/7/19 |
Pennsylvania Agronomic Education Society |
Pest Management in Reduced Tillage Production |
Boalsburg, PA |
70 |
|
1/7/19 |
University of Vermont Extension, No-Till Management Webinar Series |
Soil Fertility and Nutrient Management in No-Till Systems |
Online |
15 |
|
1/19/19 |
FarmSmart Conference |
Slugs and IPM—Healthier soil decreases troubles from menacing molluscs? |
Guelph, Ontario, Canada |
150 |
|
1/31/19 |
Ohio AgriBusiness Association Industry Conference |
Controlling slugs and insects in no-till fields with cover crops |
Columbus, OH |
65 |
|
2/20/19 |
Annual Meeting of Western New York Crop Management |
Do Not Let Slugs Slow You Down |
Batavia, NY |
130 |
|
3/5/19 |
Understanding Dairy Business and Production for the Conservation Professional |
Managing the 4Cs: Crops-Cows-Cash-Conservation |
Mill Hall, PA |
12 |
|
3/6/19 |
Understanding Dairy Business and Production for the Conservation Professional |
Managing the 4Cs: Crops-Cows-Cash-Conservation |
Duncansville, PA |
13 |
|
3/7/19 |
Western Pennsylvania Regional Soil Health Workshop |
Controlling slugs and insects with no-till and cover crops |
Prospect, PA |
55 |
|
3/12/19 |
Connecting Soils and Profits Tools for Improving Soil Health |
IPM & Soil Health: An Argument for Avoiding Preventative Pesticide Use |
State College, PA |
45 |
|
3/13/19 |
Connecting Soils and Profits Tools for Improving Soil Health |
IPM & Soil Health: An Argument for Avoiding Preventative Pesticide Use |
Wysox, PA |
70 |
|
3/14/19 |
Connecting Soils and Profits Tools for Improving Soil Health |
IPM & Soil Health: An Argument for Avoiding Preventative Pesticide Use |
Danville, PA |
200 |
|
4/17/19 |
Women in Agriculture Conference |
Insect & Slug Management in No-till Cropping Systems: a case for IPM |
Wellsboro, PA |
65 |
|
4/18/19 |
Cover Crops Innovators Webinar |
Cover Crops, Slugs, and Naked Seed |
Online |
23 |
|
4/25/19 |
Understanding Dairy Business and Production for the Conservation Professional |
Managing the 4Cs: Crops-Cows-Cash-Conservation |
Chambersburg, PA |
13 |
|
7/10/19 |
Weed/Insect Field Day |
Insects, slugs, soil health and IPM |
Rock Springs, PA |
40 |
|
7/16/19 |
Penn State Agronomic Diagnostic Clinic |
The benefits of non-Bt corn |
University Park, PA |
65 |
|
7/17/19 |
Penn State Agronomic Diagnostic Clinic |
The benefits of non-Bt corn |
University Park, PA |
35 |
|
7/29/19 |
Sustainable Chesapeake Webinar |
Manure Injection Webinar |
Hosts: Univ. of Maryland and Sustainable Chesapeake |
40 |
|
8/1/19 |
Soil and Water Conservation Conference CEAP Tour |
LTAR Conservation Dairy Cropping Systems |
Dairy Cropping Systems Rock Springs, PA |
48 |
|
8/13/19 |
Commercial Manure Hauler Continuing Education Credit Program |
NESARE Dairy Cropping Systems Tour Team presentations on multiple topics |
Rock Springs, PA |
67 |
|
8/14/19 |
Sustainable Dairy Cropping Systems Field Day |
NESARE Dairy Cropping Systems Tour Team presentations on multiple topics |
Rock Springs, PA |
37 |
|
8/20/19 |
Dairy and Crop In-Service Training |
Managing the 4Cs: Crops-Cows-Cash-Conservation |
State College, PA |
20 |
|
8/27/19 |
Penn State Commercial Applicator’s School |
Insecticides, IPM, and some new ways to control insects |
University Park, PA |
70 |
|
10/11/19 |
National Dairy Grazing Apprentice Program Educators |
NESARE Dairy Cropping Systems Tour |
Rock Springs, PA |
5 |
|
10/22/19 |
Penn Ag Industries, Keystone Crop Conference |
Agronomic Management to Reduce Nutrient Losses to the Atmosphere and Local Waterways |
Grantville, PA |
25 |
|
11/3/19 |
Watershed Specialist Meeting |
Managing the 4Cs: Crops-Cows-Cash-Conservation |
State College, PA |
20 |
|
11/6/19 |
Dairy Cattle Nutrition Conference |
Managing the 4Cs: Crops-Cows-Cash-Conservation |
Hershey, PA |
48 |
|
12/3/19 |
University of New Hampshire Crop Meeting |
Pest Management in Reduced Tillage Production |
Burlington, VT |
15 |
|
12/3/19 |
University of New Hampshire Crop Meeting |
IPM in a Treated/Traited World |
Burlington, VT |
15 |
|
12/4/19 |
University of New Hampshire Crop Meeting |
Pest Management in Reduced Tillage Production |
Burlington, VT |
25 |
|
12/4/19 |
University of New Hampshire Crop Meeting |
IPM in a Treated/Traited World |
Burlington, VT |
25 |
|
12/12/19 |
Dairy Cropping Enterprise for the Conservation Professional |
Double cropping: Forage quality, rations and performance |
Mount Joy, PA |
22 |
|
12/18/19 |
Cumberland Valley Planter and Cumberland County Conservation District, No-Till Planter Clinic |
Soil Fertility and Nutrient Management in No-Till Systems |
Shippensburg, PA |
150 |
|
12/19/19 |
NESARE Advisory Panel |
NESARE Dairy Cropping System Annual Research Update |
University Park |
10 |
Presentations at scientific meetings in 2019:
Cloutier, M., Karsten, H. D., Alcaide, T., Bruns, M. A. V. 2019. "Above Ground Disturbances Impact below Ground Nitrogen Cycling in Rhizospheres of Alfalfa and Orchard Gr," 2019 ASA-CSSA-SSSA International Annual Meeting, ASA-CSSA-SSSA, San Antonio, Texas.
Summers, H., Lingenfelter, D., Karsten, H. D. 2019. "Evaluation of Early and Late-Season Marestail Management in Soybeans," Weed Science Society of America, New Orleans, LA, published in proceedings.
Posters presented at scientific meetings in 2019
Summers, H., Karsten, H. D. 2019. "Herbicide Alternatives to Amaranth Control in a No-till Dairy System," 2019 ASA-CSSA-SSSA International Annual Meeting, ASA-CSSA-SSSA, San Antonio, TX.
Bhowmik, A., Cloutier, M., Bell, T., Karsten, H. D., Dell, C., Bruns, M. V. 2019. "Impact of Soil and Manure Management on Nitrate Ammonifying Bacteria and Greenhouse Gas Emissions," 2019 ASA-CSSA-SSSA International Annual Meeting, ASA-CSSA-SSSA, San Antonio, Texas.
Chou, J., Karsten, H. D. July 2019. "Can nitrous oxide emissions be reduced by changing the timing and amount of dairy manure total nitrogen application to crops?," Drawdown REU Symposium, Nittany Lion Inn.
Publications
Karsten, H. D. (2019). "Managing Double Cropped Winter Annual Small Grains and Corn Silage." PSU Extension online fact sheet. https://extension.psu.edu/managing-double-cropped-winter-annual-small-grains-and-corn-silage
Amin, M.G. M. T. Veith, J. Shortle; H. D. Karsten, and P. J.A. Kleinman. 2019. Addressing the spatial disconnect between national-scale total maximum daily loads and localized land management decisions. J. Environ. Qual. doi.org/10.1002/jeq2.20051
Binder, J., H. D. Karsten, D. B. Beegle, and C. J. Dell. 2020. Manure injection and rye double cropping increase nutrient recovery and forage production. Agronomy J. published online. DOI:10.1002/agj2.20181
Busch, A., Douglas, M., Malcolm, G., Karsten, H. D., & Tooker, J. F. (2020). A high-diversity/IPM cropping system fosters beneficial arthropod populations, limits invertebrate pests, and produces competitive maize yields. Agriculture, Ecosystems and Environment, 292. 15 April 2020, 106812. doi.org/10.1016/j.agee.2019.106812
Jahanzad, E., L. S. Saporito, H.D. Karsten and P. J.A. Kleinman. 2019. Varying Influence of Dairy Manure Injection on Phosphorus Loss in Runoff over Four Years J. Environ. Qual. doi:10.2134/jeq2018.05.0206
Milliron, R.A., H. D. Karsten, and D. B. Beegle. 2019. Influence of Dairy Slurry Manure Application Method, Fall Application-Timing, and Winter Rye Management on Nitrogen Conservation. Agron. J. 111:1–15. doi:10.2134/agronj2017.12.0743
Ranck, E. J, L. A. Holden, K. J. Soder. 2019. Short Communication: Evaluating feed cost, income over feed cost, and the cost of production for milk and crops on 4 case study farms that double cropped winter annual silage and corn silage for 2 years in northern and western Pennsylvania. Applied Animal Science 35:74-82.
Ranck, E. J, L. A. Holden, K. J. Soder, J. A. Dillon, and C. A. Rotz. 2020. (in press) Use of the Integrated Farm System Model to determine economic and environmental impacts of double cropping winter annuals with corn. J. Dairy Sci. (Suppl. 1). 102: 57.
Masters Thesis published:
Cereal rye and manure management to increase nutrient utilization in Pennsylvania dairy farms. Jonathan Binder. May 2019. MS Thesis. The Pennsylvania State University
Diversified low-input cropping systems influence pest populations as well as the potential for environmental. Sarah McTish. May 2019. M.S. Thesis. The Pennsylvania State University
Effects of management on selected soil properties and nitrous oxide fluxes in dairy cropping systems. Emily Ball. May 2019. M.S. Thesis. The Pennsylvania State University
Evaluating integrated weed management tactics to reduce herbicides and control herbicide-resistant weeds. Haleigh Summers. May 2020. M.S. Thesis. The Pennsylvania State University
Managing-double-cropped-winter-annual-small-grains-and-corn-silage.pdf
2018 Publications and Outreach Activities

Presentations and publications
Amin, M. G., H. D. Karsten, T. L. Veith, D. B. Beegle, and P. J. Kleinman. 2018. Conservation dairy farming impact on water quality in a karst watershed in northeastern US. Agricultural Systems. 165: 187-196.https://doi.org/10.1016/j.agsy.2018.06.010
Ball, E. and M. A. Bruns, H. D. Karsten, C. J. Dell. 2018. Soil Nitrous Oxide Fluxes from Typical Crop Rotations Used by Pennsylvania Dairy Producers, Poster presentation at the PSU Sustainable Cropping. Symposium. April 6, 2018, University Park, PA.
Binder, J. and H. D. Karsten, D.Beegle, C. J. Dell. 2018. Agronomic considerations for double-cropping. Oral presentation at the Winter Double-Cropping Producer Meeting. March 28, 2018, State College, PA.
Binder, J. and H. D. Karsten, D.Beegle, C. J. Dell. 2018. Cereal rye management to reduce nutrient pollution from dairy cropping systems. Oral presentation at the ASA, CSSA, CSA Annual Meeting. Nov. 5, 2018. Baltimore, MD.
Binder, J. and H. D. Karsten, D.Beegle, C. J. Dell. 2018. Manure nutrient and cereal rye management for dairy cropping systems. Oral presentation at the Northeast Cover Crops Council Annual Meeting. Nov. 15, 2018, State College, PA.
Castano-Sanchez, J. P., Rotz, C. A. H. D. Karsten. 2018. Elevated atmospheric CO2 effects on dairy crops in the Northeast US: comparing IFSM, Cropsyst and DSSAT models to FACE data. Poster presentation at the ASA, CSSA, CSA Annual Meeting. Nov. 5, 2018. Baltimore, MD.
Colin, A., and H. D. Karsten, C. White. 2018. Using a Decision Support Tool to Predict Nitrogen Requirements for Corn following Cover Crops. Field tour presentation, project advisory board meeting, Nov. 15, 2018, State College, PA.
Colin, A., and H. D. Karsten, C. White. 2018. Validating a Tool for Cover Crop Adjusted Nitrogen Management. Poster presentation at the Northeast Cover Crops Council Annual Meeting. Nov. 15, 2018, State College, PA.
Karsten, H. D., A. Sutradhar, K. Borrelli, G. Malcolm, A. Aschwanden, D. Beegle, W. Curran, C. Dell, R. Hoover, V. Ishler, P. Kleinman, R. Meinen, T. Richards and J. Tooker. 2018. Advancing Sustainable Cropping system for dairy in the Northeast. Poster presentation at Our Farms Our Future Conference, April 14, 2018, St. Louis, MO.
Karsten, H. D., V. Ishler, D.B. Beegle, C.J. Dell, J. Tooker, W.S. Curran, R.J. Hoover, P. Kleinman, and C. White. 2018. 145-3 Conservation Strategies and Closing the Nutrient Cycle Enhance Dairy Farming System Performance. Proceedings of the Annual ASA and CSSA, Nov. 4-7; Baltimore, MD.
Karsten, H. D., J. Binder, V. Ishler, D.B. Beegle, C.J. Dell. Double-cropping Winter and Summer Annuals. Oral presentation at Winter Double-Cropping Producer Meeting. March 28, 2018, State College, PA.
McTish, S. and K. Elkin, H. D. Karsten, J. Tooker. 2018. Neonicotinoids in the environment: A step towards solving the mass-balance equation. Oral presentation at the 2018 ESA, ESC, and ESBC Joint Annual Meeting. Nov. 11, 2018. Vancouver, Canada.
Miller, M.D., H.E. Gall, A.R. Buda, L.S. Saporito, T.L. Veith, C.M. White, C.F. Williams, K.J. Brasier, P.J.A. Kleinman, and J.E. Watson. 2019. Load-discharge relationships reveal the efficacy of manure application practices on phosphorus and total solids losses from agricultural fields. Agric. Ecosyst. Environ. 272: 19–28.
Miller, D. J., J. Chai, F. Guo, C.J. Dell, H.D. Karsten, and M.G. Hastings. 2018. Isotopic composition of in situ soil NOx emissions in manure-fertilized cropland. Geophysical Research Letters, 45, 12,058–12,066. https://doi.org/10.1029/ 2018GL079619
Prasad, R. S., K. Gunn, C. A. Rotz, H. D.Karsten, G. Roth, A. R. Buda, and M. K. Stoner. 2018. Projected climate and agronomic implications for corn production in the Northeastern United States. PLOSone https://doi.org/10.1371/journal.pone.0198623
Summers, H., W. Curran, H. D. Karsten. 2018. Long-Term Effects of Reduced Herbicide Management in a No-Till Dairy Cropping System. Poster presentation at the PSU Sustainable Cropping Systems Symposium. April 6, 2018. University Park, PA.
Summers, H. and H. D. Karsten. 2018. Weed Control in a Diverse Cropping System. Poster presentation at the Penn State University Cover Crop/Reduced Tillage Field Day. May 17, 2018. Rock Springs, PA.
Summers, H. and H. D. Karsten. 2018. Effects of Integrated Weed Management and Reduced Herbicide. Poster presentation at the NESARE DCSP Field Day. July 16, 2018. Rock Springs, PA.
Summers, H., W. Curran, H. D. Karsten. 2018. Long-Term Effects of Reduced Herbicide Management in a No-Till Dairy Cropping System. Poster presentation at the ASA, CSSA 2018 International Annual Meeting. November 6, 2018. Baltimore, MD.
2017 Publications and Outreach Activities
Continuing Education Credit programs for PA Act 49 Manure Hauler and Broker Certification Program presented by team member Robert Meinen that highlighted the NESARE Sustainable Cropping Systems Project, the nutrient management benefits, and practical lessons about manure injection
|
DATE |
LOCATION |
Attend |
|
|
1 |
2/6/17 |
Chambersburg |
38 |
|
2 |
2/14/17 |
Somerset |
14 |
|
3 |
2/15/17 |
Dushore |
9 |
|
4 |
2/20/17 |
Lancaster |
55 |
|
5 |
2/28/17 |
Lebanon |
41 |
|
6 |
3/1/17 |
Selinsgrove |
40 |
|
7 |
3/3/17 |
Mercer |
6 |
|
Totals |
203 |
Posters presented and publications
Ball E, Bhowmik A, Cloutier M, Dell C, Karsten H, Bruns MA. Soil redox potential and carbon fractions in manured and cover-cropped soils under reduced tillage. Soil Biology and Biochemistry Poster 313-1233, Soil Science Society of America Annual Meeting, Oct 24, 2017, Tampa, FL.
Ball E, Bhowmik A, Cloutier M, Karsten H, Bruns MA. Soil Redox Potential in Manured and Cover-Cropped Soils Under Reduced Tillage. Poster Presentation at 7th Annual PSU Sustainable Cropping Systems Symposium, Sustainable Cropping Systems for Water Quality, March 31, 2017, Penn State University, University Park.
Binder, J. and H. D. Karsten, D.Beegle, C. Dell. 2017. Assessing double-cropped winter rye silage after corn silage: environmental and on-farm benefits. Northeast Cover Crops Council Annual Meeting. Nov. 8-9, 2017, Ithaca, NY.
Bhowmik, A., Cloutier, M., Ball, E., Bruns, M.A. 2017. Underexplored microbial metabolisms for enhanced nutrient cycling in agricultural soils. AIMS Microbiology. 3:826-845
Bhowmik A, Bruns MA, Karsten H, Dell C. Greenhouse Gas Trade-offs in Climate-Adaptive Agriculture: Fate of Nitrogen Cycling Associated with Soil Carbon Banking. Poster Presentation at 7th Annual PSU Sustainable Cropping Systems Symposium, Sustainable Cropping Systems for Water Quality, March 31, 2017, Penn State University, University Park.
Bruns, M. V., Dell, C. J., Karsten, H. D., Bhowmik, A., Regan, J. M. "Nitrogen Cycling Considerations for Low-Disturbance, High-Carbon Soil Management in Climate-Adaptive Agriculture," AGU (American Geophysical Union) Fall Meeting 11-15, Dec., New Orleans, LA.
Karsten, H. D. and Project Team members. Closing the Loop with Diverse Cropping Systems. Cropping Systems Symposium, The Pennsylvania State University. March 31, 2017.
McTish, S., Tooker, J. F. and H.D. Karsten, "Quantifying neonicotinoid runoff from agricultural fields into nearby aquatic systems," Entomology Society of America Nov. 5-8, Denver, CO.
Williamson, J., Karsten, H. D., Soder, K. "Integrating Ruminant Livestock and Cropping Systems: Strategies to Balance Agricultural Productivity and Environmental Quality for Sustainable Intensification," ASA, CSA, SSSA Annual Meeting. Oct. 22-25, Tampa, FL, published in proceedings, Invited.
Learning Outcomes
Benefits of maintaining live plant cover with cover, double crops and perennial crops for soil health; Improving nutrient management with legumes and injecting manure and the benefits of manure injection; Using cover crops to manage nitrogen availability; Utilizing fall manure and double cropping to retain manure nutrients and increase total forage production; Management practices for double-cropping small grain silage and corn silage for increased profitability; Integrated weed management: Using crop rotation, planting green, and early control tactics for weed control; Managing insect pests with predators; Integrated pest management for slugs and insect pest management, Managing cover crops and no-till; Integrating green manures into a wheat, green manure, corn silage rotation, Dairy feed quality and cost management for nutrient management and profitability.
Project Outcomes
Over the 10 years of this project, 18 graduate students conducted their research within this project and 33 undergraduate students benefited from agricultural research training and experience. The majority of the graduate students continued their graduate students or are working as cooperative extension educators or agricultural consultants in multiple states. The majority of undergraduate students also work in agriculture or the environmental sciences either through full-time positions or continued studies in graduate school. In addition to learning about how agricultural research is conducted, students learned about the many disciplinary topics, conservation cropping systems, dairy farms, and gained an understanding of ecology and agricultural sciences can promote beneficial processes and interactions in agroecosystems. The scientific and educational value of this research has been recognized by the USDA ARS and the project will continue with some modifications and with funding from the National ARS LTAR network in partnership with Penn State University.
Future research should explore:
Additional strategies to reduce reliance on herbicides in no-till systems including occasional tillage. In addition to eliminating an herbicide application to terminate the previous crop, occasional tillage also reduced slug damage to subsequent winter canola and improved canola plant establishment (highlighted in phases 1 and 2, reports LNE09-291 and LNE13-329). This research suggests that integrating perennial legume and grass forage crops into an annual crop rotation was particularly effective at rebuilding multiple soil health indicators within the conservation cropping system. The perennial forages also provided additional benefits such as interrupting summer annual weed lifecycles. Additional research could evaluate tactics and the impact of integrating perennial crops compared to cover crops and double crops with no-till and conservation tillage to rebuild soil health indicators.
Opportunities to promote adoption of shallow-disk manure injection. Additional research should explore the use of a drag hose to shorten manure injection application time and reduce the risk of soil compaction associated with manure application, as well as side-dressing liquid slurry manure to improve crop nutrient utilization, conserve manure nutrients and reduce potential nitrogen losses.
Continue to examine multiple indicators of cropping systems performance and identify opportunities to improve cropping systems for multiple benefits such as crop yield and quality, nutrient cycling, soil health, weeds, pest and pest predator and beneficial population dynamics, energetics, greenhouse gas emissions, whole farm economic performance.
Information Products
- Poster: Advancing sustainable cropping systems for dairy in the Northeast (Conference/Presentation Material)