Final report for GNC16-222
Project Information
The soybean cyst nematode (SCN), Heterodera glycines, is consistently the top yield suppressing pathogen in soybean (Glycine max) production throughout the United States. Management of SCN has been largely dependent on the use of host resistance. Although there are at least seven sources of SCN resistance available through plant introductions (PI) in the soybean germplasm, there is one source of resistance that dominates the commercially available soybean cultivars with SCN resistance. In 2018, 95% of the commercially available soybean cultivars with SCN-resistance contain genes derived from PI88788 in Iowa (Tylka and Mullaney, 2018). As a result of the prolonged a single source of SCN resistance in commercial soybean cultivars, an increase in SCN reproduction has been observed on cultivars with resistance derived from PI88788 (McCarville et al. 2017; Howland et al. 2018).
With SCN management becoming more challenging, there is a growing interest in alternative methods through which to mitigate the pest problem. There have been a few published and unpublished studies that have piqued interest among farmers, agronomists, and seed dealers about whether cover crops have an additional benefit of reducing SCN population densities. However, the results from these studies have been inconsistent or have yielded data that were less than robust. It has been difficult to draw broad conclusions on cover crop effects on SCN population densities based on this past research. With the use of cover crops on the rise, and an interest from seed dealers in marketing their cover crop seed for nematode control, a new series of scientifically rigorous studies could help farmers know whether cover crops can be used to help with the growing SCN problem.
The focus of this project was to conduct experiments on a wide range-of-scale using cover crop cultivars that are marketed for nematode suppression or reduction with the goal of providing reliable information to farmers seeking alternative management methods for SCN. The first series of experiments was conducted in highly controlled greenhouse and growth chamber settings. This was the best way to see if, when barring any additional external factors and keeping the sampling error to a minimum, cover crops can impact SCN population densities or have any residual effects on SCN reproduction on soybean roots. The second experiment was conducted on a slightly larger scale, with larger pot sizes and accounting for the effect of winter-killed cover crops on SCN population densities and residual effects on SCN reproduction. Additionally, small-plot cover crop experiments were established in north central Iowa at the Iowa State University (ISU) Northern Research Farm (NRF) in Kanawha, Iowa and in southeastern Iowa at the ISU Muscatine Island Research farm in Fruitland, Iowa. There were two fields per location, designated by their grain crop rotation starting in 2016, including soybean-corn and corn-soybean. The cover crop treatments were applied to the same plots each year as way to observe if multiple years of the same cover crop could have additional effects on SCN population densities.
In the first greenhouse experiment, the SCN population densities decreased for every cover crop treatment as well as the non-planted soil and tomato (non-cover crop, nonhost) controls over the 60-day growing period. The variable used to estimate the change in population density (population change factor, PCF = initial population density ÷ final population density) ranged from 0.41 to 0.81. (Any number less than 1.00 indicates a decrease in SCN population density over the sampling interval). When the mean SCN population density decreases for the cover crop treatments were compared to the non-planted soil control, there were no significant differences. Although there were no significant decreases in SCN population densities as a result of cover crop growth when compared to the non-planted soil control, it is important to note that there were no cover crop treatments that increased the SCN population density. When the leftover soil from the 60-day experiment was used to grow SCN-susceptible soybean cultivar Williams 82 for 30 days, there were significant differences in the number of SCN females that developed on the soybean roots following different cover crop treatments. There were significantly fewer SCN females found on soybean plants grown following six cover crop treatments and the tomato control compared to the number of SCN females that developed on soybean roots grown following the non-panted soil control. This could be indicative of a negative residual effect of cover crops on SCN reproduction.
In the larger-scale greenhouse experiment, the decrease in SCN population density over time was not as evident. The PCF in this study varied from 0.76 to 1.05. Like the last experiment, there were no population density decreases because of cover crop growth that were significantly greater than the decrease observed in the non-planted soil control. In the subsequent soybean bioassay to observe how SCN develops on soybean roots grown in soil following cover crops, there were significantly fewer SCN females that developed on soybeans grown following six cover crop treatments and the tomato control compared to on soybeans grown following the non-planted control. However, not all six cover crop treatments that had reduced SCN development on soybean were the same as the six cover crop treatments observed in the previous study.
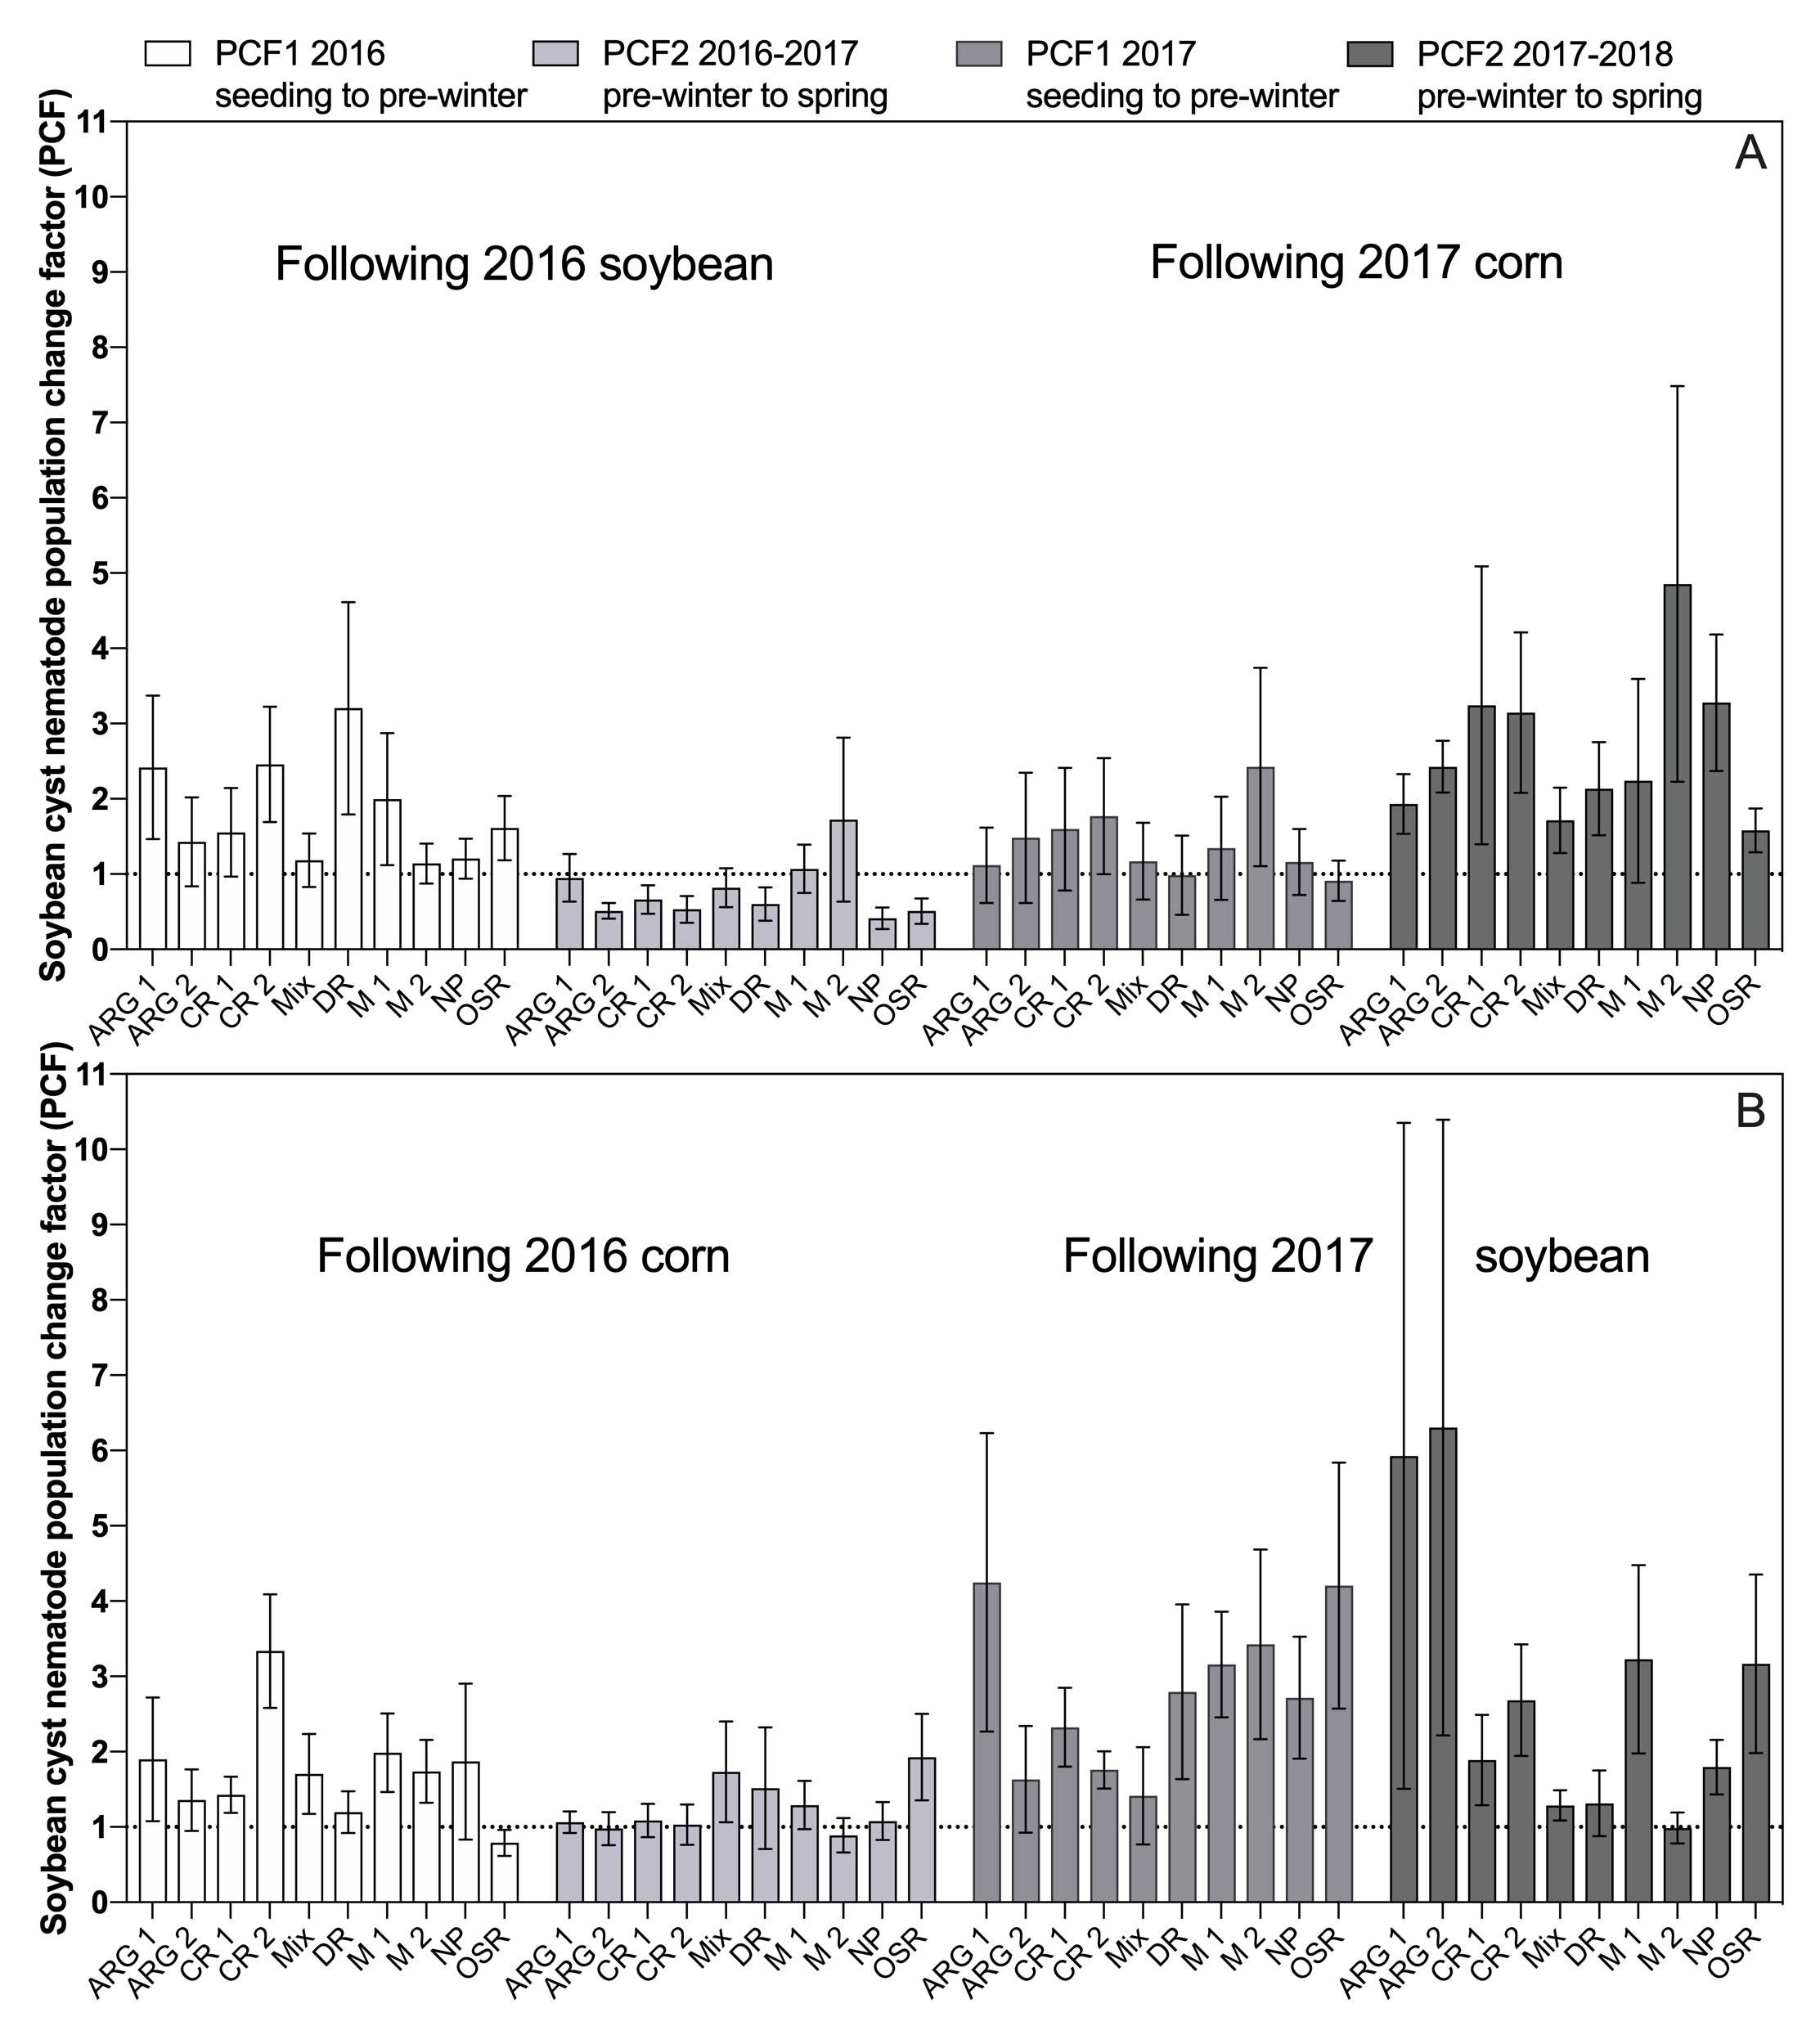
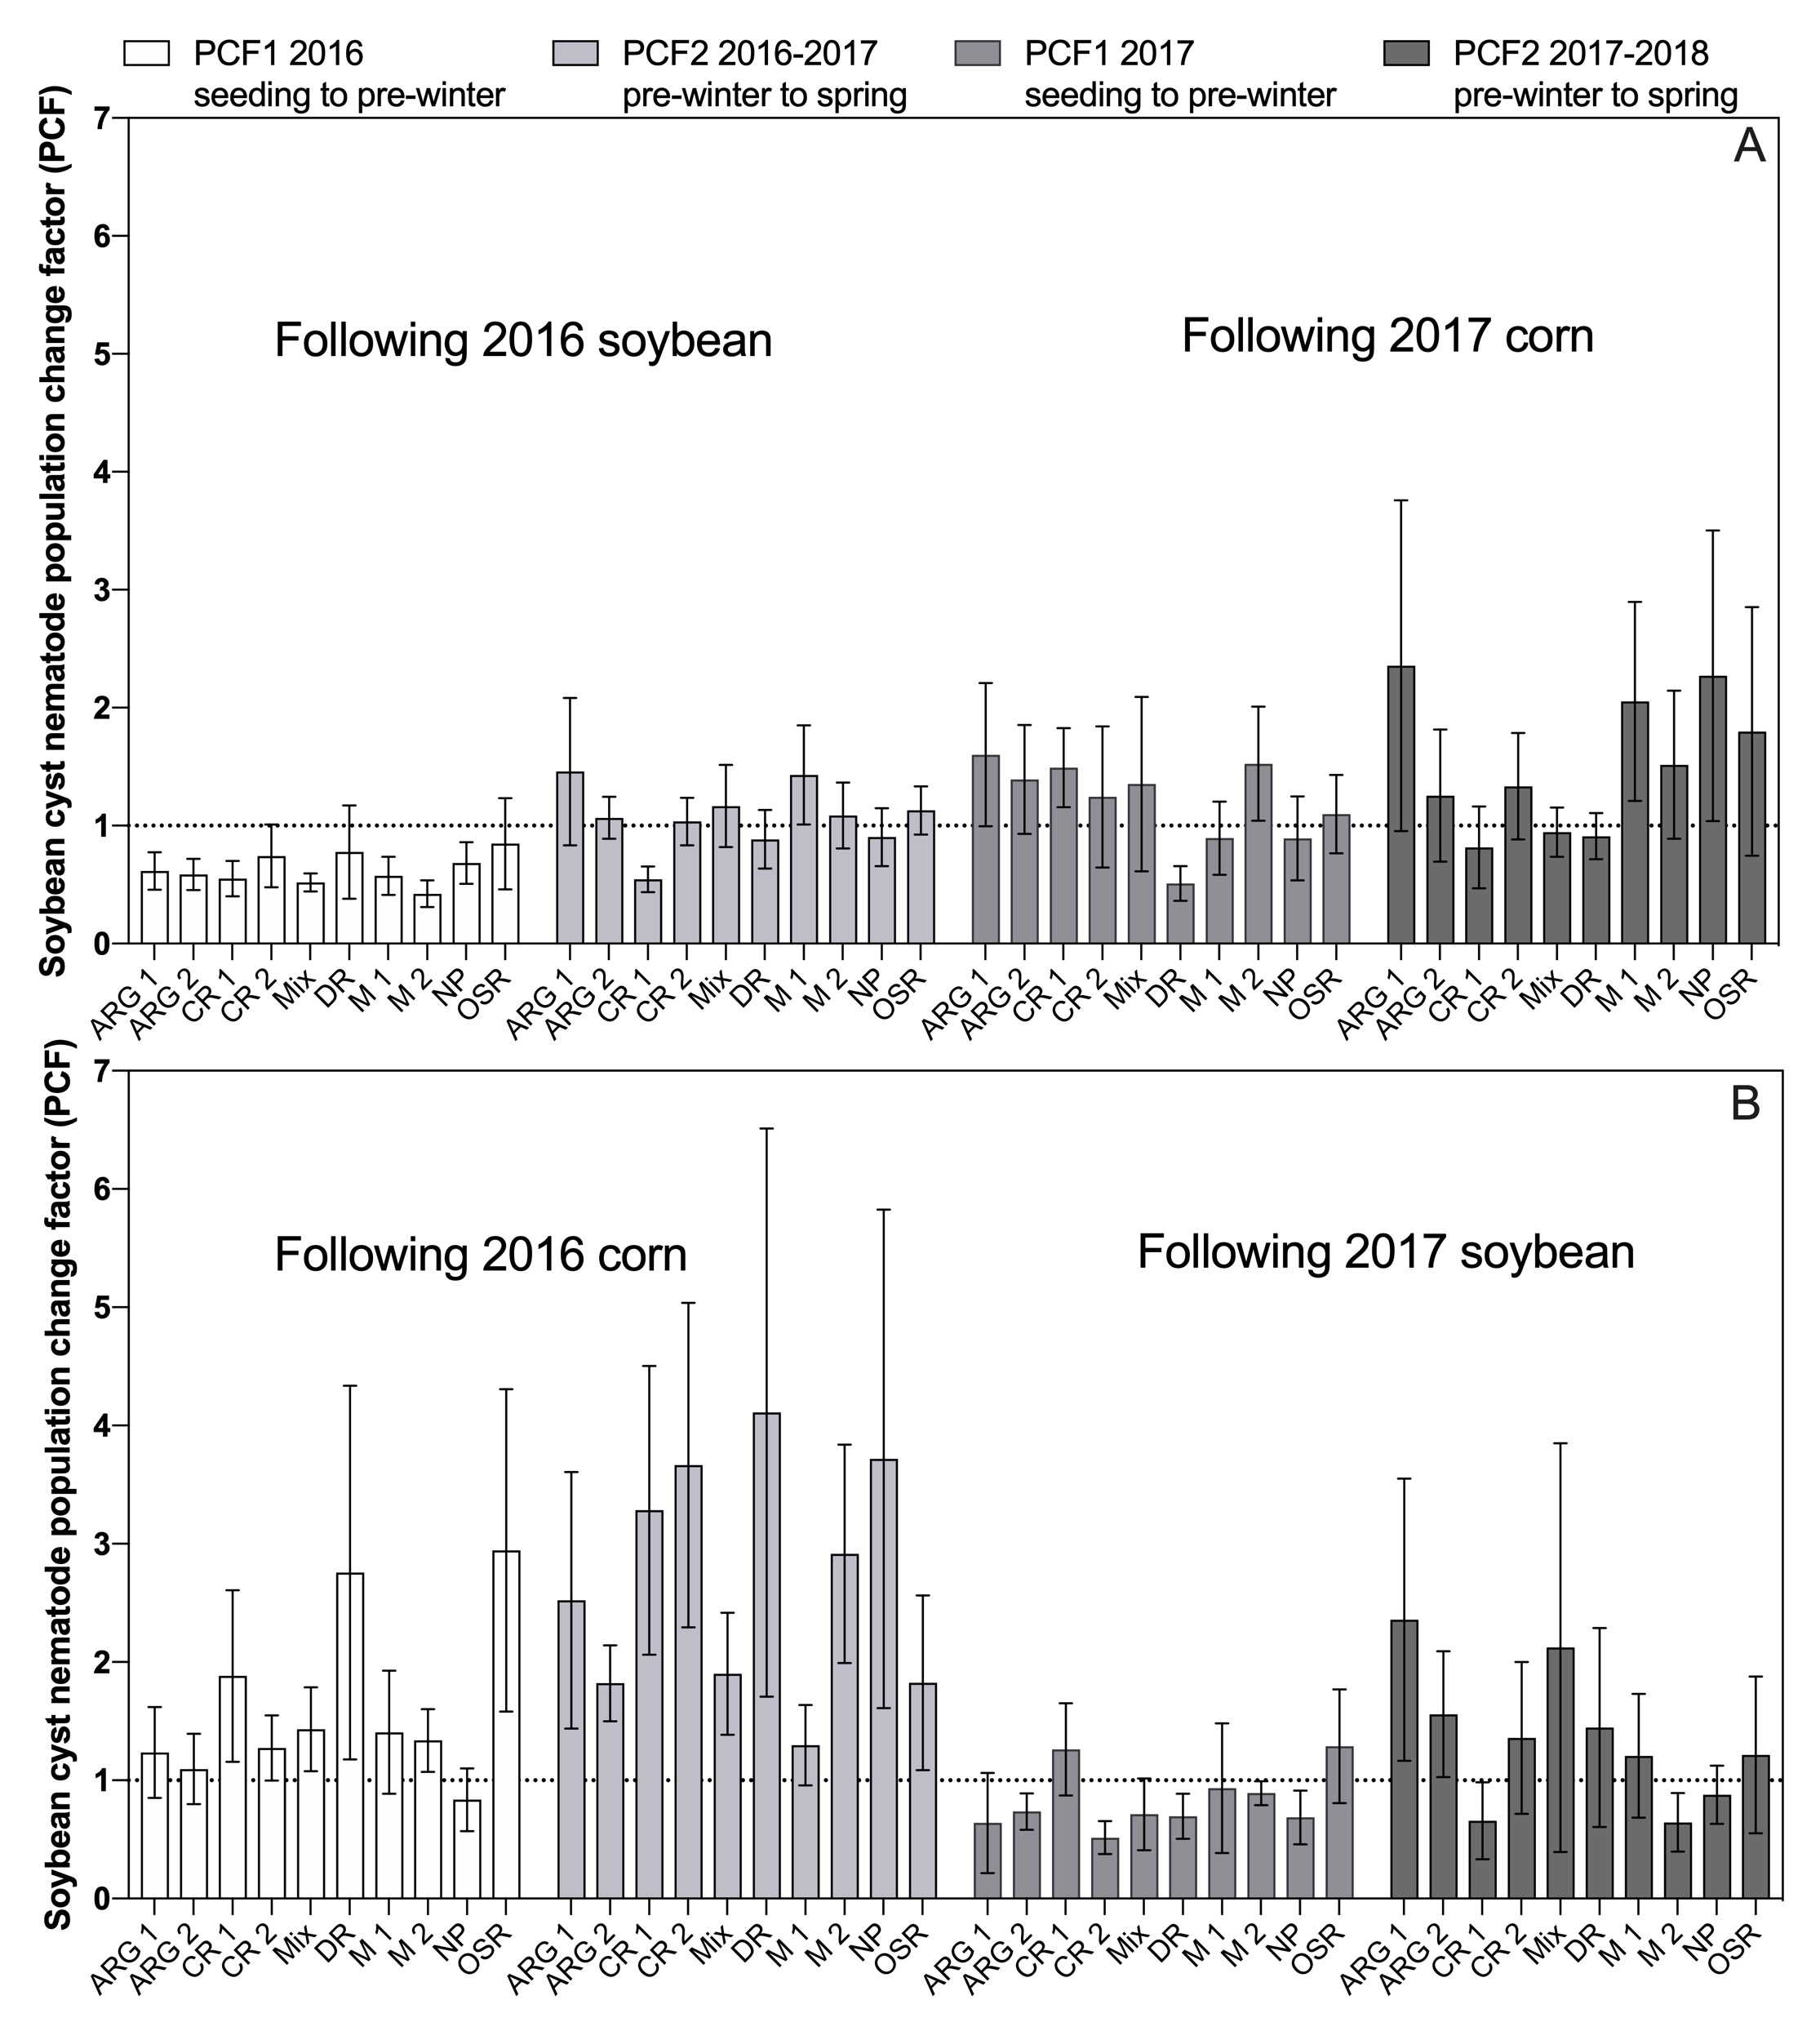
In the small plot experiments, there were two PCF for each year, consisting of PCF1 (population density at cover crop seeding ÷ pre-winter population density) and PCF2 (pre-winter population density ÷ spring population density). The PCF1 for both experiments, locations, and years ranged from 0.42 to 4.11 and the PCF2 ranged from 0.41 to 6.30. There were no significant differences detected in t-tests that were conducted to determine if PCF in cover crop plots were larger or smaller than the PCF from the non-planted soil plots. It is possible that the spatial variability of SCN population densities was too large despite efforts to sample from the same area (the center two grain crop rows) in each plot. The high spatial variability likely affected our sampling error and ability to detect differences or observe consistent PCF changes in these experiments.
Throughout all of our experiments, there were no significant impacts on SCN population density as a result of cover crop treatment when compared to the non-planted control. Despite this, it is worth noting that the SCN population densities did decrease in cover crop treatments overall, specifically in greenhouse experiments. We know that the cover crop treatments used in these experiments do not support SCN reproduction, and it is encouraging to see that there was no increase in SCN population density due to cover crop treatments. It is fair to say that although cover crops may not significantly reduce SCN population densities, there could be an adverse residual effect on SCN reproduction following some cover crop cultivars. This effect needs to be examined further and in a more-applied field experimental setting. Cover crops should continually be used for their known agronomic benefits; however, they should not be used for SCN management based on the results from these studies.
Description
With increasing implementation of cover crops in the Midwest accompanied by the ever-persistent problem of the soybean cyst nematode (SCN), there is much interest in, speculation about, and even some unsubstantiated claims made about cover crops affecting SCN population densities. The goal of this project is to determine if and how cover crops can affect SCN population densities and if cover crops have potential as an IPM tool for SCN management.
Outcomes
Results from this research will answer the question to which many soybean farmers, crop consultants, and seed companies do not have an answer: Can cover crops reduce the population densities of the soybean cyst nematode (SCN)? There is increasing interest about cover crops among soybean farmers, including whether they can reduce SCN population densities in the soil, yet there are almost no scientific data on the topic. With this research, I intend to not only answer the baseline question of “do cover crops affect SCN populations in the soil?”, I plan to dig deeper into the potential relationship of cover crops and SCN. In addition to field experiments, greenhouse experiments will be conducted to investigate multiple possible modes of SCN suppression that can occur as a result of interactions with cover crops: potential as a biofumigant, trap crop, or hatch-inducing non-host cover crops. Results will be shared in presentations and written publications for both the scientific community and the soybean-producer and crop consultant communities. Ultimately, this research will determine if cover crops can be utilized as an integrated pest management (IPM) approach for SCN, adding to the other benefits of using cover crops in corn-soybean rotations.
Outputs
The expected outputs of this research will be new research-based information on effects of cover crops on SCN population densities in the Midwest. Results will be published in various outlets including, but not limited to, extension newsletters and refereed scientific journals. The results will also be shared with farmers, extension agents, industry personnel, scientists and whomever else may attend or be interested in local, regional, or nationwide extension or scientific society meetings. NCR-SARE will be acknowledged for its support anytime results are presented orally or in print. Results from this study will help shape the way farmers perceive the utility of cover crops beyond their soil-saving and nutrient-scavenging abilities because: (1) methods for managing SCN are losing efficacy; (2) there is lack of scientific data on the effect of various cover crop species on SCN in the soil; and (3) determination of the effects of cover crops on SCN will help farmers decide if they can use specific species of cover crops as another method of SCN management.
Cooperators
- (Researcher)
- (Researcher)
Research
Strip trials
Initial soil samples were collected from all potential strip trial fields by the Iowa Soybean Association On-Farm Network® in the fall of 2016. A subset of soil samples from each of these fields were processed to estimate the SCN population densities within each field and to aid in selection process. After processing, two Iowa fields (northeastern and central Iowa) and one Illinois field were selected for inclusion in the cover crop SCN strip trial experiments.
On-farm collaborators drill cover crops in the fall following corn or soybean harvest as replicated strip trials. Fields have three strips with 8 to 20 rows per strip. Strips can be 305-460 m long, depending on the field. The farmer collaborators receive their cover crop mix (either a cereal rye and radish mix or a cereal rye, radish, crimson clover mix) in the fall from the Iowa Soybean Association and will drill the cover crop seed following the harvest of their cash crop. In addition to the initial soil samples, I collected soil samples from each field in the spring of 2017 and fall of 2017 to determine SCN population densities. There are two paired GPS-identified locations within each strip to collect the soil samples from the same area within a field.
Small-plot studies
Small-plot experiments were established at two Iowa State University (ISU) research farms: near Kanawha (north central Iowa) and Muscatine (southeast Iowa). There are two three-year experiments at each location: one initially planted with soybean, rotating to corn and then back to soy, and one initially planted with corn, rotating to soybean and then corn. Over the three years, the plots in these experiments will remain in the same locations to monitor effects of cover crops on SCN population densities over time, following a typical corn-soybean rotation. The cover crop species included in these studies were two annual ryegrass cultivars, two cereal rye cultivars, two radish cultivars (one oilseed and one daikon-type), two mustard cultivars, a bare soil control, and the same cover crop mix used in the strip trials.
Cover crops are hand-seeded using a fertilizer spreader at appropriate rates into standing corn/soybeans planted in 5.2 x 3 m plots, to simulate aerial seeding in the fall. ISU’s research farm in Muscatine has irrigation capabilities, which allows for watering after seeding, ensuring sufficient cover crop establishment.
These small-plot experiments have six replications of each treatment. Soil will be sampled for SCN at three times each year: in the fall on the same day as cover crop seeding, after crop harvest but before the soil freezes (pre-winter), and in the spring before planting of corn and soybean but after cover crop termination.
Soil samples consist of 10 soil cores collected from each of the center two rows in each plot. These soil samples are dried and crushed before processing to extract SCN cysts from a 100-cc subsample of homogenized soil from each plot. Cysts are extracted using an automated wet-sieving extraction machine. Eggs are extracted from cysts for quantification by crushing the cysts and catching eggs on a 25-µm-pore sieve. The number of eggs per sample is an estimate of the population density at the time of collection.
Percent change factors (PCF) were calculated for each sampling interval, where PCF 1 = population density at cover crop seeding ÷ pre-winter population density and PCF 2 = pre-winter population density ÷ spring population density. Data were analyzed using an analysis of variance (ANOVA) and a series of t-tests to determine if there were differences in cover crop treatments compared to the non-planted soil control plots.
Short-term effects of cover crops on SCN population densities
The first run of this experiment was conducted as a 2 x 14 factorial with two lengths of growth and 14 different cover crop treatments. The two growth period lengths were 30 days and 60 days. This was achieved by staggering the plantings 30 days apart.
The soil used in this experiment was a mix of naturally SCN-infested soil, construction sand, and field soil with the target starting population density of 5,000 SCN eggs/100cc of soil. An initial sample of at least 100cc of soil was collected while filling each experimental unit (600cc) and processed to determine the initial population density (Pi) of that experimental unit. Seeds were sown into the soil except for the fallow control. The other control treatments were susceptible soybean and a non-cover crop, non-host tomato. The plants were grown in a controlled environment for their corresponding 30 and 60 days, after which another soil sample was collected from each experimental unit to determine the final population density (Pf).
These data were analyzed by calculating the PCF for each experimental unit as Pi ÷ Pf. An ANOVA of PCF was used to determine if there were differences among treatments. Subsequently, a series of t-tests to compare the PCF in cover crop treatments to the PCF of the non-planted soil control were performed to determine if any cover crop treatment impacted PCF beyond that of the non-planted control.
After a soil sample was collected at the end of the experiment from each experimental unit, 125cc of soil remaining in each experimental unit was transferred to a 125cc capacity cone-tainer.
Seeds of the susceptible soybean cultivar Williams 82 were sown in these cone-tainers and grown for 30 days to determine ability of SCN to reproduce on soybean grown in soil following the cover crop treatments and controls. At the end of this experiment, soybean roots were removed from the soil and SCN females were removed from the roots using a high-pressure water spray and counted. The number of SCN females per soybean root was recorded for each experimental unit.
Long-term effects of cover crops on SCN population densities

To assess the effects of cover crops on SCN population densities in a more “natural” scenario with the use of a larger volume of soil and using similar environmental conditions to what cover crops would experience in the fall and winter in Iowa, this experiment used a similar soil mix as described above to fill 4,725cc capacity square pots (15 cm x 15 cm x 20 cm). An initial soil sample from each experimental unit of at least 100cc was used to determine the Pi of the soil in each pot. In the fall, the cover crops were sown into the soil and placed in a growth chamber with a 12-hour photoperiod, 27ºC day 18ºC night temperature regime to simulate the environmental conditions at the time of cover crop seeding. Pots were watered every two to three days as needed but care was taken not to saturate the soil. The plants grew for eight weeks, after which the pots were moved outside to endure the same winter conditions that cover crops would encounter in agriculture fields. After four weeks of sitting outside, the pots were moved into the greenhouse for final processing, including collecting a 100cc sample of soil to determine Pf for each pot. An additional 125cc of soil was transferred to a 125cc-capacity cone-tainer and the susceptible soybean cultivar was sown into each pot and grown for a 30-day bioassay as described above. SCN females were collected from soybean roots and counted as previously described.
This experiment was conducted in two experimental runs over multiple years. Data were analyzed as described above.
Treatments
The following table outlines the treatments included in these studies. Not all treatments occurred in each study. This table is provided as a reference for the reporting of the results.
Table 1. The cover crop species and cultivars included in experiments.

a CCS779 was previously sold as Tillage® radish by Cover Crop Solutions. The cultivar is now sold by Smith Seed Services but is no longer sold under the trademarked name.
b There are no cultivars listed for the species in this mix.
c Cultivars in Soil Buster mix were Bounty annual ryegrass and Enricher radish. Cultivars in Synergist mix were Bounty annual ryegrass and Dwarf Essex rapeseed.
Results
Short-term effects of cover crops on SCN population densities
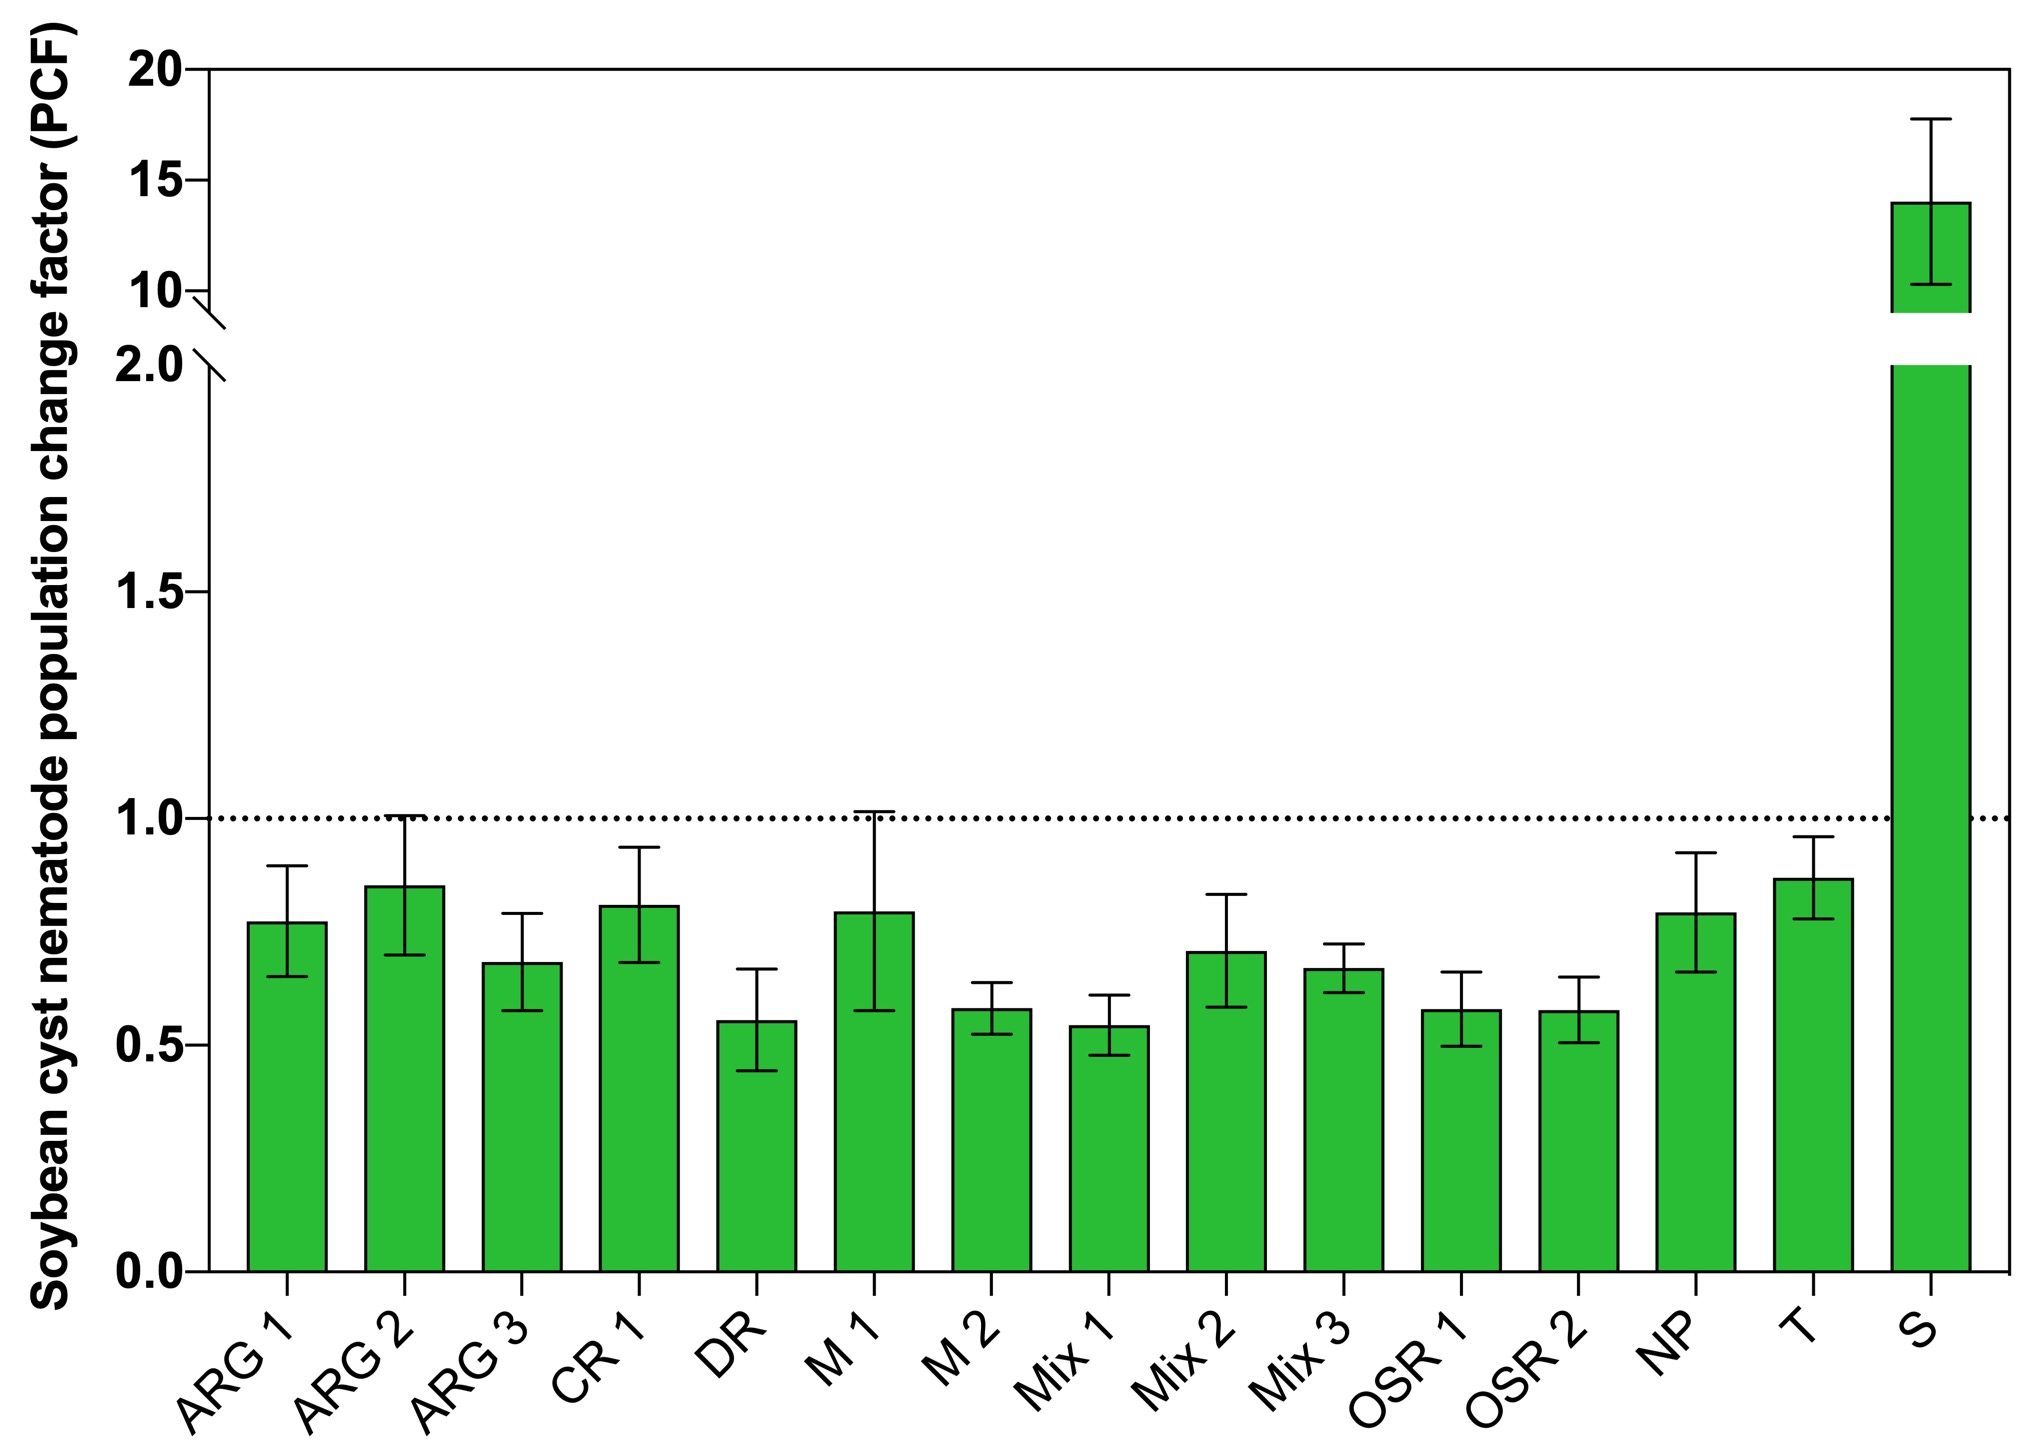
The analysis of the Pf/Pi ratio can provide an insight into the potential for cover crops to directly decrease SCN population densities in the soil. The PCF indicated a decrease in SCN population density for all cover crop treatments as well as the non-planted and tomato controls, ranging from 0.41 to 0.81 (Fig. 1). The PCF in the soybean control increased nearly fourteen-fold (Fig. 1) and was not included in subsequent analyses. The analysis of variance (ANOVA) indicated that there was no significant difference in PCF means among cover crop treatments or the non-planted or tomato control (P > 0.05). Additionally, t-tests revealed that no cover crop PCF was significantly different from the PCF of the non-planted soil control.
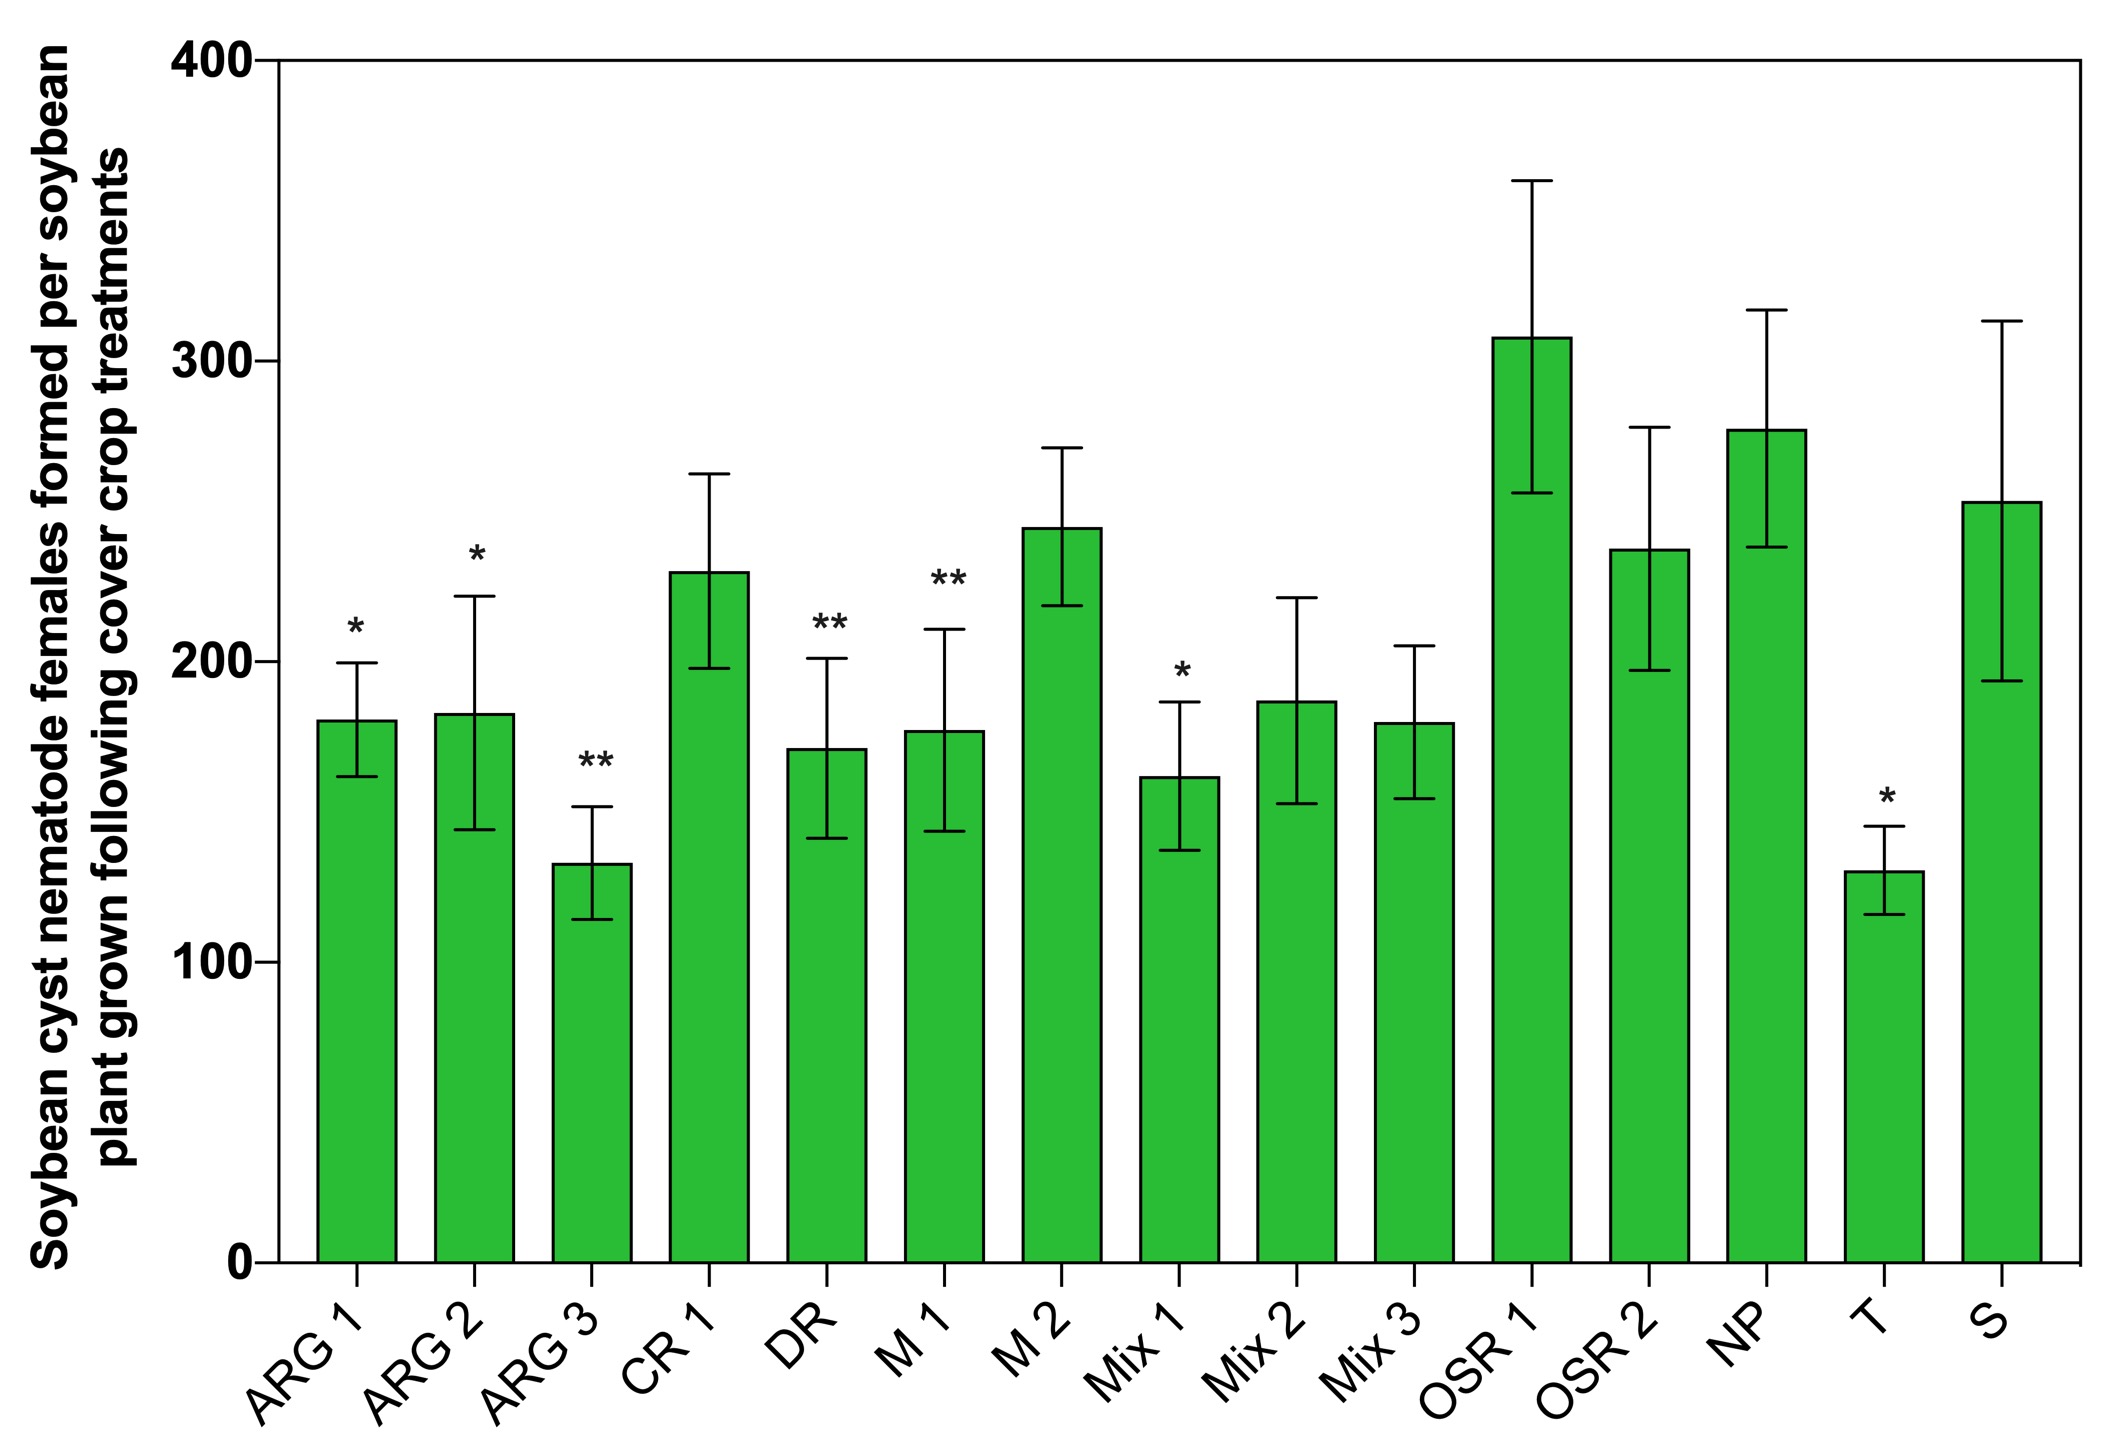
The mean number of SCN females that were found per soybean root grown in soil following the 60 days of cover crop growth were not the same among treatments (Fig. 2). The range of SCN females per soybean root was 130 to 308. The mean number of SCN females per soybean root for each treatment was compared to the number found on soybean roots grown following the non-planted (NP) soil control. There were significantly fewer SCN females found on soybean plants grown following six cover crop treatments and the tomato control compared to the number of SCN females that developed on soybean roots grown following the non-planted control (Fig. 2).
Long-term effects of cover crops on SCN population densities
After a 56-day growing period followed by 28 days of exposure to winter conditions in Iowa, the PCF among treatments in these experiments ranged from 0.76 to 1.05 (Fig. 3). There were no significant differences in PCF among treatments in this study (P > 0.05). Additionally, t-tests revealed that no cover crop treatment had a PCF that was significantly less than the PCF of the non-planted control.

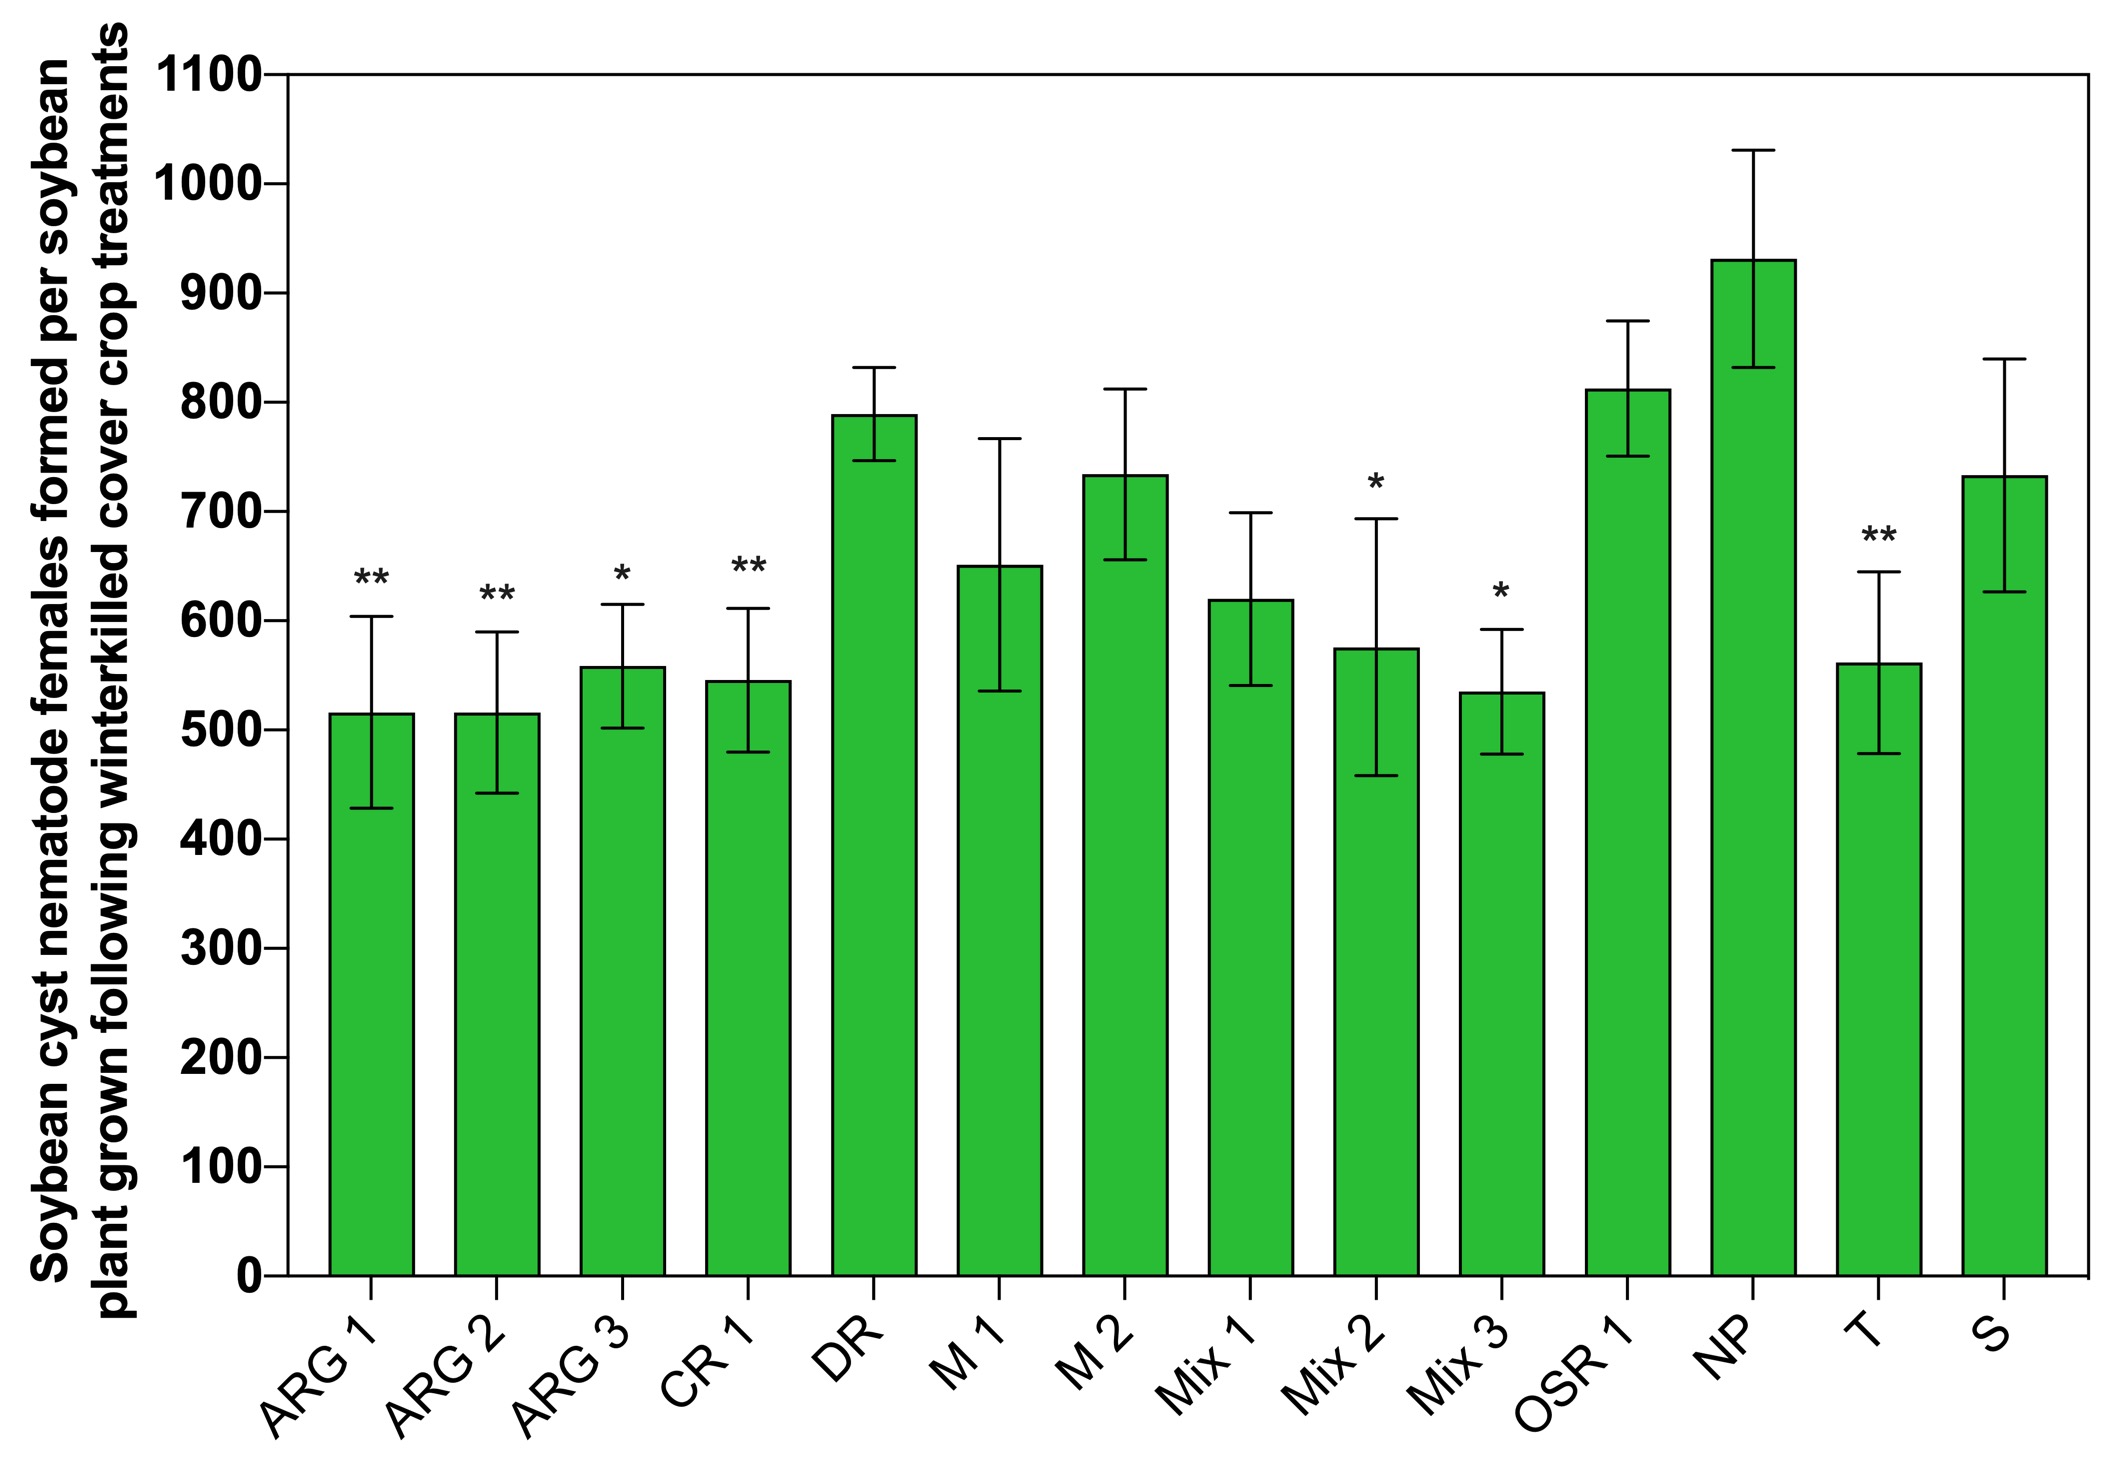
The mean number of SCN females that were found per soybean root grown in soil following the 56 days of cover crop growth and 28 days of winter weather exposure were not the same among treatments (Fig. 4). The number of SCN females developed per soybean root ranged from 516 to 812 in this experiment. Significantly fewer SCN females developed on soybean plants grown following six cover crop treatments and the tomato control compared to the number of SCN females that developed on soybean roots grown following the non-planted control (Fig. 2).
Small plot experiments
An ANOVA revealed no significant differences among treatments in altering SCN population density between sampling dates (data not shown). The PCF for the interval between cover crop seeding to pre-winter (PCF1, Figs. 5 and 6) ranged from 0.42 to 4.11. For the period from pre-winter to spring (PCF2, Figs. 5 and 6) ranged from 0.41 to 6.30. There was a trend of PCF having higher values in the experiments conducted at the Muscatine Island Resarch Farm (MIRF) in Fruitland, Iowa (Fig. 6) than experiments conducted at the Northern Research Farm (NRF) in Kanawha, Iowa (Fig. 5). However, the ranges in PCF were somewhat similar and overlapped.
There were no significant differences (P > 0.05) detected in the t-tests conducted to assess if PCF in cover crop treatment plots were larger or smaller than the PCF from the non-planted soil plots (Figs. 5 and 6). However, the standard error of the mean for PCF varied greatly, ranging from 0.11 to 6.26 (Figs. 5 and 6). Of all 160 treatment means over both locations, years, and PCF, 58 percent of the smallest standard error of the mean estimates occurred in treatments from the MIRF experiments (data not shown). Of the forty largest standard error of the mean estimates for PCF, 65 percent occurred at the NRF (data not shown).
Discussion
In the greenhouse experiments, there were consistently observed decreases in SCN population densities as a result of cover crop treatments. However, none of the decreases in SCN population densities were significantly different from the non-planted soil control. Although there were no significant differences, it is notable that there were no increases in SCN population densities. We can be certain that the treatments used in these studies may be used as a cover crop without fear of increasing SCN population densities. It is possible that the difference in volume of the experimental units used in the 60-day experiment versus the 56-day + 28-day experiment affected the observed decreases in SCN population densities. Having a larger volume of soil may impact the spatial variability of the nematode and thus, increase the sampling error and ability to observe differences as a result of treatment application.
In the bioassays following both experiments, there were some soybean plants grown following cover crop treatments that had significantly fewer SCN females develop compared to the number found on soybeans grown in the non-planted control. This is indicative of a possible residual effect of cover crops on SCN reproduction. There were a total of nine treatments across both experiments that had a negative residual effect. This effect should be further examined with more cover crop treatments as well as in field-based studies.
The small-plot studies showed no consistent or significant reductions in SCN population densities as a result of cover crop growth for any sampling interval, rotation, location, or year. The numerical increases in SCN population density are likely not due to SCN reproduction on the cover crops in the plots because research has shown that there is little to no development of SCN females on the cover crop treatments used in these experiments. Rather, it is likely that the observed increases in SCN population density are a result of sampling error association with the natural variability in the spatial distribution of SCN throughout a field and even within a plot.
Educational & Outreach Activities
Participation Summary:
Field day presentation
This was a field day presentation for the Muscatine Island Research and Demonstration Farm in Fruitland, Iowa in August of 2018 entitled “Interaction between soybean cyst nematodes and cover crops.” In this presentation, I shared preliminary data from one year of small plot experiments generalized to the species level. There was a total of 10 people in attendance for this field day presentation.
Iowa State University Research Farm Reports 2018
I co-authored research farm reports for the Muscatine Island Research and Demonstration Farm (Fruitland, IA) and Northern Research and Demonstration Farm (Kanawha, IA). These reports are intended as useful information for farmers in the area that have similar soil or growing conditions.
ICM Blog Post:
This blog post was written to fulfill requirements for a student travel scholarship to the national Integrated Pest Management Symposium in March of 2018. It was an overview of how cover crops can impact SCN that was geared towards letting farmers know where we currently stand on the topic. Thus, while not a part of my grant proposal, it was directly related to the work in my grant and some of the work was briefly mentioned in the post.
Webinar:
I was asked to give a webinar on “Cover crops and pest management: the good and the bad” by Dr. Daren Mueller for the Agronomy Society of America. This webinar was not directly related to my grant, but I mentioned the work that I am doing for my grant and encouraged attendees to follow me on social media to see what I am up to in my research. A total of 428 people registered for the webinar. I am unaware of what number of those were farmers/ranchers versus agricultural professionals.
Project Outcomes
My project may contribute to future sustainability if I find that some cover crops can reduce or suppress SCN population densities in the soil beyond that of a non-host crop. If such an effect occurs reliably, we can recommend that specific cover crops be included as part of an integrated pest management tool for SCN, which would mean that cover crops have additional benefits in agricultural systems besides the known agronomic benefits. If my project shows that there is no impact of cover crops on SCN population densities, this will encourage the use of cover crops for the conservation benefits without the fear of increasing SCN population densities in the soil.
My knowledge has improved having read more about cover crops as a sustainable agriculture approach; however, my attitude has remained the same. I am and have always been in favor of implementing practices that can improve the sustainability of agricultural systems, especially cover crops. My advisor’s awareness and knowledge of sustainable agricultural practices continues to increase by learning about the benefits of cover crops as being involved in my project.
Information Products
- What’s the real deal with soybean cyst nematodes and cover crops? (Article/Newsletter/Blog)