Final report for GNC21-320
Project Information
Effects of depth and cover crop treatment on the functioning and diversity of soil microbial communities
Global agriculture continues to be strained by the unpredictable effects of climate change, including flooding, drought, erosion, and decreases in soil fertility. To counter these changes, global agricultural systems must develop new techniques while promoting sustainable intensification practices. Cover crops can provide farmers with an off-season cash crop, while also positively impacting the soil and reducing reliance on less sustainable conventional farming practices.
The objective of this research is to evaluate the impact of different cover crops on soil microbial communities at varying depths. Cover crops have the potential to facilitate nutrient cycling, increase soil organic matter and nitrogen fixation, maintain topsoil, and improve weed control, but basic questions regarding cover crop effects on the soil microbial community so integral to these responses remain to be answered. Depth is an important factor in evaluating the effectiveness of a cover crop to build soil organic carbon. Traditional sampling methods homogenize the top 6 inches of soil, which often does not show significant changes in organic carbon year to year. I propose to conduct community-level physiological profiling (CLPP) at three depths to test the hypothesis that cover crop type and soil depth are strong determinants of microbial community diversity and functioning in an agricultural field. I predict: (a) that the physiological profile of the microbial community, as measured by the rate and ability to metabolize a variety of carbon sources, will change across depths and differ between cover crop types, and (b) that the overall functional diversity of the microbial community will be greater under cover crop treatment than without.
This project will inform local farmers on the benefits of cover crops to the overall health of their soils and productivity of their crops. Greater adoption of cover crops and more sustainable stewardship of our croplands will be encouraged through conversations with central Illinois farmers at Illinois State University farm days. Additionally, this research will be presented at a national meeting and the findings will be presented in a peer-reviewed publication. Undergraduate students will help with field collection and analysis of samples. This will offer an avenue to explore new techniques that are not part of the curriculum and give these biology students the opportunity to work across disciplines with researchers from the Agriculture Department and local farmers.
The proposed research will answer basic questions about plant-microbial interactions in soils through the examination of a managed system. This research will contribute to a larger body of knowledge about the relationship between plants and soil microbes and their effects on our croplands. Additionally, this research will be presented at a national meeting and the findings will be presented in a peer-reviewed publication. Undergraduate students will help with field collection and analysis of samples. This will offer an avenue to develop new skills and learn techniques that are not part of the curriculum and give these students the opportunity to work across disciplines with researchers from the Agriculture Department and local farmers.
Community outreach will be performed through farm days at the Illinois State University Farm. These events bring in local farmers to hear about research being conducted at the University Farm. These events will give me a unique opportunity to gain the perspective of the people who will be directly impacted by my research and to foster a positive relationship between researchers and farmers. Through conversations with local farmers, I will explain what my study means for their practices, how the choice of cover crops could affect the overall health of their soils, and how certain over crops can also provide added income. These activities will encourage greater adoption of cover crops in central Illinois farmlands. The knowledge gained through this project will complement ongoing projects at ISU, which together will demonstrate the value of cover crops.
Research
**Included methods are from a draft thesis to be defended in October 2022
2.1 Study area description and field sampling
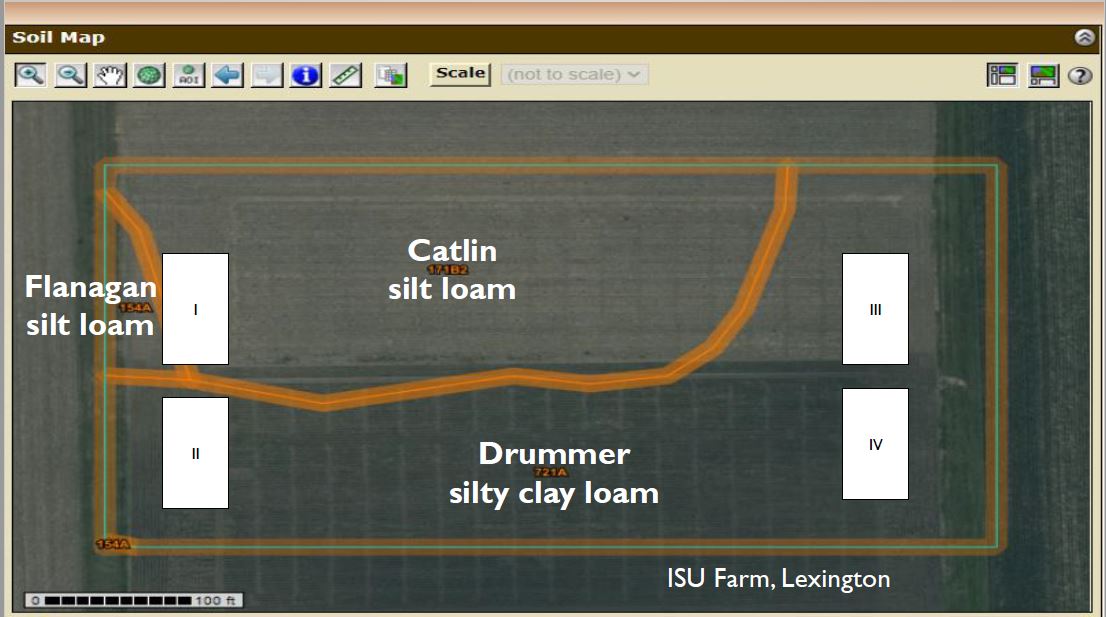
Soils were sampled from an ongoing experiment at the Illinois State University Research Farm in Lexington, IL (McLean County; 40.674641, -88.783492) that was established in the fall of 2020 to investigate carbon sequestration by cover crops. A randomized block design was used with four blocks (Figure 1), each containing four plots: (1) a fallow control plot; (2) a pea, clover, radish, and oat mix (ProHarvest™, 56 kg/ha); (3) wild-type pennycress (11.2 kg/ha); and (4) cereal rye (65 kg/ha). Blocks I, II, and III were located on a Drummer and El Paso silty clay loam soil series with a 0-2 percent slope, and Block II was located on a Catlin silt loam soil series with a 2-5 percent slope (USDA Web Soil Survey). Historically, the plots had been part of a corn-soy rotation under conventional tillage. The plots were converted to no-tillage in 2019 and cover crops were first grown in the fall of 2020. Plots were fertilized preceding corn being planted in Spring 2020. Plots were sampled in the fall of 2021 following soy in all plots (November 2021) and the spring of 2022 after the cover crops had established (May 2022).
Vegetative growth varied visibly among cover crops and fields in the spring. To better interpret potential significant effects, the percentage of soil covered by vegetation was measured with the app Canopeo™ in a 15 cm x 15 cm square centered over the point of sampling. Using sterile technique, three soil cores were collected per plot. Six depth sections were collected from each core: 0-2 cm, 2-4 cm, 4-6 cm, 13-15 cm, 28-30 cm, and 43-45 cm and pooled by depth. Samples were kept on ice until processed in the lab within six hours.
2.2 Soil microbial analyses
Biolog EcoPlates™ were used to evaluate the functional diversity of the soil microbial community. EcoPlate is a community-level profiling tool with which the investigator can quantify microbial community functional diversity. EcoPlate utilizes 31 different carbon sources and a redox dye indictor in order to indicate microbial activity. The 31 carbon sources can be categorized into six functional groups: polymers, carbohydrates, carboxylic acids, amino acids, amines, and phenolic compounds. Each 96-well microplate contains the 31 carbon sources and control wells in triplicate to ensure sufficient replication. The community-level physiological profile obtained from the EcoPlates involves three main components: the rate of color development, the richness and evenness of the response among wells, and the pattern of utilization among wells (Gryta et al., 2014). These three components can be used to compare different soil microbial communities.
10 g of each homogenized soil sample was blended and diluted with to a final concentration of 1:100. The EcoPlates were inoculated with 120 µL of the diluted sample and incubated at 25°C. The optical density (OD590) of the wells was measured using a multilabel plate reader at 24, 48, 72, 96, and 120-hour time intervals (Gryta et al., 2014). The remaining portion of each soil sample was dried at 60°C for 48 hours and the soil moisture was calculated.
2.3 Data analysis
The data analysis was generated using SAS™ 9.4 software (Copyright (c) 2002-2012 by SAS Institute Inc., Cary, NC, USA). Using the optical densities, I calculated the average well color development (AWCD), Shannon diversity (H’), evenness, and richness using the methods outlined in Garland (1997). To determine which of the five days of plate development would yield the clearest differences in these responses I conducted a preliminary MANOVA with day of development as a repeated measure and AWCD as the response variable.
Using PROC MIXED with depth as a repeated measure, crop as a fixed effect, and block as a random effect I examined how these factors affected several measures of diversity. In each analysis, Akaike information criterion was used to select among a linear or quadratic model, with and without an interaction of the continuous variable (depth) and crop. In all cases, a linear model without interaction was selected. I first calculated richness, evenness, and Shannon diversity using the AWCD as the raw data. To better understand variation in the pattern of carbon usage, the average development for the 31 carbon sources was synthesized into fewer axes using a principal components analysis (PCA). Principal components with eigenvalues >1 were analyzed with a mixed model to test the effects of cover crop and depth on community composition (Lagerlöf et al., 2014). Then I analyzed the average well color development of each of the six functional groups as response variables to determine how the microbial community under different cover crops and at different depths used available carbon. Soil moisture was initially included as a covariate in the analyses of diversity but subsequently removed due to lack of a significant effect. I analyzed % moisture to determine whether cover crops affected soil moisture and how % moisture changes across depths.
Literature Cited
Gryta, A., Frąc, M., Oszust, K., 2014. The Application of the Biolog EcoPlate Approach in Ecotoxicological Evaluation of Dairy Sewage Sludge. Appl. Biochem. Biotechnol. 174, 1434–1443. https://doi.org/10.1007/s12010-014-1131-8
Lagerlöf, J., Adolfsson, L., Börjesson, G., Ehlers, K., Vinyoles, G.P., Sundh, I., 2014. Land-use intensification and agroforestry in the Kenyan highland: Impacts on soil microbial community composition and functional capacity. Appl. Soil Ecol. 82, 93–99. https://doi.org/10.1016/j.apsoil.2014.05.015
**Included results and discussion are from a draft thesis to be defended in October 2022
3. Results
3.1 Fall 2021
In the fall, all experimental plots contained soybeans at full maturity (stage R8) at the time of sampling. The average soil moisture across all experimental plots was 21% (Figure 2a). Across sampling depths soil moisture steeply declined from 0-13 cm (F1,78 = 7.82, p = 0.0065, slope = -0.0006±0.0002). Soil moisture did not differ among cover crop treatments (F3,9 = 0.69, p = 0.5820; Figure 2b).
The average well color development (AWCD) increased over the 5-day incubation period. Preliminary analysis of AWCD indicated the largest difference occurred between days 3 and 4 and so day 4 readings were used for all subsequent analyses.
The number of carbon sources metabolized by the microbial community declined with depth (F1,79 = 54.35, p < 0.0001, slope = -0.2646±0.03589). On average, 80% of the 31 carbon sources were metabolized at the soil surface and this average declined to half of the sources used at 43 cm (Figure 3a ). While richness changed with depth it did not differ among cover crop treatments (F3,9 = 0.62, p = 0.6169; Table 1). Evenness (the similarity in color development among wells) also declined with depth (F1,79 = 39.24, p < 0.0001, slope = -0.00257±0.000410; Figure 3c) but did not differ among cover crop treatments (F3,9 = 0.69, p = 0.5792; Table 1). Because these two components of diversity exhibited trends for depth but not cover crop, a single measure of diversity, Shannon’s H, also declined with depth (F1,79 = 44.57, p < 0.0001; Figure 3e). Thus, as depth increased, there were fewer carbon sources being metabolized, more variation in the degree of metabolism, and diminished functional diversity.
The first three principal components (PC) from analysis of the EcoPlate™ AWCD explained 74.8% of the variation in the microbial metabolism of the 31 carbon sources. Inspection of factor loadings shows high correlation among carbon sources (Supplementary Table 1). Most of the carbon sources loaded on PC 1 and PC 2, with 11 loading heavily on both factors (Table 2). PC 2 was strongly and positively correlated with carbohydrates and polymers, and Factor 3 was positively correlated with carboxylic acids (Table 2). Analysis of the factors revealed that the cover crop planted the previous season significantly affected both PC 2 (F3,9 = 4.00, p = 0.0460) and PC 3 (F3,9 = 8.28, p = 0.0059). Control plots scored high for PC 2 and low for PC 3, whereas pennycress plots scored low for PC 2 and high for PC 3 (Figure 4a). This indicates that soil in the control plots included a greater density or diversity of microbes capable of metabolizing a range of carbohydrates and polymers compared to soil from pennycress plots (t3,9 = 3.41, p = 0.0325; Figure 4a). Whereas pennycress plots (t3,9 = -4.63, p = 0.0056) and mixed cover crop plots (t3,9 = -3.72, p = 0.0203) metabolized a greater amount of carboxylic acids than did control plots. While the control and pennycress tended to separate out, the cereal rye and the mixed species cover crop clustered together (Figure 4a), indicating more balanced metabolism of carbon sources. Sampling depth had a significant impact on PC 1 (F1,79 = 25.46, p < 0.0001, slope = -0.026+0.005), PC 2 (F1,79 = 24.78, p < 0.0001, slope = -0.028+0.006), and PC 3 (F1,79 = 4.17, p = 0.0445, slope = -0.012+0.006 As depth increased, values for all PCs declined.
A closer look at how the metabolism of each functional group of carbon source changed across depths and among cover crop treatments showed that usage of all functional groups declined significantly with increasing depth (Figure 5, Table 4). Across all depths, the trend was that phenolic compounds were least utilized, and at shallower depths that polymers were the most utilized. Beyond depths of 13 cm there were less differences in the utilization of each functional group. The most differences in functional group usage were observed from the surface to 4 cm. The cover crop planted the previous season did not have a significant effect on the pattern of functional group usage (Table 3).
3.2 Spring 2022
Cover varied among cover crops in the spring and was more heterogeneous than observed for soy in the fall. Because the goal of this research was to identify effects of cover crops on soil microbes, I deliberately chose areas of the experimental plots in the spring where coverage was highest and haphazardly sampled within those areas. Cereal rye provided the greatest coverage (83.5%), followed by pennycress (54.8%) and mixed (48.4%). Control plots had the least amount of plant coverage (4.04%). There was overall poor establishment of mixed cover crop experimental plots. At the time of sampling these plots contained mostly radishes, with few peas, clover, or oats. Control plots contained a mix of weeds, with high overall plot coverage and I sampled locations in control plots that had little plant material. The average soil moisture across all plots in the spring was 15% (Figure 2a). Similar to the fall, soil moisture steeply declined from 0-13 cm (F1,78 = 10.82, p = 0.0015 Control plots had greater soil moisture than cover crop plots (F3,9 = 8.43, p = 0.0056) (Figure 2b).
As with the fall, AWCD increased over the 5-day incubation period. Preliminary analysis of AWCD indicated the largest difference occurred between days 2 and 3, and no difference was found between days 3 and 4. Day 3 readings were used for subsequent analyses in the spring.
The number of carbon sources metabolized by the microbial community (richness) declined with depth (F1,79 = 116.15, p < 0.0001, slope = -0.2279±0.02115; Figure 3b). On average, 74% of the 31 carbon sources were metabolized at the soil surface and this declined to 30% of the sources used at 43 cm. Richness did not differ among cover crop treatments (F3,9 = 0.43, p = 0.7349; Table 1). Evenness declined with depth, indicating that the community is becoming more variable as depth increases and some microbes are becoming more abundant than others (F1,79 = 71.85, p < 0.0001, slope = -0.00177±0.000209; Figure 2d. Evenness did not differ among cover crop treatments (F3,9 = 1.36, p = 0.3149; Table 1). Shannon diversity also declined with depth (F1,79 = 113.36, p < 0.0001; Figure 2f). These results mirrored those seen in the fall, demonstrating that as I move through the soil profile, measures of diversity (evenness and richness) decline.
The first three principal components from analysis of the EcoPlate™ output explained 62.3% of the variation in the microbial metabolism of the 31 carbon sources. As in the fall, all functional groups loaded heavily on PC 1 (Table 2; Supplementary Table 1). PC 2 was dominated by carbohydrates, and PC 3 had all functional groups represented except for amino acids (Table 2). Analysis of the factors revealed that the cover crop present in the spring significantly affected PC 2 (F3,9 = 4.16, p = 0.0418). Cereal rye plots scored high in PC 3 and low in PC 2 (Figure 4b). This indicates that soil in the cereal rye plots included a greater density or diversity of microbes capable of metabolizing a range of carbohydrates compared to soil from mixed cover crop plots (t3,9 = -3.04, p = 0.0565). Cereal rye tended to separate out, while all other treatments and the control clustered together (Figure 4b). Sampling depth had a significant impact on PC 1 (F1,79 = 108.43, p < 0.0001; slope = -0.0433±0.0042), PC 2 (F1,79 = 5.93, p = 0.0171; slope = -0.0146±0.006), and PC 3 (F1,79 = 5.39, p = 0.0228; slope = -0.0139±0.006) with a decline in metabolism of carbon sources with depth. As seen in the fall, as depth increased, values for all PCs declines.
Usage of all functional groups decreased across depth (Figure 6, Table 4). Similar to the fall, the trend was that phenolic compounds were least utilized across all depths, but in the spring they were utilized more by cereal rye than by the other treatments and the control group (F3,9 = 7.78, p = 0.0072; Table 3). At shallower depths, amino acids and carboxylic acids tended to be greater utilized. The usage of carbohydrates was also greater at the surface than at all other depths.
- Discussion
The aim of this study was to investigate how the ability of sampled microbes to metabolize 31 types of carbon as a measure of community function changes across depths and among different cover crop treatments using community level physiological profiling with BIOLOG EcoPlates ™. Because plant root growth adds carbon and affects rhizosphere properties, I postulated that soil depth as well as the presence and type of cover crop would significantly affect the soil microbial community. I found a consistent trend in regard to depth that accorded with predictions whereas trends associated with cover crop treatment were equivocal.
For all measures of the soil microbial community, microbial activity declined linearly with soil depth and distance from . Microbes sampled near the surface metabolized nearly all of the carbon sources. Variation in the degree of metabolism of these carbon sources was also lower near the surface. However, even within the top 15 cm of the soil profile that is normally homogenized for soil analysis, the trend in reduced activity with depth was evident in metabolism of all carbon sources. As sampling continued deeper into the soil profile, fewer carbon sources were metabolized and the variation in degree of metabolism increased. Both the number of carbon sources used and the evenness in use contribute to diversity as reflected in the Shannon diversity index, which declined as I sampled deeper through the soil profile and further outside of the rhizosphere. This relationship between depth and functional diversity is likely due to the decline in resource availability and reduction in carbon quality that occurs farther outside the rhizosphere (Fierera et al., 2002). At the surface more crop residues are available for microbes to decompose, and in the top of the soil profile greater plant root growth provides root exudates to nourish the microbial community (Rankoth et al., 2019).
As predicted, the functional groups metabolized by the microbial community also changed across depths. While the overall metabolism of all functional groups decreased across depth, there were also shifts in which groups were most utilized. Closer to the soil surface, these differences among functional groups metabolized by soil microbes were more apparent. In the fall, polymers were the most utilized substrate group closer to the soil surface. Biolog EcoPlates™ contain four polymers: . Trends in the impact of the cover crops on the soil microbial community were less clear. In the fall, the cover crop planted the previous season significantly affected PC 2 and PC 3. This indicates that the cover crop planted the previous season has some lasting effects on the microbial community, even after the soy cash crop grew through the following summer. However in the spring, the cover crop planted only had a significant effect on PC 2. This is likely due to the poor establishment and delayed germination observed.
In the analysis of spring samples, I found the microbial community metabolized fewer carbon sources and had greater variance in their use, resulting in lower diversity. The six functional groups were also utilized to different extents in the fall and the spring, with shifts in which groups were most commonly metabolized at each depth increment. In both the fall and the spring, though, phenolic compounds were the least metabolized. While samples were collected and processed at different times and are thus not directly comparable, trends can still be noted. The principal components analysis revealed a different pattern in the trend of carbon source metabolism in the fall and the spring . EcoPlate™ output explained less variation in the microbial metabolism of the 31 carbon sources in the spring than in the fall (74.8% and 62.3%, respectively). In the fall, pennycress and control plots tended to separate out, with cereal rye and mixed cover clustered together. In the spring, though, cereal rye separated out with all other treatments clustered together. One explanation is that there may be a seasonal component contributing to changes in the microbial community. Other studies have shown that seasonal variation, such as precipitation and temperature fluctuations, can impact the activity of the soil microbial community (Hamel et al., 2006). Additionally, the amount of available carbon changes throughout the growing season, with less being available when there is less vegetative cover at the soil surface (Kaiser and Heinemeyer, 1993).
The trend I observed with depth was consistent across seasons, but the trend for crop was not. In the fall, I observed more differences in diversity measures between experimental plots, despite all plots having soybeans planted most recently on them. In the spring, the diversity measures were more consistent across experimental plots, despite significant differences in the amount of plant coverage. This seems to indicate that better establishment of the cover crop (like in the case of cereal rye) does not necessarily lead to increases in measures of diversity. Control plots had similar diversity measures to treatment plots. This seems to indicate that the diversity of live plants may be equally important to successful establishment when it comes to microbial diversity. Control plots contained a wide variety of weeds present throughout the spring, and often had vegetation present before the germination of some cover crops (mixed cover treatment). This may indicate that with better establishment, a mixed cover crop treatment can positively impact soil microbial diversity. The results that I observed in the spring are likely due to a combination of factors: soil moisture was much lower in the spring than in the fall, and plant coverage was lower and more variable in the spring than in the fall. Cover crop establishment was incredibly variable in the spring, with cereal rye having the most successful establishment and the mixed cover crop having the least success.
Previous studies have shown EcoPlates™ to be an effective method for examining changes in the soil microbial community in agroecosystems (Bonanomi et al., 2020; Gomez et al., 2006; Zhou et al., 2008). EcoPlate™ studies can provide support for further work using molecular techniques that can provide more detailed information about the structure of the microbial community. Microbial biomass and bacteria:fungi ratios provided by molecular techniques, like PLFA and EL-FAME, can be useful at determining the impact of cover crops on the microbial community. As a culture method, EcoPlates™ cannot capture the full extent of what is happening in the soil. Cover crops may be impacting total microbial biomass, but not the overall functional diversity or species diversity of the microbial community (Frasier et al., 2016). Additionally, EcoPlates™ only contain 31 carbon sources, which may not capture all those able to be metabolized by a microbial community.
Educational & Outreach Activities
Participation Summary:
I attended three cover crop field days (one hosted by Illinois State University and two hosted by the Illinois Farm Bureau) that included educational talks from researchers, other professionals, and farmers. The field days also included demonstrations of cover crops and agricultural technology and tours of research sites. At each field day I gave a short presentation (approximately 15 minutes) and answered questions. I also conducted surveys at each field day to gauge farmers' knowledge and attitudes towards cover crops. Across the three field days I received 70 responses to the survey. I developed an educational fact sheet to distribute at the field days and also distributed SARE educational materials (provided by extension educator Doug Gucker). My participation in these field days resulted in two online articles published by FarmWeek Now. One of these articles was also included in the print version of FarmWeek. FarmWeek has a statewide circulation of 72,000 and is sent to all members of the Illinois Farm Bureau's congressional delegation and state constitution officers, as well as, agriculture-related state and federal agencies in Illinois. An additional online article and video about my research were published by Illinois State University.
I presented a poster for my research at the Illinois State Academy of Science's annual meeting and the Illinois State University Research Symposium. I also gave five oral presentations of my research at both internal research symposiums and seminars and symposiums at other universities. I have two additional talks scheduled for September and October 2022 at this time.
I will defend my Master's thesis in October 2022 and intend to publish the results of my study in the Journal of Applied Soil Ecology.
Three article features include:
- (Article/Newsletter/Blog)
- (Article/Newsletter/Blog)
- (Article/Newsletter/Blog)
Project Outcomes
My project investigated how the sustainable practice of planting cover crops influences soil microbial communities. The results of my project provide support for the use of cover crops as a practice that can benefit the overall health of agricultural soils. Through my conversations with farmers, I was able to discuss my findings and encourage the use of cover crops on their farms. At the three field days held throughout the course of this project, myself as well as other ag professionals and educators spoke about how the emerging cover crop CoverCress can be economically beneficial to farmers, and how other cover crops can reduce their fertilizer inputs and potentially increase yields in the long term. We also spoke with farmers about how planting cover crops can help meet the goals of the Illinois Nutrient Loss Reduction Strategy by preventing nutrient runoff and erosion. I discussed how cover crops help build soil organic matter, increase microbial diversity, and overall have a positive impact on the environment. Finally, I discussed how planting cover crops here in Illinois ultimately benefits not only the farmers' own land, but also other states throughout the Mississippi watershed and those bordering the Gulf of Mexico.
Over the course of this project I learned invaluable information about the practical implementation of cover crops. Prior to this project I was not aware of many of the difficulties that farmers face when trying to introduce cover crops to their land management practices. This knowledge has changed the way I talk to farmers about my research and how I present this research to colleagues who may not know much about agriculture. My advisor gained a lot of knowledge about farming practices, sustainable agriculture, and cover crops. Before this project, my advisor did not have much experience in agricultural systems. Through this project she was able to apply ecological theory to a managed agricultural system.
After seeing the article published in the newspaper FarmWeek about my research, a farmer from McLean County, IL reached out to me through the ISU Biology Department to further discuss my work and his own experiences with cover crops. He told me about some of the struggles he had with implementing them on his farm and asked for my suggestions about which cover crops would be best for improving the health of his soils. He also indicated that he would like to participate in future research at ISU and is currently in contact with one of my advisors about participating in his carbon sequestration study.
Information Products
- Cover crop informational flyer (Fact Sheet)
- ISU GradBird Scholar Video (Multimedia)
- Video: Cover Crops and Microbial Communities with Emily Hansen (Multimedia)