Final report for GW20-215
Project Information
Weedy and invasive plant species are one of the major causes of yield losses in agricultural systems (Flessner et al. 2019, Soltani et al. 2016, Soltani et al. 2017, Soltani et al. 2018, WERA-77). The arid Western US is lacking in cover crop research and the development of best management practices for weed suppression utilizing cover crops and integrated strategies. Producers have identified this need for understanding the competitive ability of cover crops against weeds, including most effective seeding rates and timing, and their incorporation into an integrated approach for Western US cropping systems (Cann et al. 2019). In this proposed two-year study, we will identify the types of cover crops and best-integrated strategies for the use of these practices in the Western US. Types of cover crops will be tested within different cropping systems using a range of management approaches. Integrated weed management tactics of seeding dates, rates, and cover crop types will be tested in an irrigated wheat system for suppressing weeds, specifically Kochia scoparia. We will measure cover crops competition with weeds and cash crops and also examine their potential future weed threat. The outcome of these studies will be the identification of cover crops best suited for practical use alone and in integrated weed management in the Western US. Results will be disseminated through fact sheets, educational meetings, the development of a regional cover crop selection tool, and partial budgets accounting for these practices. Surveys and interviews will be conducted to discern the likelihood of practice adoption.
The objectives are to 1) test cover crops types in terms of weed suppression, cash crop interference, and potential weediness and identify their optimum planting date in small grains crops and 2) identify optimal seeding rates for cover crops that can be used in an IWM approach in wheat.
For both objectives the following methods were used:
The determination of the cover crops with the greatest efficacy in weed suppression in arid regions of the Western US was measured through percent cover and biomass comparisons. The density and composition of weed species were measured once monthly across the growing period (May-July) each year by taking percent cover measurements. At the time of cash crop harvest (August), shoot growth from the plots was collected for biomass comparison. This was repeated a month later for comparison of post-harvest competitive suppression due to cover crop-weed interaction.
These metrics have also been applied to the cash crop to show any influence on cash crop development. Additionally, cash crop yield data has been calculated each year from the biomass samples taken. This has allowed for the identification of any cover crop influence on crop yield.
Objective 1
2020
- August: Establishment of plots across all participating farms, the exact date depends on producers. Harvest data collection.
- September: Monthly data collection or harvest data collection
- October-November: monthly data collection or harvest data collection; if previously harvested then post-harvest biomass collection; data processing
- December: data processing
2021
- January- February: data analysis; posters and brochure production, drafts of publications and fact sheets
- March-May: Establishment of plots across all participating farms, exact date dependent on the crop. Monthly sampling in later months at any early planted plots.
- June- July: monthly sampling
- August- September: monthly data collection or harvest data collection
- October- December: harvest and post-harvest data collection depending on the crop; data processing
2022
- January- February: data analysis; educational material production
- March-May: field survey for germination
- June- August: finalize work on selection tool and partial budgets and publications
Objective 2
2020
- August-September: Monthly data collection or harvest data collection
- October: post-harvest data collection; data processing
- November: data processing
- December-February: data analysis; posters and brochure production, draft publications and fact sheets
2021
- Late March to Early April: plot establishment and early planting
- Three weeks post first establishment: late planting
- May-July: Monthly data collection at Evans Research Farm and Cache Junction Research Farm
- August: Monthly data collection if not mature and if mature yield data collected and plots harvested
- September- Harvested if not previously at this time for yield data and weed
- October- post-harvest data collection through subsamples cut and collected for weed and crop data; data processing
- November-December: data analysis; educational material production, publications, and fact sheets
2022
- January- February: data analysis; educational material production, posters and brochures, drafts of publications and fact sheets
- March-May: survey for germination of any escaped cover crop seed
- June- August: finalize work on the cover crop selection tool and partial budgets educational materials and meetings
Cooperators
- - Producer
- - Producer
- - Producer
- - Producer
- - Producer
- - Producer
- - Producer
- - Producer
Research
Determination of Cover Crop Competitiveness in Semi-Arid Regions
Variety trials were established in 2021 across four Utah State Research farms to determine cover crop effectiveness at suppressing weed species in small grain crops. in a randomized block design. Crops were planted according to current standard practice, with typical seeding rates and dates used for crop planting. Plots 3 x 9 m were used, including borders (2’ or 0.66m), at all sites in a randomized complete block design with five replications. The cover crop types tested were white yarrow (Achillea millefolium), frosty berseem clover (Trifolium alexandrium), fixation balansa clover (Trifolium michelianum), cicer milkvetch (Astragalus cicer), and medium red clover (Trifolium pratense). Plots were randomly assigned a cover crop type to be seeded at the recommended planting rate of the cover crop or as a non-seeded control. At Evans Research Farm and Cache Junction Research Farm cover crops were inter-seeded after germination and establishment of the grain crop, when the crop was approximately at stage 12 to 13 according to the Zadoks growth scale. At Kaysville Research Farm and the Greenville Research Farm cover crops were inter-seeded directly after drill seeding of the grain crop.
Percent cover by species as a measure of competition was measured for each cover crop type, grain crop, and weeds. Quadrats (0.25m2) were used to sample once a month, commencing after planting through to harvest. At harvest, quadrats were used to collect three biomass samples across each plot. Shoot growth of all species present within the quadrat was cut at the soil surface, placed in a labeled bag and stored at 4°C. These samples were sorted by species, dried and weighed for biomass. Data will be analyzed using an ANOVA in R.
Cultural Weed Management for Invasive and Weedy Plants in Irrigated Spring Wheat Productive System
A field experiment to determine an optimal strategy cover cropping application for the suppression of Kochia scoparia and other weed species was established in irrigated spring wheat. At Cache Junction Research Farm and Evans Research Farm in Logan, UT plots measuring 3 x 9 m were established in a complete randomized block design with three replications. Plots were planted at the recommended seeding rate for irrigated spring wheat, 100 lbs/ac (Brown and Walsh 2016). Each plot was assigned one of three seeding rates of the cover crop, and one of five cover crop types or a none cover cropped control. At USU's Cache Junction Research Farm planting occurred on April 10, 2020 April 23, 2021 and at Evans Research Farm planting was done on April 20, 2020 and April 29, 2021. Seeding rates used were based on documented seeding rates of each cover type. The three levels for seed rate were as follows: 75% of the recommended seeding rate (light), the recommended rate (recommended), and 125% of the recommended rate (heavy). The cover crops used were dynamite red clover (Trifolium pratense), hairy vetch (Vicia villosa), Utah sweetvetch (Hedysarum boreale utahensis), strawberry clover (Trifolium fragiferum), and rose clover (Trifolium hirtum).
Percent cover by species, as a measure of competition, was recorded similarly to the previous description. Quadrats were used to sample once a month after planting until the crop harvest. At harvest, quadrats were used to collect three random samples spaced equidistantly per plot. Shoots within each quadrat were cut at the soil surface and placed in labeled bags. These were stored in a cooler at 4°C. Samples were sorted into species dried and weighed for biomass. Yield was estimated from the grain yield of the harvest biomass samples. In the fall after the first cash crop harvest, biomass samples were collected again to establish the cover crop’s ability for suppression on the field after harvest has occurred. Samples were processed as described previously. Data was analyzed using an ANOVA in R.
Cultural Weed Management for Invasive and Weedy Plants in Irrigated Spring Wheat Productive System
Wheat
Average percent cover for wheat in July was only significantly influenced by the location of planting (p= 2.178e-7), indicating that the use of the inter-seeded cover did not interfere with the establishment of the desired cash crop. As seen in Figure 1, average percent cover of wheat was consistent across each location, with Cache Junction having better coverage and thereby more competitive wheat stands. However, as discussed below many of the cover crops seeded did not establish well, or at all, thus having no impact on the wheat crop.
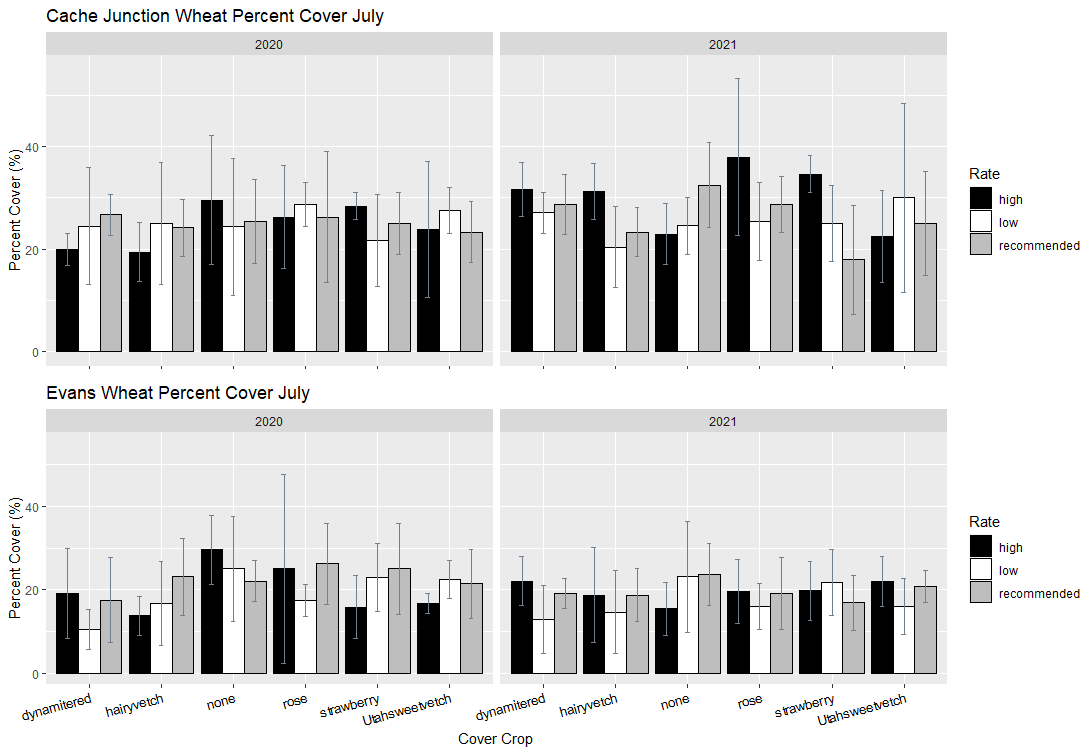
Figure 1: Average percent cover of wheat in July 2020 and 2021 for both Cache Junction and Evans Research Farm. Average percent cover for plots seeded with each species, dynamite red clover, hairy vetch, none covered control, rose clover, strawberry clover, and Utah sweetvetch, at each rate high (black), low (white) and the recommended rate (grey).
The trends in wheat cover were supported by the harvested wheat biomass. Wheat biomass was significantly influenced by both site and year of planting (p= <2.2e-16; p= <2.2e-16) and their interaction (p=1.226e-4). There was no evidence of influence of the use of inter-seeded cover crops on wheat crop biomass. For wheat biomass however, an interaction of site and rate of the cover used also showed some significance (p=0.0429). The significance of the site and rate of cover crop interaction is likely due to the differences in the site history and micro-climate differences in the field, not the rate of cover crop used, as cover had no significant influence. Crops planted at Evans Research Farm were planted into previously fallow fields with no history of fertilization while Cache Junction Research Farm have historically received fertility and weed management treatments.
Cover Crop
For July, average percent cover was significantly different by cover (p=0.0428), and the interaction of site and cover (p=0.0446) and year, site and cover used (p=0.047). There was significantly more percent cover seen at Evans than at Cache Junction. Low plant growth from both crop and weeds at the Evans site resulted in lower competition and therefore more growth or better observation of the growing cover crop present. More cover crop growth was observed in 2020 than 2021 (Figure 2), due to drought conditions in between set irrigation schedules during the 2021 growth season. Those cover crops that provided the best cover at both sites were dynamite red clover and hairy vetch (Figure 2).
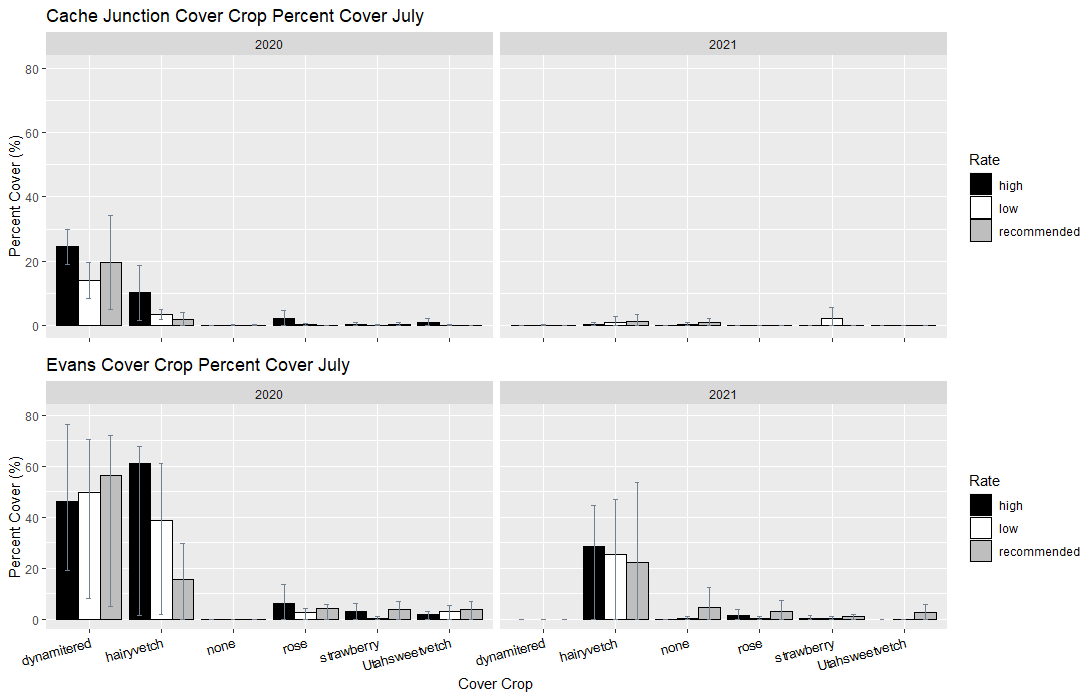
Figure 2: Average percent cover of the cover crops present in July 2020 and 2021 for both Cache Junction and Evans Research Farm. Average percent cover for plots seeded with each species, dynamite red clover, hairy vetch, none covered control, rose clover, strawberry clover, and Utah sweetvetch), at each rate high (black), low (white), and the recommended rate (grey) is displayed.
Overall, percent cover of the cover crop treatments was low in this study. At Evans farm, late in the growing season cover was observed from rose clover, strawberry clover, and Utah sweetvetch. The low emergence and ground cover would indicate that these species may not be the best suited for use in the Western US. However, conditions were not optimal for the germination and establishment of these species, so observing them at all would indicate further study would be needed to observe their potential. In 2020 at Cache Junction, water was cut to half of the recommended irrigation rate for the area. In 2021 the entire Cache Valley area experienced drought conditions, resulting in less precipitation and additional restrictions placed on irrigation. These restrictions would influence cover crop growth and could have contributed to the changes observed between Evans Research Farm and Cache Junction Research Farm site as well as between the years of the study.
Cover crop biomass was significantly influenced by the site, year and cover crop used (p= 2.668e-4; p= 2.834e-5; p= 8.234e-14). The interactions of the site and year and year and cover as well as the three-way interaction of site, year and cover all showed significance (p=7.985e-5; p=2.12e-13; p= 4.51e-4). Dynamite red clover and hairy vetch were the only cover crops used that had consistent germination greater than the none cover cropped controls. Though hairy vetch established well, its vining quality negatively impacted grain harvest (Figure 3). Cover crop biomass harvested was significantly greater in 2020 than in 2021, which would be expected as additional moisture from precipitation was greater in 2020 than 2021. The Evans site had greater cover crop biomass than the Cache Junction site likely due to the reduced competitive pressure from lower stands of wheat and fewer weeds at this site as well as their nutrient fixation ability which is a great advantage in the nutrient poor soil.
Figure 3: Illustration of inter-seeding desired understory growth (left) and growth habit of seeded hairy vetch (right) demonstrating that the vining hairy vetch can overtake the desired cash crop making harvest impossible.
Weeds
Percent cover of weeds observed in July was significantly influenced by the year (p=<2e-16), site (p=<2e-16), and the interaction of site and cover (p=0.011). As discussed previously, these differences would be due to the site history difference and the differences in drought conditions between growing years. The site and cover interaction significance would be expected as only two of the five cover crops employed in our inter-seeding consistently established (Figure 2). Those plots that contained dynamite red clover and hairy vetch showed significant difference in percent cover (p=<2e-16; p=0.0272). Those plots that did not have hairy vetch or dynamite red clover would not have had much if any competitive pressure from the cover crop and would therefore have higher weed presence. Kochia percent cover was significantly different between years (p=1.363e-10), site (p=<2.2e-16), and the interaction of year and site (p=1.333e-10). The influence of location on the distribution of B. scoparia was due to the lack of establishment of the seeded B. scoparia at the Evans Research Farm site. Bassia scoparia was present across the site at Cache Junction. The use of hairy vetch did seem to help reduce B. scoparia presence, though no cover crop at any rate was distinguishable from the non-cover cropped control plots.
Weed biomass was only significantly influenced by the site and year of planting and this interaction (p= <2e-16; p=4.621e-8; p=2.258e-5). Weed biomass was higher at the Cache Junction site than the Evans location (Figure 4 and 5) likely due to field fertility and management differences. Overall, plant life, both crop and weeds, was greater at the Cache Junction site as the field used was regularly maintained for years previous to this planting. The Evans Research site was a field brought out of a fallow grass condition, unmanaged for a long duration before use. Kochia biomass recovered was also seen to be significantly influenced only by the year and site and the interaction of year and site (p=<2e-16; p=7.04e-8; p= 7.06e-8). This would be expected as the Cache Junction location had a history of kochia invasion and seeding of kochia for research on this study plot while the Evans Research Site was only seeded with kochia during this study. There was no influence seen of the cover crop used or it’s seeding rate on general weeds and kochia biomass (Figure 4 and 5). These findings would seem to indicate that the use of cover crops at any seeding rate in irrigated spring wheat would not be sufficient alone to provide general weed control or specific control of B. scoparia. However, previous research established that when used as an inter-seeded cover, when cover crop establishment was at the expected rate, dynamite red clover can aid in weed suppression. In a USU IWM study, solely inter-seeding cover cropping dynamite red clover and combined seedings with chemical management (MCPA) provided similar suppression to chemical treatments alone (Huskie) (Figure 6). In this same study, kochia biomass at crop harvest was reduced by cover cropping alone and in combination with chemical treatments compared to the non-treated control (Figure 7). These results establish that successful employment of this strategy is highly dependent on environmental conditions supporting healthy cover crop stands which can then exert strong competitive pressures. Testing germination and establishment across a variety of climate conditions under more controlled conditions such as in a greenhouse or germination chamber would be recommended.
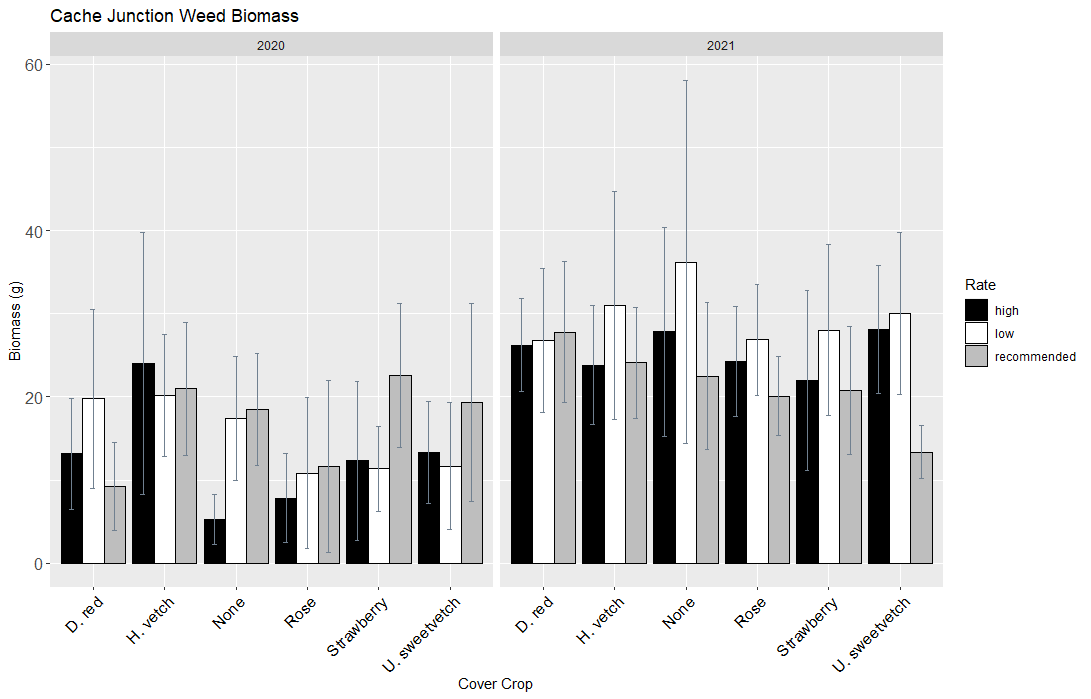
Figure 4: Weed biomass observed at the time of crop harvest for each cover crop treatment and seeding rate, high (black), low (white), and the recommended rate (grey) at Cache Junction Research Farm in 2020 and 2021.
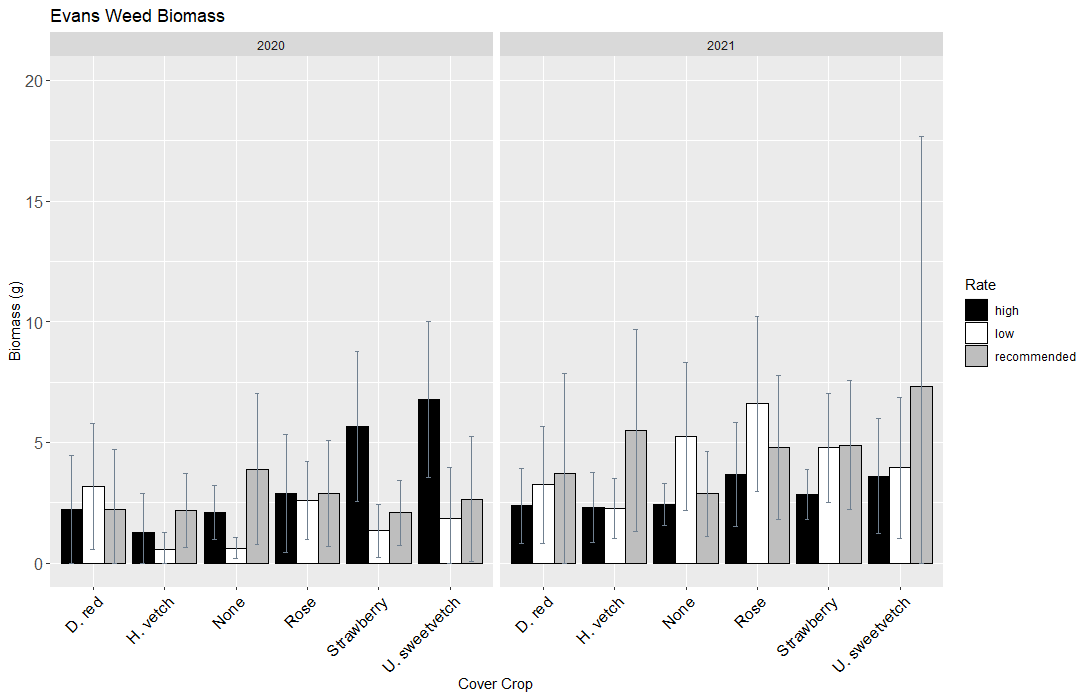
Figure 5: Weed biomass observed at the time of crop harvest for each cover crop treatment and seeding rate, high (black), low (white), and the recommended rate (grey) at Evans Research Farm in 2020 and 2021.
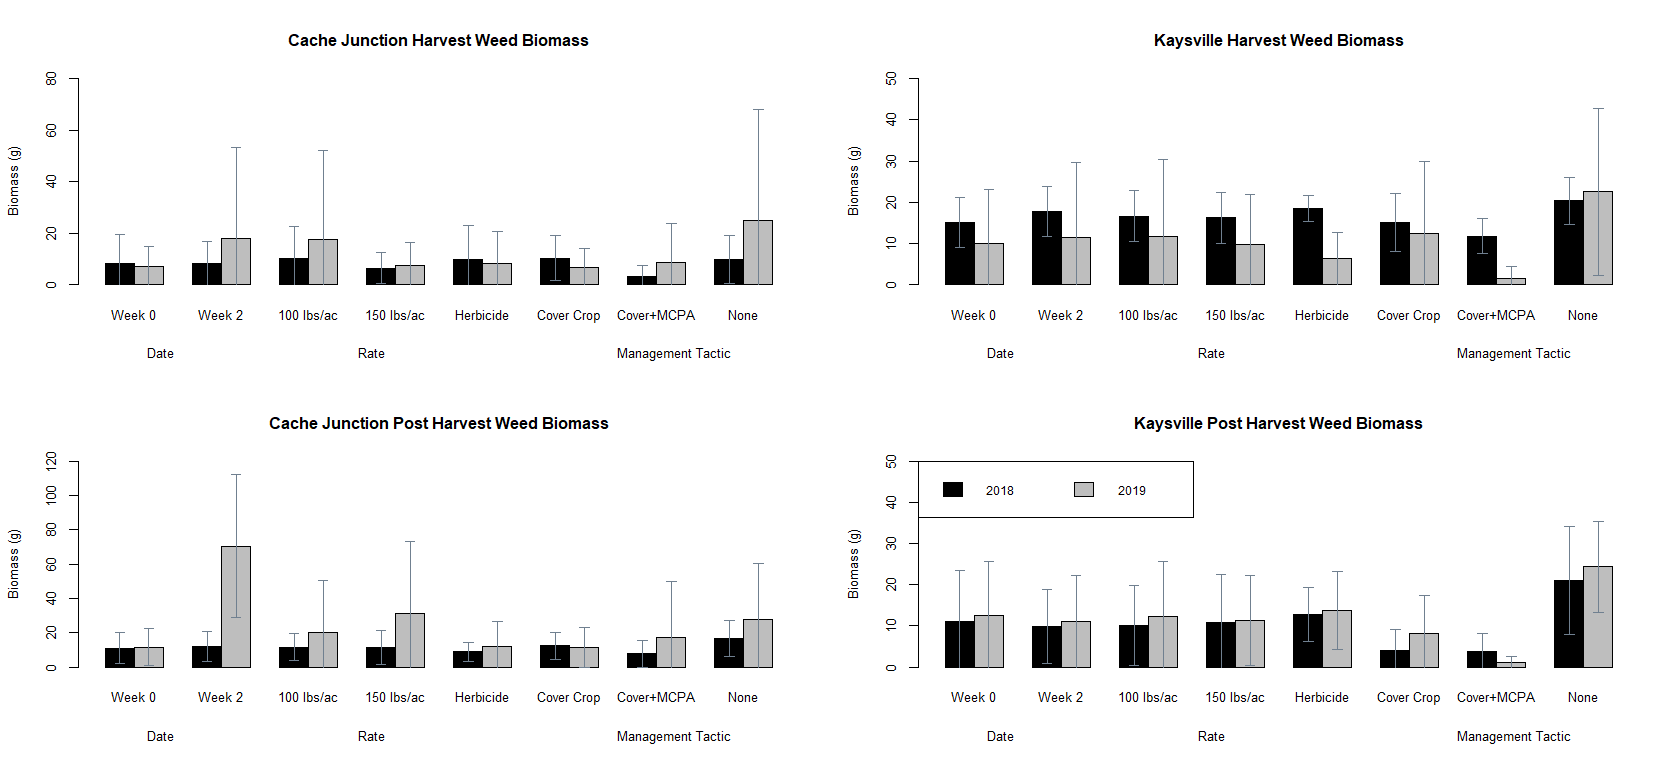
Figure 6: Weed biomass observed at harvest and one month post-harvest for an integrated weed management study at USU’s Cache Junction Research Farm and Kaysville Research Farm for 2018 (blue) and 2019 (brown) by each management tactic.
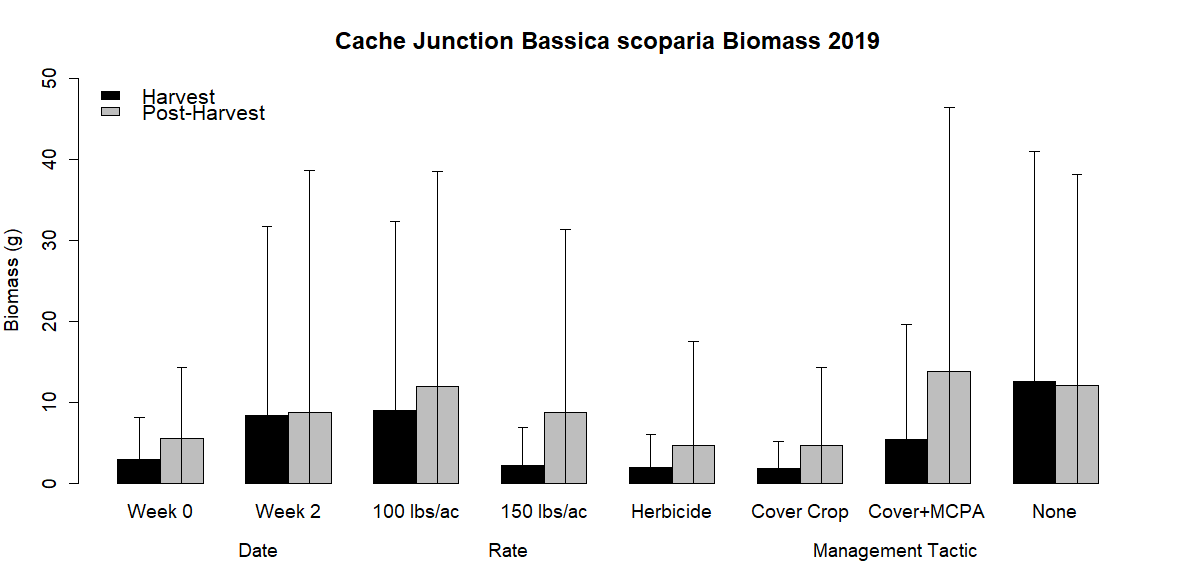
Figure 7: Kochia biomass observed in 2019 at harvest (blue) and one month after harvest (brown) by each integrated weed management tactic used.
Determination of Cover Crop Competitiveness in Semi-Arid Regions
Cover crops used as inter-seeded cover for competitive suppression in small grain crops had very little growth and therefore little effectiveness. At Cache Junction no growth was seen for any employed cover crop. The Cache Junction location was managed using chemicals resulting in no weed presence and a healthy wheat stand. This site is therefore not included in the graphics.
For June in terms of average percent cover of the cash crop within the location percent cover was similar across all treatments (Figure 8). The differences seen in terms of grain crop and weeds average percent cover were all observed based on the location of planting. Weeds abundance observed in June in terms of average percent cover was consistent across the location (Figure 8). These results suggest that these inter-seeded cover crops did not have any influence or allow for the competitive suppression of weeds. Inter-seeded cover crops were observed to establish better when inter-seeded at the same time of the grain crop seeding. Both Kaysville and Field 17 locations were inter-seeded at the time of planting and displayed greater average percent cover of the inter-seeded cover (Figure 8). However, overall percent cover of the inter-seeded cover crop was low, again this is likely due to the limited water availability due to the irrigation restrictions and drought conditions in 2021.
Overall, for June plant life establishment at Field 17 was low (Figure 8). This is likely due to the delay and variability in water application as there were limiting water resources due to drought.
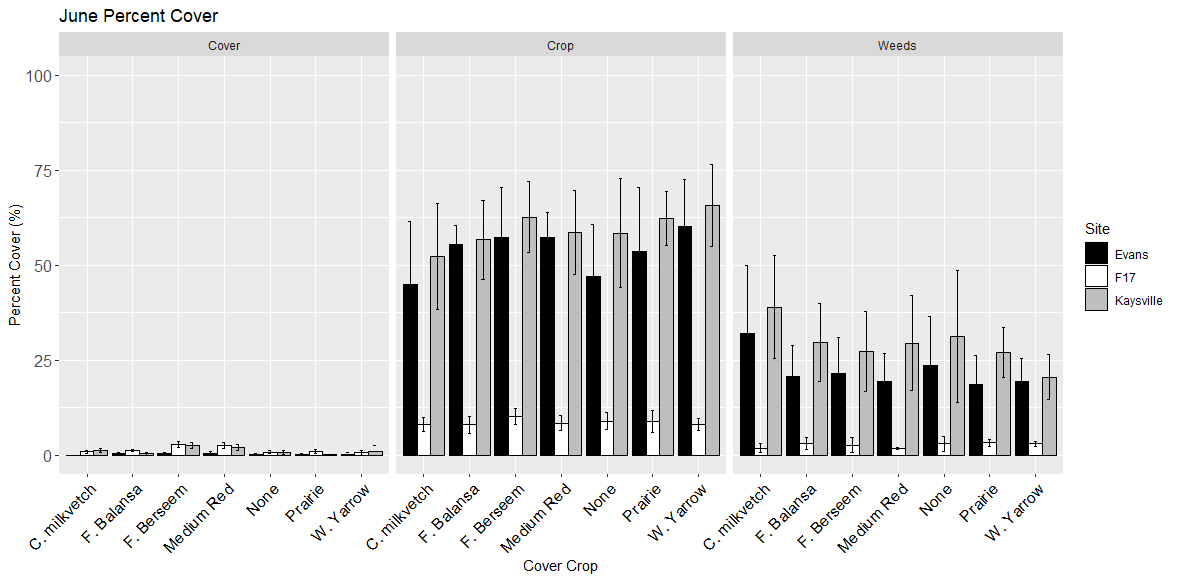
Figure 8: The average percent cover of the cover crop, cash crop, and weeds seen across each cover crop treatment for Evans Research Farm (black), Kaysville Research Farm (grey) and Field 17 Research Field (white) observed in June.
Average percent cover observed in July was similar for those locations which were inter-seeded at the same time as grain crop planting. Overall, across both locations (Kaysville and Field 17) both the grain crop and weeds average percent cover observed were similar (Figure 9). Inter-seeded cover did establish differently between the sites, though overall establishment of inter-seeded cover was low. At both sites, medium red clover and frosty berseem clover had some establishment. At Kaysville cicer milkvetch was seen to have some establishment though this was not observed at Field 17. At Field 17 both frosty berseem clover and prairie clover were also seen to establish, though this was not observed at Kaysville (Figure 9). However, frosty berseem clover alone had enough establishment to differ significantly (p= 0.0157). These observations would support that inter-seeding cover cropping was not successful at competitively suppressing weeds in this system. Due to the low establishment of cover through this study from drought conditions further investigation would be recommended.

Figure 9: Average percent cover for the locations inter-seeded at the time of grain crop seeding, Kaysville Research Farm (grey) and Field 17 (white), for the grain crop, cover crops, and weeds observed in July of 2021.
For the cash crop and weed presence, the site alone showed an influence on the biomass harvested (p=<2e-16; p= 1.298e-8). Field 17 and Kaysville Research Farm were planted in oats which produced more biomass than the barley crop present at Evans Research Farm. As the cover crop did not establish well at these sites, as seen in the percent cover observed (Figure 8 and 9), very little if any cover crop biomass was collected (Figure 10). There was no influence of the cover crop used on weed biomass present (p= 0.588). The differences observed in weed biomass can be attributed then to the site difference and the other management and cash crops used at these sites.
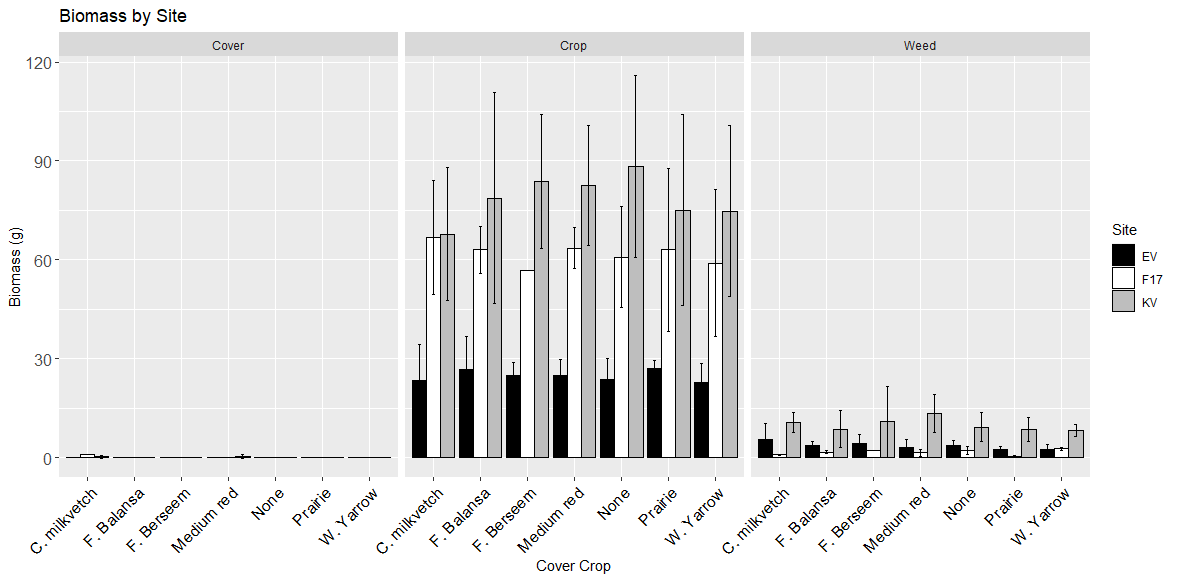
Figure 10: Average biomass for the cover crop, cash crop and weeds for each location Evans Research Farm (black), Field 17 (white), and Kaysville Research Farm (grey) at the time of harvest by each cover crop treatment in 2021.
Research Outcomes
This project was severely impacted by the restrictions of the pandemic. Due to limited interactions during 2020 variety trials for identifying suitable cover crops for use as inter-seeded cover in the West were unable to be placed onto producers' properties. These were then executed in 2021 but kept to Utah State University properties as we were still observing social distancing and many producers were not comfortable with outside personnel interacting with workers risking their operations. The project was adapted the best as possible for these circumstances, however, this limited our cash cropping system application and the number of cover crops that could be tested for inter-seeding performance. I would recommend that these cover crops be tested again in a wide array of cash cropping systems to get a clearer picture of the performance as inter-seeded cover for weed suppression.
Also as discussed previously drought experienced over the course of the study had an impact on the performance of the cover crop as well. Seeing how these abiotic factors had shifted our compositions from year to year and knowing that these conditions will only get increasingly more prevalent incorporating studies on the optimization of water resources will be important for investigation in the future. Studies which incorporate looking at the timing and duration of water applications throughout the growth period would help producers tremendously. This would aid in knowing optimal application methods for limited water resources. This is essential for systems utilizing cover cropping as the establishment of the stand is vitally important for creating competitive suppression through this method. For our study, water inputs were reduced to half at one site resulting in a similar reduction in the percent cover of cover crops within the system. This illustrates the vital importance of studies which can illuminate when to apply and what volume of water to apply.
Greenhouse experimentation spurred by this project has brought further understanding of crop-weed competition, and how environmental factors influence the dynamic and has attempted to pinpoint the limiting resource driving competitive suppression observed. Greenhouse experimentation at USU following these studies has been conducted on resource limitation in order to further understand these field dynamics. In a replacement series design populations of dynamite red clover and kochia were exposed to varied light, water and nutrient levels. These studies have shown that both species experience intra-specific and inter-specific competition for light, water and nutrients. Under limited light levels both clover and kochia had reduced biomass acquisition. However, clover reductions were observed after a 10% light level was imposed opposed to kochia which displayed reductions after 40% light availability had been reached. This suggests clover is a better competitor for light than kochia. Under limited nutrient conditions clover biomass reductions were observed under 25% nutrient availability while kochia reductions were seen beginning at 50% nutrient availability. When nutrients were limited, kochia intra-specific competition was also observed to be high. This indicates nutrient limitations will have greater adverse effects to kochia populations than dynamite red clover, a nitrogen fixing legume suggesting clover’s ability to outcompete kochia for nutrients. However, water limitations resulted in heightened kochia performed than clover. When water was limited, kochia had higher growth rates under low water conditions than clover. Both kochia and clover had intra-specific competition, however, and were able to individually acquire more biomass with fewer of their own species present. This would indicate that kochia is a better competitor for water than the dynamite red clover and potentially similar cover crops. This would be expected as kochia is documented to be drought resistant and grow even under moisture limitations (Pafford and Wiese 1964; Coxworth et al. 1969; Friesen et al. 2009; Undersander et al. 1990). Therefore, the weed suppression observed in the field by cover crops likely stems from light and nutrient competition. Also, this would indicate that when water is limited, cover cropping may have difficulty establishing and would not be very successful at outcompeting weed counterparts. Inter-seeded cover crops, even in irrigated systems, may have limited usefulness during times or drought or in dryland crops. The intricacy and complexity of these interactions requires further study and projects such as this greenhouse research can help to understand how these tactics can be employed to their greatest success and develop guidelines for management in soil fertility and water resources that can shift advantage toward crops over their weed counterparts.
Education and Outreach
Participation Summary:
The findings from this study were presented at the Spring 2022 WSWS conference. An oral presentation was given discussing the use of these tactics. Additionally, a poster presentation was given discussing cover crop competitive interactions surrounding water resources which supplemented the understandings of implementing these practices in the Western US. Findings were also presented in an international webinar as well hosted by the Faculty of Agriculture at Kamphaeng Saen, KU regarding advances in agricultural research for people’s well-being. All findings will also be submitted as a journal publication to communicate our findings on the efficacy of these methods for the Western US.