Final report for FNC16-1063
Project Information
I grew up on a farm and started farming on my own in 1966. When I started farming, I plowed everything with a moldboard plow. I did this for about 10 years. After learning about other tillage practices, I tried mulch tilling. I began ridge tilling in 1984 because I wanted to protect the soil and reduce erosion. Now my wife and I own 475 acres and rent 640 acres. We use ridge till on our corn and soybean crop rotation fields. We also raise Holstein steers. We own land that is enrolled in the Conservation Reserve Program. To continue our ridge till practice, we also rent out a quarter of our owned land to a young farmer who ridge tills.
We would like to plant cover crops to further benefit the soil, prevent water and wind erosion, and to show other farmers that it is beneficial and can be done.
The project included two 35-acre fields, one field was seeded with cover crops and one was not. Both fields have the same cropping history of corn and soybeans; along with ridge till management practices. The cover crop seed included a mix of 23 pounds of Annual Rye, 4.8 pounds of Radish, and 19.6 pounds of Spring Wheat. This mix was chosen to prevent soil erosion and improve infiltration.
From each 35-acre field, two soil samples were collected along with one grassed area control sample. The Haney soil test was used to compare microbial activity in the soil over the duration of the grant.
Along with the Haney soil test, infiltration tests were conducted in the fall and spring on each field plot. An infiltration rate is the velocity at which water enters the soil. Infiltration is measured by placing a six-inch (height) by eight-inch (diameter) ring in the soil three inches deep, then adding sixteen ounces of water to the inside of the ring. The test was run continuously for an hour. The amount of times it takes the sixteen ounces of water to infiltrate into the soil was recorded as an infiltration rate of inches per hour.
Yield data was also collected during crop harvest and a simple per acre economic analysis was completed for the two fields. Information included cover crop seed, fertilizer, and crop seed costs, as well as crop yield and value, gross income, and net income.
The objective of this grant was to measure the benefits of cover crops using the Haney soil test and infiltration test. The Haney soil test was used to determine soil health year to year by using the "soil health calculation". Infiltration tests were completed in the spring and fall to determine if cover crops increase infiltration within the soil profile. A cover crop mix of Annual Rye, Tillage Radish, and Winter Wheat was chosen to prevent soil erosion and improve infiltration.
Cooperators
- (Educator and Researcher)
Research
This project included two 35-acre fields, one field was seeded with cover crops and one was not. Both fields have the same cropping history of corn and soybeans; along with ridge till management practices. The cover crop seed included a mix of 23 pounds of Annual Rye, 4.8 pounds of Radish, and 19.6 pounds of Spring Wheat. This mix was chosen to prevent soil erosion and improve infiltration.
From each 35-acre field, two soil samples were collected along with one control sample taken in a grassed area. The soil samples were sent to the lab to conduct a Haney soil test to determine soil health. The Haney soil test compared microbial activity in the soil over the duration of the grant.
Along with the Haney soil test, an infiltration test was conducted in the spring and fall in each field plot. An infiltration rate is the velocity at which water enters the soil. Infiltration is measured by placing a six-inch (height) by eight-inch (diameter) ring in the soil three inches deep, then adding sixteen ounces of water to the inside of the ring. The amount of times it takes to infiltrate sixteen ounces of water is recorded as an infiltration rate of inches of rain per hour.
Yield data was also collected during crop harvest and a simple per acre economic analysis was completed for the two fields. Information included cover crop seed, fertilizer, and crop seed costs, as well as crop yield and value, gross income, and net income.
Impacts

Photo: Infiltration test being completed in corn residue. Photo taken November 3, 2016 in Nobles County.
Infiltration Test
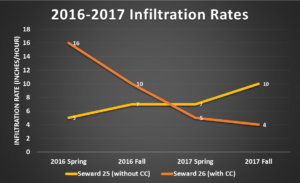
2016 spring infiltration tests were completed on June 8, 2016. Originally, the Heron Lake Watershed District had planned to complete the test before May 15th. Due to weather conditions, the staff was unable to get to the sites until June 8th. The results for both fields are as follows:
|
2016 Crop |
Acres |
County |
Location |
Soil Type |
Tillage Practices and History |
Date Test Completed |
Result (Inches/Hour) |
County Average Rainfall (Inches)* |
|
Corn |
35 |
Nobles |
Seward 25 (without CC) |
L141A |
Ridge Till |
6/8/16 |
5 |
15.05 |
|
Corn |
35 |
Nobles |
Seward 26 (with CC) |
L83A |
Ridge Till |
6/8/16 |
16 |
15.05 |
*Rainfall amounts measured from Jan 1, 2016 to infiltration test completion date.
2016 fall infiltration tests were completed on November 3, 2016. The results for both fields are as follows:
|
2016 Crop |
Acres |
County |
Location |
Soil Type |
Tillage Practices and History |
Date Test Completed |
Result (Inches/Hour) |
County Average Rainfall (Inches)* |
|
Corn |
35 |
Nobles |
Seward 25 (without CC) |
L141A |
Ridge Till |
11/3/16 |
7 |
36.24 |
|
Corn |
35 |
Nobles |
Seward 26 (with CC) |
L83A |
Ridge Till |
11/3/16 |
10 |
36.24 |
*Rainfall amounts measured from Jan 1, 2016 to infiltration test completion date.
2017 spring infiltration test were completed on May 15th. The results for both fields are as follows:
|
2017 Crop |
Acres |
County |
Location |
Soil Type |
Tillage Practices and History |
Date Test Completed |
Result (Inches/Hour) |
County Average Rainfall (Inches)* |
|
Beans |
35 |
Nobles |
Seward 25 (without CC) |
L141A |
Ridge Till |
5/15/17 |
7 |
5.56 |
|
Beans |
35 |
Nobles |
Seward 26 (with CC) |
L83A |
Ridge Till |
5/15/17 |
5 |
5.56 |
*Rainfall amounts measured from Jan 1, 2017 to infiltration test completion date.
2017 fall infiltration test were completed on October 25th. The results for both fields are as follows:
|
2017 Crop |
Acres |
County |
Location |
Soil Type |
Tillage Practices and History |
Date Test Completed |
Result (Inches/Hour) |
County Average Rainfall (Inches)* |
|
Beans |
35 |
Nobles |
Seward 25 (without CC) |
L141A |
Ridge Till |
10/25/17 |
10 |
29.39 |
|
Beans |
35 |
Nobles |
Seward 26 (with CC) |
L83A |
Ridge Till |
10/25/17 |
4 |
29.39 |
*Rainfall amounts measured from Jan 1, 2017 to infiltration test completion date.
Haney Soil Test
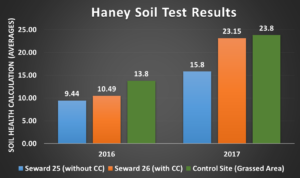
In the fall of 2016 and 2017, a total of two Haney soil tests were completed in each 35-acre plot, along with a control sample that was collected in a grassed area along the field border. The Haney soil test uses multiple tests to determine the health of the soil. To score the soil health, the Haney test uses "a soil health calculation" score. This score is determined by taking soil nutrients, soil organic nutrients, water extractable carbon, balance of C:N ratio, and microbial activity measurements. A score of seven or higher indicates adequate soils. The results are as follows:
|
2016 Haney Soil Health Calculations |
|||||
|
Seward 25 (without CC) |
Seward 26 (with CC) |
Control Site (grassed area) |
|||
|
Zone 1 |
12.4 |
Zone 1 |
7.68 |
Grassed Area |
13.8 |
|
Zone 2 |
8.57 |
Zone 2 |
11.2 |
|
|
|
Average |
10.49 |
Average |
9.44 |
||
|
2017 Haney Soil Health Calculations |
|||||
|
Seward 25 (without CC) |
Seward 26 (with CC) |
Control Site (grassed area) |
|||
|
Zone 1 |
16.20 |
Zone 1 |
23.30 |
Grassed Area |
23.80 |
|
Zone 2 |
15.40 |
Zone 2 |
23 |
|
|
|
Average |
15.80 |
Average |
23.15 |
||
The field with cover crops had a soil health calculation of 10.49 in 2016 and 23.15 in 2017. The field without cover crops had a soil health calculation of 9.44 in 2016 and 15.80 in 2017. The grassed area was at 13.8 in 2016 and 23.8 in 2017. The grassed area was used for a control site and also increased in 2017. After discussing results with project partners, soil moisture could be the reason for higher calculations in 2017. The Haney soil test concluded that the cover crop field always had a higher soil health calculation compared to the non-cover crop field.
Cost Analysis
For the cost analysis, the following data was collected to determine the net profit: average field yield, revenue per bushel, cost of crop seed, cost of fertilizer, cost of chemicals, crop insurance, cost of machinery (repairs, fuel, etc.), cost of cover crop seed, cost of seed application, and cover crop termination cost.
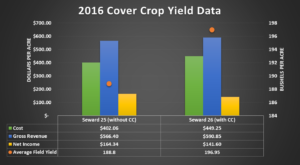
In 2016, the cover crop field yield was higher than the non-cover crop field. Even with the increase in yield, the cost to seed the cover crops was higher and the non-cover crop made more of a profit.
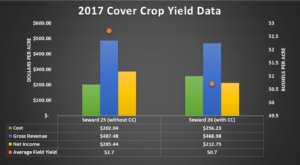
In 2017, the cover crop field showed a two bushel per acre decrease in yield and a lower net income of $72.69 per acre. The high traffic of hauling manure could be a cause for lower yields in the cover crop field.
Even though the net income wasn’t equal in both fields, through this project there was still a benefit from using cover crop. Soil health was improved but was not measured in the net income. For future projects and research, measuring how the crop is using nutrients and how to measure the cost and benefits of increased infiltration and soil health would be beneficial.
Educational & Outreach Activities
Participation summary:
The results from both tests will help local farmers to confidently determine the impact of management on soil characteristics. Adoption of cover crops is dependent upon presenting measurable results. This grant effort provided an opportunity for first-hand, measurable results in southwest Minnesota. Having this data supplied farmers with information that will assist them in determining how cover crops can be implemented in their farming operation.
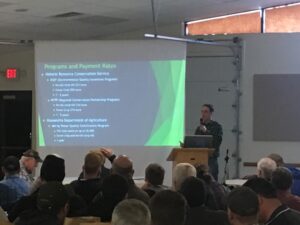
For the education and outreach event, multiple partners got together to host a winter workshop. Jerry and Nancy Ackermann, Jerry and Terry Perkins, Dave Christoffer, and Tim Hansberger who are currently working in partnership on a Minnesota Department of Agriculture (MDA) Sustainable Agriculture Demonstration Grant were major partners for this event. MDA helped cover advertising costs. The landowners provided research findings from their grant projects. Also, the Heron Lake Watershed District, Jackson Soil and Water Conservation District, LaCrosse Seed, Minnesota Corn Growers, and Natural Resource Conservation Service partnered on this event to help cover the cost of a speaker and to provide lunch and refreshments for attendees.
SARE-Newsletter-MailerBefore the event, two mailings were sent out. One was a newsletter covering the SARE grant results and also promoting the field day time and location. 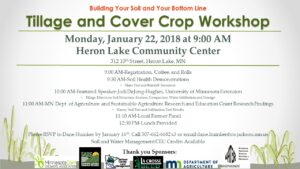 The second was a postcard reminding farmers to attend the event. Both mailings were send to Heron Lake Watershed farmers and landowners. Emails were sent to all agency personnel and crop consultants in southwest Minnesota.
A newspaper ad was also used to advertise for the event. The ad was placed in the Worthington Daily Globe. Information about the event was sent to local newspapers. Radio ads were aired on Worthington's and Windom's major radio stations. Roughly 40 radio ads were aired to promote the event. Radio-Ads Newspaper-Ads
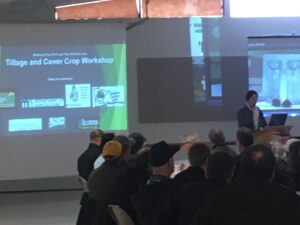
The event was scheduled for January 22, 2018 in Heron Lake, Minnesota. Due to a blizzard, the event was moved to January 24, 2018.2018 Workshop Flyer-Update
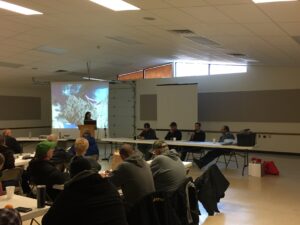
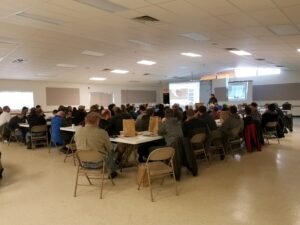
During the event, a sign-up sheet was used to track the number of attendees. Present for the event were 62 farmers, 27 agency personnel, and five crop consultants.
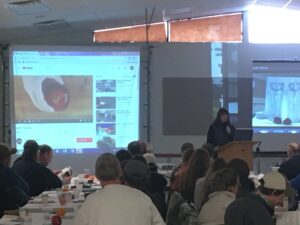
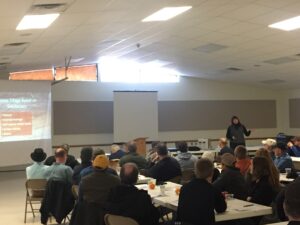
The event consisted of a keynote speaker, Jodi Dejong-Hughes, University of Minnesota Extension. She explained research on reducing tillage practices to better soil quality and infiltration. After the speaker, SARE and MDA grant research findings were presented, followed by a four-person farmer panel. The farmer panel provided knowledge, experience, and plenty of photos of their operations. After the event, many farmers stayed and lots of discussion was held.

After the event a news release was sent to the same local newspapers covering details of the event.
Learning Outcomes
Because of this grant, I was able to measure and show neighboring farmers that my soil quality was improved by using cover crops. This type of research is rare for southwest Minnesota, so I was excited to be able to share it with farmers in our area. I believe that the infiltration test was affected by the compaction of heavy equipment when hauling manure. Before the compaction, the cover crop field had a higher infiltration rate. So I still believe that cover crops would have improved my infiltration if there wasn't equipment that had a negative effect on the results.
Through this grant, one aspect I wanted to look at was the economics of using cover crops. I wasn't able to quantify a dollar amount for my soil health improvement or infiltration rates. Because of this my net profit was lower in my cover crop fields. I still believe cover crops are beneficial even with the net profit outcomes. If there was a way for me to quantify my soil quality and water infiltration I believe the cover crop field would be comparable to non-cover crops or even more profitable.
Project Outcomes
This grant project was one of the first research projects in southwest Minnesota to show actual measurements of improved soil quality. Many farmers in southwest Minnesota were looking for this type of information. Through this grant, we were able to host a very well attended workshop. We were able to reach 62 farmers. After the event, a lot of discussion took place. The most knowledge is gained when farmers can learn from each other. Many farmers talked about changing their operations to incorporate cover crops. A newsletter with the project findings was sent to people within the Heron Lake Watershed District even if they were unable to attend the workshop. Without this grant project, we wouldn’t have been able to reach and educate as many farmers as we did.
Even though the net income wasn’t equal in both fields, through this project there was still a benefit from using cover crops. Soil health was improved but was not measured in the net income. For future projects and research, measuring how the crop is using nutrients and how to measure the cost and benefits of increased infiltration and soil health would be beneficial.