Final report for FNC19-1182
Project Information
Prairie Wind Family Farm is a 40-acre certified organic farm owned and operated by the Miller Family. We are located at the heart of Prairie Crossing, a conservation community in Grayslake, Illinois about 40 miles north of Chicago. We've grown a wide variety of certified organic mixed vegetables for the past 14 years.
Jeff fell in love with farming nearly 20 years ago while working summers on an organic farm, harvesting heirloom tomatoes and baby greens. While Jeff earned degrees in art and landscape architecture, he never lost his passion for working with plants and farming.
In 2006, Jeff left his career as a landscape architect and we started Dea Dia Organics, which grew into a successful, respected farm business. In 2012, we joined Sandhill Family Farms, a collaborative partnership of two farming families, farming in two farm locations (Brodhead, WI and Grayslake, IL) to provide for a shared CSA program. In 2016, our family started Prairie Wind Family Farm operating solely in Grayslake and focused on growing certified organic vegetables, raising hens in pasture for eggs and partnering with long-time farm partners to provide fresh fruit and other high-quality farm products to a 280 member CSA and farmers market.
We believe in the power of collaboration and community. We work with the Liberty Prairie Foundation on projects such as mentoring beginning farmers at Farm Business Development Center and offer a Gleaning Program which provides thousands of pounds of organic produce each year for our community food pantries. We partner with the Prairie Crossing Charter School on their award-winning Farm to Table lunch program and the Diamond Lake School District Chef's Tasting Table introducing children to healthy foods. We develop collaborative farm products in collaboration with our partner farms and offer farm events in partnership with our local chefs and food community.
Our passion for eating, cooking and sharing food with our community fuels everything we do. We respect the plants and animals that create our food and treat the land with deference so it will produce for generations to come.
Each year, we have observed the weather patterns changing, and as the weather becomes more extreme, we observe more significant negative impacts on our crops. We have experienced the loss of important crops over the last several years making it increasingly difficult to run a viable farm business. Our current ability to assess these changes in weather and its impacts depends on photographs, anecdotes and limited access to current and past weather data from remote sites. These disparate sets of data make it difficult to assess and correlate how extreme weather events affect the health and quality of our crops. Our grant proposal would allow us to collect weather data specific to our farm and tie that data to aerial imagery collected on a regular basis. Combining aerial imagery and site specific weather data will allow us to: a) correlate the responses of our crops at different stages of growth to various weather events and the conditions following those events and b) make better, more informed decisions on how to respond. We will share both our process and results with farms in our region and help advise them on where these technologies might fit into their farms.
- Evaluate the impact of extreme weather events on crop growth, crop health and crop quality, and identify predictive signs that can impact future crop planning.
- Collect, correlate, analyze and share data to educate regional farmers and the public on the impacts of changing weather to crops and soils.
- Demonstrate the development of climate-smart decision making methodologies.
- Help farmers increase their economic viability through a demonstration of when, where and how to effectively use resources and respond to changing weather patterns.
- Assist other farmers in determining if this methodology is appropriate for their farm.
Research
Data Collection
- Weather Data
- Automatically collected on an ongoing basis
- Aerial Imagery
- Collected at least every other week. More frequent fly overs will be completed as needed based on weather and crop growth/changes. This frequency will provide a good baseline to illustrate how the studied crops respond to weather changes.
- Part One - Consistent route flown over entire farm
- Part Two - Closer examination of each growing succession of selected crops
- Collected at least every other week. More frequent fly overs will be completed as needed based on weather and crop growth/changes. This frequency will provide a good baseline to illustrate how the studied crops respond to weather changes.
- Weekly field observations (notes and photographs).
Data Correlation
- Correlating aerial and weather will take place monthly.
- Aerial imagery will be correlated with graphs of weather data from the same time period.
- For presentation and sharing purposes specifics aspects of weather data (i.e. rain amounts and temperature) will be selected to illustrate the most relevant correlations.
Crops Studied - These crops were chosen as part of this study because their growth, quality and yield depends to a great deal on weather. These crops are also valuable to our CSA and farmers markets, and farmers in our region also struggle with these crops during extreme weather events. Additionally their frequency of planting will allow us to monitor them at many different stages of growth. They can also serve as proxy for a wide range of other crops:
- Beets
- 8 successions per year split over 1.5 AC
- Both transplanted and direct seeded
- Broccoli
- 6 successions per year split over 2 AC
- All transplanted
- Tomatoes
- 2 successions per year split over 0.75 AC
- All transplanted
Grant Budget:
- Drone: $1,799
- Weather Station: $2,340 (included: expandable weather station/data logger (wifi) with soil moisture, temperature, light, humidity, wind speed/direction and rain sensors). The additional sensors we’ve added are noted below.
Benefits to other farmers:
- Learn how weather events affects crop growth, yield and quality and the rate and spread of disease.
- Learn which of the technologies used are appropriate to other farms and how they can inform management decisions resulting in a more viable farm enterprise.
June weed explosion
In early May, we planted a field with broccoli where we effectively kept weed pressure down. Then starting on the 22nd of May (7 days before the drone video), we received rain. This pattern of rain continued for 26 of the next 40 days with no more than 3 consecutive days without rain. This ongoing rain meant our soils remained close to saturated. We were unable to get any equipment into the field to cultivate resulting in an explosion of weed growth at an important time in the growth of the broccoli.
Disease Pressure
The 2019 season brought more issues with disease than any season we can remember. Of the 222 days (April 15 - November 23) that make up most of our outdoor growing season, we had 112 (just over 50%) days with rain. As water is one of the main carriers of plant disease this provided diseases with a lot of opportunities to spread.
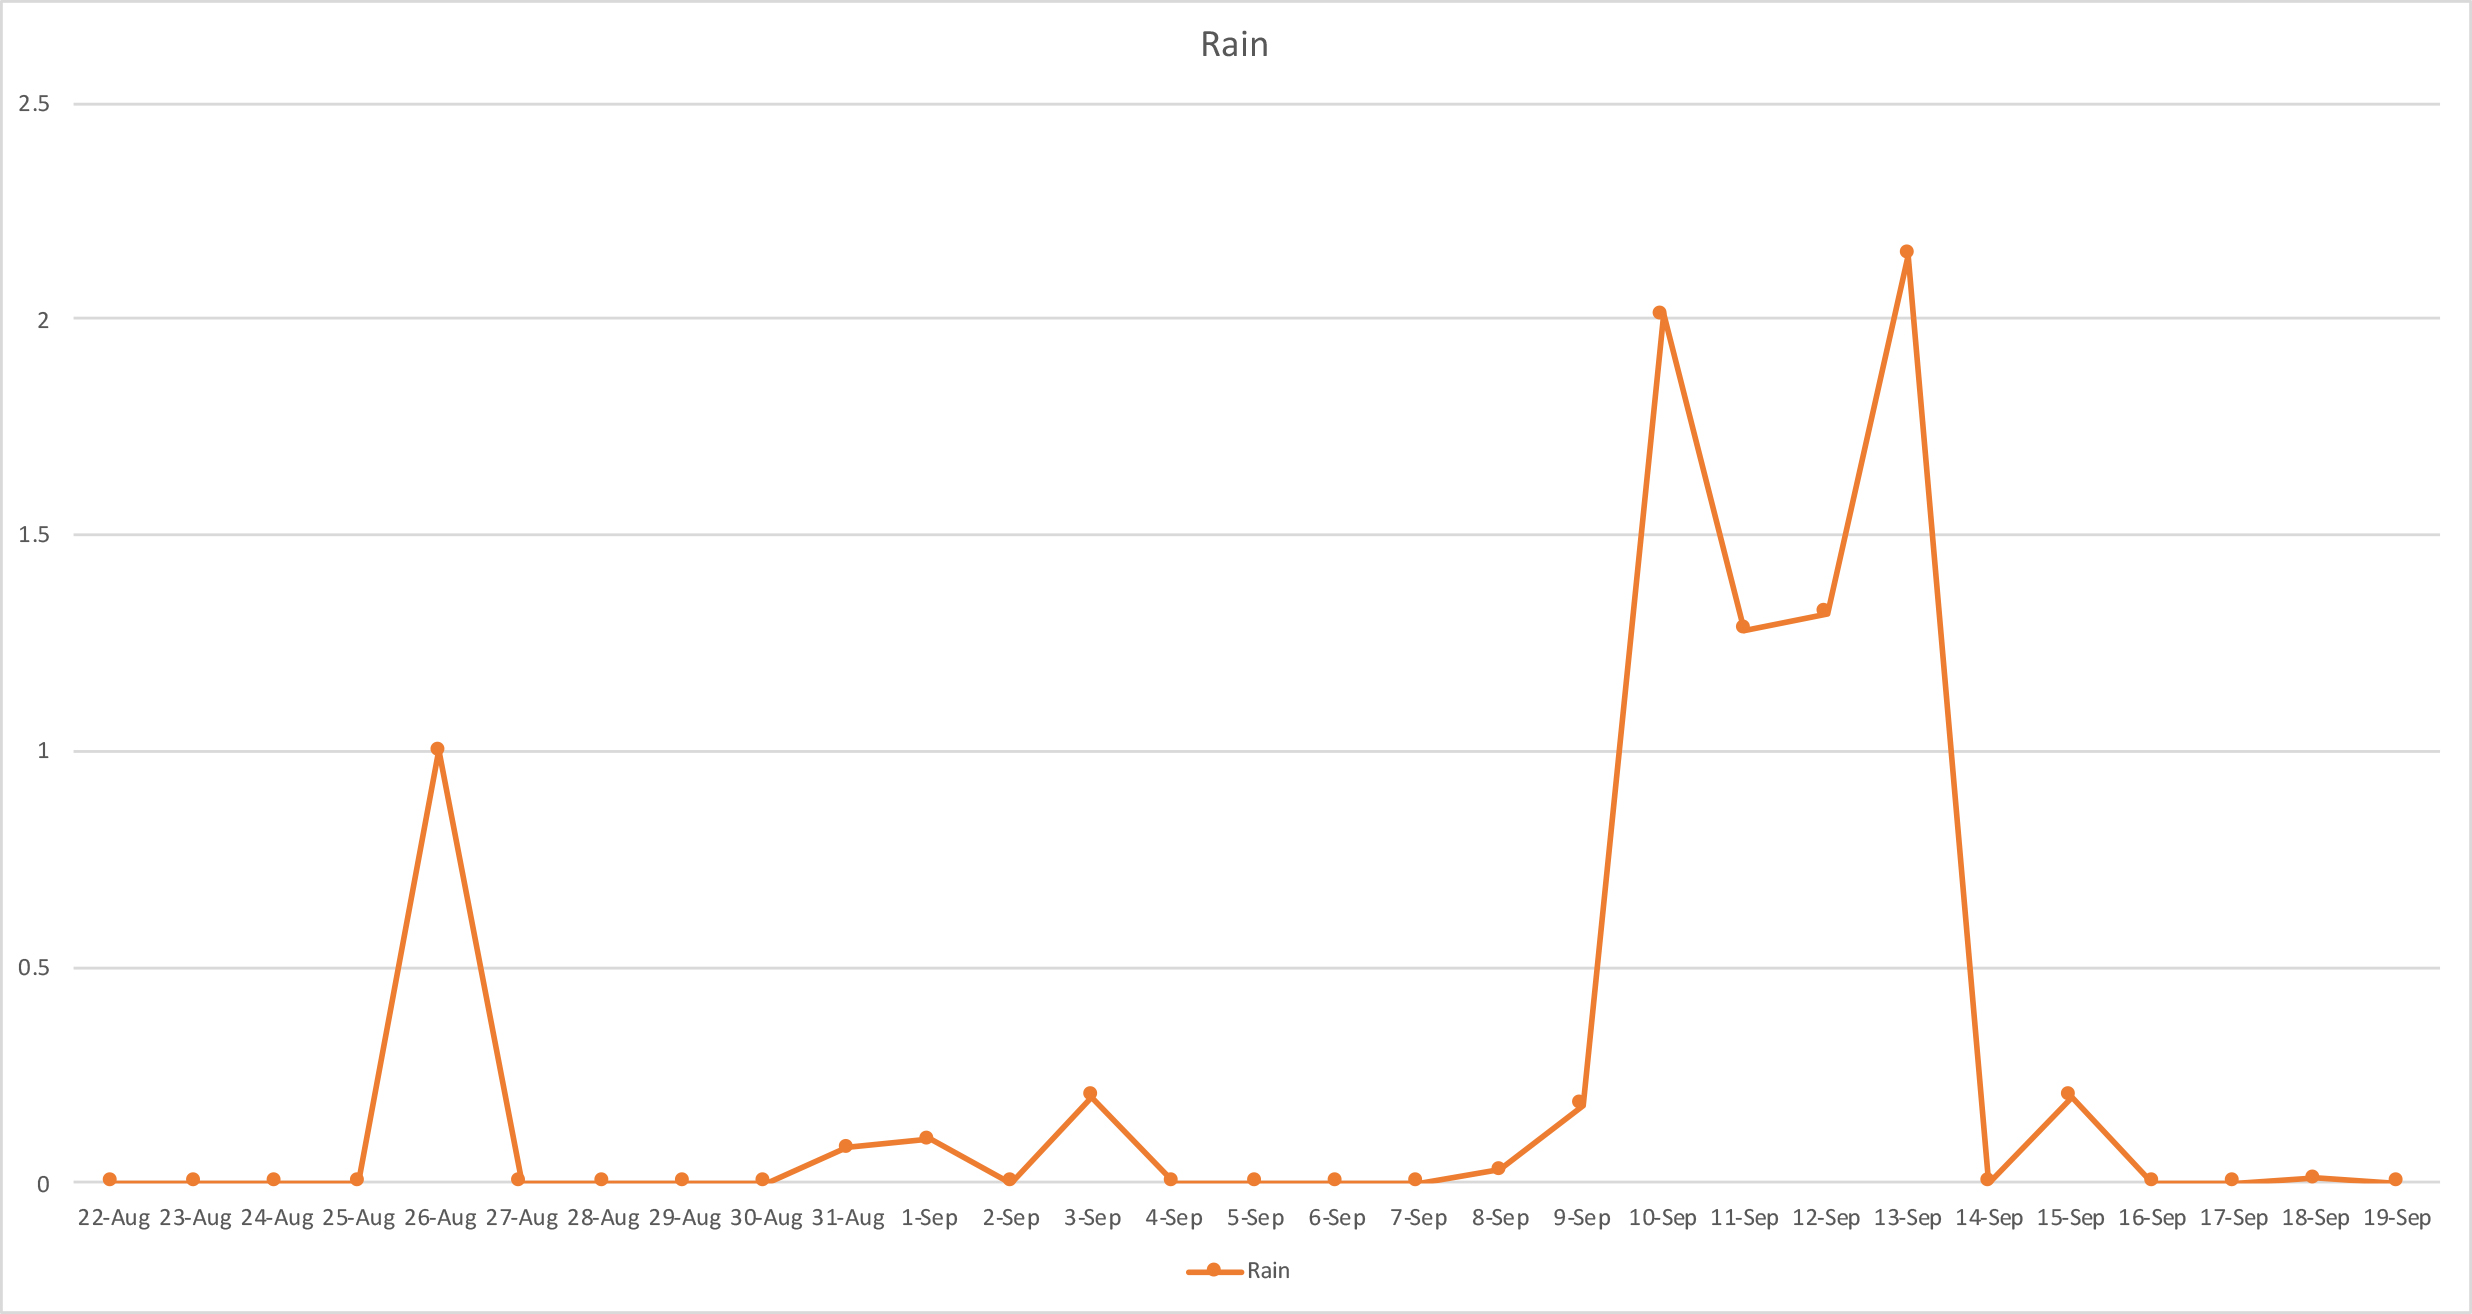
Black rot has not been very present on our farm in the past, however, in 2019 it was present in abundance. We thought our last two broccoli plantings were going to make it with limited damage because July and August were a little drier. Then the second week of September we got almost 7” of rain over 5 days. After this rain, the disease spread across the entire planting and dramatically limited the harvest of fall broccoli, one of our more important crops in that season.
While the photo and video don’t show this perfectly you can see the widespread yellowing leaves on the plants. We are also using some of this imagery to evaluate how different varieties we trial resist the spread of diseases and respond to various weather conditions.
Flooding
The extreme rain event mentioned above caused widespread damage and crop failures across our farm. We used the aerial imagery to better understand how widespread the flooding was, where it was most prominent, and how it retreated over the following weeks. We will use this information as we consider how to best manage our land and if/how it might make sense to reconfigure our fields.
Educational & Outreach Activities
Participation summary:
In year one, we demonstrated the data collection tools to area farmers to educate them on our planning and processes. We shared with our email newsletter and social media subscribers the project details and progress reports throughout the season.
In year two (due to COVID), we participated in a series of video and virtual tours to farmers, educators and consumers of our farm including a zoom-based question and answer field day session. Specifically to farmers, we educated participants through a video about the studies and work we were doing, the technology used and the information gathered. The benefit of being on video was a visual representation of the tools and fields to a wider audience than might normally attend a field day in person.
As this project feeds into subsequent research projects (i.e., Lake County Community Compost and Food Waste Reduction pilot project and a study of the benefits of a more intensive cover cropping rotation) this season, we will continue to share the techniques and technologies used with participants of these projects. Participants include farmers, growers, governmental bodies, private organizations and non-profits.
Learning Outcomes
Through this grant, we learned that access to relevant, site-specific information is an important tool to analyze the causes and effects of various situations on our farm. The aerial imagery collected over the course of the past season illustrated the spread of disease, the breadth and resilience of weeds, and the extent and impact of flooding. Weather station data provided insight into macro-trends and micro-trends. For instance, these objective tools better informed us of when we need to start looking at various field activities (rather than when we felt we should) and gave clues and insights into why crops performed the way they did (rather than guesses). Some specific examples of what we learned over the course of the 2019 season can be found in the Research Results and Discussion section.
These are new tools for our farm and there have been a number of successes and challenges. We have learned a lot about how best to use them and how they can improve what we do and how we can better tell the story of our work. In addition to the research we are continuing to do we have also been able to share our farm with our customers and community in a whole new way. One example was the flooding we experienced last September. After all the rain we received an outpouring of concern. Because we had access to weather data and aerial images illustrating the breadth of the flooding we were better able to convey what happened and how it was impacting our crops with both data and images supporting each other.
The impact of extreme weather events is varied and complex, and as many farmers already know, it's useful to look at impacts through a variety of lenses and data sets. Extreme weather events cause stress on crops which manifests in different ways per crop severely impacting overall crop health, viability, flavor and postharvest quality. It can be challenging to track all of these factors across a wide variety of crops. Therefore, if looking to correlate weather and the success/health of a crop farmers should pay particular attention to one crop group (e.g., broccoli) or one succession (broccoli in the heat of the summer, or that grew through a wet spell) per season to allow time to deep dive into the various impacts of weather. Over time this will allow farmers to see commonalities in the correlation between weather and crop performance.
Additionally, the predictive signs and trends depend on these deep dives into the various issues per weather event which also differ in their makeup (i.e., no two weather events are exactly the same). A key takeaway is to think about the information into two key categories:
1) Action-Oriented Data - information that allows us to make better decisions during the growing season, and
2) Planning Data - information that we can look back on to determine factors in the success or lack of success of crops when reviewing the past season.
Action-Oriented Data
Defined as information that allows us to make better decisions during the growing season:
- Weather Station Data:
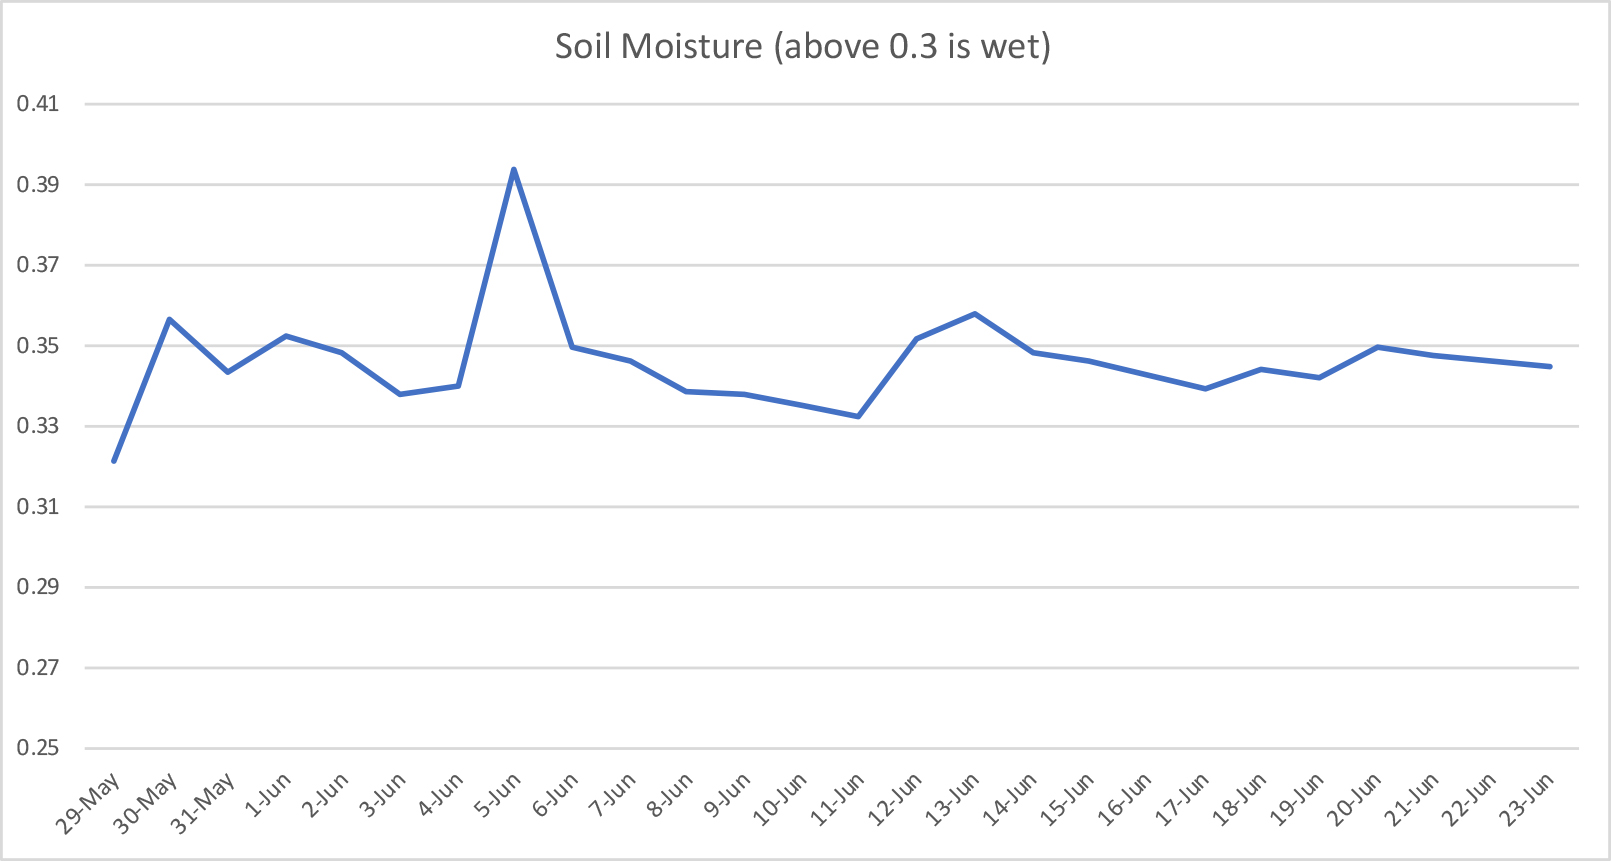
- In addition to visual cues and “hands-on” data points, the soil moisture and rainfall data allow us to make more accurate decisions about when to complete field activities (planting, tillage, cultivation, irrigation, etc.) and when to hold off and put the soil’s health first.
- Drone Imagery:
- As opposed to walking and re-walking fields in multiple directions and some amount of guesswork, aerial videos provide time savings as they provide useful larger-scale data that complements and builds on what we can collect from the ground level. Some examples include:
- Instead of sending tractors or farm crews into a field, farmers can use aerial images to better assess the extent of weed pressure and better determine the best tool(s) to use and/or whether it's able to be controlled and/or might jeopardize the success of a crop.
- Before spending money and time on additional re-seeding efforts, farmers can use aerial images to assess the germination of cover crops and consider whether location-specific reseeding efforts could be more efficient.
- Furthermore, aerial photos are useful in seeing the health, disease pressure and variety differences in crops because you can see plantings as a whole in one view.
- As opposed to walking and re-walking fields in multiple directions and some amount of guesswork, aerial videos provide time savings as they provide useful larger-scale data that complements and builds on what we can collect from the ground level. Some examples include:
Planning Data
Defined as historical information that may be referred to determine factors of crop success or failure when reviewing the past season.
- The ongoing automatic temperature and humidity data logs (as opposed to keeping written logs) are helpful touch points (in addition to those mentioned above) when striving to identify factors leading to plant disease. In addition to the tools purchased, we would recommend farmers consider adding a leaf wetness meter to add an additional, automated data collection tool.
- The observations we’ve made (and continue to make) through the drone imagery supported by the weather data are providing valuable information as we develop and improve crop and field rotations. This information is allowing us to see the nuances of how different fields hold water and when they are dry enough to be able to grow consistent crops. We are using this information to classify different areas of our fields into groups that are reliably available at different times of the year. These groups are in turn being used to decide what crops get planted when and where. This is an ongoing process that continues to evolve as we observe the impacts and repercussions of various weather events.
Most of the challenges we experienced were related to using new technologies. We had a learning curve with the drone finding the best height, speed, angle and when to use photographs versus videos to capture what we wanted. As we look forward to the second year of the grant we will be developing a more standardized process to make these variables more consistent. The weather data is collected automatically, however, we are still learning the intricacies of configuring the logger to collect the right amount of information for our needs. It also took some experimentation to put the various data points together and use that information to draw conclusions.
This project demonstrated the need for patience and additional time for experimentation when transitioning to new measurement tools. Just as farmers need additional time, practice and patience to integrate new implements into the farm’s workflow, we have found this is also the case for these tools. We look forward to continuing to learn and become more predictive as we learn more about the tools and data.
Beyond integrating the regular use of these measurement tools into our workflow, we will continue to adjust how and when we review, analyze and then integrate the data into our crop and field planning process. We would recommend farmers consider each measurement tool and who is responsible for consistent measurement and data collection, and wherever possible automate/standardize the data collection process so there are fewer decision points.
Our action-oriented data saved us hours in moving around our 40 acre farm. As opposed to checking on field conditions too soon, we used the data collected to better predict the ideal timing of field activities (i.e., capturing data on the rates at which soil was drying). We better prioritized work based on the data for soil conditions and we feel better making the hard decision when to terminate a failing crop based on data collected in both imagery and through the weather station (e.g. how quick/slow soil is drying, weed and/or disease pressure, humidity levels, etc.) While there is no replacement for boots on the ground, these data points aid in making more objective decisions using a more complete picture of what is and has happened.
Our farm’s viability depends on economic, social and environmental factors. As climate extremes continue to affect our outdoor growing environment, we seek to embrace technical solutions and tools to help us learn, adapt and protect the quality of our crops from the extremes. This takes the form of investing in hoophouse structures to protect key crops, technology to better track planting, harvest and yield data, and access to objective data that allows us to make better decisions and become smarter growers. While there is similar weather information available through various sources such as the National Weather Service, we have found that our proximity to Lake Michigan means that both precipitation and temperatures can vary widely between their nearest reporting site and our farm. We found highly detailed, place-based data is important to our learning how to better work with the land and soil conditions and not against them. There is also value in having the information easily accessible.
We realize the future of our farm’s viability also depends on technology tools to help us manage smarter as well. For instance, we program alarms and notifications to our weather station to prevent potential crop loss in both our hoophouses and greenhouse due to both hot and cold temperature extremes. We also have alarms for wind so we are sure to close structures to prevent damage. We will use data on growing degree days and leaf moisture reading to watch for pest and disease outbreaks. Our viability will continue to rely on learning about new pests, diseases and being proactive in the prevention of diseases.
We believe our viability also depends on the viability of other farmers, and thus we will continue to openly share information. We plan to register our weather station with Cornell’s NEWA network to share information and utilize their models to forecast pest and disease pressure.
We see a large potential for both these technologies to work together and independently to benefit sustainable farming. As we move forward and build a better understanding of their strengths and weaknesses we will begin to share this information with other farms and advise them on how these technologies could fit into their farms to address challenges they might be having.
Summary Lessons Learned and Recommendations
In summary, these are lessons we share with farmers and growers:
- We found having two sets of data sources is useful, but at times duplicative. We would recommend using the two sets of data for different uses.
- Synergies were found in data correlation when looking for larger trends or to answer certain hypotheses about disease pressure or fertility needs.
- These tools are also useful for additional reasons: proactive temperatures control within hoophouses and greenhouses, watching weather trends, sharing the importance of moisture levels within soils with others, using data to better predict the timing for farm tasks and the potential for disease pressure.
- When extreme external factors come into play (e.g., global pandemic), we found consistently gathering data was challenging for farmer-dependent tools, whereas we saw the benefit of automated data logging and capture tools that didn't require a farmer's time.
- We found the scalability and flexibility of the technology tools an essential aspect for the tools to grow with our knowledge.
- We’ve found that our work is more predictive and less reactive due to additional information.
- Aerial imagery captures new pieces of information that you didn’t realize you could find useful (e.g., finding trends within plantings).
- Consider the time available to maintain your technology (e.g., to maintain drone license, a yearly certification is required).
- We would recommend shared or collaborative purchasing of equipment and share data between farmers.
- The cost for maintaining both pieces of technology is relatively low. For continued commercial use, the aerial drone license fee of $150, along with passing a safety test, is required every two years. We also foresee costs in replacement batteries (approx $185). However, over the course of two years, we have not seen any noticeable decreases in battery life. Thus far, the only ongoing cost associated with the weather station was the addition of sensors. Most sensors are in the range of $150-200. We’ve decided to invest in additional sensors to track temperatures in our greenhouse and hoophouses, and we invested in a leaf moisture sensor to begin to better predict disease outbreaks. In our experience, the most useful sensors have been, temperature, humidity, rainfall, and soil moisture.
- Time Requirements:
- Learning
- FAA License - I spent about 10-15 hours over a couple of weeks to feel prepared for the test. After completing the test I felt like I may have been a little over-prepared. This is only required for commercial operations.
- Drone Operation - The drone we use has a “training mode” that limits the height and distance from the operator. I spent 1-2 hours in this mode getting a better sense of the controls before taking it out on a full flight. After that, it was mainly a process of learning the finesse of the control to make smoother turns and adjustments. There are quite a few modes and settings you can use to make flying safer (height limits, distance from operator).
- Ongoing
- I aim to fly drone every other week throughout the growing season plus additional flights depending on conditions. Each flight was about 30 minutes plus 15-20 minutes for set-up and putting everything away. I am generally on my own while flying, however, if you are trying to cover a more extensive range or an area with lots of obstructions you would want a helper to maintain line of sight with the drone.
- Reviewing the information generally took an additional hour depending on the amount of detail I was looking at. Whereas the timing of the flight is dependent on conditions and farm work the review of the information is very flexible.
- Field observations fit into the regular field walks we do to stay on top of our farming operations and didn’t add much time. Many times these observations were more productive because we caught things in the drone flights that called for additional investigations.
- Learning
- Our recommendation to farmers would be to standardize the data collected to ensure comparing and contrasting opportunities in the future. We found the sweet spot for data collection on our farm was to fly at a height of 80-100’ above ground to receive the best combination of detail and scope. We also began taking three different views: 1) a bird's eye video flying at ~100’, 2) a bird’s eye photo, and 3) a photograph looking straight down at a height to capture most of the field/planting. Three different views gave us the most useful information.
- Given the drone’s abilities, we tested various aspects of data we could collect. While we initially focused mainly on using the drone to create videos, we gradually shifted to using the drone to capture more still images from above. While videos are useful we would recommend farmers consider still images to capture clearer images and to observe detailed aspects of images through the ability to more easily focus and zoom.
- A filter for the drone’s camera is required to get usable video and images without and wobble. We found ND8 filter to be the most versatile and cost-effective. If purchased as an aftermarket add on the ND8 filters are not too expensive and can be found as a set with multiple different filters which can be useful for different types of light conditions.
Project Outcomes
We see additional research potential in having accessible technology available. We are determining the outcomes of different production practices using these tools and create different studies based on what we learned was possible with these technologies.