Final report for FNC21-1264
Project Information
Tenth Street Orchard grows strawberries, blackberries, and apples on 8 acres in central Kansas. We have always tried to be good stewards of the land and implement practices that are beneficial for soil health and resource conservation. We have used drip irrigation to help with water conservation and have also used cover crops extensively following strawberry harvest.
Production of strawberries in many parts of the country has moved away from a perennial matted-row system to an annual plasticulture system. An annual plasticulture system has the potential to produce higher yields of strawberries, but requires more frequent soil tillage and higher input costs. Soil tillage increases soil erosion, alters soil biology, and reduces soil quality over time. This project tested a combination growing method in which strawberries were grown for the first year on plastic mulch and subsequently retained for a second year using matted-rows. For plants that were retained for a second year we compared rows in which all plants were retained and runners removed throughout the summer (crown treatment) and rows in which plants were alternately removed from the row and runners allowed to fill in over the summer (runner treatment). We compared the second-year crown and runner treatments to annual plasticulture rows (annual treatment). We compared overall yield, strawberry size, and soil health between the combination method (crown and runner treatments) and annual plasticulture method (annual treatment).
Overall yield was highest for the crown treatment rows, followed by the runner and annual treatment rows. Similarly, average berry size was highest for the crown treatment rows. Soil organic matter ranged from 3.2 - 3.8% on the field and was similar between all treatments over the course of the study. Soil respiration and soil health scores increased over time for all treatments. Both soil health and soil respiration values were similar for all treatments at the beginning of the study but were highest in the annual treatment by the end of the project. The crown and runner treatment rows had higher values for percentage soil fungi, while the annual treatment rows had higher values for soil bacteria. This may have been due to reduced tillage in the second-year rows.
The study took place in a relatively poor growing season for strawberries in our area. The strawberry size and overall yields observed for all treatments were much lower than what we harvest in a normal year. In this case, the advantage of using a second-year production method is that growers would have an opportunity to recoup some of the investment lost during a poor year. Our findings suggest that it may be worth trying a combination production method if labor is available for summer weeding and row maintenance following the initial harvest and removal of plastic mulch.
- Evaluate the yield of a combination plasticulture / matted-row strawberry production system.
- Compare measurements of soil health for a combination plasticulture / matted-row strawberry production system and an annual plasticulture system.
- Share findings by hosting a field day with the regional Growing Growers apprenticeship program that promotes sustainable agriculture throughout south-central Kansas; hosting a workshop for county FFA clubs, presenting results at the Wichita Local Food Producers conference, and demonstrating production methods using videos on social media and farm website.
Research
Chandler, Flavorfest and Liz strawberry plugs were planted in September 2020 into plastic mulch in 12 rows that were each 150’ long. Within this field, 20’ end segments on 12 rows were randomly assigned the following experimental treatments.
- Annual plasticulture treatment: Four rows were mowed, plastic removed, soil tilled and planted to a sorghum-sudangrass cover crop. Cover crop residue was incorporated using a 5' rotary tiller in early August 2021. These rows were replanted to strawberries on plastic mulch in September 2021 using the same spacing and varieties. Liz was no longer available from our supplier, so only Chandler and Flavorfest varieties were planted.
- Combination plasticulture/matted-row runner treatment: In June 2021, four rows were mowed, plastic removed, and alternating strawberry plants were pulled to provide room for runner establishment and appropriate plant densities. These strawberries were weeded throughout summer and retained for second-year harvest.
- Combination plasticulture/matted-row crown treatment: In June 2021, four rows were mowed, plastic removed, and crowns thinned as needed. Runners were removed throughout summer and plants retained for second-year harvest.
All rows were covered with 1.25 oz row-cover from early December 2021 to mid-March 2022.
Strawberry size and total yield were determined for each treatment in May-June 2022. Data was collected on the middle 10’ segment of each row to reduce inter-plot interference and edge effects.
A Haney soil test was used to determine pH, organic matter, soil respiration, organic carbon, and a soil health score for each treatment. A phospholipid fatty acid (PLFA) test was used to measure percent fungi, percent bacteria, total microbial biomass, functional group diversity, soil predator:prey ratios, and fungi:bacteria ratios. Soil samples were taken on June 25, 2021 (initial sampling), September 23, 2021, and June 23, 2022 for each of the three treatments. Soil was taken from each of the treatment rows and soil was mixed before submitting a sample for each treatment for soil health analysis.
Soil Biology
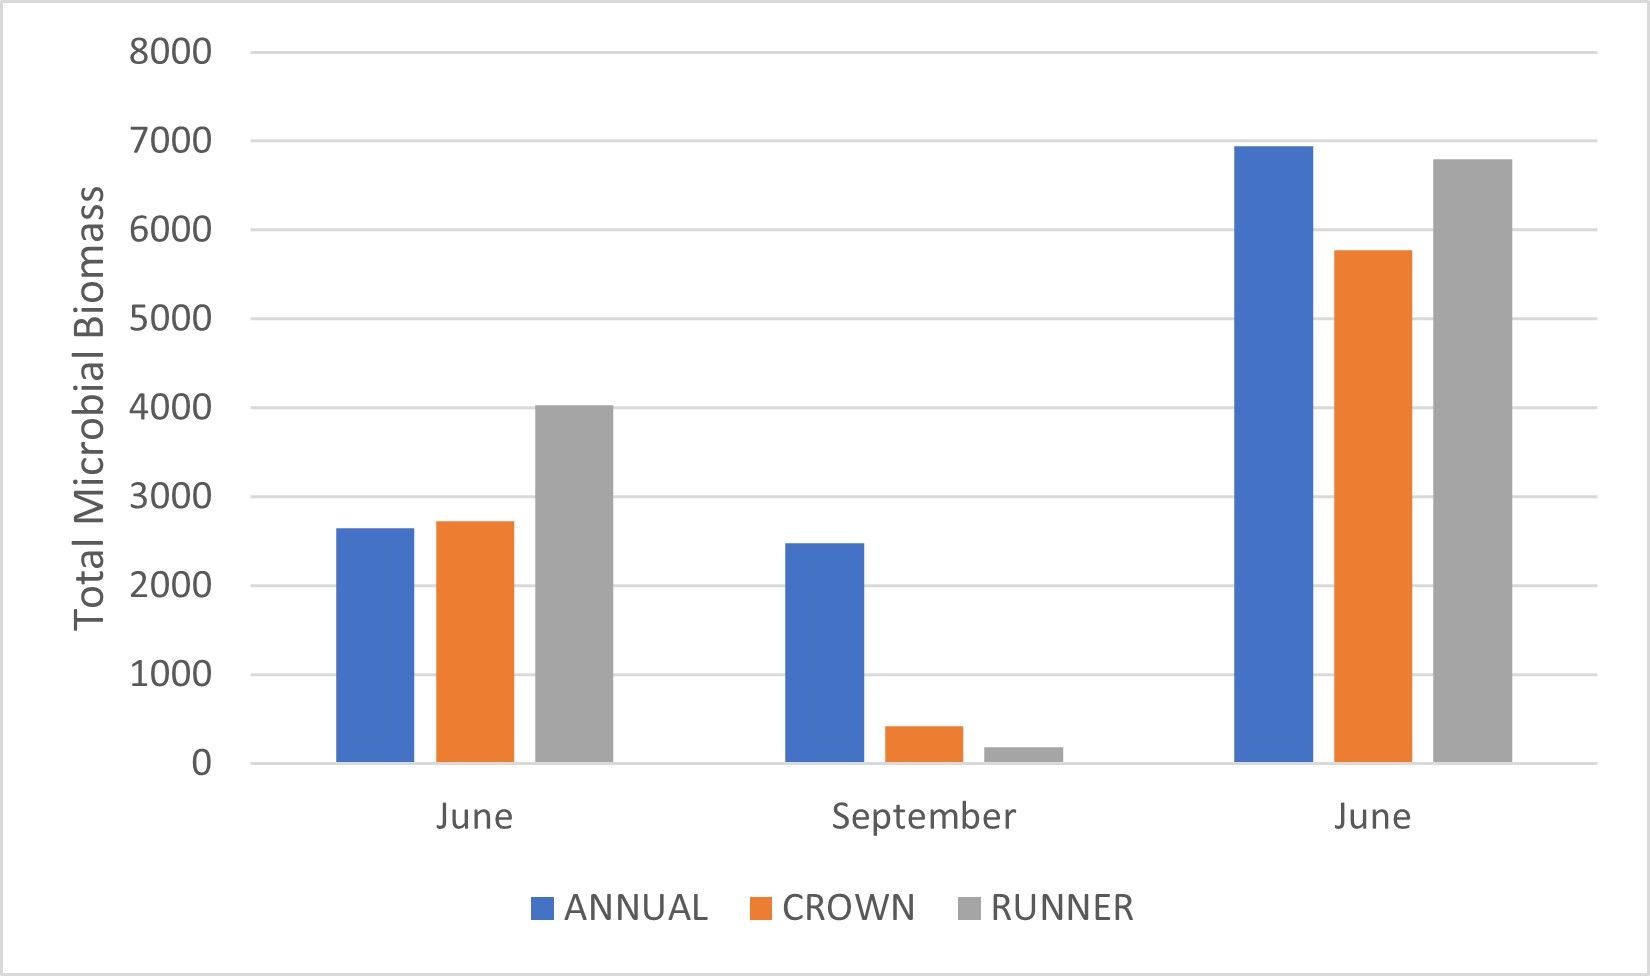
Total microbial biomass (Phospholipid Fatty Acid - PLFA ng/g)
Total microbial biomass measures the living microbes within the soil by analyzing the quantity and types of phospholipid fatty acids (PLFA) (which are from the cell membranes of microorganisms) that are present in a soil sample. Over 4,000 ng/g is considered excellent and less then 1,000 ng/g is considered poor. The highest levels of microbial activity that we observed were in June following harvest. It is possible that the lower levels of total microbial biomass that we observed in September was due to a seasonal effect. The higher levels observed for the annual treatment was probably due to a spike in bacterial activity as the summer cover crop residue was being digested after being tilled under during August.
For the microbial community, the total microbial biomass decreased for both of the second-year treatments (crown and runners) from June 2021 to September 2022. For the annual treatment, there was a similar microbial biomass in June and September. Total microbial biomass increased for all treatments by the end of the study.
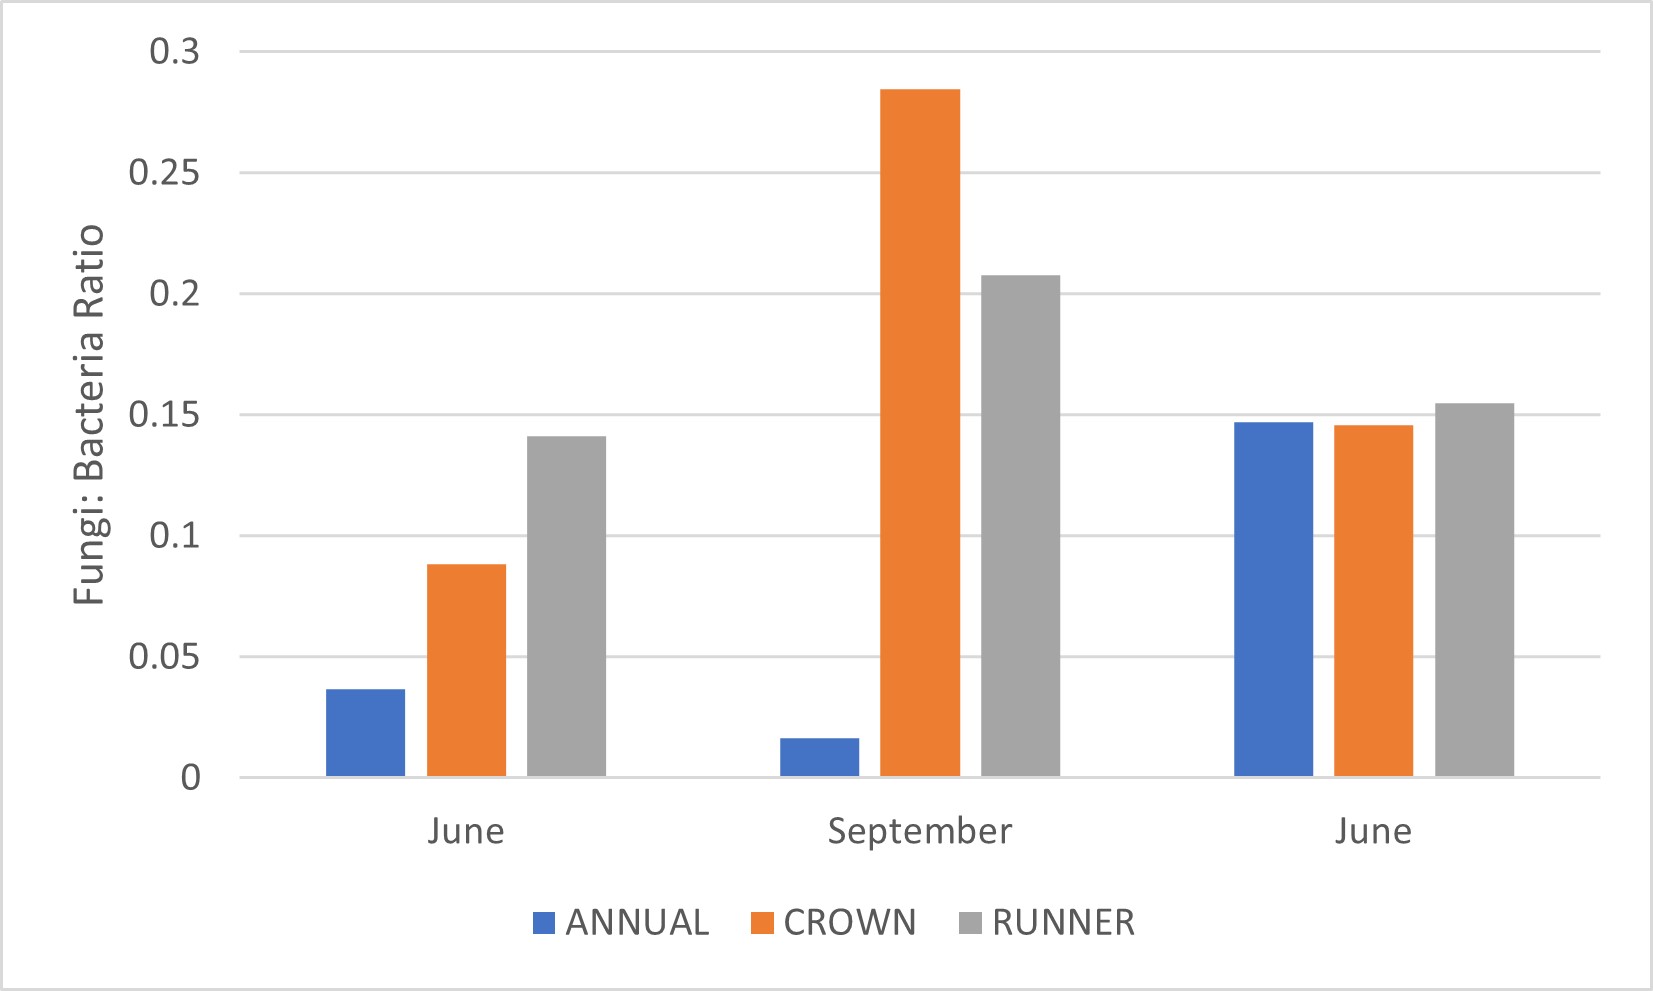
Fungi:Bacteria Ratio
The ratio of fungi to bacterial biomass in the soil is an indicator of soil health. Soils that are excessively tilled, compacted, or disturbed will typically be dominated by bacteria. A ratio of over 0.25 is considered to be a good ratio. Our soils were typically below that level for all three treatments. The highest levels were found during September for the crown and runner treatments after a period of no tillage over the summer growing season. The fungi:bacteria ratio was lowest for the annual treatment during June 2021 and September 2021, this may have been due to soil tillage that shifted the soil community to a more bacterial dominated state. The final sampling period showed similar levels for the annual, crown, and runner treatments. At this point no treatments had been tilled for >9 months which may have allowed the fungal community to recover.
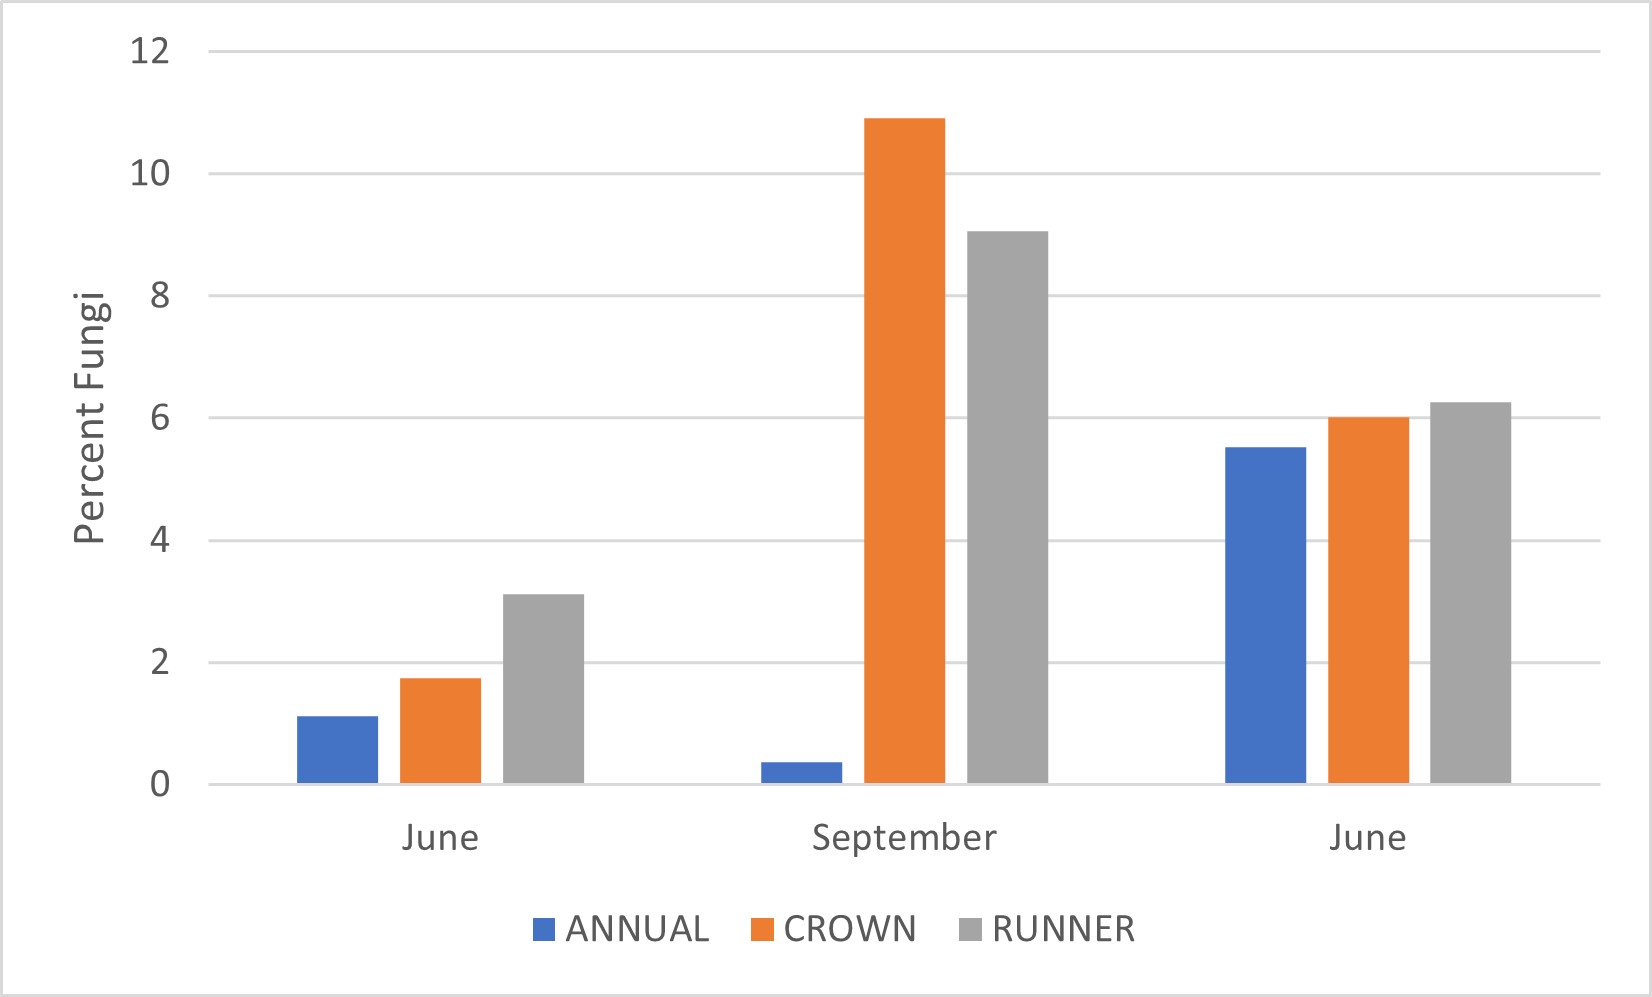
Percent Fungi
All treatments started with a relatively low level of fungi. The September sampling period exhibited an interesting effect, these samples were taken following tillage of a summer cover crop and you can see that tillage had a strongly negative impact on fungi within the soil (the lowest level was observed in the annual treatment) and increased the amount of bacteria in the soil. However, you can also see that by the following June the soil fungi had recovered to the point where levels were similar across all treatments.
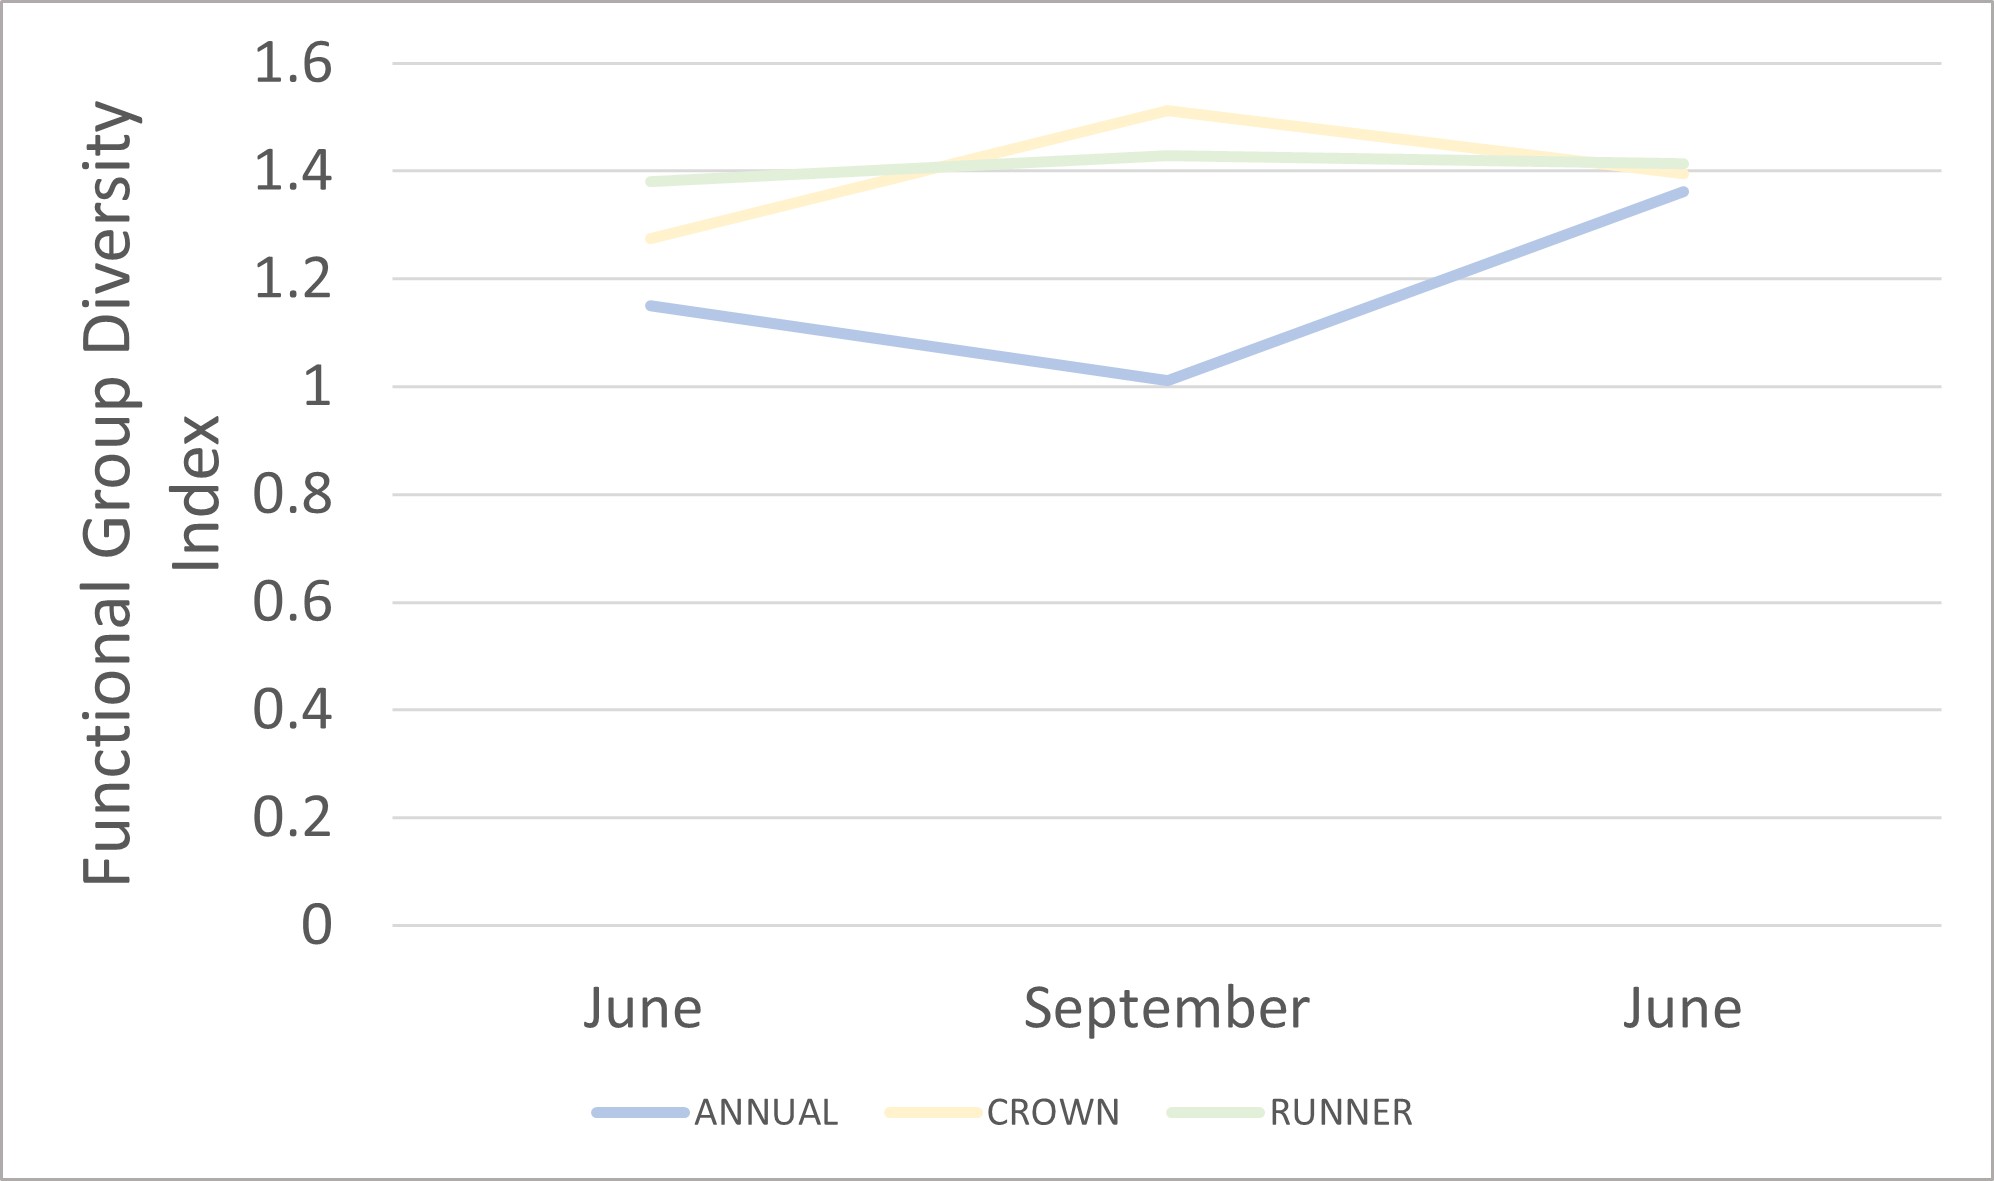
Functional Group Diversity Index
This index measures the diversity of different functional groups of microbes that are present in the soil. Values greater than 1.3 are considered above average. The crown and runner treatments followed similar trends and were both slightly above average throughout the study. The annual treatment was consistently lower and this could be because some types of soil microorganisms may be more sensitive to soil disturbance and slower to recolonize following tillage.
Soil Chemistry
Percent Organic Matter
Typical soil organic matter ranges between 1-6% on agricultural land and there are great benefits to increasing soil organic matter. Increasing organic matter may help make nutrients more available to plants, improve the soil structure and water storage capacity of the soil, promote carbon storage, and reduce soilborne disease. Our treatments had similar levels of organic matter with little variation over the course of the study. The annual treatment had a slight peak in September perhaps due to the high biomass of cover crop that had recently been incorporated into the soil. While repeated tillage typically reduces soil organic matter, it is possible that our use of a sorghum-sudan grass cover crop helped to maintain organic matter for our annual treatment.
Total Organic Carbon
The total organic carbon increased for all of the treatments. The annual treatment had been planted to a cover crop which may have helped improve soil carbon and the second-year treatments may have sequestered soil carbon over the summer.
Soil Respiration
Soil respiration measures the activity of microbial biomass within the soil based on carbon dioxide production following drying & rewetting. A higher value typically means that there is a greater level of biological activity within the soil and greater potential for nutrient cycling. All of the treatments exhibited an increase in microbial activity by the end of the study. The absence of soil tillage from September - June could have allowed biological activity within the soil to increase for each of the treatments.
Soil pH
Soil pH ranged from 6.8 - 8.0 across treatment and exhibited little variation over the course of the study. The soil pH levels are slightly higher than recommended for growing strawberries.
Soil Health Scores
Ward Labs provides an overall soil health score that accounts for soil respiration, water extractable organic carbon levels, and water extractable organic nitrogen levels in the soil sample. Values greater than 7 are considered acceptable, with top scores being around 30. Soil health scores tended to increase for all of our treatments. Contrary to our hypothesis, the annual treatment had the highest soil health scores. For the annual treatment, the presence of the summer cover crop was probably responsible for the increase in the soil health score and organic carbon levels. For the second-year treatments, the soil health score may have increased due to a lack of tillage.
|
PFLA Test – Community Composition Fungi: Bacteria Ratios |
|||
|
Treatment |
June 2021 |
September 2021 |
June 2022 |
|
Annual |
0.0366 |
0.0164 |
.1471 |
|
Runner |
0.1413 |
0.2847 |
.1548 |
|
Crown |
0.0882 |
0.2079 |
.1456 |
|
PFLA Test – Total Living Microbial Biomass |
|||
|
Treatment |
June 2021 |
September 2021 |
June 2022 |
|
Annual |
2645.62 |
2476.1 |
6943.48 |
|
Runner |
4029.24 |
419.45 |
6795.97 |
|
Crown |
2729.17 |
183.78 |
5770.49 |
|
Soil Health Calculation |
|||
|
Treatment |
June 2021 |
September 2021 |
June 2022 |
|
Annual |
6.46 |
13.72 |
16.86 |
|
Runner |
6.29 |
9.34 |
11.9 |
|
Crown |
6.46 |
8.6 |
13.84 |
|
Total Organic Carbon (ppm C) |
|||
|
Treatment |
June 2021 |
September 2021 |
June 2022 |
|
Annual |
85 |
205 |
148 |
|
Runner |
103 |
156 |
147 |
|
Crown |
118 |
168 |
172 |
|
Soil Respiration (CO2 – C) |
|||
|
Treatment |
June 2021 |
September 2021 |
June 2022 |
|
Annual |
35.6 |
69.8 |
151.9 |
|
Runner |
27.9 |
46.6 |
69.9 |
|
Crown |
25.9 |
35.2 |
116.1 |
|
Organic Matter (%) |
|||
|
Treatment |
June 2021 |
September 2021 |
June 2022 |
|
Annual |
3.6 |
3.8 |
3.4 |
|
Runner |
3.3 |
3.3 |
3.3 |
|
Crown |
3.5 |
3.2 |
3.3 |
|
Soil pH |
|||
|
Treatment |
June 2021 |
September 2021 |
June 2022 |
|
Annual |
7.4 |
6.8 |
7.3 |
|
Runner |
7.7 |
7.7 |
7.9 |
|
Crown |
7.1 |
7.1 |
8 |
Yield Data
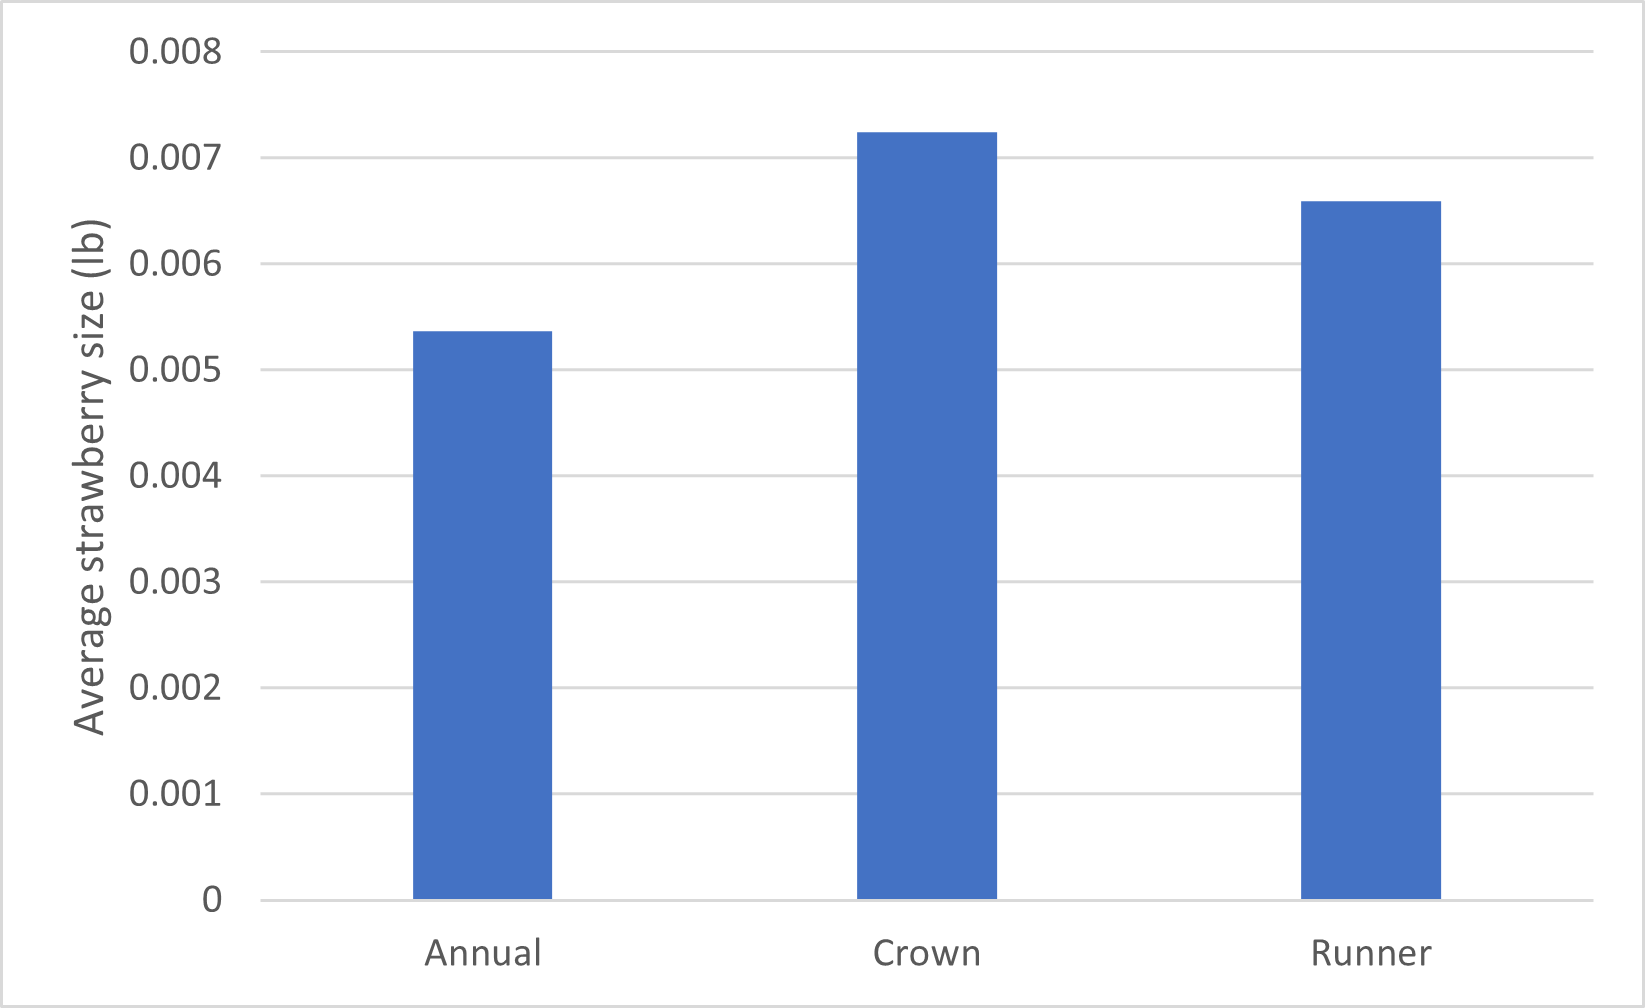
Strawberry Size: Contrary to our hypothesis, the overall berry size was slightly larger in our crown and runner treatments compared to the annual plasticulture treatment. However, it should be noted that the average berry size was relatively small for all treatments. This could have been due to a spring frost that reduced production in crown blooms.
Weekly Yield: The majority of our production was harvested early in the season, this is a fairly typical harvest pattern with production typically peaking during the 3rd week of May. We also waited a little longer than usual to start harvest so that we would have enough strawberries to weigh, so the first week yield included some strawberries that probably could have been harvested a little earlier in the season.
Weekly Yield by Treatment: All treatments had the same harvest pattern with an initial peak and subsequent decline. The 2nd year crown and runner treatments had a greater rebound later in the season, perhaps due to a slightly later bloom time for these rows.

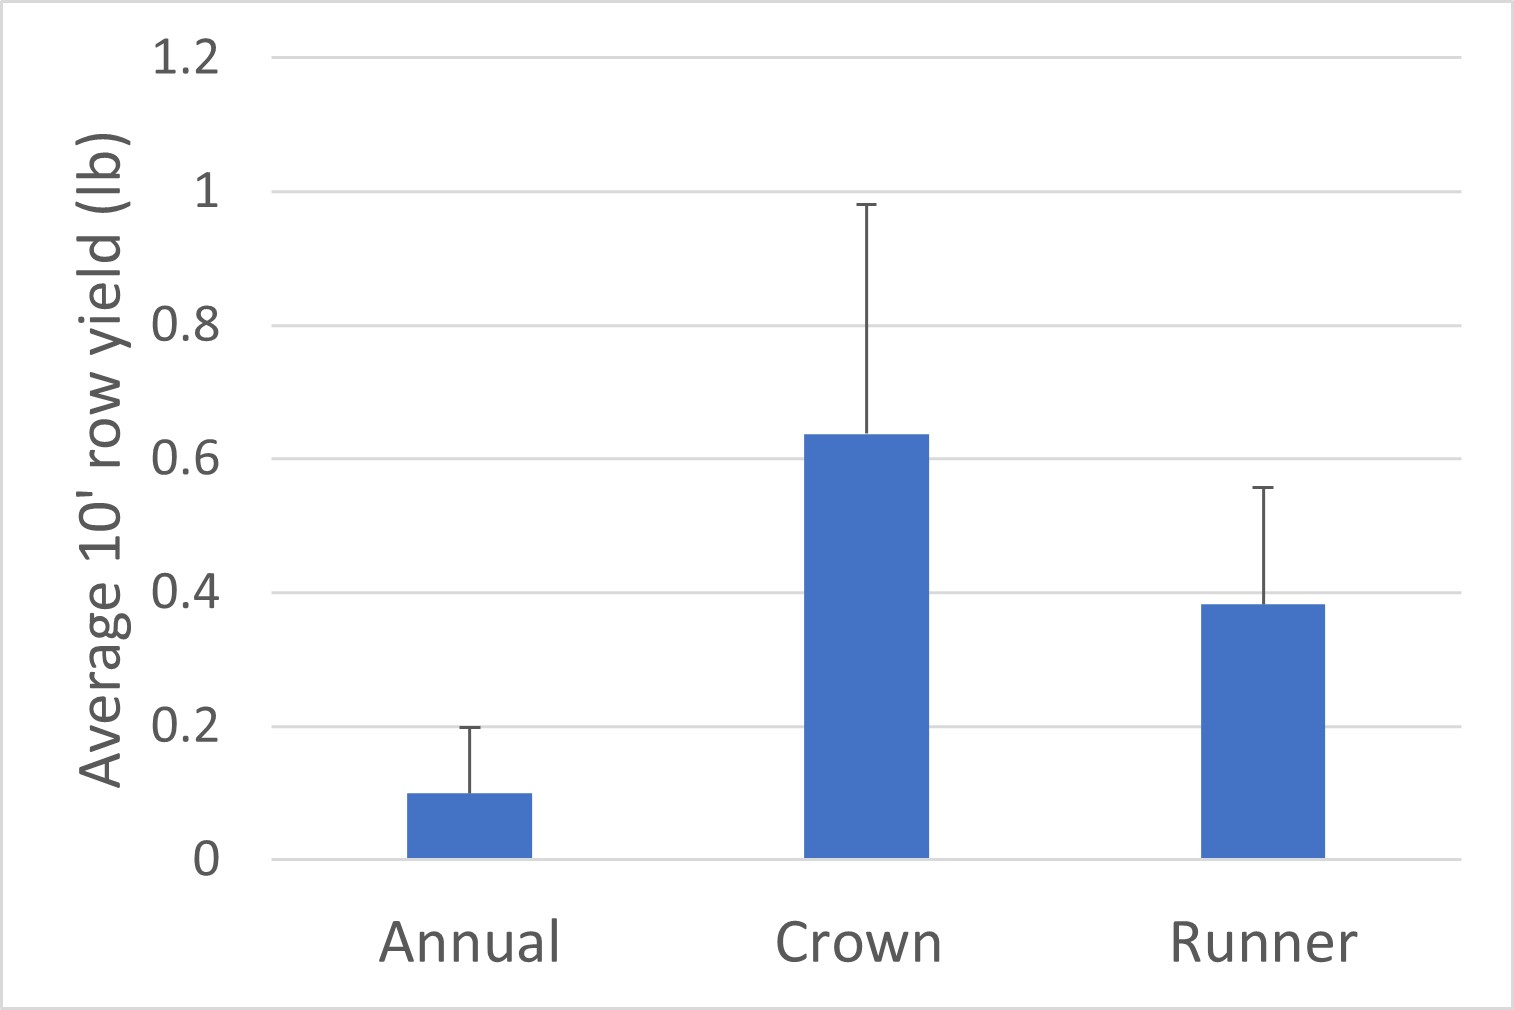
Average Yield: Both the crown and runner treatments had higher yields than the annual plasticulture treatment. However, it is important to note that overall yields for all treatments were very low compared what is typically harvested. This may have been due to a late April freeze and plant loss that occurred earlier in the season for the annual treatment.
Educational & Outreach Activities
Participation summary:
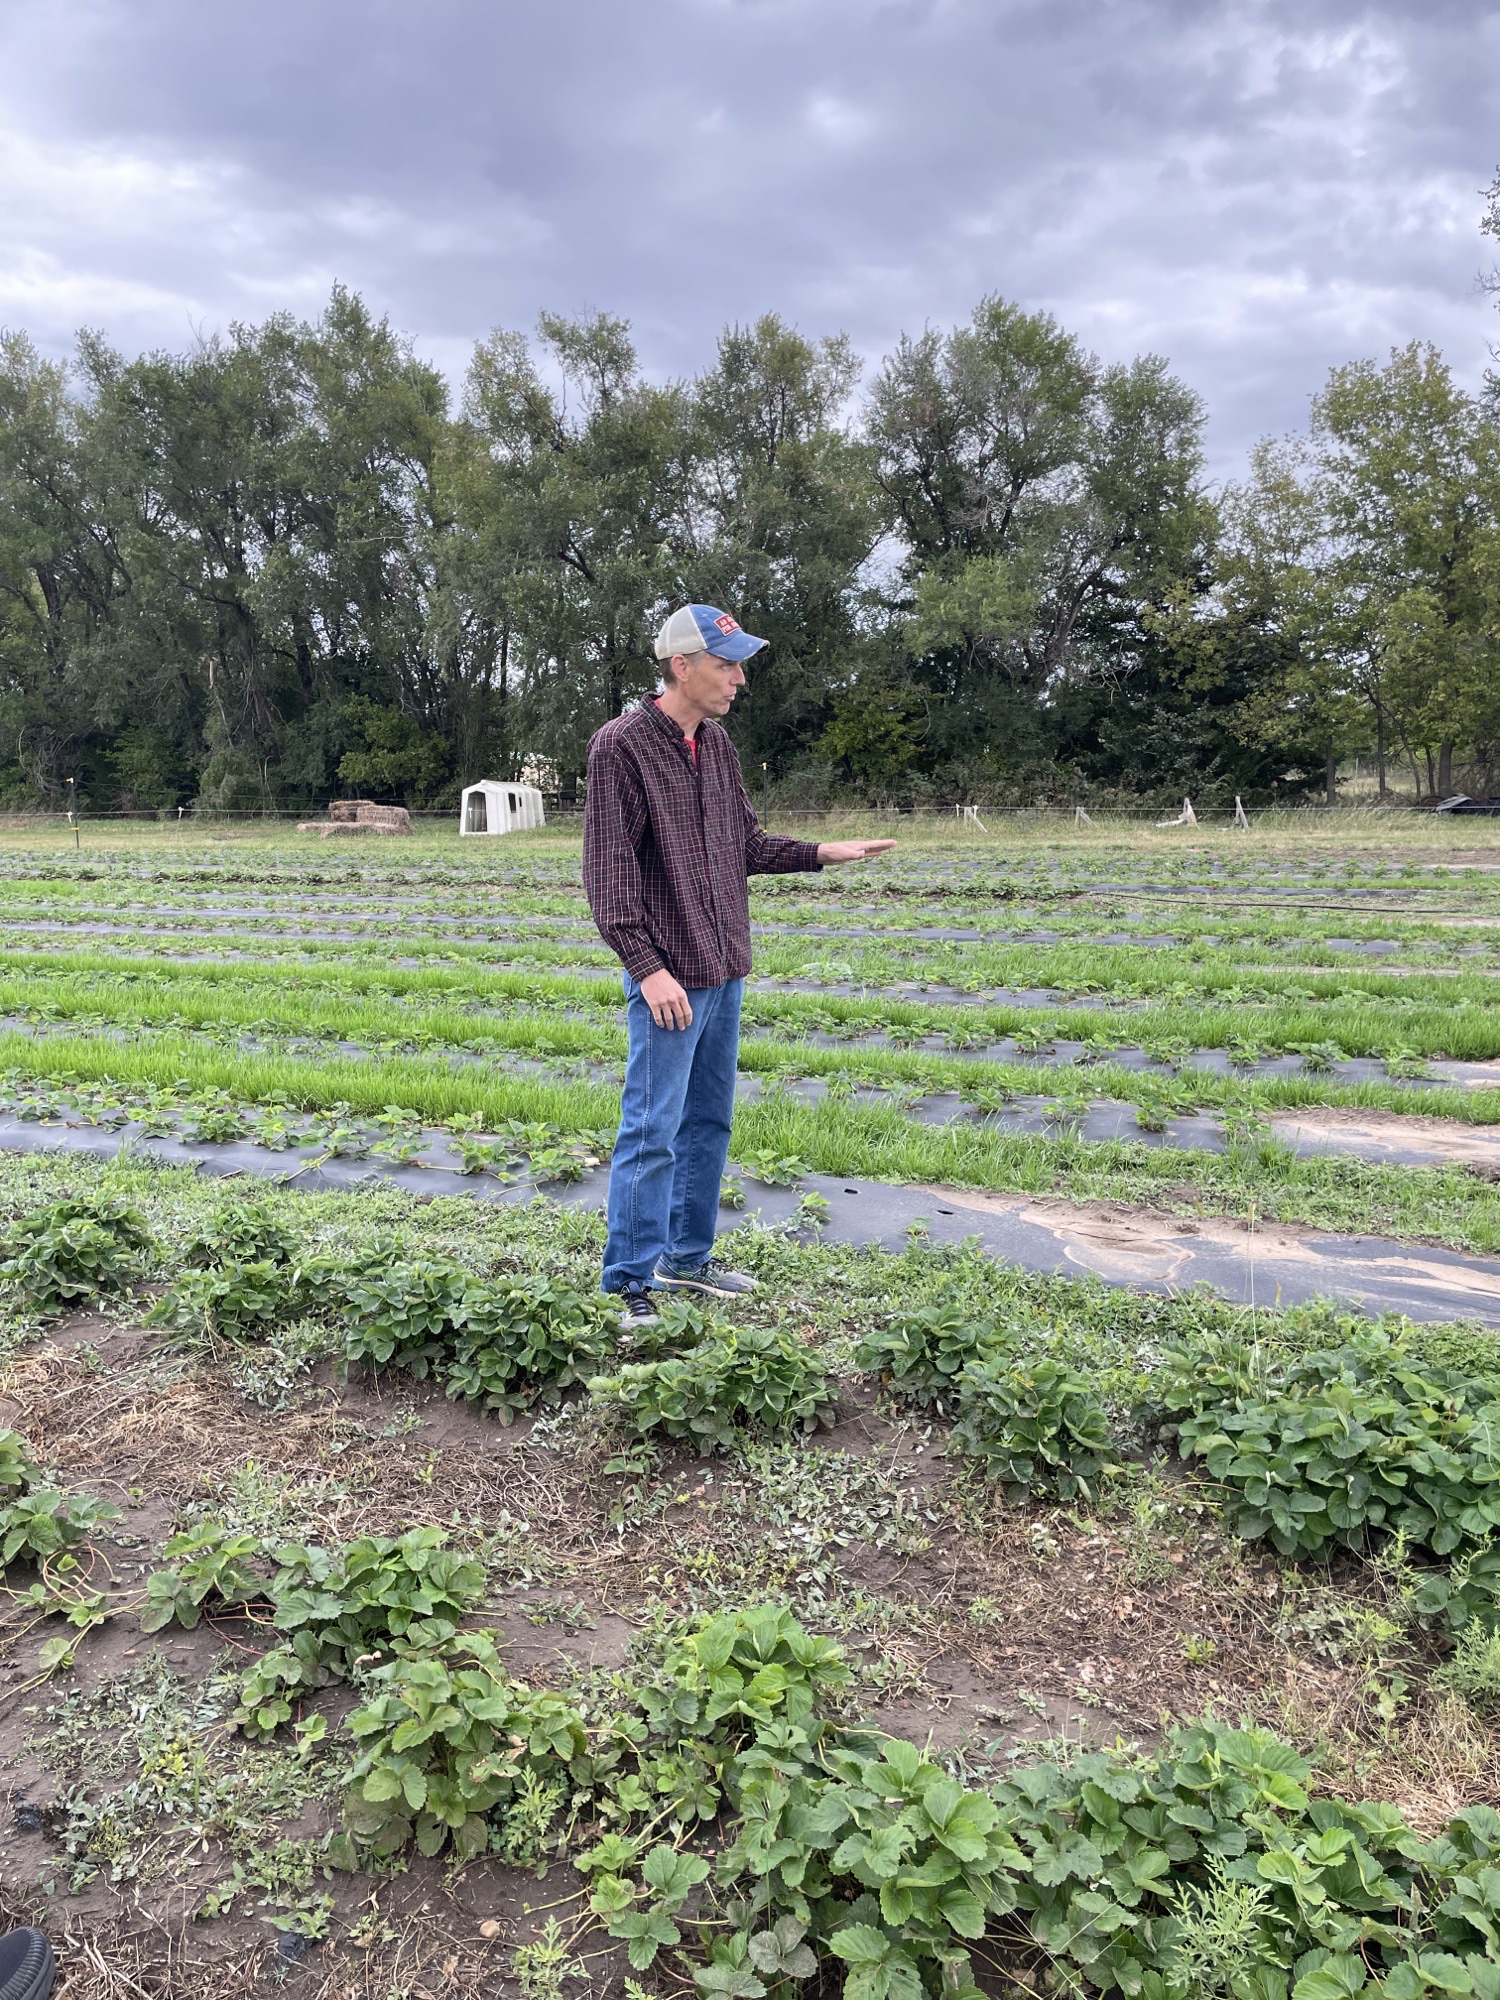
A field day to demonstrate the study design and strawberry production methods took place on October 2nd, 2021 at Tenth Street Orchard. There was a small turnout for the event, but the individuals that were able to attend had a good experience and learned a lot about the project. The attendees included a variety of aspiring growers and university/extension employees. The Kansas State University Growing Growers Program publicized the field event for individuals that were participating in their apprenticeship program. Tenth Street Orchard also publicized the event on social media.
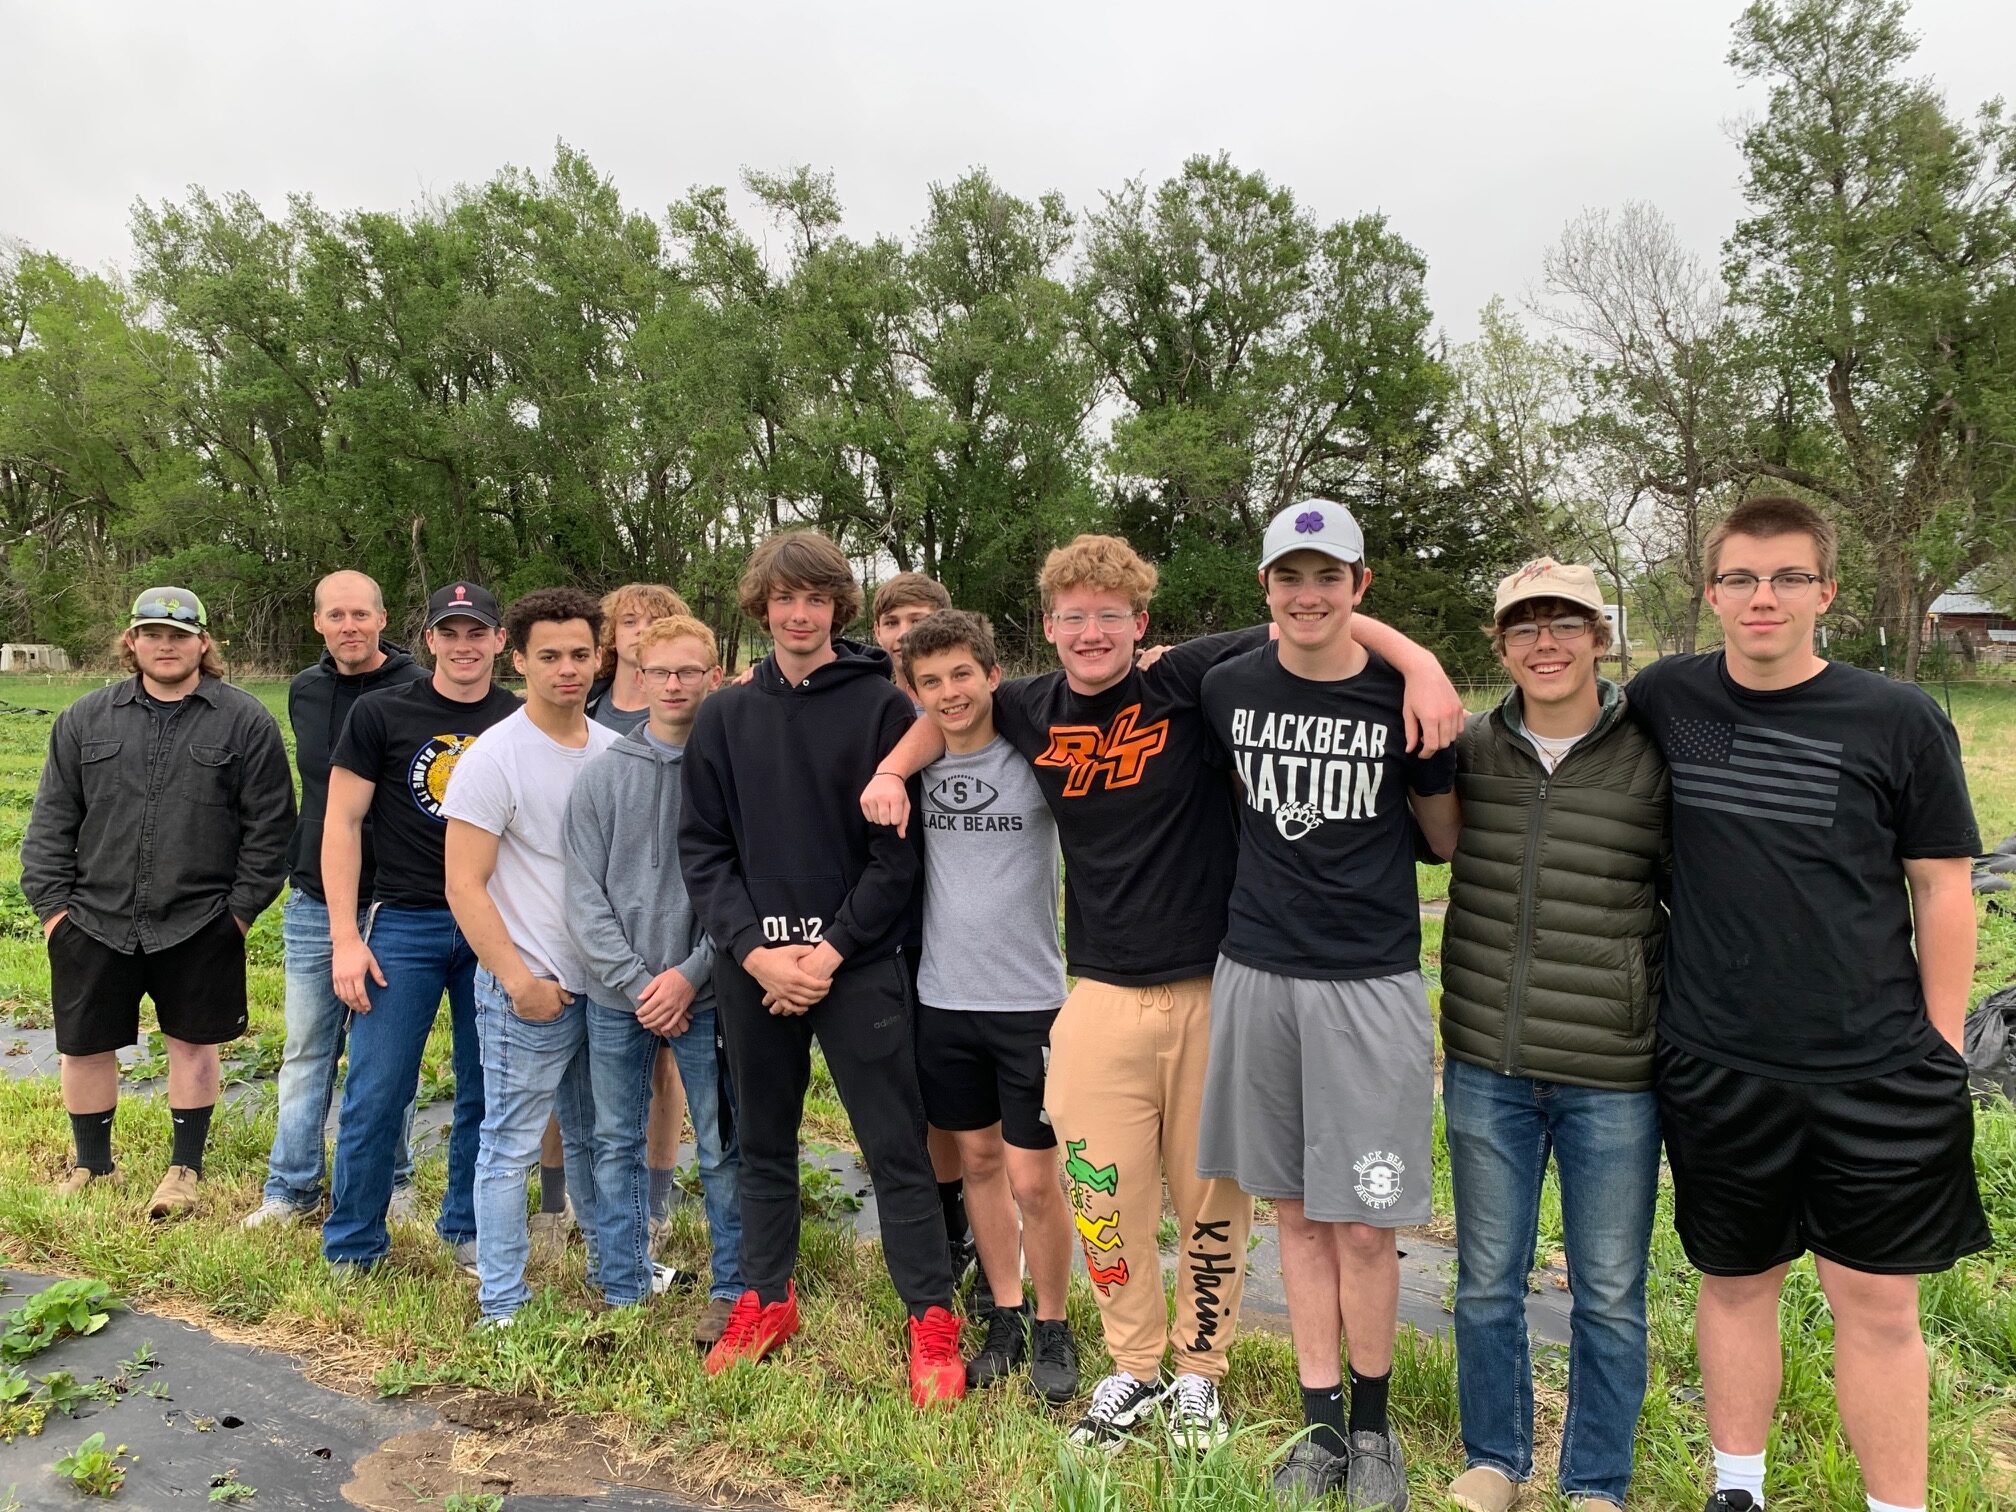
The Sterling High School FFA class visited Tenth Street Orchard for an informational tour in strawberry production methods on May 4th, 2022. The group included 12 students and 1 instructor. The students learned about strawberry production methods and soil health.
The results from the study were shared at the Wichita Local Food Producers conference on February 4th, 2023 in Wichita, Kansas. The presentation was titled "Strawberry production and profits: testing a combination production system". The presentation was well-attended by a number of farmers and specialty crop producers.
Learning Outcomes
The grant has been a learning experience that has had a positive impact on our operation. The data that has been collected has been useful to determine how our management practices are impacting soil health. We would encourage farmers to consider that different methods of strawberry production methods could be viable and that long-term thinking about soil health may be important to consider when deciding which production methods to implement.
For the second-year strawberry plants, we learned that the runner treatments varied greatly in terms of the number of runners that were produced by different varieties. We observed that the Chandler variety produced a greater number of runners than both Flavorfest or Liz. The rows with Chandler strawberries appeared to fill more quickly with runners. While this was beneficial in the runner treatment rows, this tendency resulted in Chandler rows requiring more labor for removal of runners for both the crown treatments and annual treatments. The second-year rows that did not produce runners quickly had a lot of exposed bare ground. We would probably consider adding a light layer of straw mulch to help reduce bare ground and suppress weeds until runners could become established. It might also be possible to delay removing plastic mulch until slightly later in the summer to avoid weed germination and reduce labor costs for second-year rows.