Final report for FNC21-1288
Project Information
Jared and Valerie Luhman have been farming in Goodhue, MN with Jared's father, Jon since 2015 and the Luhman family has been farming on this farm since the 1960's. Their farm mission consists of 3 goals: To leave the land in better condition and share knowledge with other farmers, build a resilient business, capable of providing for any family member who chooses to participate and produce high quality genetics and food for customers.
The farm consists of 700 acres. They have grown organic corn, soybeans, black edible beans, hay and pasture. They are currently transitioning their cropland from row crops to perennial pastures where they implement regenerative grazing practices to build soil health. They graze 230 registered Red Angus cows, and are Pharo Cattle Company cooperative producers. They market their bulls to ranches across the country through Pharo Cattle Company. Valerie and Jared have raised 1,000+ pastured chickens in 2018 and 2019. They sell pastured chicken, pastured pork and grass finished beef to customers through their business, the Grassfed Cattle Co.
Evaluating the impact of corn and soy feed versus corn-free, soy-free feed in pastured poultry production will allow us to understand the customer demand for corn-free, soy-free chicken and the impact it has on animal health, growth rates and meat quality. After direct marketing over 1000 pasture raised chickens in the Twin Cities, we were asked by customers to raise corn-free, soy-free chickens. Many customers choose not to eat pastured chicken because of food sensitivities caused by corn and soy feed. Our goal is to evaluate the differences between chickens fed the two types of feed while making and promoting ecologically, economically and socially sound choices. By assessing the animal health and growth rates between the two groups of chickens, we will provide research for other farmers on the economic viability of a corn-free, soy-free pastured chicken enterprise. Lastly, by understanding the differences in nutritional composition for human nutrition between the two groups of chickens, we will provide sound research for customers and a new market for farmers. We are committed to using sustainable practices, including moving chickens to fresh pasture daily, supplying feed from local growers and improving the quality of lives of farmers and the chickens.
Evaluate the impact of corn and soy feed versus corn-free, soy-free feed in pastured poultry production on the following three factors:
- Animal Health - Compare mortality
- Growth Rates - Assess the differences in feed conversion ratios, feed consumption and processed weights
- Meat Quality - Evaluate nutritional composition for human nutrition
Cooperators
- (Educator and Researcher)
Research
Three batches of chickens will be raised on Dry Creek Farms in Goodhue, Minnesota April 29-October 22, 2021. Each batch will consist of 600 and will be split into four groups of birds. Cornish Cross male chickens will be used because of their high feed conversion. All variables for groups one through four will be the same, except for types of feed.
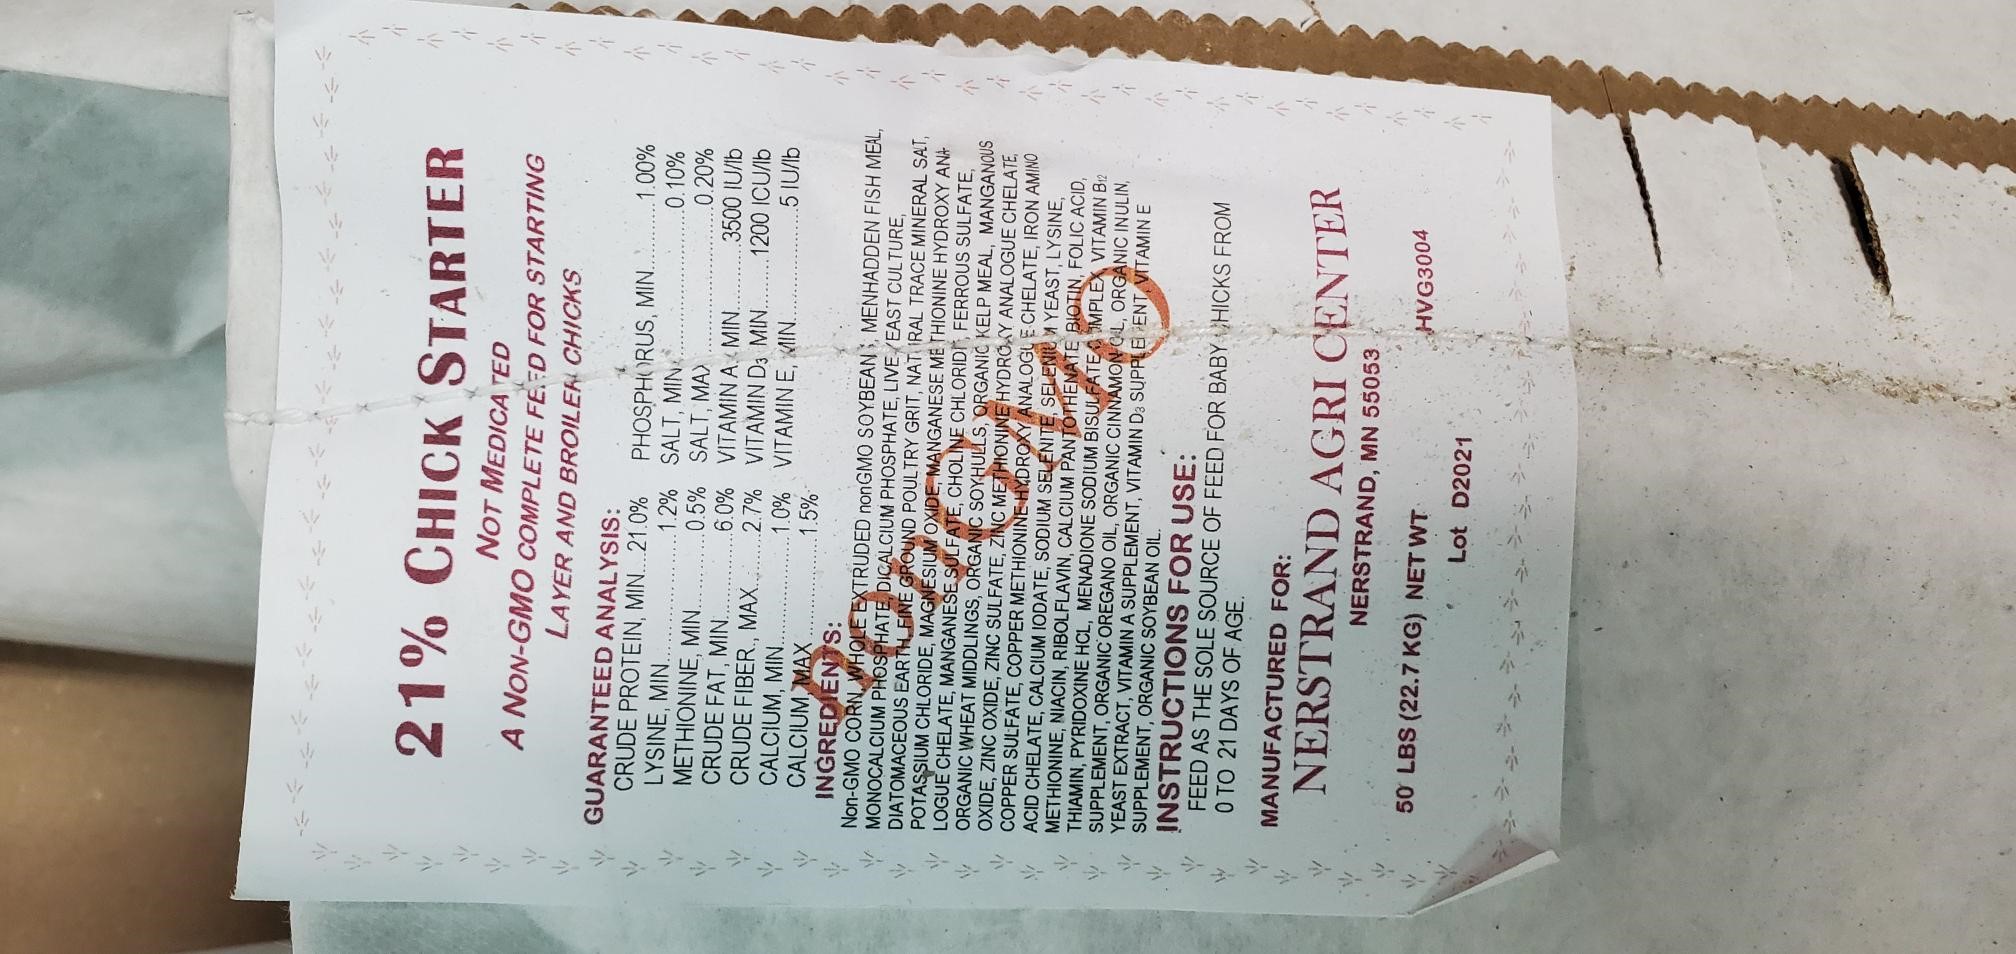
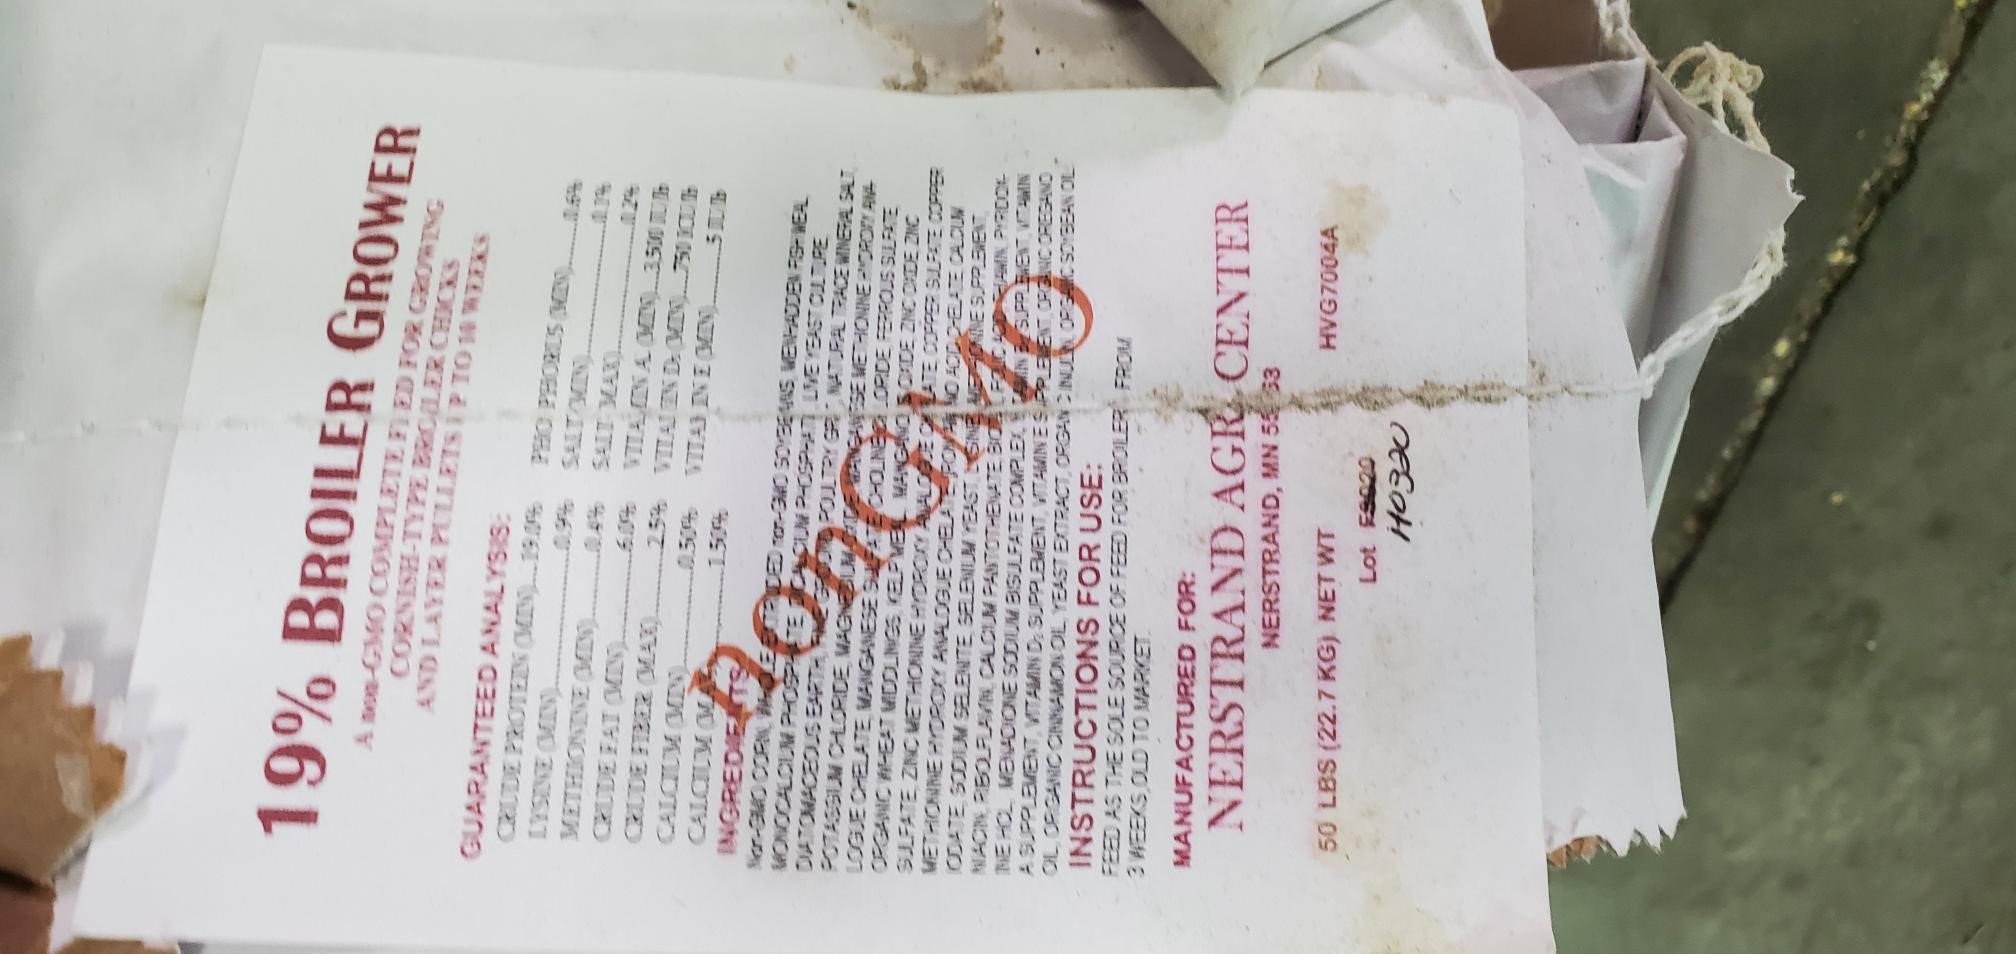
Photo 4 - Organic Broiler Grower
Groups one and four will be fed Nerstrand Ag non-GMO corn and soy starter (Photo 1) weeks one and two and Nerstrand Ag non-GMO corn and soy grower (Photo 2) weeks three through seven. Group two and three will be fed Hyview Feeds organic corn-free and soy-free starter (Photo 3) weeks one and two and Hyview Feeds organic corn-free and soy-free grower (Photo 4) weeks three through seven.
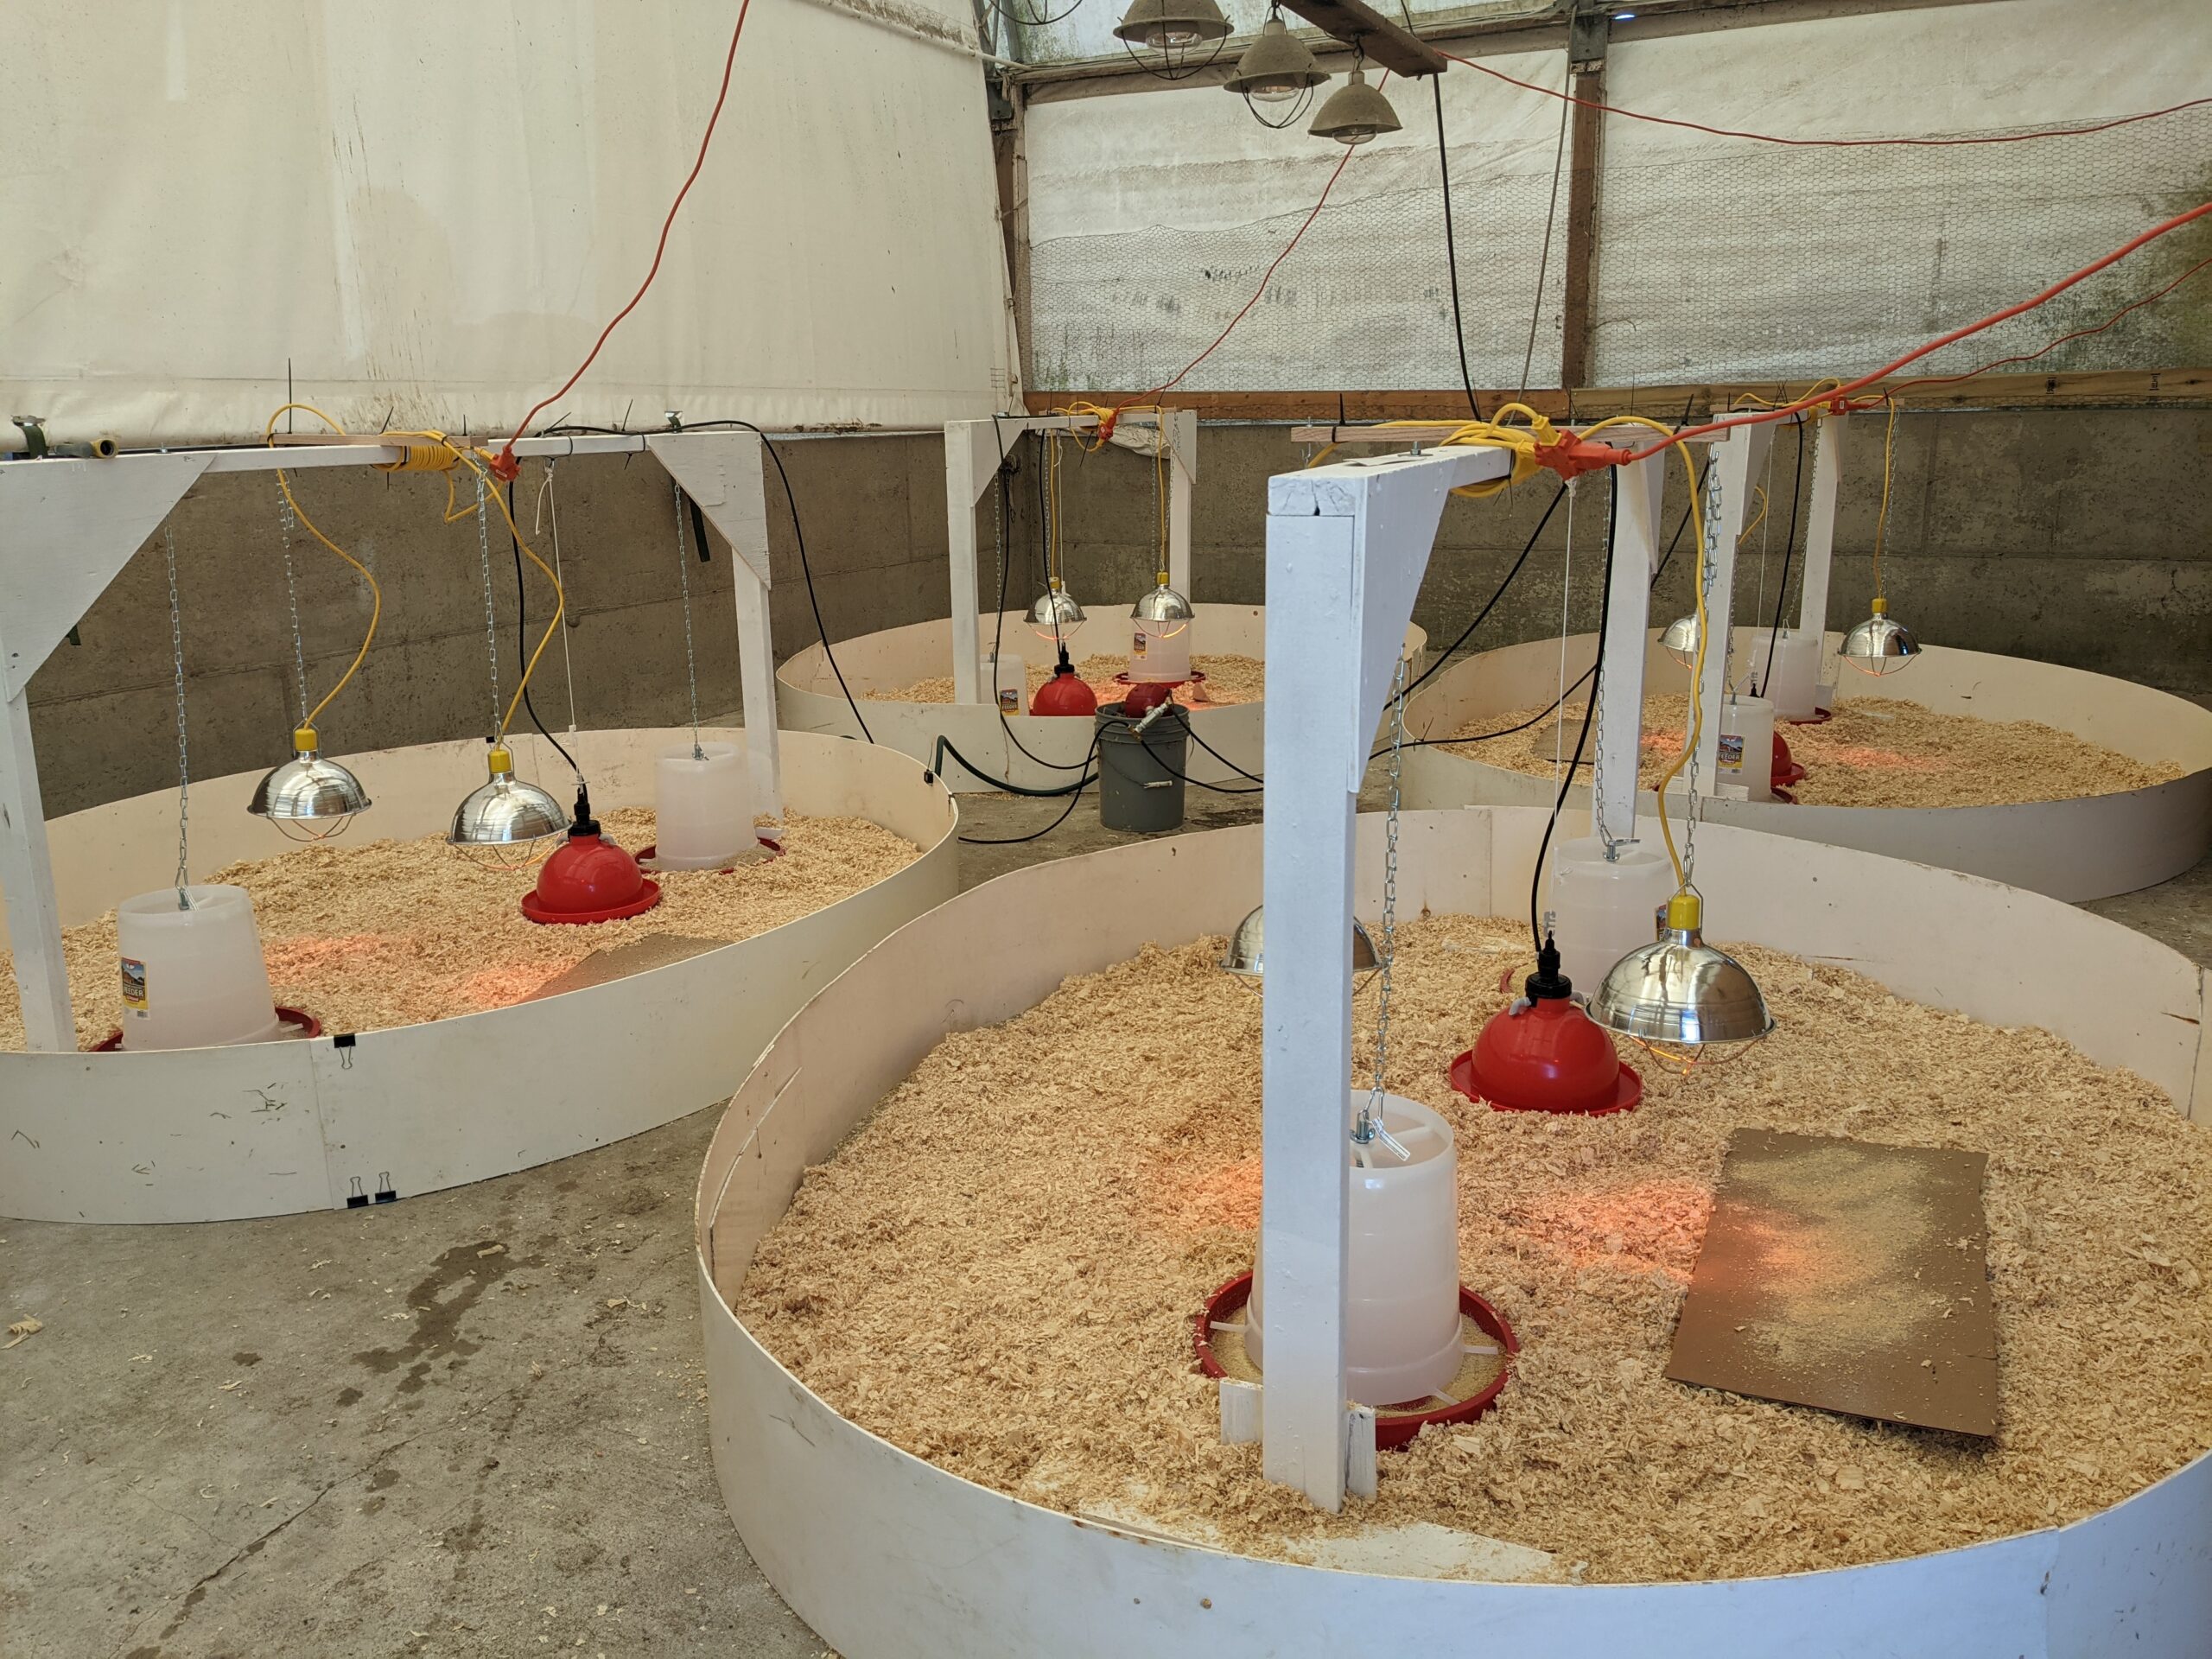
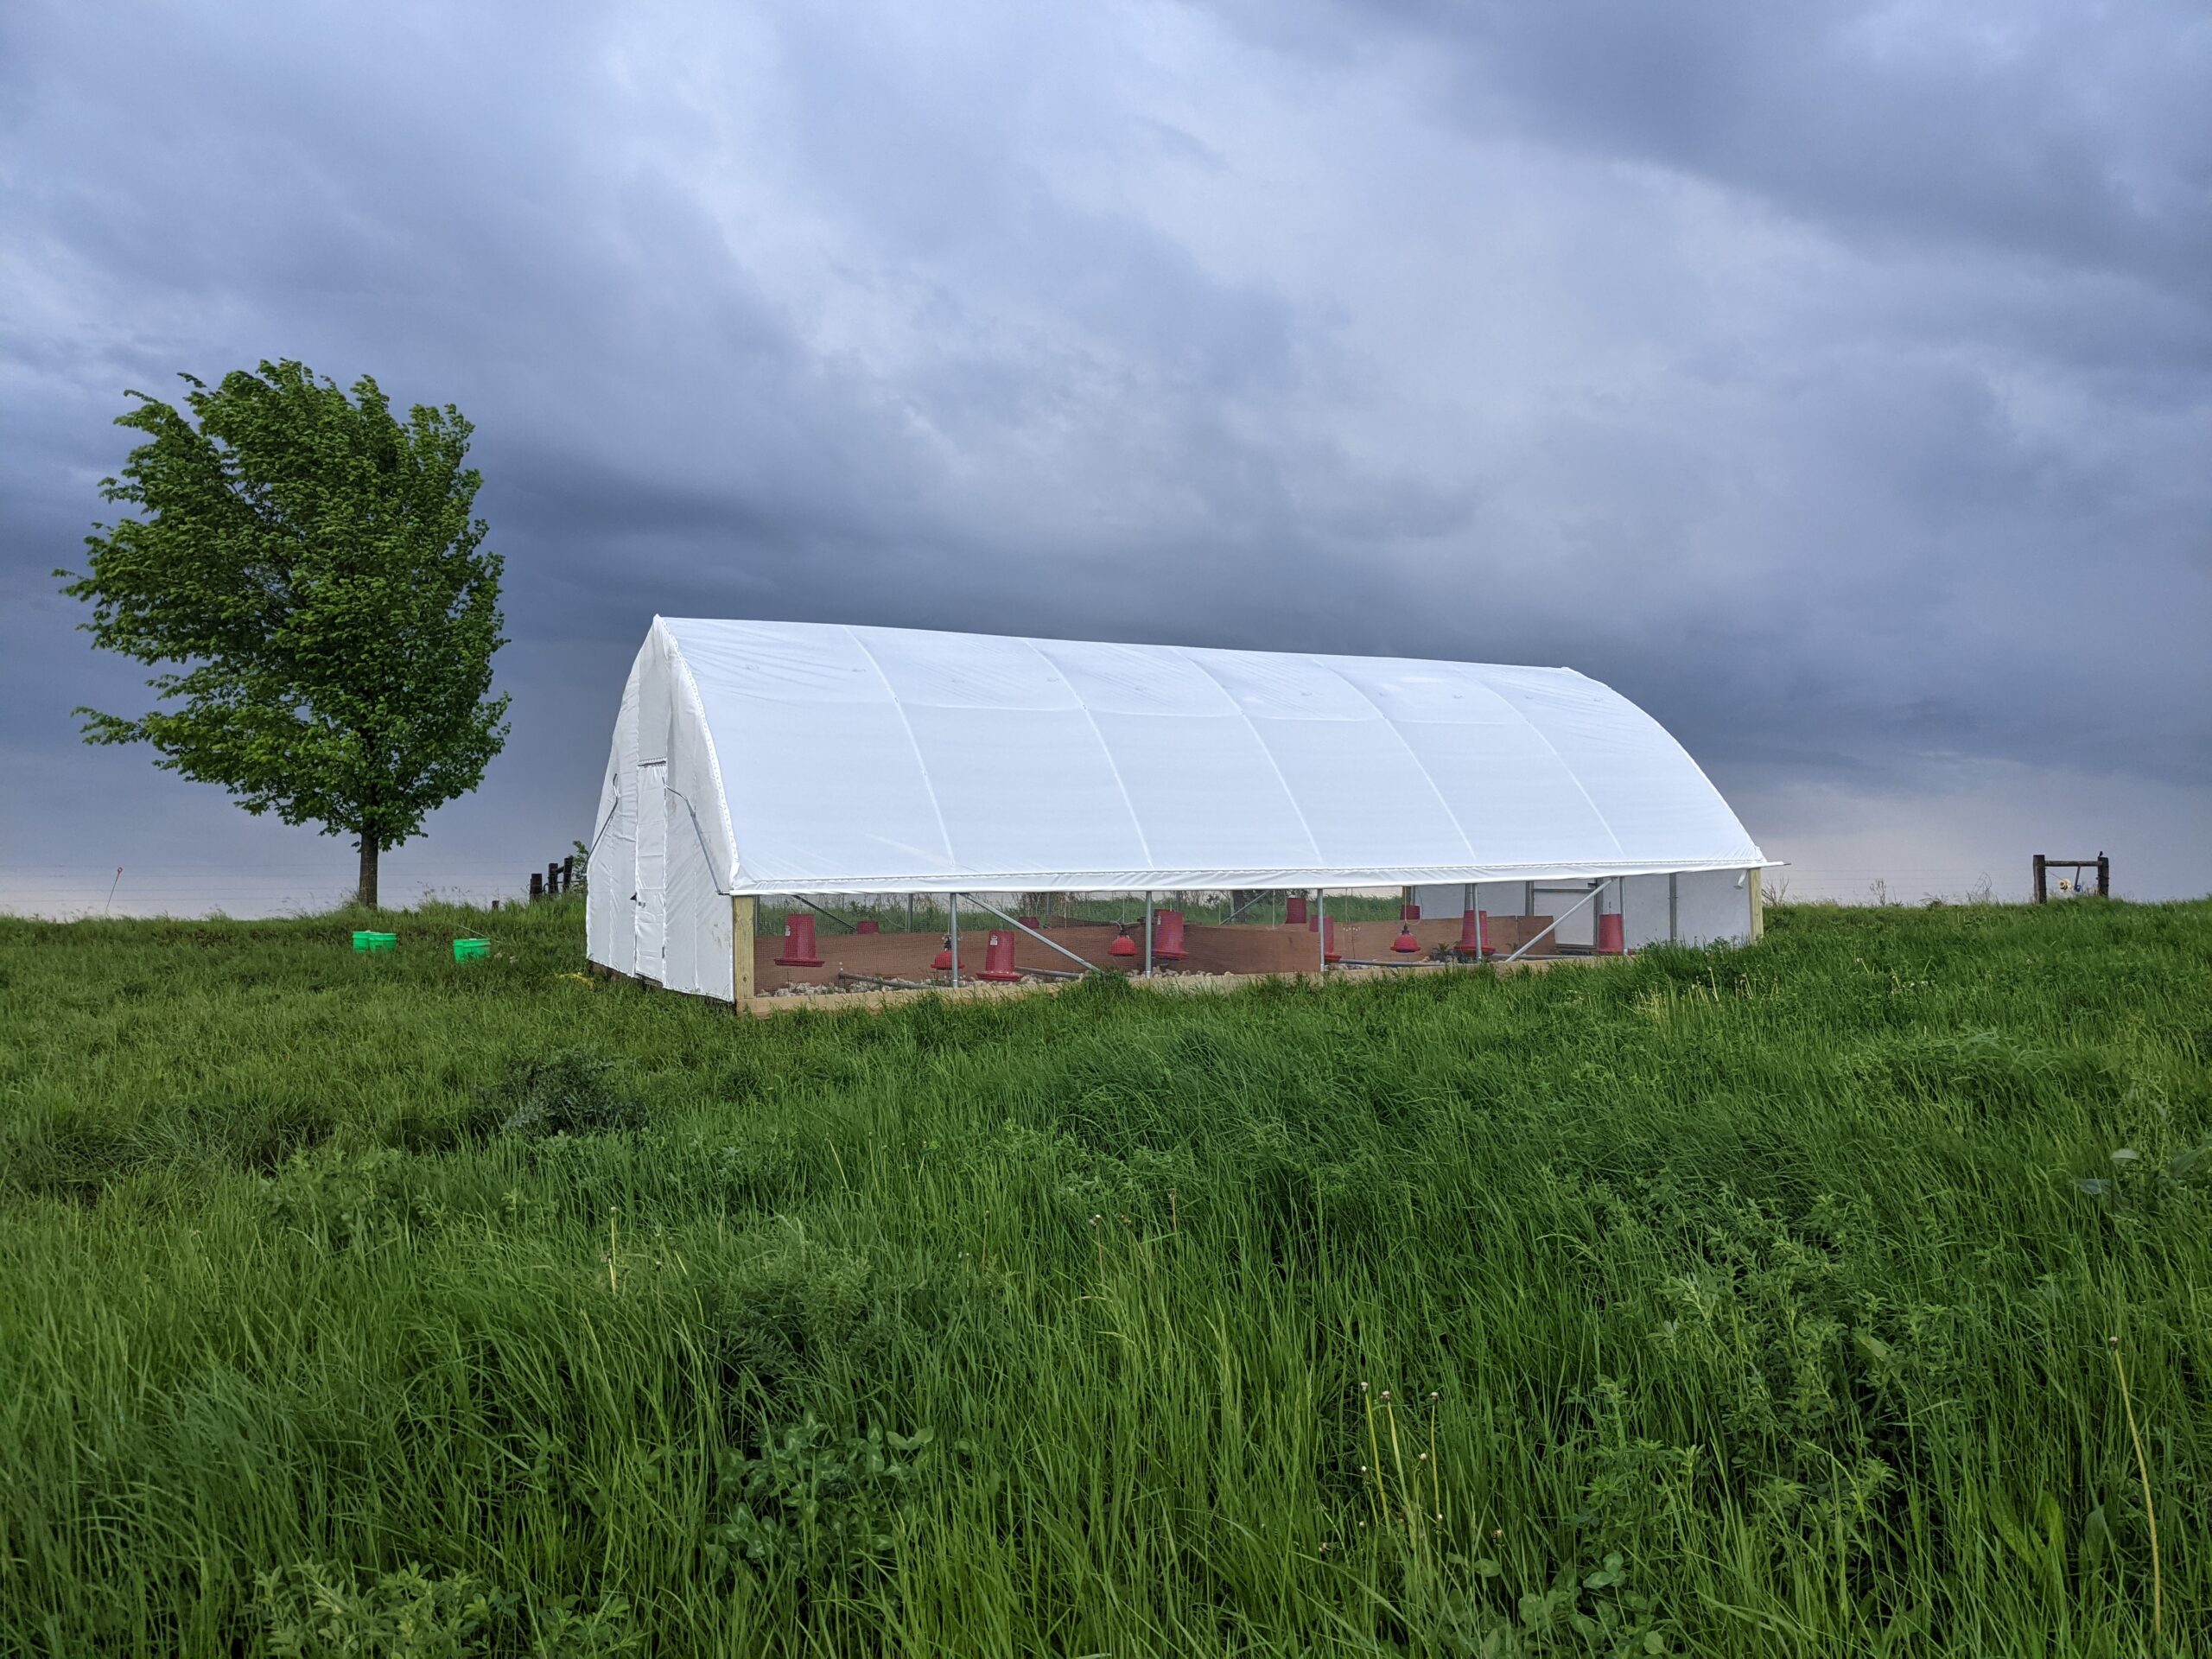
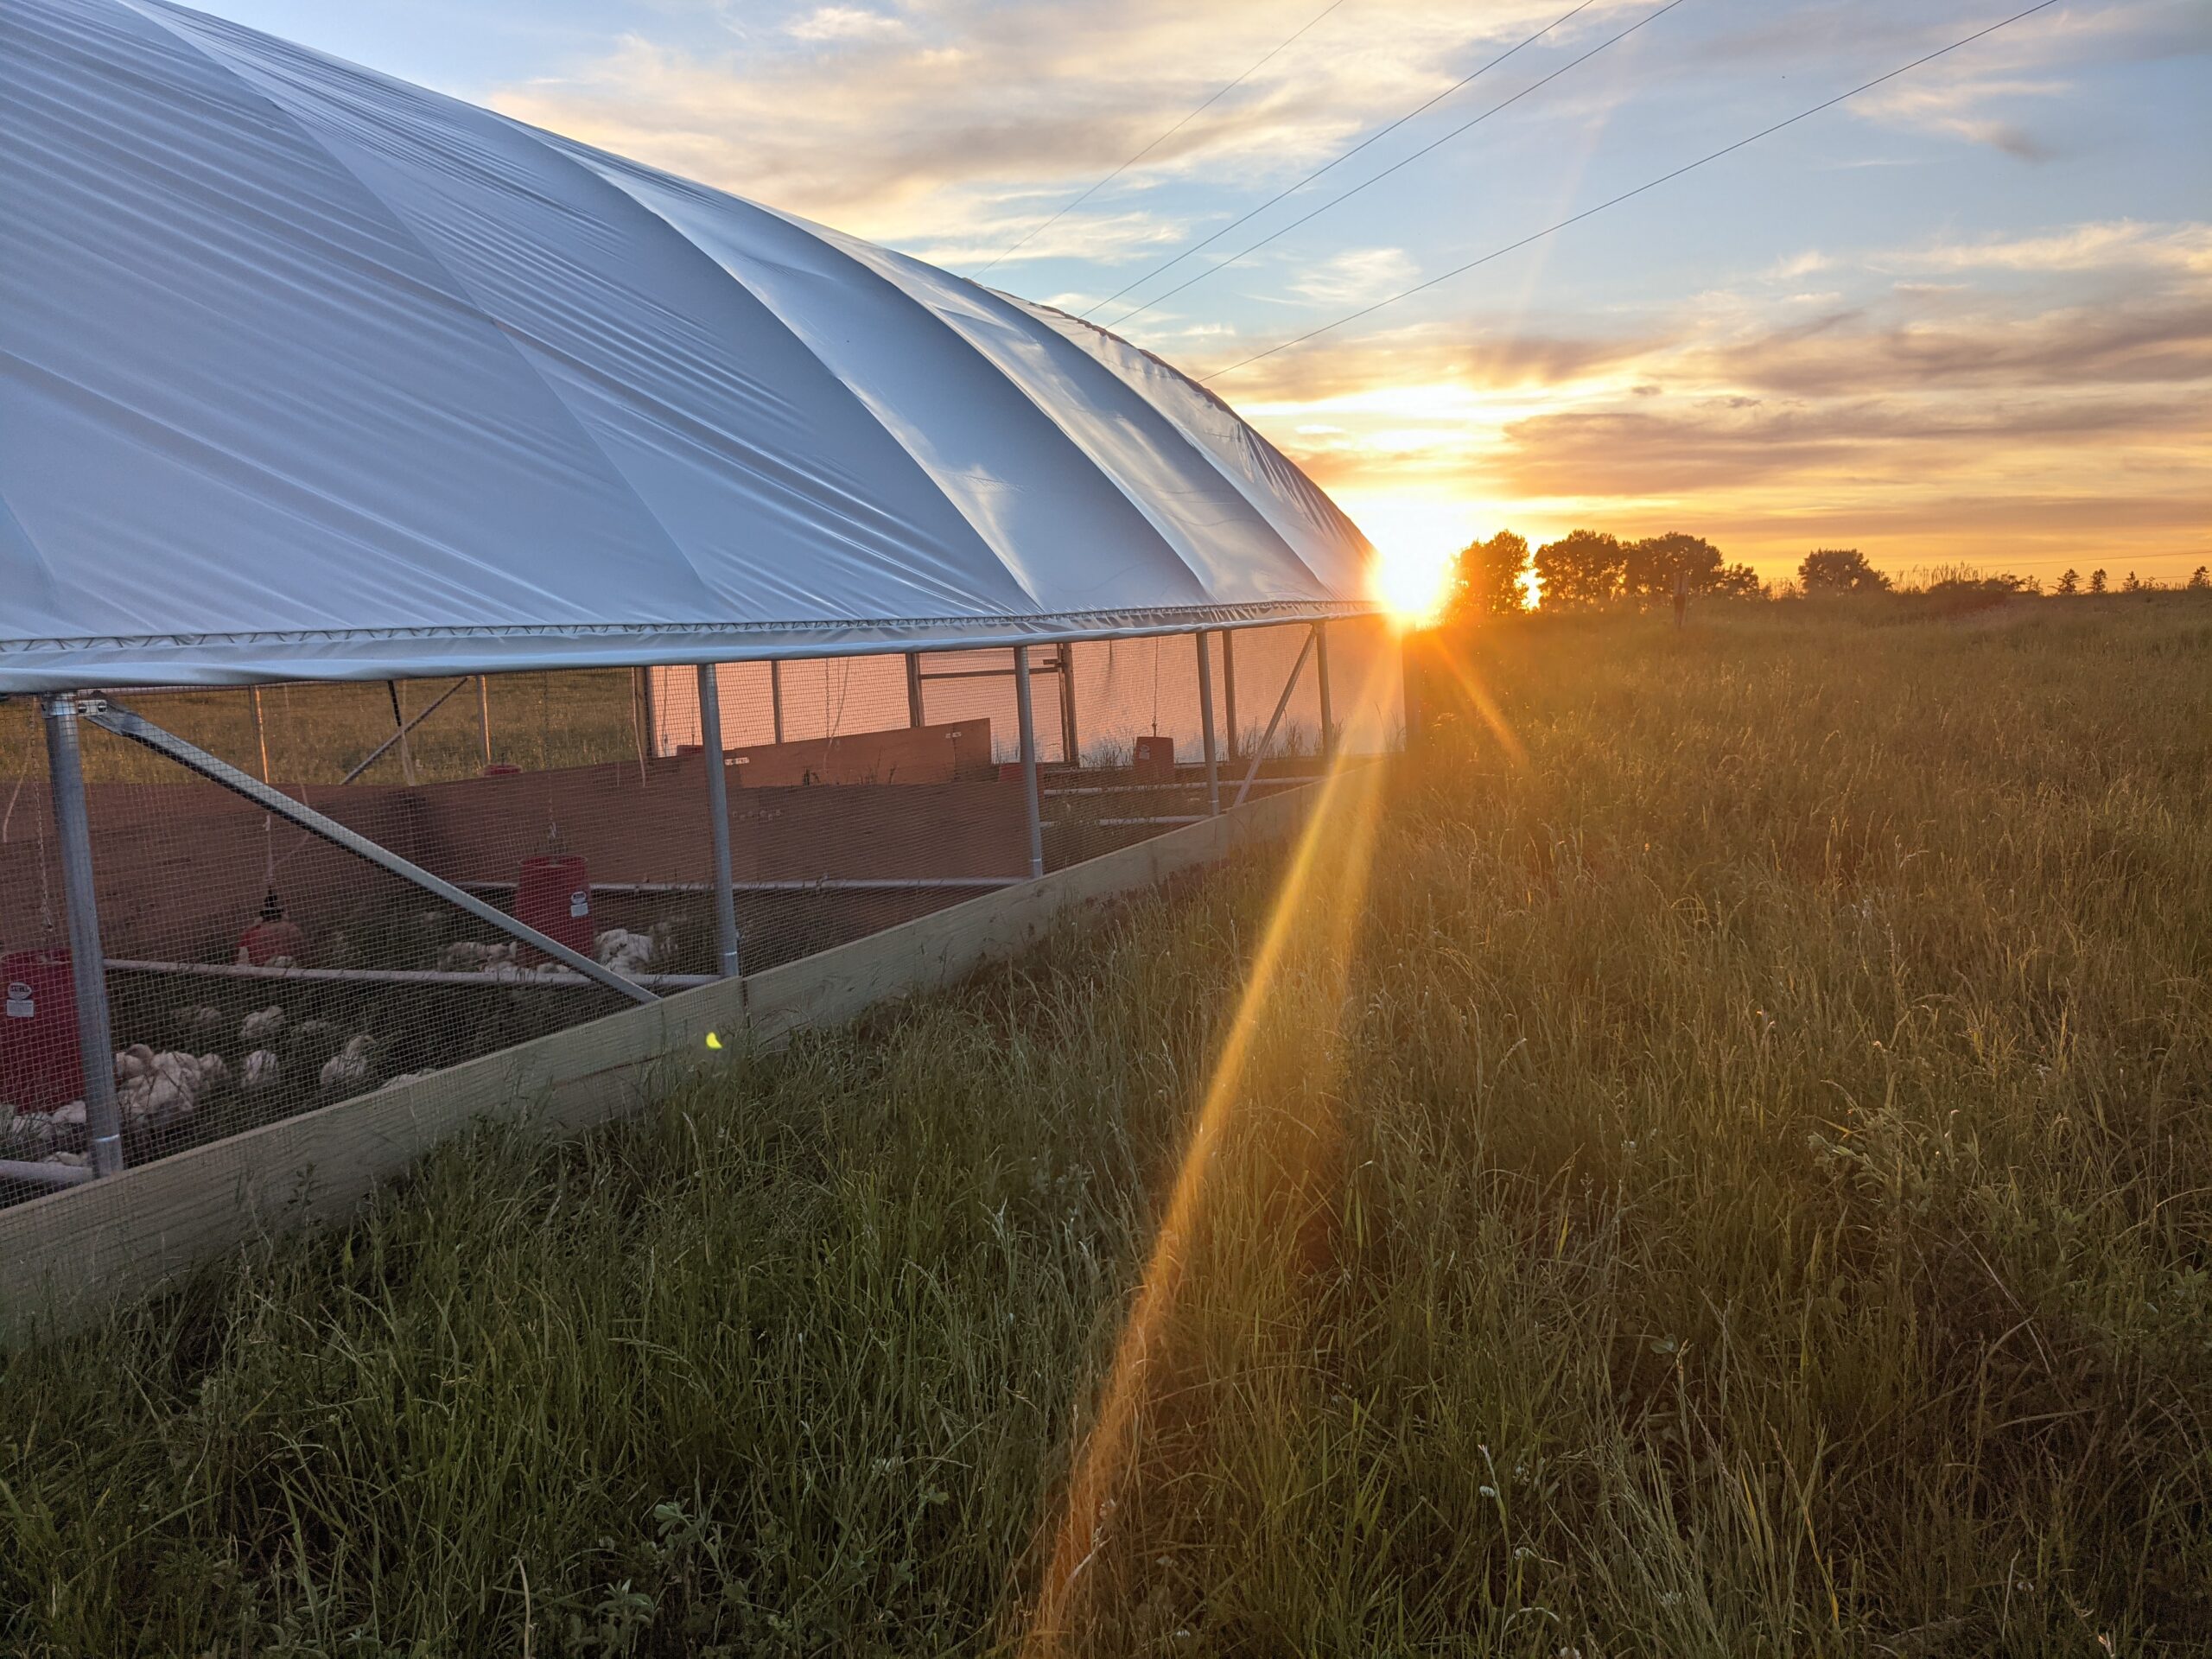
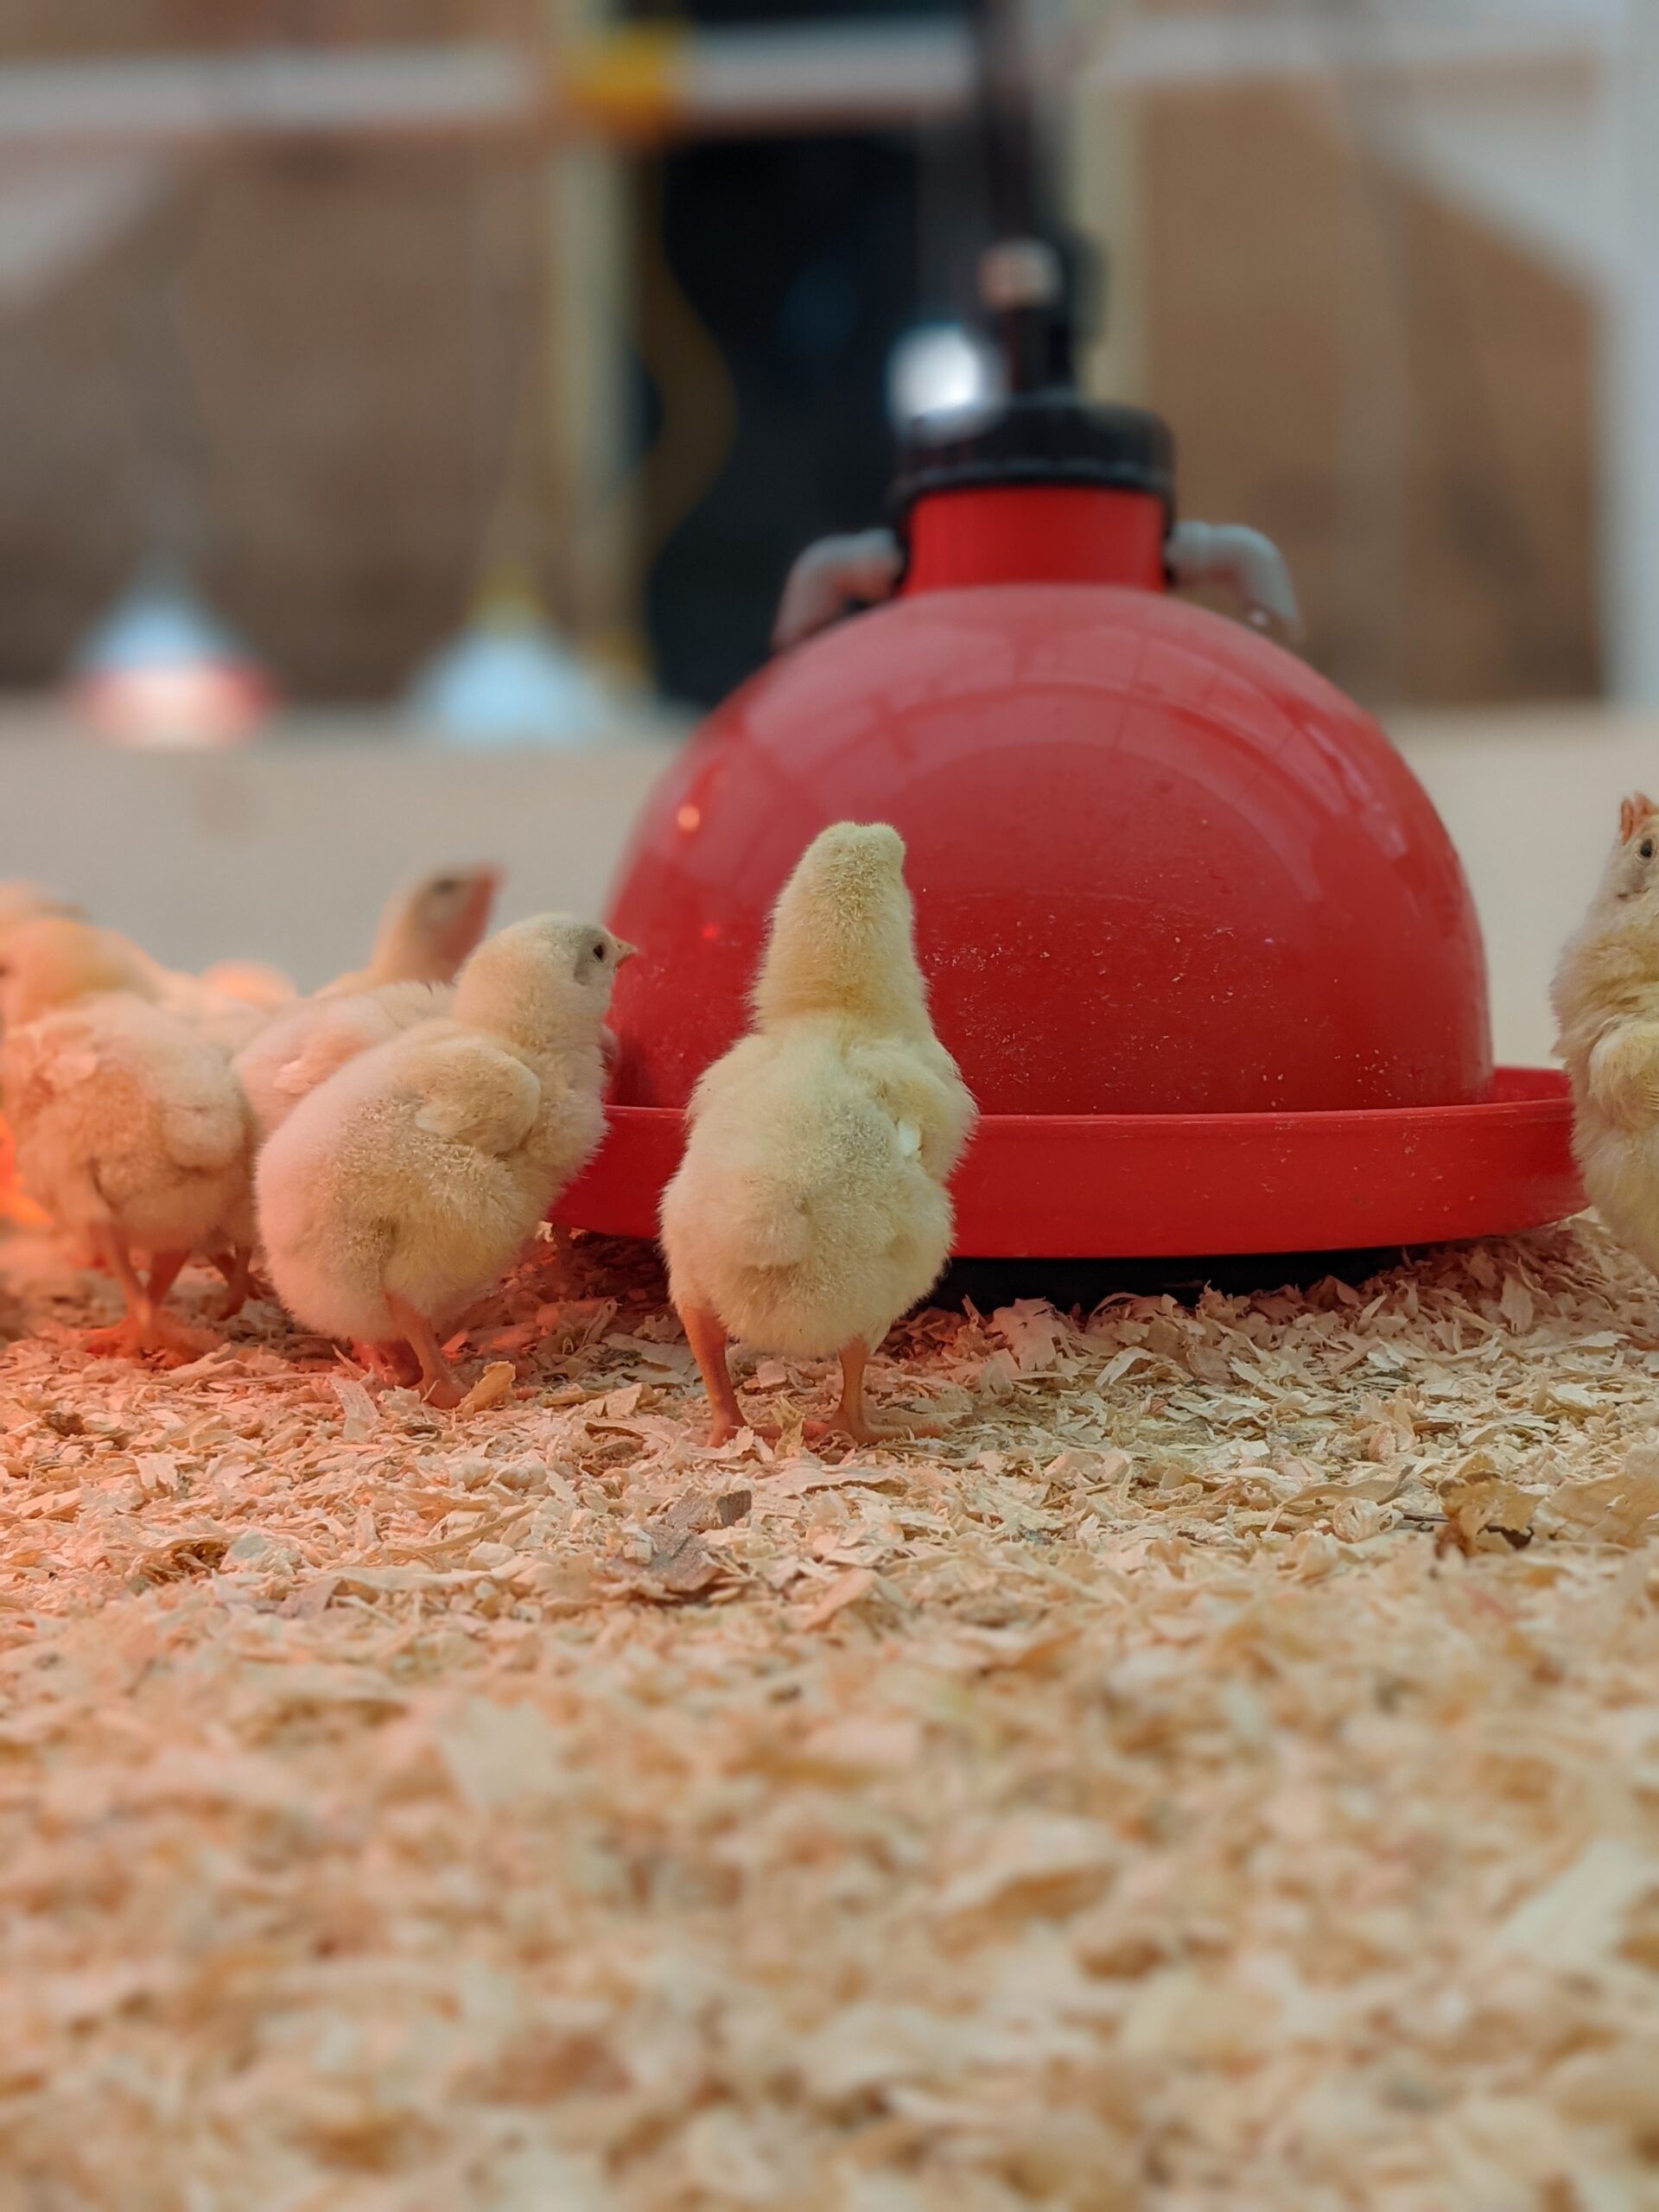
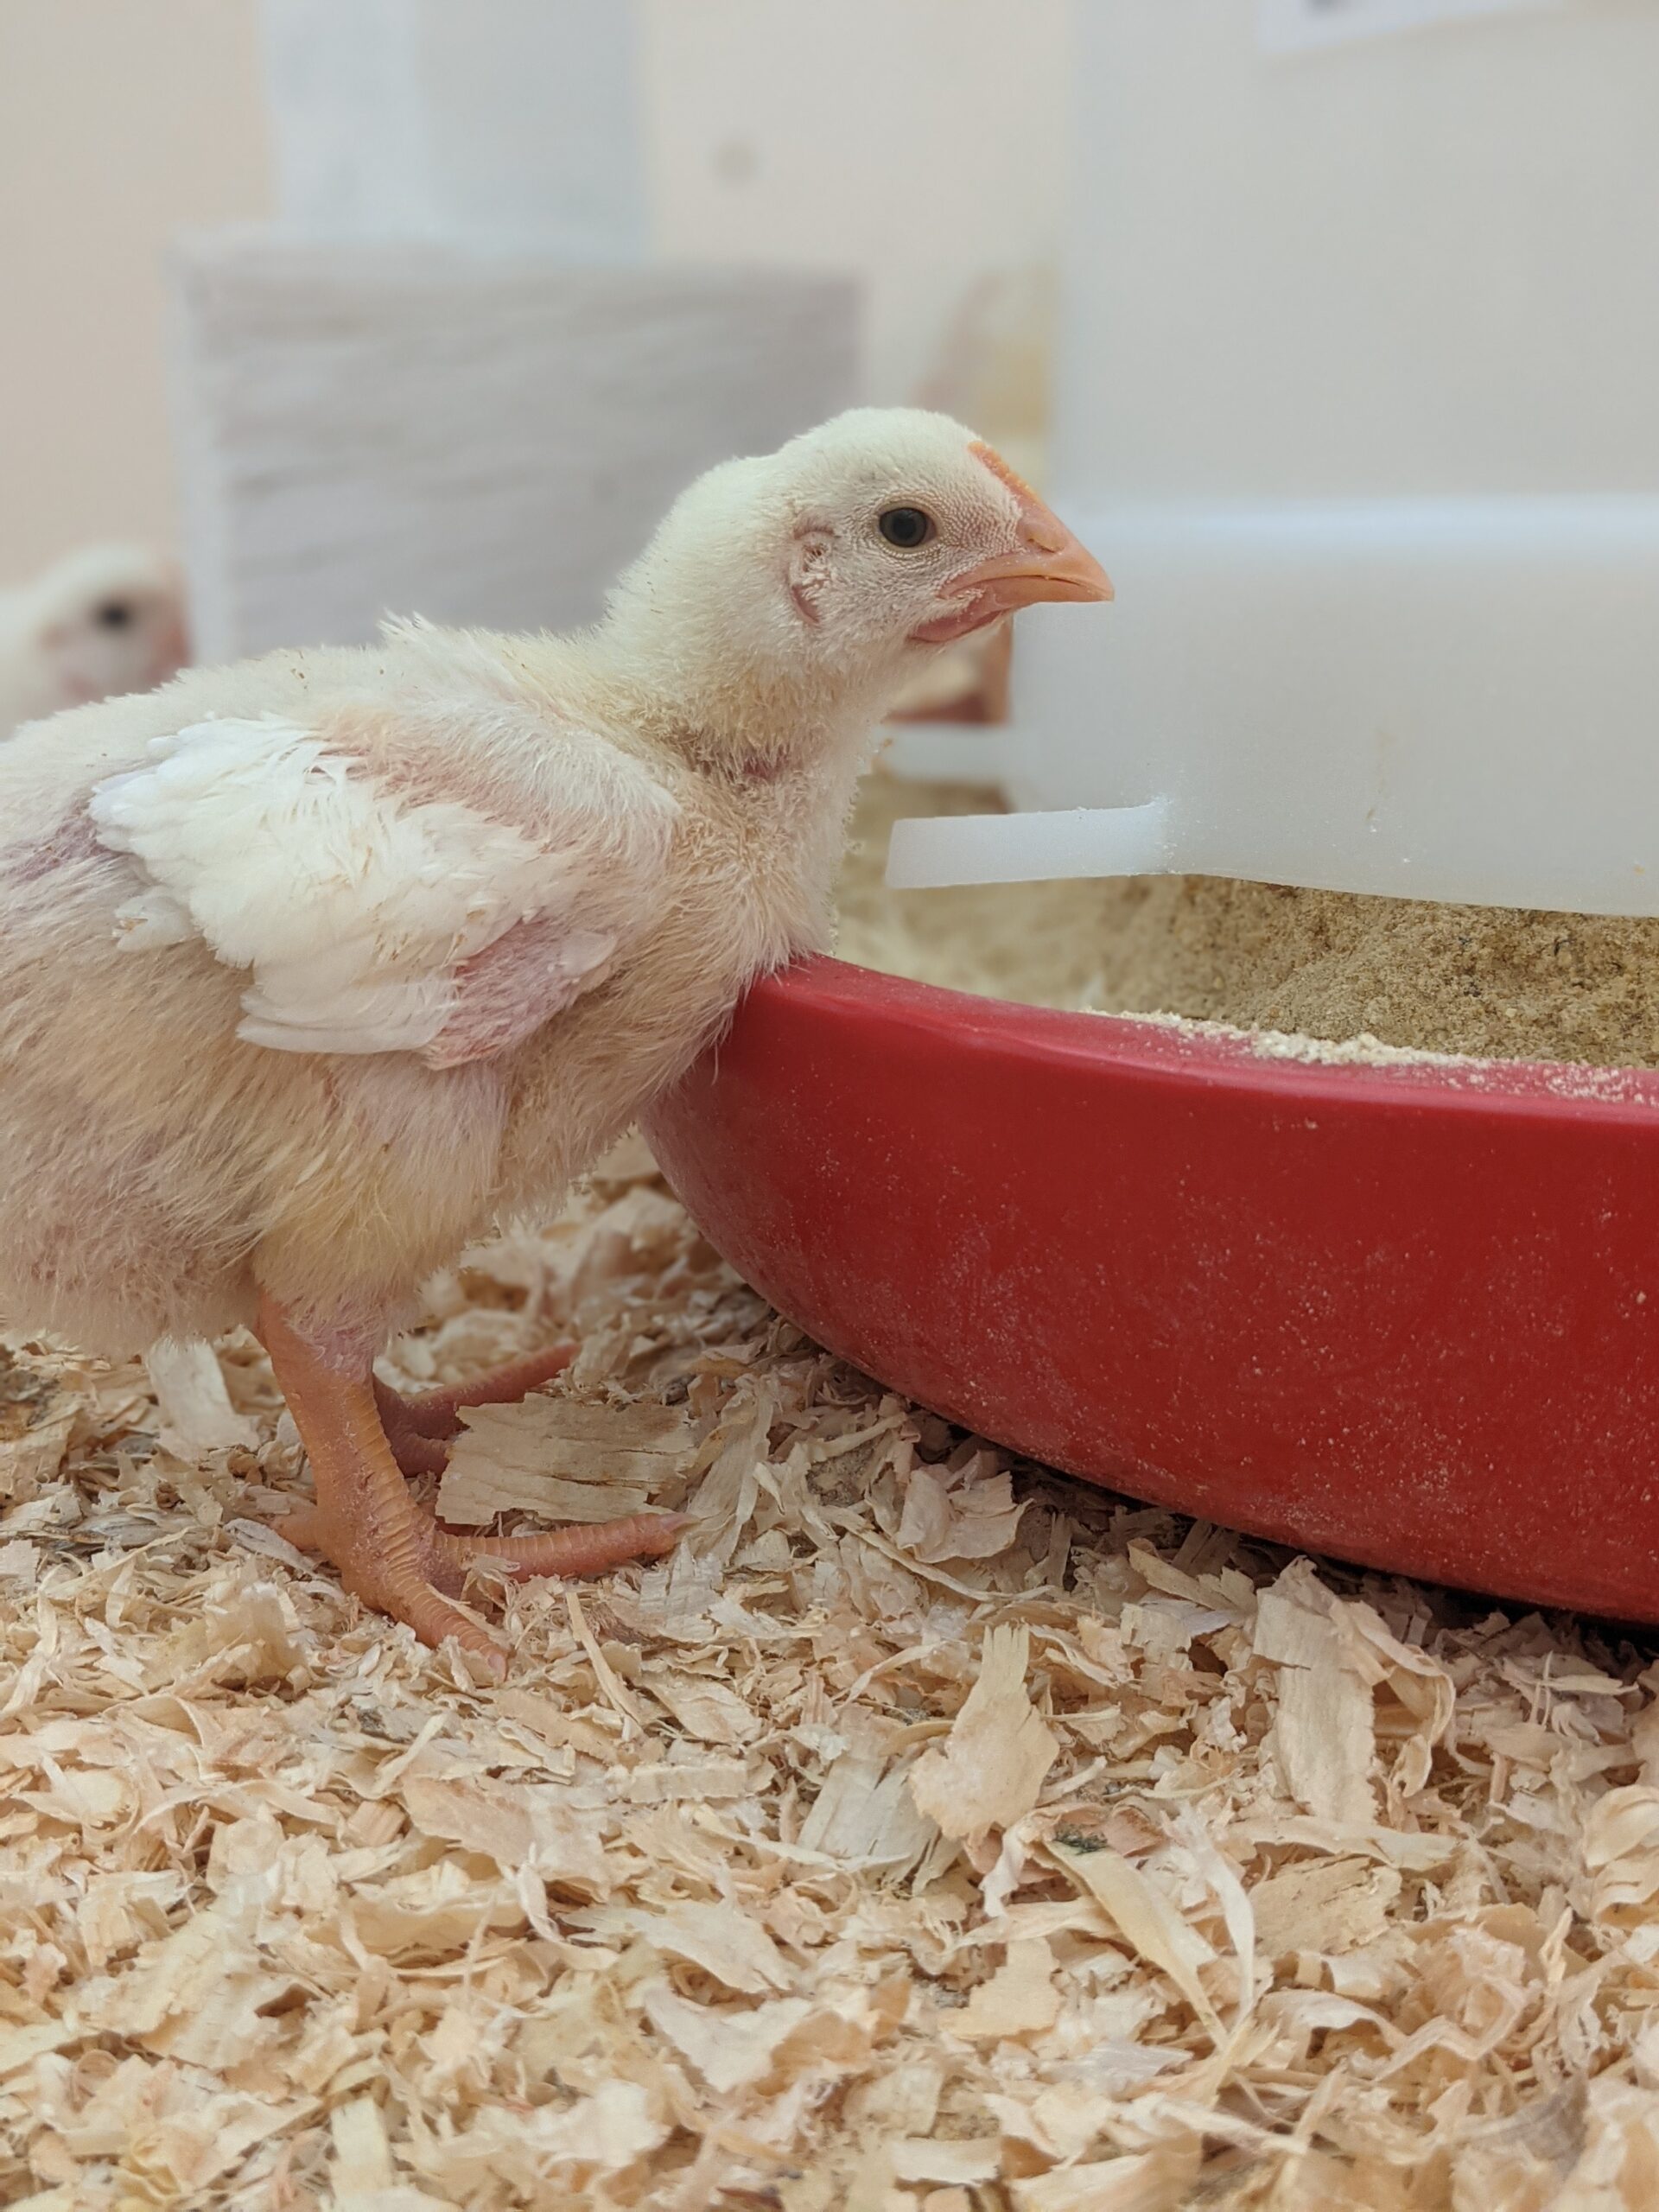
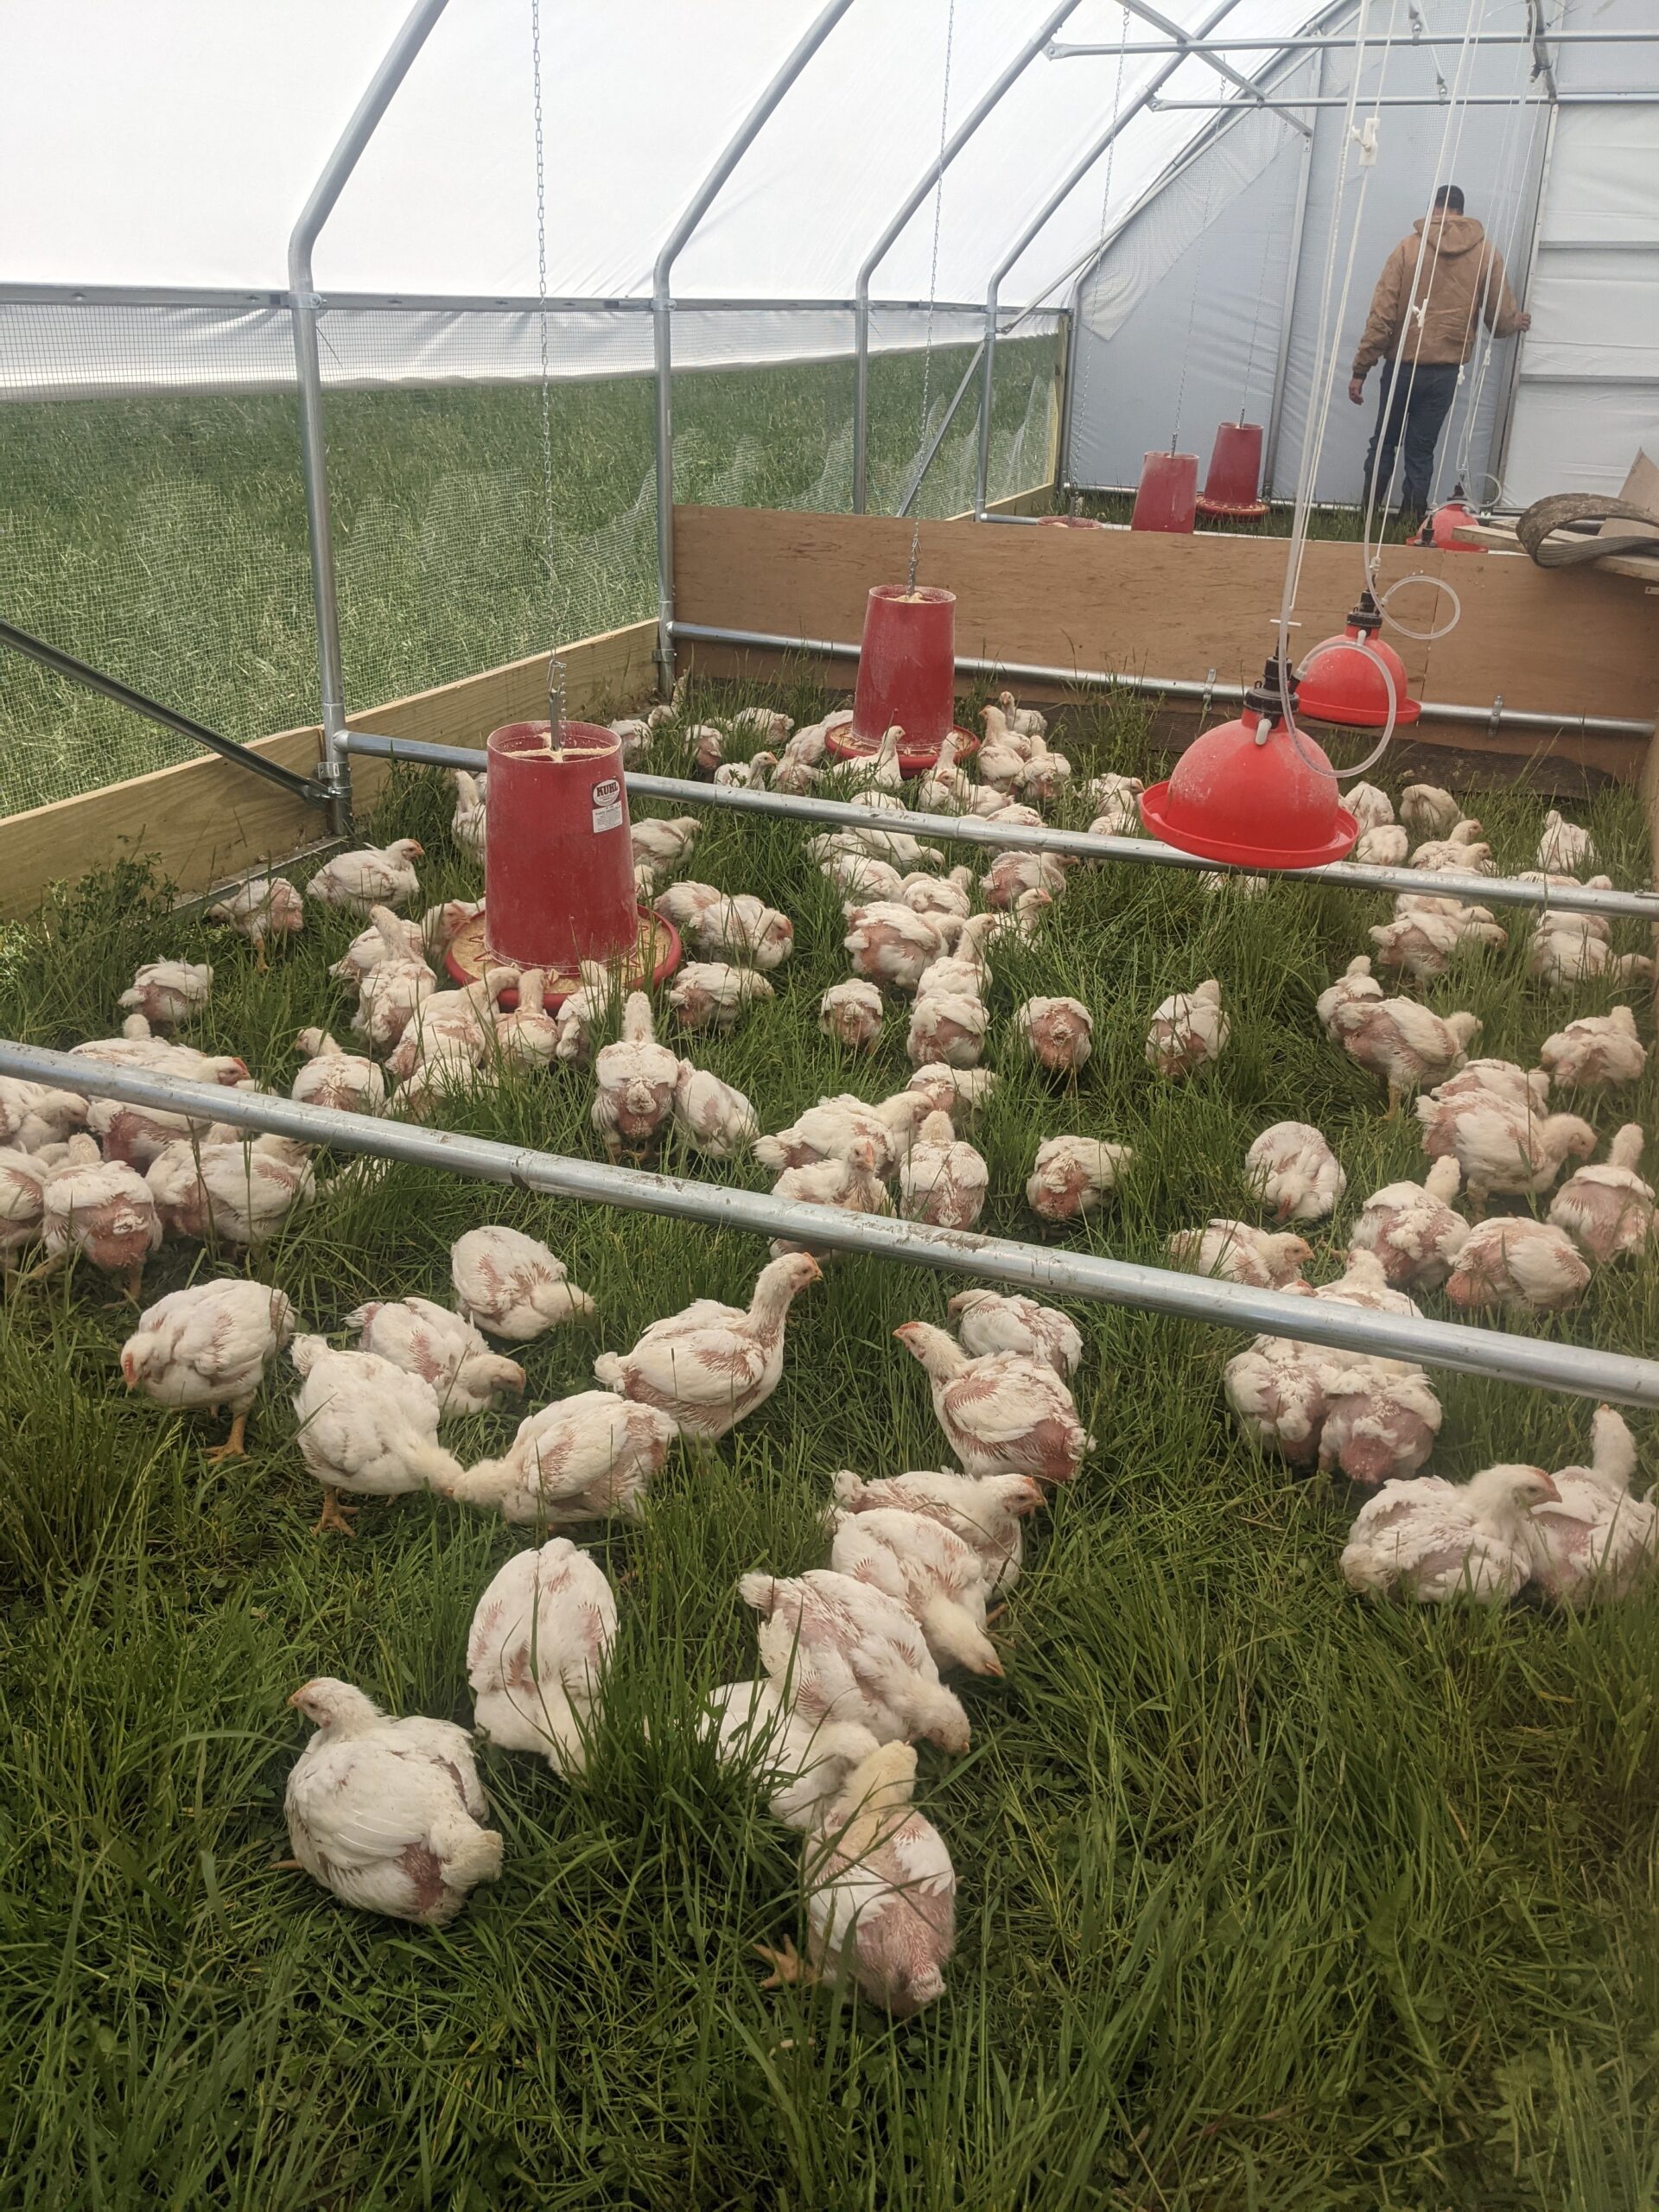
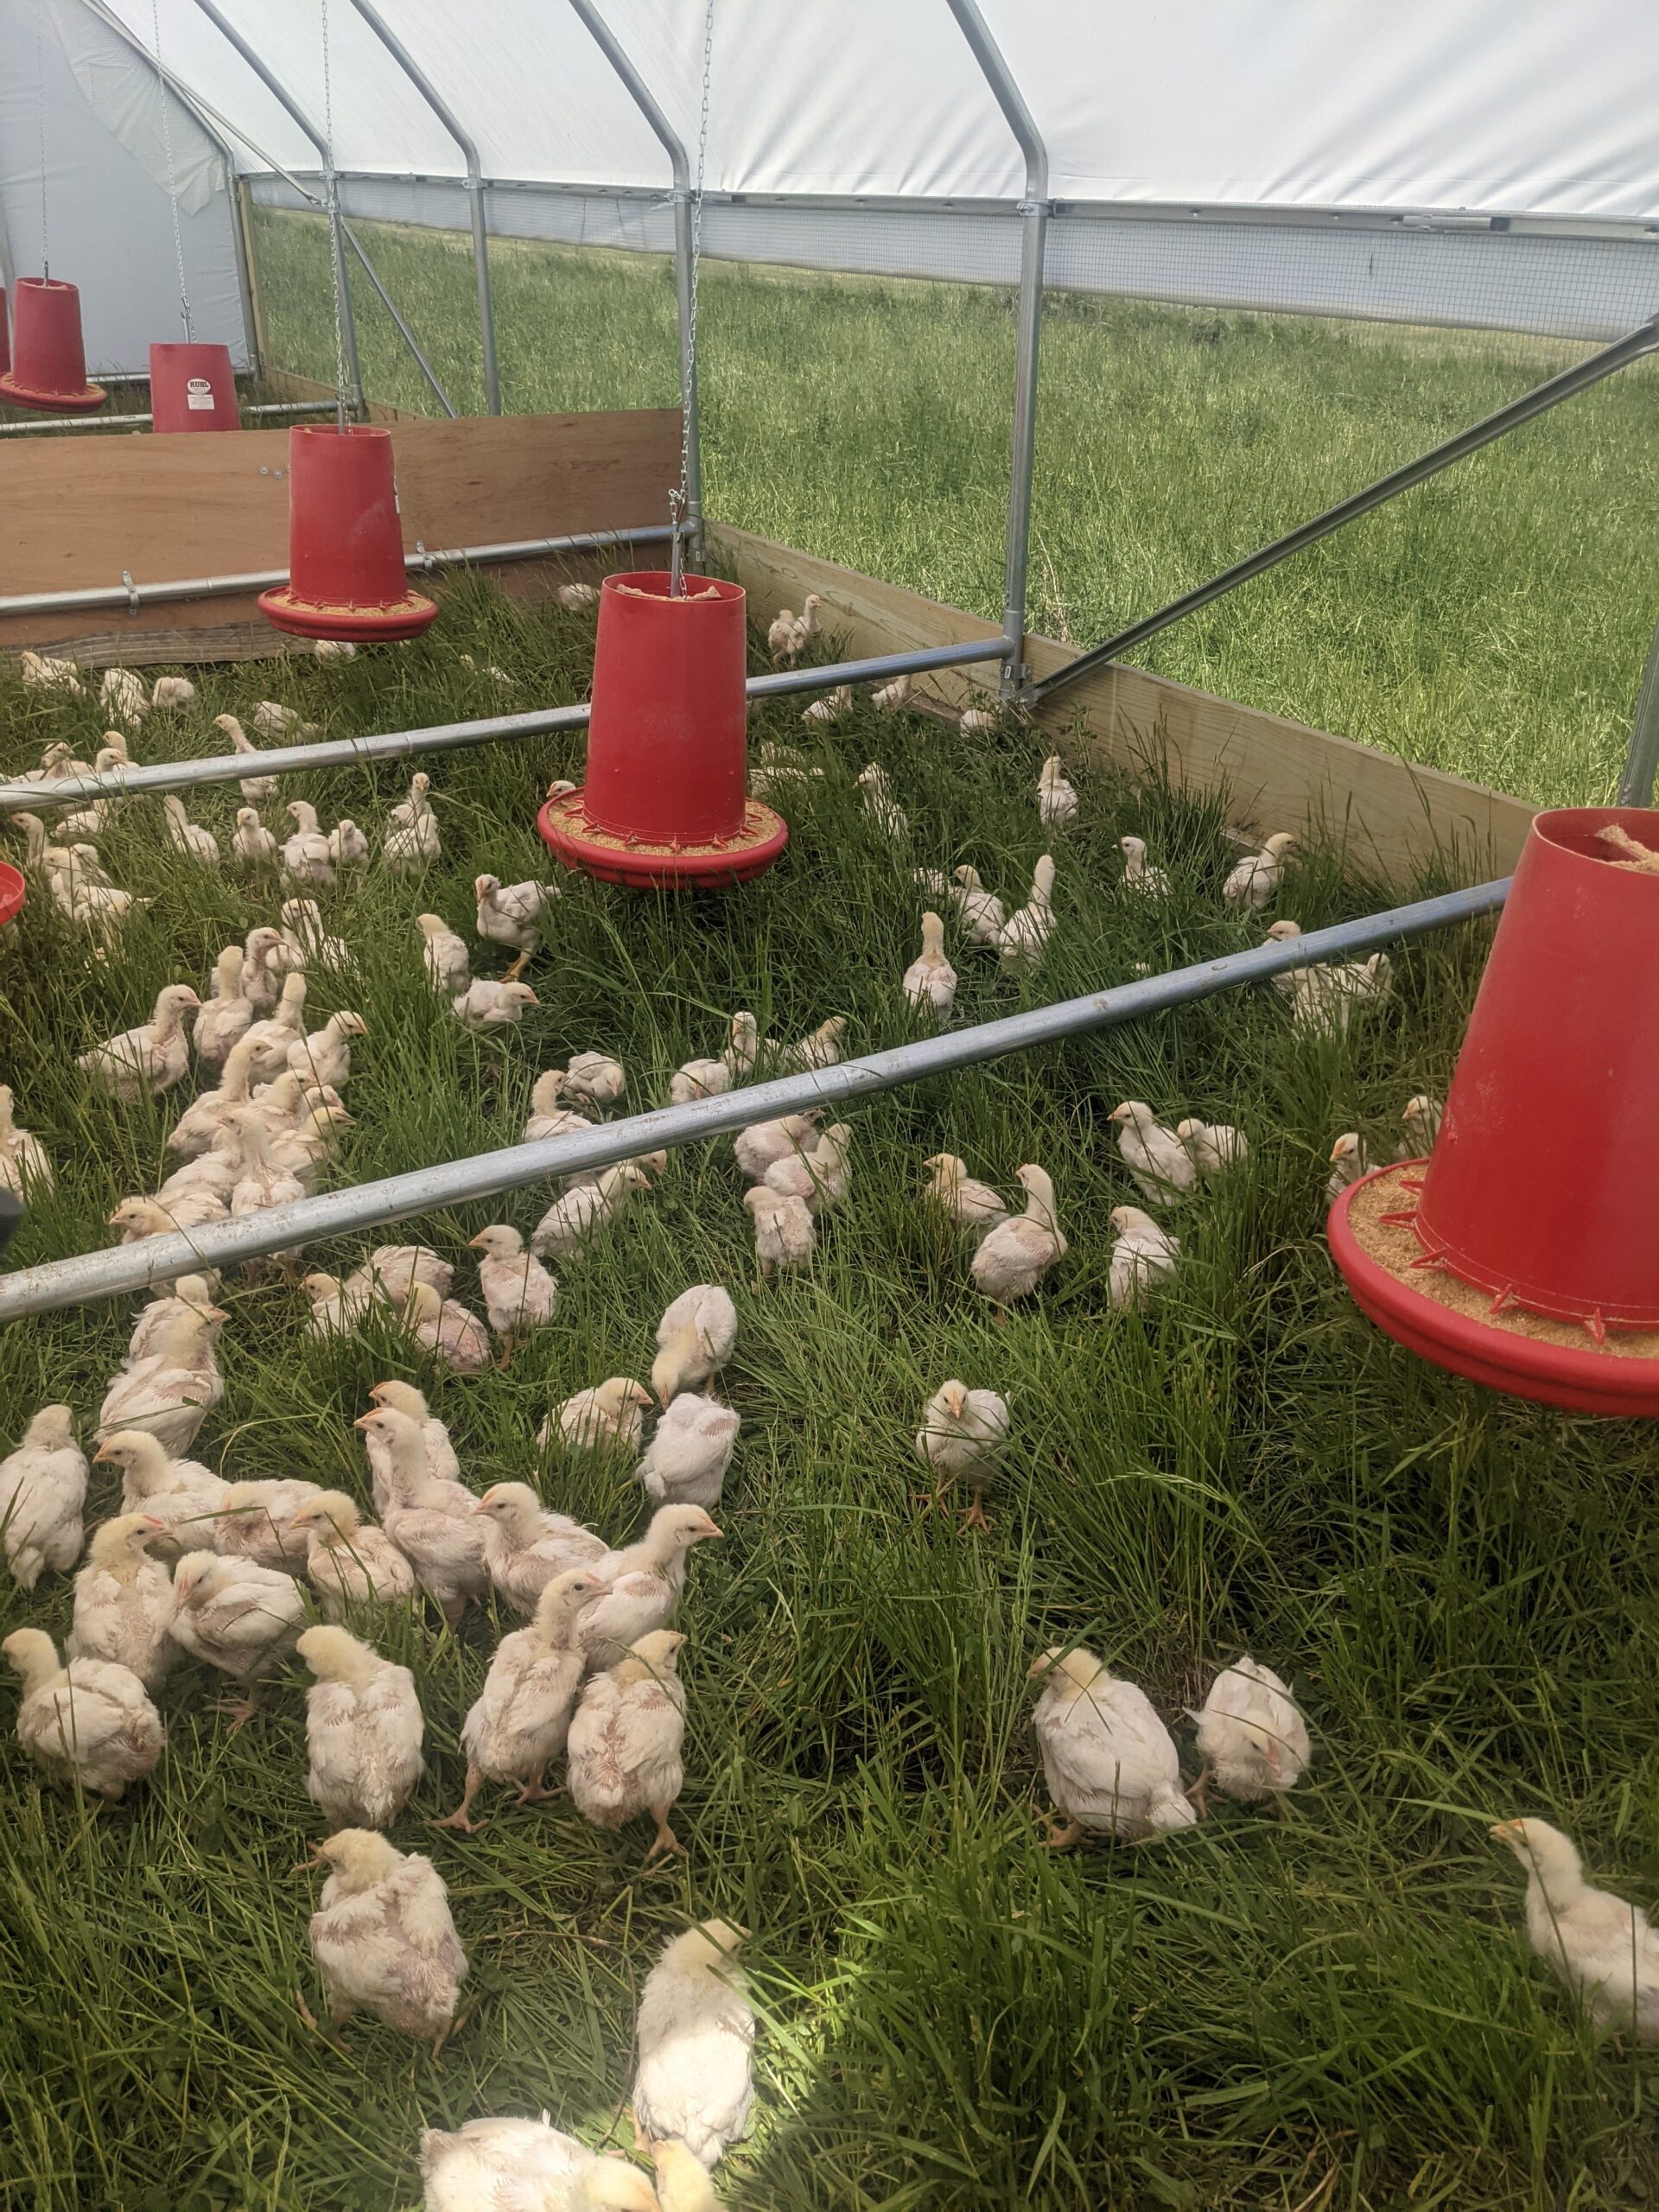
All chickens will be housed in the brooder (Photo 5) weeks one and two with a divider splitting the shelter into four equal parts for the four test groups. All groups will be moved out to pasture between weeks two and three and will be housed in a Cobb Creek Mobile Range Coop (Photos 6-8).
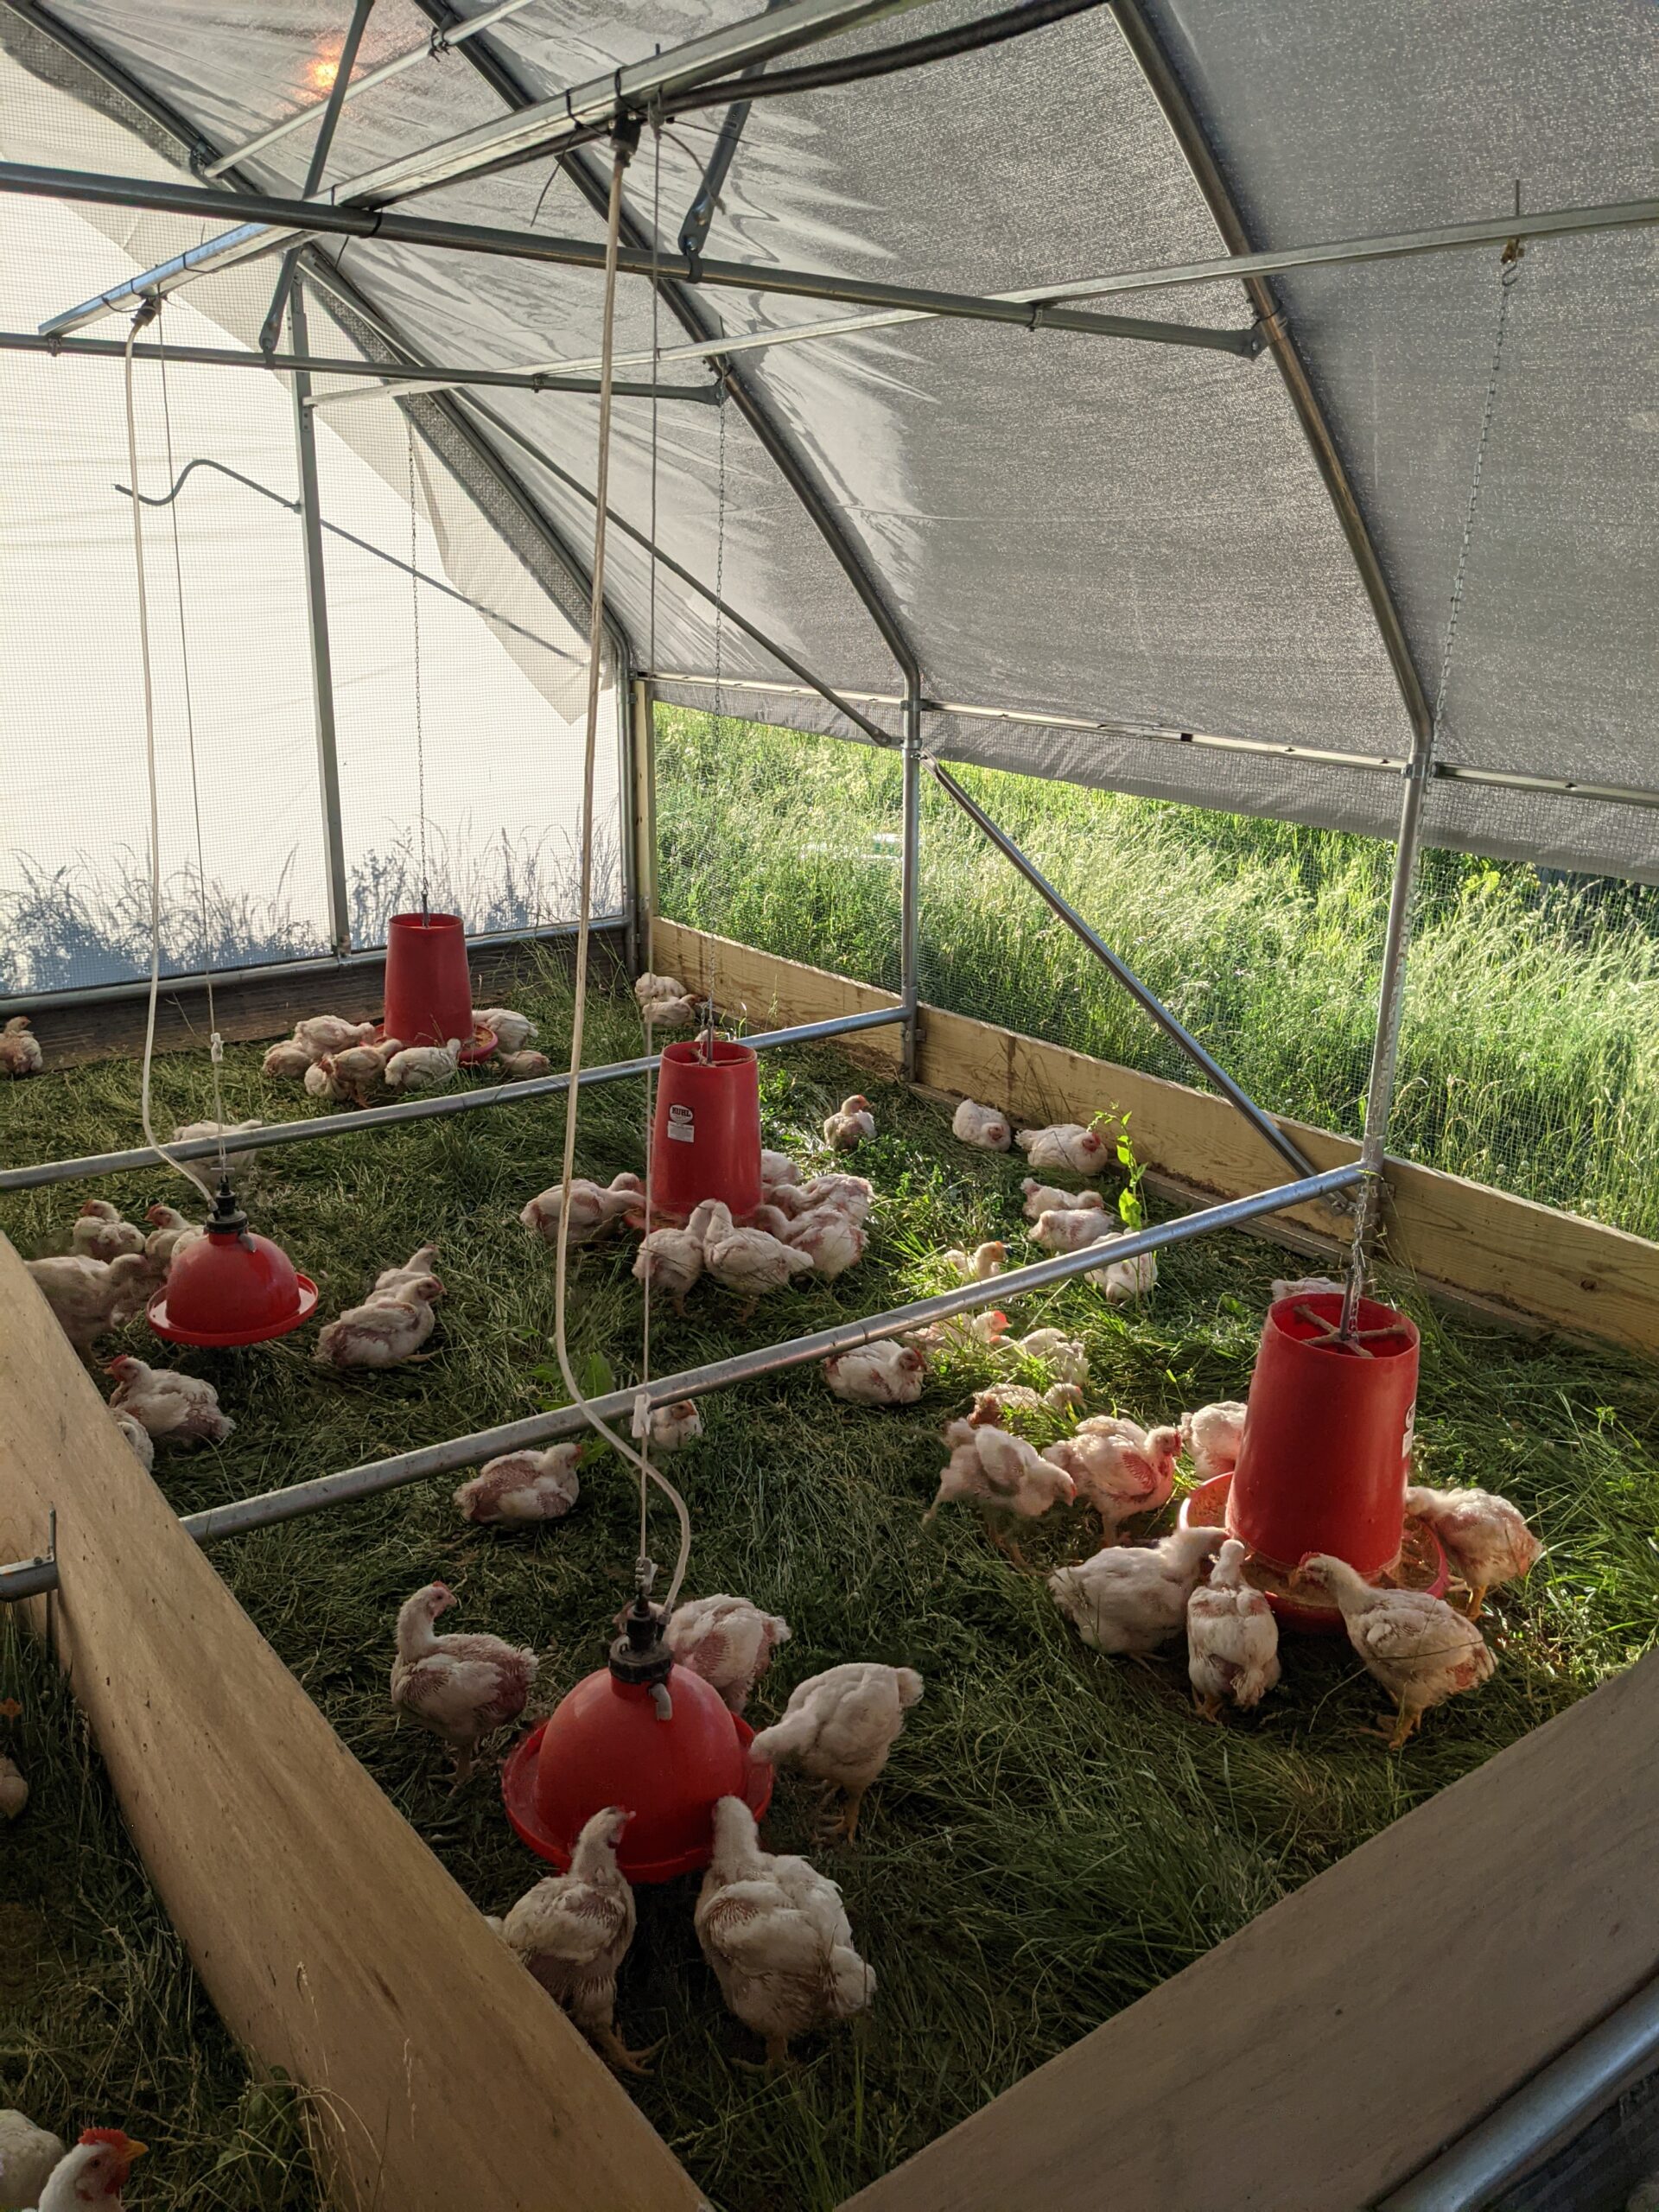
They are moved to equal amounts of fresh perennial pasture each morning. Both groups will be given the same number of feeders, drinkers and shavings in the brooder (Photos 9-10). They will be given free choice feed and grit and we will record the number of pounds consumed. Nutritional testing will be done at Eurofins Scientific Inc. on twelve samples of breast and thigh meat from a random sampling of three birds per group per batch.
While we intended to keep all variables besides the feed types the same, the corn and soy free chickens grew much slower. In order to have saleable chickens, we had to push the butcher dates back a few weeks for the corn and soy free chickens. Unfortunately, many of the ideal butcher dates were already filled, so we were forced to butcher each batch of corn and soy free chickens at a different time. The number of days the chickens were raised is shown in Figure 6.
Data collection includes:
- Pounds of feed
- Mortality rate
- Stocking density
- Live bird weights
- Processed bird weights
- Labor in hours
- Sales in dollars
- Production expenses in dollars
Nutritional testing includes:
- Cholesterol
- Vitamin E
- Eicosapentaenoic acid (EPA)
- Docosahexaenoic acid (DHA)
- Alpha-Linolenic acid (ALA)
- ω-6 fatty acids
- ω-3 fatty acids
- Fat
- Monounsaturated Fat
- Polyunsaturated Fat
- Saturated Fat
We evaluated the impact of corn and soy feed versus corn-free, soy-free feed in pastured poultry production on animal health, growth rates and meat quality.
Production Results
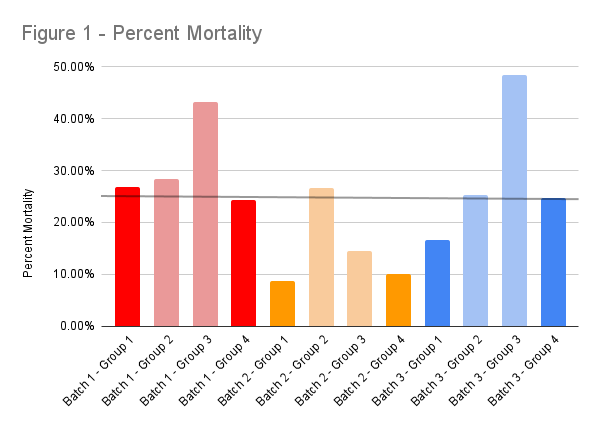
Figure 1 shows percent mortality in each group of chickens. The corn and soy free chickens (groups 2 and 3) had more deaths than the corn and soy chickens (groups 1 and 4) in every batch. Total mortality was 282 chickens for the corn and soy free groups and 168 chickens for the corn and soy groups. It is important to note that batch 1 had a higher overall mortality due to health issues at the hatchery. Group 3 in batch one had 43% mortality because one of the boxes of chicks were placed in group 3 were sicker than the others. After this realization, we split each box of chicks into all four groups in the second and third batches.
Group 3 in batch 3 had 48% mortality because one of the three heat lamp bulbs burned out overnight causing the temperature to drop unexpectedly. 25 chicks were dead when we arrived to do morning chores and additional 26 chicks died within 48 hours, which accounts for about 70% of the mortality in group 3 from batch 1.
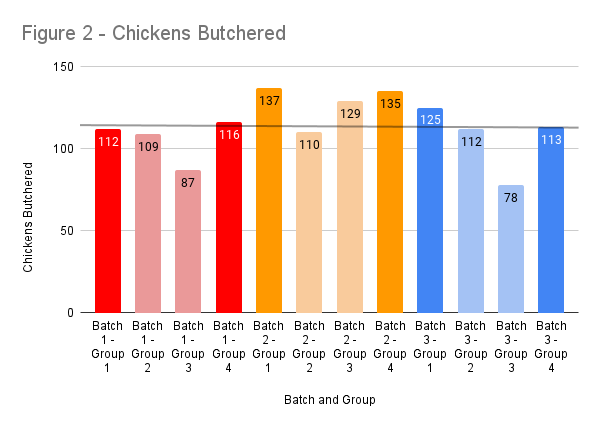
Figure 2 shows the total number of chickens processed in each group. In each batch, groups 1 and 4 (corn and soy) have a greater amount of chickens processed than groups 2 and 3 (corn and soy free).
When observing the health of the chickens fed the two types of feed while in the brooder and on pasture, the corn and soy fed chickens overall appeared much healthier than the corn and soy free chickens. The corn and soy chickens grew feathers and matured much quicker than the corn and soy free chickens. By week 3, the corn and soy chickens had full feathers, but the corn and soy free chickens still had some down and appeared bald in other places. When the first batch of chicks arrived on the farm, they were struggling due to sickness at the hatchery. While it impacted all four groups in batch 1, groups 2 and 3 that were fed the corn and soy free started experienced higher mortality than groups 1 and 4 that were fed corn and soy feed.
When moving the chickens to pasture between weeks 2 and 3, we observed the corn and soy free chickens were more vigorous than the corn and soy chickens; they chased, hunted and pecked more bugs and moved much quicker.
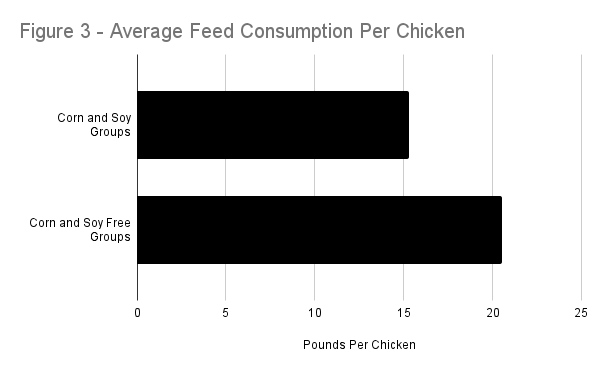
Figure 3 shows the average pounds of feed consumed by each type of chicken. The corn and soy free chickens consumed 5.2 pounds more feed per chicken than the corn and soy chickens. Note that these are based on total feed consumed divided by total chickens harvested and does not account for feed fed to chickens that died or take into consideration the different length of times fed for each group of corn and soy free chickens. Batch 1 was fed for 70 days, batch 2 for 55 days and batch 3 for 64 days.
Photos 11 shows a full group of corn and soy chickens and photo 12 shows the corn and soy free chickens. Both photos were taken May 28 when the chickens were 29 days old.
Photos 13 is a corn and soy chicken and Photo 14 is a corn and soy free chicken on June 1, both 33 days old. The size difference was very evident. The feather growth was also much slower on the corn and soy free chickens.
Photos 15 is a corn and soy chicken and Photo 16 is a corn and soy free chicken on October 2. They are both 45 days old and from Batch 3.
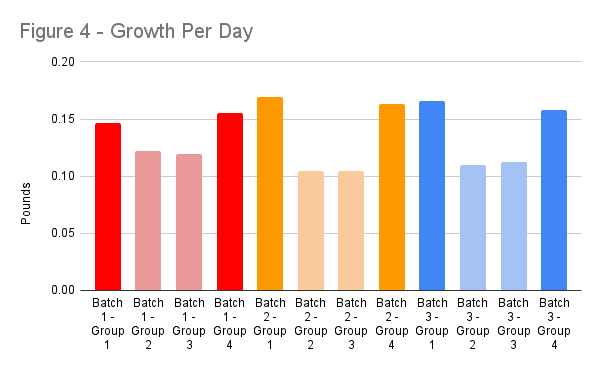
Per day, the corn and soy chickens gained an average of .16 pounds per day, whereas the corn and soy free chicken gained an average of .11 pounds per day. Figure 4 shows the average daily growth in each group of chickens.
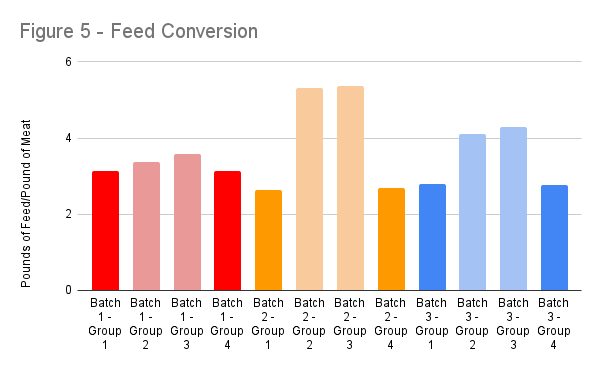
Figure 5 shows the feed conversion ratio differences between each group of chickens. The corn and soy chicken had an average 2.84 lbs of feed per pound of chicken produced and the corn and soy free chickens had an average 4.2 lbs of feed per pound of meat . Note that the length of time the chickens were on feed for the corn/soy free groups affects the accuracy of this feed conversion ratio. The feed consumed per chicken was done for total chickens of each feed type, not broken down per batch. Due to the length of the corn and soy free groups being different for each batch the feed consumption is not precise. It only gives us an idea. These feed numbers also do not remove feed fed to chickens that died.
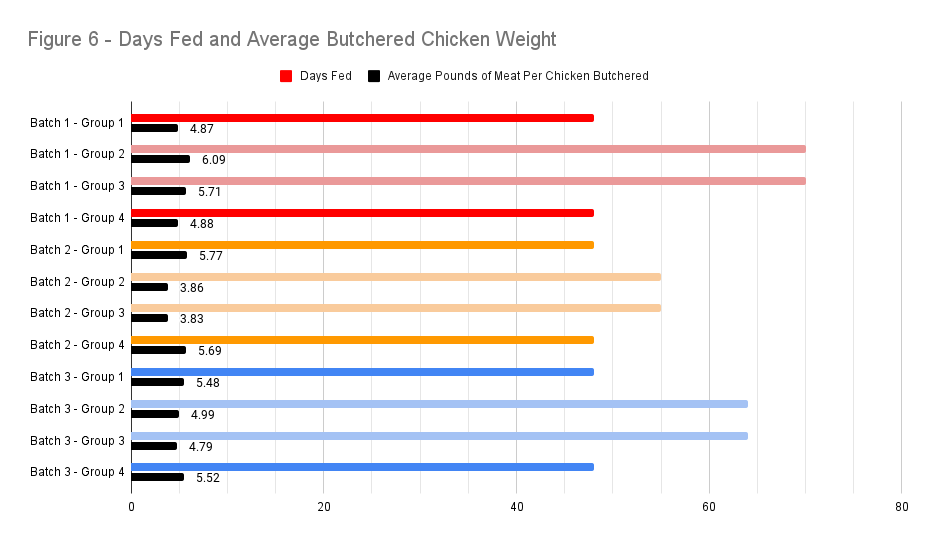
Figure 6 shows the number of days each group of chickens were fed and the average butchered chicken weights for each batch. The corn and soy chickens were all fed for 48 days, whereas the corn and soy free chickens were fed between 55 and 70 days. The corn and soy chickens averaged 5.37 pounds after butchering. The corn and soy free chickens averaged 4.88 pounds after butchering.
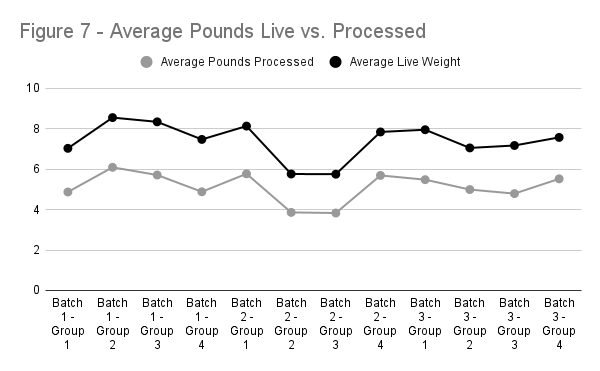
While loading the chickens before transporting them to the butcher, a sample weight of 10 chickens per group was collected and weighed live. Figure 7 shows the difference between the average live weight in each group of chickens and the average processed weight of the chickens.
In total, the corn and soy free chickens took 50 extra hours of labor compared to the corn and soy chickens. This was largely due to the extra days added for the corn and soy chickens before sending them to processing because of their size. Moving the chickens to new pasture each morning took about 45 minutes.
Nutritional Testing Results
Method of Analysis
A complete fatty acid profile was conducted on the chicken meat. Most of the values were below detectable levels except those reported.
Other Factors
Because the corn and soy groups grew slower, we had to keep them for a longer amount of time. The difference in ages at sampling may have influenced the composition of the meat. Having access to pasture may also modify the omega-3 fatty acid composition in the meat. We were unable to get the breakdown of diet components in each of the feed types. Having a breakdown of the diet components may have helped us analyze the differences in the meat further. A composite meat sample made up of breast and thigh was used for analysis. The proportion of breast to thigh meat is unknown and also could have influenced the meat composition.
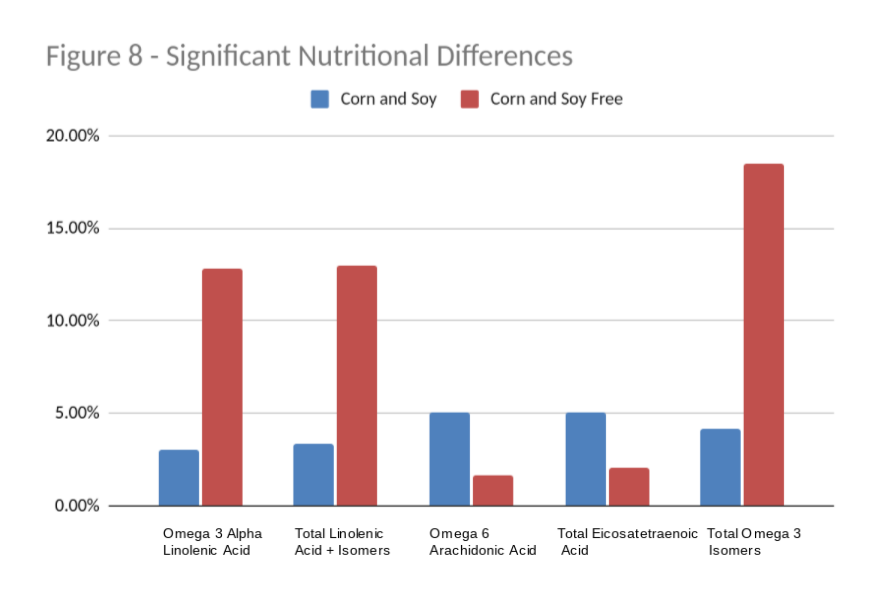
Omega-3 Fatty Acids
The two feed treatments had limited significant effect on one of the three main omega-3 fatty acids, alpha-linolenic acid (ALA), EPA and DHA in the meat. EPA and DHA were not present at detectable levels in the meat. In the meat of the corn and soy free groups, ALA was .128% and .03% in the corn and soy groups. Omega-3 fatty acids are important to human health. Higher levels of Omega-3 fatty acids aid in heart health, lowers triglycerides (fats) in blood, and has antithrombotic, anti inflammatory and antiarrhythmic properties. The closer the Omega-3 to Omega-6 ratio is to 1 the better. A lower ratio of Omega-3 to Omega-6 fatty acids is commonly accepted as being better for health. The ratio of the meat from the corn and soy free chickens was 1:1.3 whereas the meat from the corn and soy chickens was 1:11.
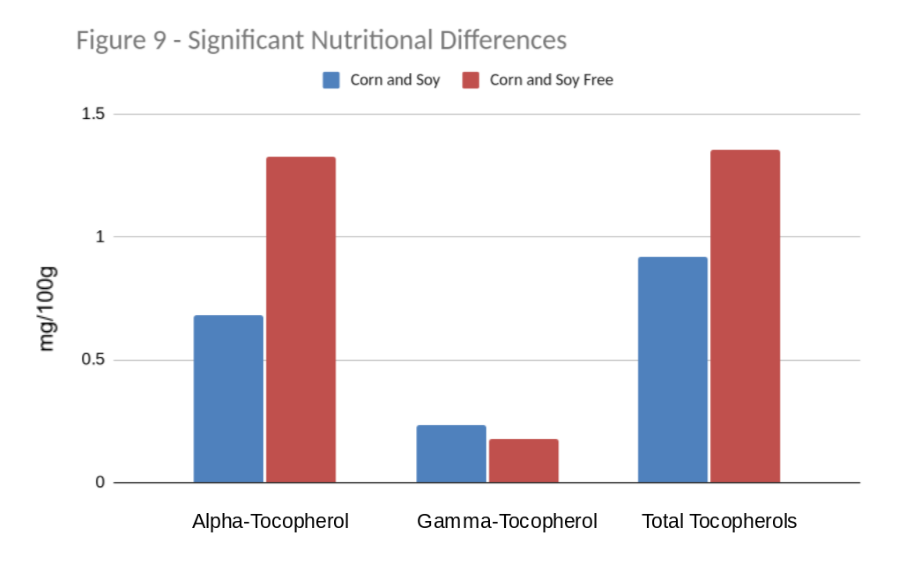
Alpha-tocopherol (Vitamin E)
The two feed treatments also showed a difference in alpha-tocopherol (Vitamin E) content in the meat tissue. Alpha-tocopherol is the most active form of Vitamin E for animals. The corn and soy free groups had 1.33 mg/100g of alpha tocopherol in the meat compared to .68 in the corn and soy fed groups. Figure 9 shows the difference in Vitamin E levels in the meat between the corn and soy and corn and soy free chickens. The Vitamin E contents in the corn and soy free starter is 50 IU/pound minimum and 35 IU/pound minimum in the grower whereas the Vitamin E in the corn and soy starter and grower is 5 IU/pound. The higher levels of Vitamin E in the corn and soy free feed is one reason there are higher amounts of Vitamin E in the meat tissue samples in the corn and soy free chickens. However, because we were unable to get the specifics of the feed rations, it is unclear if the higher levels of Vitamin E is caused by the major ingredients such as organic peas, barley and flax meal, or if the Vitamin E levels were higher in the premix compared to the corn and soy feed. The increased amount of Vitamin E in the meat tissue from the corn and soy free chickens could also be due in part to the flax seed in the feed.
Feathering Observations
The methionine levels were higher in the corn and soy starter feed compared to the corn and soy free feed. The corn and soy free feed is organic and the organic standards allow 2 pounds of synthetic methionine per ton of feed. This could explain the poor feathering in groups 2 and 3 fed the corn and soy free feed. It can also lead to lower growth rates and lower carcass weights.
Seasonal Differences in Nutrition Testing
After breaking down results by both treatment (type of feed) and batch (time of year), there were no statistical differences in any of the categories based on season with the exception of cholesterol. The cholesterol in batch 3 treatment 2 appeared to have a significant interaction between batch and treatment.
|
Corn and Soy (Groups 1 and 4) |
Corn and Soy Free (Groups 2 and 3) |
|
|
Total Omega 3 Isomers - (%) |
.0417 |
.185 |
|
Alpha- Tocopherol - (mg/100 g) |
.684 |
1.327 |
|
Gamma-Tocopherol - (mg/100 g) |
.232 |
.1795 |
|
Total Tocopherols - (mg/100 g) |
.9165 |
1.355 |
|
Palmitic Acid) - (%) |
.31 |
.202 |
|
Stearic Acid) - (%) |
.125 |
.1 |
|
Omega 9 (Oleic Acid) - (%) |
.43 |
.2787 |
|
Total (Oleic Acid + isomers) - (%) |
.47 |
.315 |
|
Omega 6 (Linoleic Acid) - (%) |
.328 |
.1633 |
|
Total (Linoleic Acid + isomers) - (%) |
.338 |
.1783 |
|
Omega 3 (Alpha Linolenic Acid) - (%) |
.03 |
.1283 |
|
Total (Linolenic Acid + isomers) - (%) |
.0333 |
.13 |
|
Omega 6 (Arachidonic Acid) - (%) |
.05 |
.0167 |
|
Total (Eicosatetraenoic Acid) - (%) |
.05 |
.02 |
|
Cholesterol - (mg/100 g) |
77.4 |
76 |
|
Total Fat as Triglycerides - (%) |
1.528 |
1.12 |
|
Total Fatty Acids - (%) |
1.458 |
1.072 |
|
Total Monounsaturated Fatty Acids - (%) |
.53 |
.35 |
|
Total Omega 3 Isomers - (%) |
.0417 |
.185 |
|
Total Omega 6 Isomers - (%) |
.405 |
.2 |
|
Total Omega 7 Isomers - (%) |
.0767 |
.045 |
|
Total Omega 9 Isomers - (%) |
.433 |
.29 |
|
Total Polyunsaturated Fatty Acids - (%) |
.47 |
.398 |
|
Total Saturated Fatty Acids - (%) |
.455 |
.3167 |
|
Alpha- Tocopherol - (mg/100 g) |
.684 |
1.327 |
|
Gamma-Tocopherol - (mg/100 g) |
.232 |
.1795 |
|
Total Tocopherols - (mg/100 g) |
.9165 |
1.355 |
Educational & Outreach Activities
Participation summary:
Online Trainings - Jared Luhman hosted the Sustainable Farming Association Livestock Webinar Series on pastured poultry production on February 10, 2022. 110 farmers and ranchers registered. Here is a video of that presentation: https://youtu.be/4De9DHbTqsI
On-Farm Demonstrations - Grassfed Cattle Co. was chosen as a Greener Pastures Farm Feature. We demonstrated how to move the hoop house and how we care for the chickens. Here is a link to that video: https://youtu.be/NgtHU0YQpqE
Articles, Newsletters - Grassfed Cattle Co. newsletter updating 3,800 customers on our email list (15-20% average open rate) on the grant results. Our Greener Pastures Blog and video reached 164 farmers and consumers. The Farmer article "30 Under 30: Young People Impacting Agriculture," was also featured in the Beef Magazine, although only a small portion. We were highlighted in articles in the Star Tribune and Bloomberg for our livestock management in drought conditions.
Tours - Farm tours for customers, other current and potential pastured poultry farmers
Presentations - Valerie will be presenting at the Sustainable Farming Association Annual Conference. It was postponed due to COVID but is scheduled for March 18. 225 attendees are expected.
Podcasts - Valerie and Jared shared their project and results on the Sustainable Farming Association Dirt Rich Podcast. The SFA Podcast has an average of 455 listeners per episode. Valerie will also be speaking on the Direct Farm Podcast in February 2022 and will mention their grant research project.
Learning Outcomes
This grant helped us understand the impact different feed types have on the production of pastured chickens. We learned by feeding corn and soy free feed, the chickens take over 30% more time and over 30% more feed than chickens fed a standard non-gmo corn and soy feed to get to the same weight. In addition to consuming more feed, the corn and soy free feed was 88% more expensive than the corn and soy feed per pound. The chicks in the first batch of chickens we raised were exposed to sickness at the hatchery and while we lost many chicks from both groups, the corn and soy free chickens died at higher rates leading us to believe the feed resulted in a chicken that was less able to fight off health issues. These higher mortality rates continued in the corn and soy free chickens throughout the batches. The additional labor, feed, feed costs and mortality all lead to requiring a significantly higher price per pound of meat in order to sell them at a profit.
We invested in a Mobile Range Coop that allows us to raise up to 600 birds per batch. Today, this mobile range coop will cost around $10,000 to build. When you have a significant investment in overhead to raise the chickens, higher turnover and spreading it over more chickens is a key to being profitable. We increase turnover by reducing the amount of time each batch is raised in the chicken house and raising more batches. By raising corn and soy free chickens we are only able to raise 4 batches of chickens or 2400 chickens in our growing season as opposed to 5 batches or 3000 chickens if we feed corn and soy free feed and finish 2-3 weeks faster. The potential to increase profit by spreading overhead over more chickens and having more total chickens to sell needs to be considered as opportunity cost against the corn and soy free chickens. Alternatively, you can look at low cost chicken production models such as Salatin style chicken tractors but these tend to have higher labor costs associated due to less efficient systems.
We market our meat through our brand Grass Fed Cattle Company. Although we had many customers ask for corn and soy free chickens, we found that only some of those customers were willing to pay the price required to justify raising large quantities of chicken with corn and soy free feed. Farmers considering feeding corn and soy free feed should be confident in their customers willingness to pay a premium price. If you are unsure of your market, we suggest pre-orders with deposits prior to raising these chickens.
An additional observation through this project is the importance of managing brooder temperature with young chicks. In the third batch on the night of August 20th, the temperature outdoors reached 56 degrees at night and one of the heat lamp bulbs burned out in the group 3 brooder. We lost over 30 chicks that day and over 20 more in the following 2 days. While we knew this was important, we had never had this issue and it became clear to us how important maintaining brooder temperature is. Consider having a temperature alarm for large batches.
Adding a chicken enterprise impacted our farm in many ways. This is a way for us to stack enterprises or produce multiple meat products off of the same acres. This further diversifies our farm so that we are not dependent on one production enterprise to generate all of our income. We feel this added diversification makes our business more resilient to market swings.
Another huge advantage of the chicken enterprise is the soil health and fertility building opportunity. While raising 3 batches of chickens we covered around 2 acres of pasture with this hoop house. We use this system as a way to import fertility in the form of chicken feed that is consumed by the chickens and applied naturally in the form of chicken manure. It is unsurprising but there was a clear and significant impact to grass production where the chickens had been. Even though 2021 was an extremely dry year, the pasture where the chickens were was significantly more productive and stayed green later into the fall when the rest had gone dormant. We look forward to seeing how it impacts soil and forage production in years to come. This can be an excellent way to improve soil health on low fertility areas of the farm. Additionally, composted wood shavings and chicken manure from the brooder makes great fertilizer for a garden or field.
We move cattle to new paddock early in the afternoon when brix readings are highest in the pasture and also to get cattle eating in the heat of the day to avoid crowding and push back their highest internal body temperature until the cooler part of the day. We also cut and make hay in the afternoons for similar reasons and to wait until the dew is gone. However, chicken chores are best done first thing in the morning when it’s cool. For our farm, the addition of a chicken enterprise compliments our other enterprises from a labor standpoint because the bulk of the work takes place at different times of the day. Additionally as parents of a 6 month old, we are excited for the potential of this enterprise to be something that our children can participate in from a young age and stay safe!
Project Outcomes
We recommend another pastured poultry farmer study the impact of feeding corn and soy starter and switching to corn and soy free grower after 2 weeks. After reviewing and analyzing our results with Dr. Noll, we agreed this may impact the growth of the corn and soy free chickens.
Our research was funded through both the SARE grant as well as the Agriculture, Growth, Research and Innovation Sustainable Ag Demonstration grant. However, during year one we found that due to the high mortality, low growth rate, and higher feed costs, we didn't have the demand for these chickens at the price required to justify raising them. Additionally, the cost of nutritional testing that was written into the grant had increased significantly from our initial quote, cutting into the grant funding for the rest of the production expenses. Lastly, we didn't feel a second year was necessary to confirm the results we set out to discover.