Final Report for FNE16-861
Project Information
The bay scallop (Argopecten irradians) commercial fishery in New England, which was once robust and profitable for fishermen, has been in rapid decline since the 1980’s due to overfishing, habitat loss, and coastal water quality degradation. Over the past decade there has been a renaissance in shellfish production throughout New England, though the oysters and clams are now being produced through farming instead of through wild harvest. Shellfish farmers are currently seeking new species to grow, in order to increase revenue and diversify risk, and given the high market demand for bay scallops combined with a lack of significant wild supply, they are an ideal aquaculture candidate. However, current bay scallop aquaculture techniques are not efficient, which leads to high mortalities, as well as high labor and gear costs. Therefore, further investigations into the nursery, as well as the growout and overwintering phases, are needed to help make bay scallop aquaculture viable.
Ward Aquafarms starting farming bay scallops in 2014, and they quickly realized that simply copying existing oyster farming methods was not going to be effective to produce bay scallops. In 2015 Ward Aquafarms designed and constructed a floating downweller system for the bay scallop nursery phase, which greatly improved survival and growth, leading to much more efficient techniques. In 2016, Ward Aquafarms further investigated optimization of the nursery phase to increase cultivation viability, with the goal of faster growth rates, higher survival and higher stocking densities. During an eight week observation period (July-September 2016), Ward Aquafarms investigated the differences in bay scallop growth, survival, and food availability in relation to flow rates and initial stocking densities.
Stocking densities for each of twelve silos were modified at the beginning of each two week stocking period, dependent on scallop size, gear mesh size and desired initial stocking densities. Initial stocking densities ranged from 900 scallops/m2 to 36,626 scallops/m2, which resulted in survival ranging from 77.9% – 86.2% and growth rate range from 0.05 mm/day – 0.70 mm/day. Flow rates between the silos ranged from 1,478 cm3/sec – 5,666 cm3/sec, though there was no correlation between flow rate and growth or survival. As is common in the natural environment, there was high variability in observed chlorophyll a and phycocyanin values, which resulted in either no correlation, or a weak relationship between available microalgae and production statistics. Provided there was sufficient available food, initial stocking density (scallops/m2) was shown to be the primary factor which determined growth rate and survival. It was proven that with augmented water flow, bay scallops can be grown at very high densities, with no apparent decrease in growth or survival until the stocking density exceeds 18,000 scallops/m2, at an average shell height exceeding 11.8 mm.
The results indicate that as the initial stocking densities are increased, overall bay scallop growth decreases. However, stocking density did not have a significant effect on survival, as very little death was seen at any stocking density during the entire nursery phase. Neither flow rates nor food availability proved to significantly impact growth or survival of bay scallops at any tested stocking densities. The results of this work will allow a farmer to fine tune their bay scallop stocking densities to either maximize growth or survival based on the known microalgal food density in their waters. Results of the project were presented at the Northeast Aquaculture Conference and Exposition (NACE) in January 2017 to inform farmers and researchers how to optimize bay scallop growth for their specific requirements during the nursery phase.
Introduction:
In Massachusetts, the number of shellfish farms has grown from 230 to 315 farms from 2005-2010, and contributes to an annual dockside revenue of $45-$50 million to New England communities (Lapointe, 2013; Reitsma et al., 2012). Currently, most of these aquaculture farms produce primarily oysters, and many farmers are seeking new crops to cultivate in order to diversify risk and increase farm revenue. Given that bay scallops already have an established market, and their demand is high, but the commercial fishery is diminishing, they present an excellent option for shellfish farmers to expand their crops. Farmers who already cultivate shellfish could make an easy transition to bay scallop aquaculture because bay scallop aquaculture uses similar farming gear and techniques, reducing startup costs for already established shellfish farmers. Given the reduced startup costs, and an already established market, the addition of bay scallops presents a logical and simple addition as new sustainable shellfish crop and a source of additional farm revenue.
Bay scallop seed is available for purchase from hatcheries, but efficient techniques for growing hatchery seed (0.75mm) to growout size (20mm) are still not fully understood. Although the creation of the Floating Upweller System (FLUPSY) solved the complementary issue with oyster seed, allowing for high survival and growth during the nursery phase, it is not sufficient for bay scallops (Rhodes et al., 2005). Since bay scallops have the ability to swim, they are able to escape from a FLUPSY. Additionally, bay scallops require greater surface area than the single level of a FLUPSY silo provides. These pitfalls of the FLUPSY for bay scallops were discovered by Ward Aquafarms in 2014. In 2015, Ward Aquafarms built a pilot scale floating downweller system. Similar in function to a FLUPSY, the downweller reversed the flow and increased surface area by adding multiple nested trays to each silo (Fig. 4). In 2015, Ward Aquaframs was able to grow bay scallops to growout size (20mm) in 30-60 days using the downweller nursery system. The downweller system appeared to promote high survival and growth, but the number of bay scallops which the downweller can be produced based on stocking density was not fully understood. By optimizing bay scallop nursery techniques, efficiency gains could lead to increased farm revenue and sustainable protein production, as well as increased ecosystem health benefits provided by shellfish aquaculture.
In 2016, Ward Aquafarms LLC built a second downweller nursery system, which was placed in Fiddler’s Cove Marina (North Falmouth, MA) in June 2016. Currently, Dr. Ward (farm owner) has two bay scallop downweller systems and one oyster FLUPSY within Fiddler’s Cove Marina. Ward Aquafarms also has 3 sites, spanning 10 acres, in outer Megansett Harbor (Fig. 1). Dr. Ward is permitted to grow eastern oysters, quahogs, and bay scallops on his 3 sites. Dr. Ward and Harrison Tobi (research assistant) were engaged in every stage of the bay scallop nursery research, which was carried out using both downweller systems in Fiddler’s Cove Marina. Once the bay scallops were at growout size, they were put into cages with 12.7 mm mesh, and deployed on the 10 acres lease in the outer Megansett by Dr. Ward and Mr. Tobi.
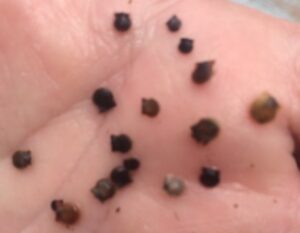
Figure 1: Scallops after seven days in downweller system. Scallops entered the downweller system at approximately 1 mm shell height (SH) and after seven days approached 5 mm SH
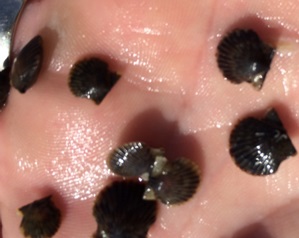
Figure 2: Scallops after 24 days in downweller system. Total average SH was approximately 10 mm. 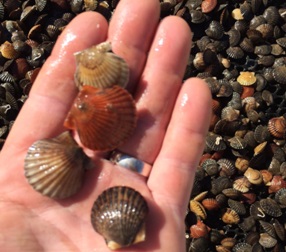
Figure 3: Scallops after 48 days in downweller system; average SH 15 mm. 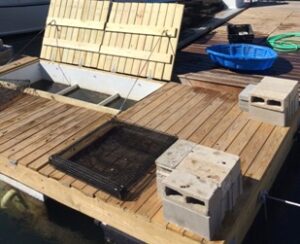
Figure 4: Ward Aquafarms’ downweller nursery systems, opened to show three of the twelve silos; one of the nested trays in the foreground.
From July to September of 2016, Ward Aquafarms investigated the best way optimize growth rates and survival of bay scallop seed from the hatchery (.75mm) to a size ready for growout (20-25mm) (Figs. 1-4).
- Ward Aquafarms evaluated four different initial stocking densities over the entire nursery phase (July to September 2016), comparing flow rates, food depletion, survival, and growth rates in a bay scallop downweller system.
This objective was achieved by comparing four different initial stocking densities over three different mesh sizes over three, two-week sampling periods throughout the nursery season. Initial stocking densities were based on the findings of Leavitt and Karney (2010) for bay scallops in bags with no additional water flow. Given that the downwellers increase water flow, and maintain enhanced flow rates, and therefore higher food availability, we increased the stocking density in the four treatments to either 2X, 4X or 8X standard stocking density (1:2:4:8 ratios) as compared to the published stocking densities for a system without augmented flow. Scallops were grown in downweller systems for 10 weeks from July through September, with sampling starting after two weeks of acclimation to the system.
Every 14 days, all of the twelve stocked silos were assessed in an identical manner. Flow rates entering each silo were measured using a flow meter. Water samples were taken both at the water intake of the downwellers, and at the water exit point of each silo to quantify total chlorophyll a, phycocyanin content, and total Cochlodinium polykrikoides cells within each water sample at each sampling period.
Once flow rate and food availability measurements were taken, all of the nested trays holding the bay scallops were removed from the silos. Scallops from each silo were then graded to separate size classes. Once separate, shell heights were recorded for twenty individuals per size class, individual counts were taken of live scallops per 100 ml, total volumes were recorded for each size class for each individual silo.
- Results will be made public so shellfish farmers in the northeast region can begin to grow bay scallops.
Findings will be published in a leading aquaculture academic journal, and were presented at the Northeast Aquaculture Conference and Exposition (NACE) in January 2017 to make findings available to farmers and scientists looking to pursue bay scallop aquaculture.
Cooperators
Research
Daniel Ward (farm owner) and Harrison Tobi (research assistant), constructed a second floating downweller system in the April-May of 2016. Once the downweller was completed, it was placed in Fiddler’s Cove Marina (North Falmouth, MA). In July of 2016, 500,000 bay scallops were purchased from Muscongus Bay Aquaculture (Bremen, ME) at a size of 0.75 mm by Dr. Ward. Upon arrival, Mr. Tobi and Dr. Ward, divided the bay scallops evenly into 12 trays (3’W x 3’L x 4” H) lined with 0.75mm mesh and placed each tray on an empty tray with no mesh, and moved them into 12 different silos in the downweller for the first two weeks. Before removing scallops for the first, and each of the following sampling periods, flow rates entering each silo were measured using a YSI Flow Probe (Yellow Springs, OH). Water samples were taken both at the water intake of the downwellers, and at the water exit point of each silo to measure total chlorophyll a and phycocyanin content (total relative fluorescence units; Handheld Dual Channel Fluorometer, Beagle Bioproducts, Columbus, OH; as a proxy for suspended microalgae). A bloom of the harmful algae Cochlodinium polykrikoides was noticed on July 23rd, and for the remainder of the experiment, at each sampling period total C. polykrikoides cells within each water sample, entering and leaving the silos was quantified as well. After the first two weeks, triplicates of four different stocking densities were maintained at the ratios: 8:4:2:1 for the entire nursery period in randomly selected silos of two downweller systems.
For the first two week period, beginning on July 27th 2016, 3 silos were stocked at 61,248 scallops/silo (36,626/m2), 3 silos at 30,624 scallops/tray (18,313/m2), 3 silos at 15,312 scallops/tray (9,156/m2) and 3 silos at 7,656 scallops/tray (4,578/m2) on 4 mm mesh. Every 14 days following the first sampling period, the bay scallops were removed from the downweller silos for each sampling period. Once emptied, scallops were graded based on size to reduce densities and increase the mesh size on downweller trays for the subsequent sampling period. After grading was completed using three different mesh sizes (12.7 mm, 6 mm, and 4 mm), 100 ml individual scallop counts, shell heights, and volumes were obtained for each size class for each sampling period. After grading scallops from the first sampling period, medium and small scallops (graded on 6 and 4mm mesh) were moved into used for stocking downweller silos for the second sampling (beginning August 11th 2016), and large scallops (>12.7 mm) were moved to growout cages. Scallops were stocked in triplicates of 62,997 scallops/silo (18,836/m2), 31,499 scallops/silo (9,418/m2), 15,749 scallops/silo (4,709/m2), and 7,875 scallops/silo (2,355/m2) for the second sampling period. After grading and measurements, only large scallops were stocked back into the downwellers on August 29th 2016. For the third sampling period, silos were stocked in triplicates, placed in randomly selected silos at 24,080 scallops/silo (7,200/m2), 12,040 scallops/tray (3,600/m2), 6,020 scallops/tray (1,800/m2) and 3 silos at 3,010 scallops/tray (900/m2). On September 13th 2016, at the end of the third two week sampling, grading and measurements was completed, and all large scallops were moved to growout cages.
After all scallops had left the downweller systems, data from the individual sampling periods were entered into Microsoft Excel workbooks. Data was analyzed to assess survival, growth rates, percent volumes of different sized bay scallops, and food depletion at different bay scallop stocking densities and flow rates. Where applicable, all analyses done in Microsoft Excel were assessed for validity using either one-way or two-way ANOVA tests using Graphpad Prism (La Jolla, CA).
During the six-week sampling period, percent survival based on size ranges of initial stocking densities (< 2,000, 2,200-4,000, 4,500-5,000, 7,000-9,500, and >18,000 scallops/m2), using total number of scallops stocked per silo (900 scallops/m2 to 36,626 scallops/m2) and total number alive at the end of the two-week sampling period (722 scallops/m2 to 31,529 scallops/m2), ranged from 77.9 ± 11.0% - 86.2 ± 6.6% (Table 1; all values mean ± SD unless otherwise noted). There were no significant differences in survival at the conclusion of each any of the two-week sampling periods, regardless of stocking density (ANOVA, α=0.05, n=5, P-value= 0.4278). While the differences in survival between treatments were not significant due to low variability, the differences between groups in terms of actual number of scallops was quite large (Fig. 5). For example, during the second two-week sampling period, silo 1 stocked at the mid-low level (2X low stocking density; 9,156 scallops/m2) had a final survival value of 86.6%, which meant 1,227 scallops died during the two-week growth period. During the same time period silo 6 stocked at the high level (8X low stocking density; 36,626 scallops/m2) had an almost identical final survival value of 86.0%, though under the higher stocking density, this meant a loss of 5,097 scallops over the same sampling period. Therefore it is in the farmer’s best interests to decide on optimizing survival or growth during the nursery period, as with the higher stocking densities, even a slight decrease in survival as compared to a lower stocking density can have a much larger impact.
Growth rates for the first two week sampling period decreased as stocking density increased (Pearson r, α=0.05, two-tailed P-value= 0.0029, R2=0.6054), with growth ranging from 0.04 mm/day to 0.35 mm/day (Fig. 6). For the second two week sampling week, the reduction in growth rate given an increase in stocking density was greater as compared to the first two week sampling period (Fig. 7). Growth rates decreased as stocking density increased (Pearson r, α=0.05, two-tailed P-value= 0.0002, R2=0.7627), with growth rates ranging from 0.20 mm/day to 0.45 mm/day (Fig. 7). Growth rates in the third two week sampling period showed an even greater reduction (Pearson r, α=0.05, two-tailed P-value= 0.0001, R2=0.7789), as stocking density increased compared to previous sampling weeks, with growth rates ranging from 0.16 mm/day to 0.39 mm/day (Fig. 8). These results indicate, that as initial stocking density (scallops/m2) is increased, a reduction in bay scallop growth rate occurs (Fig. 9). When each week is evaluated individually (average initial size of scallops was 9.8 ± 1.5 mm for the first two week sampling period, 11.8 ± 2.8 mm for the second and 18.6 ± 2.1 mm for the second sampling period), it can also be concluded, that both as scallops grow in size over the nursery stage, and as growth rate increases with increasing water temperature, scallop size plays a larger role in determining growth rate when scallops are stocked at a larger size (Figs. 6-8). Investigating each week individually, and knowing the average size of the scallops stocked during each sampling period, estimates can be made by a farmer as to which stocking density (scallops/m2) is optimum for each size to maximize number of individuals stocked and maximize growth to desired final size.
Initial stocking density (scallops/m2) directly affected the final volume and total number of small, medium and large scallops after each two week sampling period. As initial stocking density increased, the percentage of large scallops out of the overall final volume within each silo decreased, and the final volume of small and medium scallops increased as stocking density increased (Pearson r, α=0.05, two-tailed P-value= < 0.0001, R2=0.6871) (Fig. 10). This means that although there are more animals stocked at the higher densities, there are fewer were can be graded out at the largest size at the 8X stocking density. The mortality of scallops at all size classes also increased as the initial stocking density increased as well. Therefore, it is up to the farmer to decide which aspect of the nursery phase to optimize based on individual farm management strategies. If the farmer would like the greatest number of bay scallops out of the system, then stock at higher densities, even though it may take longer for the shellfish to get to a given shell height. However, if the farmer would like to have a set number of scallops at a larger shell height as early as possible in the season, then a lower stocking density, which would result in lower overall yield, would be required.
Total chlorophyll a and phycocyanin RFU (relative fluorescence unit) was quantified as an assessment of available food (phytoplankton) for the bay scallops. The results indicated that flow rates (cm3/sec) did not have a significant influence on chlorophyll a availability when measured for the second two-week sampling period (Pearson r, α=0.05, two-tailed P-value= 0.3787, R2=0.02508) (Fig. 12), whereas there was a weak, but significant correlation between flow rate and phycocyanin levels (Pearson r, α=0.05, two-tailed P-value= 0.0049, R2=0.2281) (Fig. 13). While there was not a significant correlation between chlorophyll a and flow rates, there was a weak but significant correlation between chlorophyll a levels and final scallop stocking density (Pearson r, α=0.05, two-tailed P-value= 0.0107, R2=0.1921). Additionally, while there was a weak but significant correlation between phycocyanin level and flow rate, there was not a significant correlation between phycocyanin and final scallop stocking density (Pearson r, α=0.05, two-tailed P-value= 0.1677, R2=0.06048). All of the analysis between food availability (chlorophyll a or phycocyanin) and either stocking density or flow rates, resulted in either no significant correlation, or a weak relationship between variables. Thus, it appears that food is not limiting the growth of scallops, but rather space limitation caused by overstocking, in an environment with high rates of flow, with high food availability to the scallops in the downweller system (Figs. 6-9 and 11).
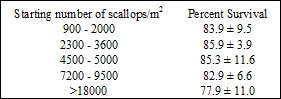
Table1: Percent Survival based on initial bay scallop stocking density (scallops/m2) 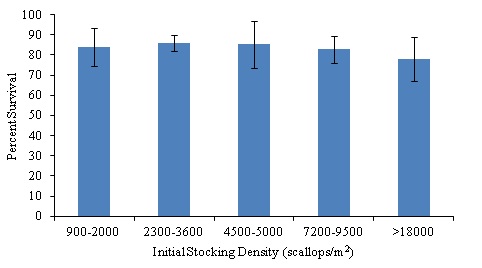
Figure 5: Percent survival of bay scallops in downweller systems for initial bay scallop stocking densities ranging from 900 scallops/m2 to 36626 scallops/m2. No significant differences in survival at the conclusion of each any of the two-week sampling periods, regardless of stocking density (ANOVA, α=0.05, n=5, P-value= 0.4278).

Figure 6: Bay scallop growth rates (mm/day) based on initial stocking density (scallops/m2) for first two week sampling period.

Figure 7: Bay scallop growth rates (mm/day) based on initial stocking density (scallops/m2) for second two week sampling period.

Figure 8: Bay scallop growth rates (mm/day) based on initial stocking density (scallops/m2) for third two week sampling period.

Figure 9: Bay scallop growth rates (mm/day) based on initial stocking density (scallops/m2) for all two week sampling periods.
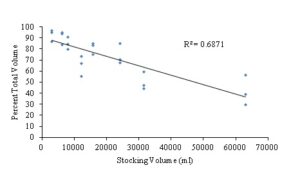
Figure 10: Percent total volume of large scallops only across all sampling week periods based initial stocking volume (ml) for all sampling weeks. (Pearson r, α=0.05, two-tailed P-value= < 0.0001, R2=0.6871). 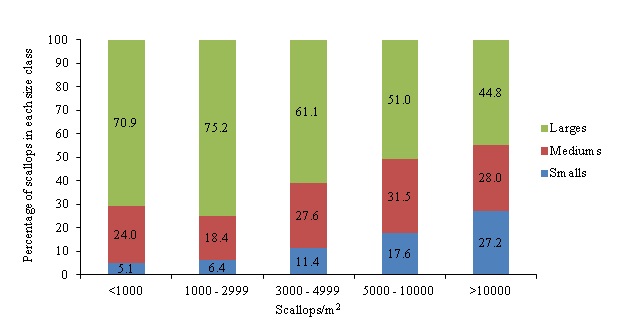
Figure 11: Percentage of scallops for each size range per stocking density for sampling weeks two through six based on initial stocking density (scallops/m2).
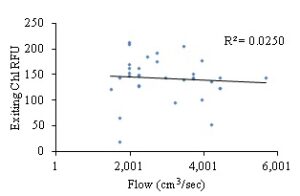
Figure 12: Exiting chlorophyll a RFU levels based on flow entering silo flow rates (cm3/sec). 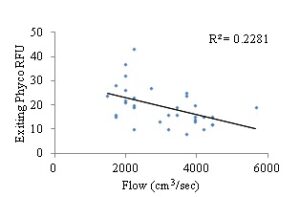
Figure 13: Exiting phycocyanin RFU levels based on flow entering silo flow rates (cm3/sec). 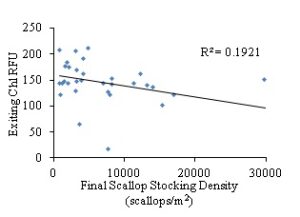
Figure 14: Exiting chlorophyll a pigment RFU levels based on final bay scallop stocking density (scallops/m2). 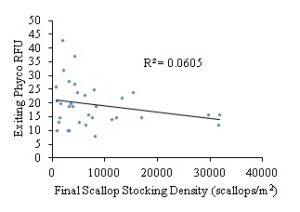
Figure 15: Exiting phycocyanin levels based on final bay scallop stocking density (scallops/m2).
Other farmers have not adopted the floating downweller system as of yet, though there has been quite a bit of interest. Farmers thoughout the Cape Cod area, as well as the Chesapeake region have expressed interest in bay scallop aquaculture, and have inquired about the nursery system. Results will be shared throughout 2017 with shellfish constables in Massachusetts and additional farmers, therefore interest will increase further, and perhaps by the following season additional farmers will adopt the practice.
Education & outreach activities and participation summary
Participation summary:
Ward Aquafarms has presented their findings at the Northeast Aquaculture Conference and Exposition (NACE) in January 2017 to inform farmers and researchers how to optimize bay scallop growth for their specific requirements during the nursery phase. Future publication of the findings in aquaculture focused journals will be completed in conjunction with findings from other bay scallop aquaculture experiments to help farmers through the nursery phase in order to achieve a marketable product.
Project Outcomes
Potential Contributions
By using a similar or identical design as the downwellers created at Ward Aquafarms, farmers can raise bay scallops using similar space requirements, tools, and skills as they utilize to raise oysters. By supplying high flow, food will be readily accessible to the bay scallops in the nursery system, with low food depletion, reducing the effects of food availability as a growth limiting factor. Depending on what size scallops the farm wishes to produce in the nursery stage and how quickly they wish to grow them to that desired size, and at what quantity, farmers can manipulate initial stocking densities of different sized scallops to achieve their desired product. Given the above applications of achieved results, Ward Aquafarms is confident that farmers can take this information to start diversifying and expanding their available farmed products and farm revenue.
Future Recommendations
In conducting this experiment, Ward Aquafarms achieved the goal of investigating the optimization of the nursery phase. It was discovered that stocking density (scallops/m2) had a large effect on bay scallop growth (mm/day), percent survival, and the number of large, medium, and small scallops produced at different stocking densities. Using this information, Ward Aquafarms intends to use variable stocking densities to achieve specific farm objectives. If we intend to sell primarily seed, higher stocking densities will be used, for greater numbers of scallops are desired at small size, so getting only large scallops is not as important as growing hatchery sized seed (0.75mm) to a size suitable for a nursery (10mm) in a short period of time, in large quantities. However, if the objective is to grow the bay scallops as big as possible, in the shortest period of time in order to put the shellfish into the growout stage, initial stocking densities will be lower based on initial size of the scallops and desired finishing size.
The next step of the project is to better optimize the growout practices once the bay scallops leave the downweller nursery systems. Ward Aquafarms has been, and currently is investigating multiple growout methods in multiple environments in Cape Cod to assess which growout methods maximize growth before the overwintering phase. Over the winter of 2017, Ward Aquafarms has undertaken research to investigate survival and parasitism during the overwinter phase to determine when to move the scallops to different gear for the final growout period. The results from the SARE project have allowed Ward Aquafarms to optimize the nursery phase, and further investigate the next stages in growing bay scallops. These further investigations are leading to the optimization of every stage in bay scallop aquaculture, bringing bay scallops back to the market, increasing local dockside revenue, providing new jobs, and helping increase farm security via stock diversification for farmers in the northeastern United States.