Final report for FNE17-882
Project Information
The purpose of the project is to gain an understanding of honey bee pollen foraging habits in central Appalachia that is fact based and comprehensive.
Beekeepers in five locations trapped pollen weekly or bi-weekly throughout the active foraging season according to a standardized protocol. After having individual pollen samples treated with acetolysis, the project leader was able to perform microscopic examination of the pollen grains, identify the taxa present, and determine their relative abundance. This provided an understanding of which plants where being visited and how much of the bees’ pollen income was being obtained from each plant, and enabled the project leader to compile charts so that the samples from different locations and different seasons could be compared. Charts where also compiled showing which plants provided the highest amounts of pollen, and which plants provided the highest percentage of pollen in the samples. The March-through-June samples were analyzed and reported on in an earlier project, and the July-through-October samples were analyzed and reported on in this project.
Interesting results included the fact that the samples overall contained very little pollen from commercial crop plants. No Soy pollen was found in any of the samples, and corn was found to a meaningful degree in only one sample. Winged Sumac was found to have very high potential for a bee forage plant. Although it was not found in all locations, it accounted for more pollen intake than any other plant, sometimes by over 300%, and was a consistent bloomer from year to year. Clover and Wingstem pollen were important pollen sources almost universally. Ragweed pollen was collected to a surprisingly high degree, approaching clover in quantity. Probably the most universally important pollen type across locations was the Goldenrod type. On average, the August samples contained the highest plant diversity.
The final outreach report was posted online and beekeeper organizations in West Virginia and surrounding states (Virginia, Maryland, Pennsylvania, Ohio, and Kentucky) were notified. A summary report was delivered at the West Virginia Beekeepers Association (WVBA) annual November executive board meeting and an article submitted for the WVBA 2019 spring newsletter and to the American Bee Journal.
The objective of this project is to provide for the first time, in an easy-to-understand format, a set of fact-based charts describing the relative abundance of each plant type in its contribution of pollen to honey bees during the summer and fall months (July-October) in Appalachia as bees and beekeepers prepare for winter. We will use pollen trapped at hive entrances according to a standardized protocol, pollen treatment with acetolysis, and microscopic examination of a minimum of 200 random pollen grains per sample to answer the following questions:
• What pollen types are the bees collecting?
• What is the percentage of each type at each time period?
• When are the bees bringing in the highest and lowest quantities?
• How much does it change from one location to the next?
• How much does it change from one year to the next?
• Which wild plants are most valuable to honey bee nutrition and health?
• What gaps in natural honey bee forage need to be filled?
• Are there preferable bloom periods for harvesting pollen for marketing or for supplemental honey bee feed without jeopardizing colony health?
The purpose of the project is to gain an understanding of honey bee pollen foraging habits in central Appalachia that is fact based and comprehensive. It is a region of high plant diversity and the value of this diversity to bees remains scientifically undocumented. While nectar provides bees primarily with carbohydrate, it is pollen that supplies the protein, fat, vitamins, and minerals. Historically, honey production has been the focus of most honey bee foraging research, but it is evident that pollen foraging is equally important.
Optimal nutrition is essential for every aspect of honey bee behavior including demonstration of mite resistance. While mite infestation is the #1 issue facing most honey bee colonies in Appalachia, it is highly suspected that nutritional issues are a major factor contributing to winter collapse. This was glaringly obvious all over West Virginia in the fall and winter of 2017.
At our farm we have produced quality nucs and honey for sale over the last 8 years while treating less than 3% of our colonies and experiencing average winter losses below 35%. We constantly witness the incredible difference produced in colonies when good forage is available. But the definition of that "high quality forage" was often a big fuzzy question mark. After watching bees gathering nectar and pollen from plants not mentioned in the literature and ignoring plants that were, we decided some investigation was needed.
Furthermore, opportunities for land reclamation will always abound, and there have been large scale efforts to plant for pollinators. We hope that understanding pollen foraging will enable us to make good use of these opportunities by knowing and choosing plants that provide pollen throughout the active season.
Cooperators
- - Technical Advisor
Research
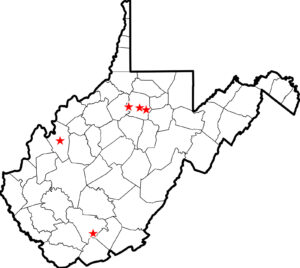 The pollen used in this study was gathered according to protocol by the project leader in 2013, 2014, and 2015, and by four other farmers in West Virginia in 2015.
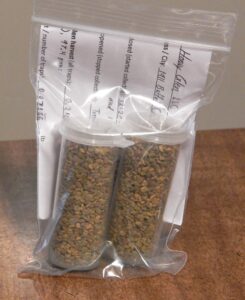 One polyfloral pollen pellet sample consisted of two 1-oz vials of pollen pellets taken from the mixed pellets of 3 or more traps in one apiary, trapped throughout one daylight period, labeled with the date, and contained in a sealable bag with a completed Pollen Sample Record Sheet. The samples had been collected weekly or biweekly using plastic front porch pollen traps and kept frozen until analysis.
 Our methods of pollen collection and preparation of samples was detailed in the West Virginia Pollen Project 2015. (See link and scroll down to Materials and Methods.)
Analysis of two or three samples from each month from each of the 5 locations provided enough data for a rough but acceptable picture of pollen foraging/intake. 62 samples were chosen for the July-through-October analysis.
Prior to analysis the pollen needed to be treated with acetolysis and stained to make the pollen grains identifiable with light microscopy. 22 July samples had already been treated in the 2015 Pollen Project, leaving 40 August-October samples to be treated.
Additional single-pellet samples were treated if needed to obtain better references to aid in identification of pollen grains.
In September 2017 the project leader sent the 40 August-October samples to Texas A&M University for treatment and began analysis of the July samples treated previously.
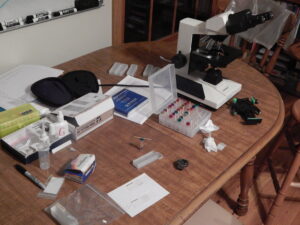 For analysis a small amount of treated pollen was added to a small drop of glycerin on a glass microscope slide, covered with a coverslip, sealed, and examined at 400x magnification, or at 1000x magnification when necessary. 400 individual pollen grains were counted and identified as accurately as possible to the family, Genus, or Species level. Other areas of the slide were also scanned to see if there were any noteworthy pollen grains of low abundance. The project leader decided to count 400 grains instead of 200 grains to increase the accuracy of the percentages. Pollen image references were supplied by the Technical Adviser to aid with identification. Other references that proved very helpful for pollen grain identification were Pollen and Spores by Ronald O. Kapp, 2nd edition, An Atlas of Airborne Pollen Grains and Common Fungus Spores of Canada (Canada Department of Agriculture), and the PalDat web site. Some helpful information was also found in Lindtner’s Garden Plants for Honey Bees. Broad knowledge of the region's flora helped narrow the possibilities, while extensive observations of honey bee preferences was extremely helpful to provide a starting point. A few unidentified pollen grains were photographed with a Nikon DS-Fi3 microscope camera and sent to the technical adviser for aid in identification. Data collection continued on the July and August samples through early December.
The counts for each view in the microscope were recorded in a spreadsheet which totaled the counts for each pollen type and calculated the percentages. The totals and percentages were then transferred to a Google Sheets document to form the tables and bar graphs used in the final report. The tables could be copied into the word document for the final report. The Chrome browser allowed the bar graphs to be easily saved as images for the reports. Considerable time was saved by holding off on bringing the final product into the final report until the analysis of all the samples was completed and all considerations for identification and categorization were complete.
From the data collected we were able to graph an accurate, comprehensive, verifiable picture of pollen intake for each location where pollen was collected for the months July through the end of the pollen collecting season in October. Tables and graphs were created to answer the questions listed in the Project Summary. The best understanding of the results, and answers to individual questions, are best obtained by viewing the tables and graphs.
The Pollen-Percentage-Tables-and-Bar-Graphs-July-October show the percentages of each pollen type in each sample. This data helps us determine which species are contributing most to the bees' nutritional intake at various times through the year. The bar graphs often helped visualize the changes that took place as different species came into bloom and faded away over time. Graphs from different locations, and the graphs from different years at the Salem location can be easily compared.
Additional-Lists were made according to the grant proposal including plants utilized during pollen shortage, plants contributing 45% or more of a sample, plants unique to one location, plants universally important, and a chart showing the level of diversity contained in each pollen sample analyzed.
The Average-Pollen-Intake-Graphs show the total amounts of pollen intake on a per hive basis at each collection point through the whole season so that beekeepers can see clearly when high or low amounts of pollen were being gathered by the bees.
The Pollen-Importance-Tables-July-October organize the pollen types found by level of importance based on both highest percentage found in any sample, and on highest amount in weight gathered per hive at any one time. One table is organized in descending order based on percentage, the other is organized in descending order based on amount gathered by weight. These tables show, based on our data, the highest degree that each taxa currently contributes to the bees’ pollen intake, considering all samples analyzed from all locations.
The Month-by-Month-Comments section gave further details along with the project leader’s interpretations of the data.
Some of the Asteraceae types of similar size and spine length were difficult to differentiate, partly due to incomplete references. 15 samples of individual pollen pellets previously collected from the field from bees working known plant species were sent to Texas in December 2017 to help fill in these references. This helped to verify the difficulty in differentiating between Goldenrod, Aster, and White Snakeroot pollen grains. A few more were sent in December 2018 to help finalize the comments on a few more pollen types, just prior to publishing the final project outreach report.
One question we had was whether the bees would gather a larger diversity of pollen types when pollen was scarce. When an abundant pollen source becomes available it would seem likely that the honey bees would maximize on that resource, while at times when pollen is scarce, the bees might fly further and make use of a wider variety of less desirable pollen types. While in a few cases this did appear to be the case, overall our observations have not consistently supported this hypothesis. The level of diversity in the pollen samples appears to have more to do with the time of year and the location where the samples were collected.
We also wondered if in fact the plants bees foraged upon differed significantly from one location to the next, or if the bees’ ability to forage widely would tend to have a moderating and equalizing effect. The two nearest locations in this study were more than 4 miles apart as the crow flies, so this study was not able to investigate this question in detail. The data collected however does confirm the former, that in a naturally diverse landscape, there are significant differences in foraging even between two fairly close locations. Reasons for this are still speculative, likely due to significant differences in forage from location to location and the tendency of honey bees to forage closer to home when food is abundant. The topography of our area may also significantly affect foraging behavior, as hills and valleys probably tend to channel bees into certain areas. As noted in the Materials and Methods section above, even two colonies at the same location can bring in significantly different ratios of the primary pollen types.
We sought to identify which plant types provided what percentage of the bees' pollen intake at each point through a given season and thereby come to a much better understanding of honey bee ecology in our region, i.e. their relationship to the surrounding plant life that sustains them, or at times, may fail to sustain them.
We also seek to learn at what times pollen income is superabundant, allowing beekeepers the opportunity to harvest excess pollen for human use, winter feeding, etc. Furthermore we can project what pollen types this product is likely to consist of at various times of the year.
Quantitative analysis was completed on all 62 July through October samples to produce relative abundance values for each pollen type at each collection date. The charts and graphs to visually display the resulting data were created and assembled into a final outreach report document to be shared with beekeepers and beekeeping organizations.
The study has revealed great variation in the amount of pollen collected by honey bees from season to season and from year to year. Hence it is important for beekeepers to watch the amount of both pollen and honey stored in the hive on a regular basis and not assume that forage in a particular season will be plentiful.
The study was successful in giving beekeepers in our area a fact-based picture of what their bees' pollen income looks like through the second half of the active season in an easy-to-understand format. We also demonstrated an effective method of establishing the facts.
This knowledge could have an extremely wide array of applications related to understanding how human activities that impact the landscape can either enhance or be detrimental to pollinator health.
Education & outreach activities and participation summary
Participation summary:
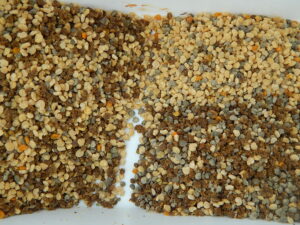
Once the analysis of the samples was complete a report was sent to four of the collaborating beekeepers showing the results for their specific location including images of their pollen pellet samples for color reference, and charts showing only the pollen types found in their samples. Additionally, a final report including the results from all the analyzed samples was compiled, posted online, and the link e-mailed to interested beekeepers throughout West Virginia. The neighboring states of Kentucky, Virginia, Maryland, Pennsylvania, and Ohio were also notified of the completion of the project. A journal article was submitted to the American Bee Journal and is expected to be published in their April 2019 issue. A similar article was submitted to the newsletter editor of the West Virginia Beekeepers Association for inclusion in their spring 2019 statewide newsletter. The project leader has used the knowledge gained to educate other beekeepers, although it is too soon for other beekeepers to have done much of the same, as the final report was just recently published.
Final-Published-Outreach-Report-Defining-Honey-Bee-Pollen-Sources-in-Appalachia-July-October
Learning Outcomes
Knowledge of honey bee forage. Selecting apiary locations. Awareness of the importance of plant species diversity in the landscape.
Project Outcomes
"It's nice to know if we have a fall crop that it could have Ragweed pollen in it for the people that have allergies and consume honey for relief. This whole project is eye-opening because of the bees bringing in different pollens that we had no idea about including the Sycamore in the spring" - Beekeeper from Harrison County
"Your pollen survey has definitely opened my eyes to the importance of maples in the spring. I understand that silver maple is even earlier than red maple and I have added silver maple to my list of trees to introduce in the landscape. I historically have looked at silver maple as a trash tree but your research has changed my mind. I fully agree with your assessment of Winged Sumac. I have seen this shrubby tree in the wild in Fayette County in early August and it was loaded with every kind of pollinator possible including honeybees." - Beekeeper from Fayette County
"I have certainly gained knowledge, attitude and awareness from the pollen project. Thanks for all your work!" - Organic grower in Elkins area.
"It has been very beneficial to me to learn what types of plants and trees are providing pollen sources for honey bees in our area so I can help my bees to survive and prosper in these difficult times when we are losing large quantities of bees due to a variety of reasons including lack of the proper feeding sources for the honey bees. Before the project I could only guess what types of pollen might be needed by my honey bees and I was never sure what types of pollen they preferred. This study has provided that information and there have been several surprises to me on what types of pollen they were bringing in. This project has provided me valuable information to allow me to know what types of plants and trees to look for in new locations where I will place my bees as I expand my operations. It has also given me information on where to move some existing apiaries I currently have to better provide pollen resources for my current operations. I am very much appreciative of the knowledge that has been obtained through this study and am appreciative of the hard work and dedication that Michael Staddon has provided in gathering this knowledge through his leadership and the many hours he has spent on this project in working with others and performing much of the work himself." - Beekeeper from Jackson County
We have been very satisfied with the approach taken and grateful for the groundwork and experience gained prior to the beginning of the project which enabled it to be successful so far.
One struggle in the study was been lack of microscopic imaging and software equipment to accurately measure the pollen grains and their surface features and send quality images to Professor Bryant to aid in identification. A microscope and camera was purchased by the project leader with the needed features for this type of research, which was helpful toward the end of the study and could also be used in future projects.
The volume information in the Pollen Importance Tables has limited accuracy at present. These calculations were made for each sample based simply on the pollen grain count and resulting percentages for each type, and the total weight of pollen collected in the sample. What the calculations did not consider was the sometimes drastic difference in individual pollen grain size. So, if the pollen grain count showed a smaller grain making up 50% of the sample, that pollen type would logically have made up less than 50% of the volume of the sample. Such differences in pollen grain volume were not taken into account when calculating the volume of each pollen type in a sample. The density of different pollen grains could also influence this calculation depending on whether actual weight or actual volume would be the more important factor to consider in a pollen’s importance to honey bees.
This project needs to be duplicated in other states, habitats, and regions all over the country. It could be especially significant to do this type of study pre-urbanization and post-urbanization of a particular location.
The Project Leader's region is in the heart of the coming massive shale drilling operations. Future studies could be used to assess the impact this may have on pollinators and habitat.