Report for FNE20-948
Project Information
Winters in New England routinely reach temperatures below freezing for months at a time. For years, growers in New England have turned to high tunnels to shelter their crops from snow and frost, extending their growing seasons by up to six months. Crop selection for unheated high tunnels are limited, so supplemental heat can broaden crop options during winter months. While increasing the variety of crops grown, costs can quickly climb to thousands of dollars per month. Hip Peas Farm was to measure the effectiveness of using an Earth Air Heat Exchanger (EAHE) to reduce heating costs. An EAHE draws warm ambient air heated by the sun through pipes buried in crushed stone during warm days, then draws heat from stone on cold nights to raise the greenhouse air temperature. A 50 degree minimum air temperature will be maintained in each of two separate high tunnels using an in ground radiant heating system in one, and an in ground radiant heating system plus the EAHE in the other. Hip Peas Farm already has these structures and does not require funding for their construction. The reduction in the amount of fossil fuel needed, and cost savings was to be measured, and the study was to determine the financial efficacy of using an EAHE. Unfortunately, the project leader was unable to complete the project, and research conclusions were not attained.
This project seeks to determine the efficacy of an Earth Air Heat Exchanger (EAHA) in reducing fossil fuel-based heating costs in winter growing high tunnels in NH. We will compare the fuel used in a tunnel utilizing an EAHE and a radiant heating system to a tunnel utilizing just a radiant heating system. From there, an economic analysis can be performed to determine the cost savings of using this system on different common fuel types.
If the system is effective, it could help growers reduce winter heating costs, allowing them to save on heating bills and reduce fossil fuel expenditure. If not, it can inform others how the system can be improved for future use. Suggestions from UNH Extension Agricultural Business Management Field Specialist, Seth Wilner, were made to observe yield and quality data of crops grown. While this is an intriguing aspect to study, Hip Peas Farm is a working farm, and will need to grow different crops at different successional timings in each tunnel, so having side by side comparisons would not be viable. Research could be performed by another party if the crops could be identical so comparisons could be made.
Growers in cold climates have been searching for effective ways to utilize high tunnels during winter months. Some growers just grow without the use of heating systems, but for those wanting to grow out of season crops for a premium market, or start seedlings early in the winter, supplemental heating becomes necessary. Traditionally, propane or natural gas heaters can be used to send warm air straight into the structures. While this can be profitable, many growers believe this to be inefficient, attempting to devise new systems that could save fuel and cost. L’Abri Végétal, based in Compton, Quebec, grows tomatoes during winter by sending heated air through perforated ducts directly above the soil line, claiming it is more cost effective than sending heat into the air. Most Northeast Agricultural Universities, from Cornell, to UNH, to UVM have fact sheets, studies, and blogs about traditional and alternative high tunnel heating systems.
Hip Peas Farm has installed an EAHE that could keep ambient air inside the high tunnel at or above 50 degrees year-round utilizing nothing more than the sun and two small fans. This could minimize if not eliminate the need for fossil-fuel based heating systems, especially for cool-weather crops or during shoulder seasons. This system will be run regardless, but SARE could help fund a trial to communicate to other growers the potential benefit, or lack thereof, of these systems. The trial would monitor soil and air temperature in both of our 30’x96’ high tunnels, both utilizing a radiant heating system, and with one also utilizing an EAHE. We will monitor soil and air temperatures in one of our 30’x52’ high tunnels with no heating for comparison as to ambient air temperatures without heat. The purpose of this comparison is to see how effective an EAHE can be at reducing the amount of extra heat needed during winter months.
The impact of this trial could reduce the use of fossil fuel-based heating systems in Northeast high tunnels by completely removing the need to heat structures up to 50 degrees. According to the heating calculator from Littlegreenhouse.com the annual propane needed for growers in Hooksett, NH growing inside a 30’X96’ high tunnel is an estimated 2,930 gallons per year.
Despite the potential environmental impact, growers are more apt to adopt a new technology if there is also a proven economic incentive. Our farm pays $2.85 per gallon for propane, causing an average annual heating bill of $8,350.50 per 30’X96’ tunnel. The cost of a propane heater capable of 250,000 BTU heating can range from $1,250 to $2,500. By February of 2017, the National Resource Conservations Service (NRCS) had funded the construction of 47 high tunnels in Rockingham and Strafford counties alone. If these structures could be heated without the use of fuel, it would lead to a reduction of 137,000 gallons of propane, with a cost savings of almost $400,000 annually.
For our farm, the total cost to install an EAHE was $17,500. The materials included 200 feet of 15 inch corrugated plastic piping, roughly 4,500 feet of 4 inch perforated piping covered in fabric, and 64 pieces of 4’X8’ rigid insulation with a 1” thickness. The combined cost of these materials was about $7,500. Installation also requires additional site work to dig deep into the earth using an excavator, the cost of which was $4,000. Filling the site required large amounts of crushed stone, which cost $4,000. Finally, the project required two fans to move the air throughout the system, which cost $600 total, and the labor for installation was $2,000.
Comparing this cost to the propane heater, if the EAHE is able to maintain minimum night temperatures of 50 degrees, it will earn a cost savings of about $701 after only two years ($8,350.50 per year x 2 years = $16,701 operating cost + $1,500 heater cost = $18,201 - $17,500 = $701). Over the course of 10 years, the system would earn a cost savings of $67,505.
A complete elimination of fossil fuel usage is a lofty goal, but if the system is able to reduce heating costs by 25% annually, the system will pay for itself over the course of 9 years by saving $18,788.63 in propane costs. If the system is able to reduce heating costs by 40% annually, the system will pay for itself within 6 years. A high tunnel will last at least 10 years, and the EAHE should last just as long with regular maintenance to the fans.
Hip Peas Farm is a Certified Organic Microfarm in Hooksett, New Hampshire. Owners Dan Lagueux and Valerie Vanasse purchased the 5.5 acre property in 2017 after owning the Hooksett based restaurant “New England’s Tap House Grille” for 5 years. Since then, the farm has operated on about an acre of growing space, supplying restaurants, farm stands, and school districts. The farm sells 95% of its product within 2.5 miles of the property.
Cooperators
Research
2020 Progress:
Due to complications with the COVID-19 pandemic, the project has had delays in certain areas, though there are still very interesting findings to report. Heat has not been implemented in either tunnel yet as the boiler installation is still in work. We hope to have the boiler fully functional soon, but it may not be until next winter. Due to this delay, the only factors being monitored are air temperature and Relative Humidity (RH) in the Climate Battery Tunnel (T3), the non Climate Battery Tunnel (T4), and the Climate Battery Intake, and Exhaust ducts. Measurements are also being taken for Soil Temperatures in T3 and T4.
Data was synthesized from November 17th to December 15th of 2020. All four sensors that represent air temperature and RH in each tunnel were averaged together to create one data point. The same was done for soil temperature, and Climate Battery intake and exhaust temperature and RH. Data points were collected every minute for all measurements except for T3 Soil Temperature, which was collected every hour. This was overkill and created an overly cumbersome project for synthesizing data. Data points will be collected far less frequently moving forward to account for multiple years for of the project's life that will need to be synthesized.
Over the time surveyed, the Climate Battery tunnel showed an average daily temperature that was consistently warmer than the control tunnel by at least 0.5o F, but as high as 6.6o F. The average temperature difference over the entire time surveyed was 3.6o F warmer in the Climate Battery Tunnel (Tables 1 and 2). When the entire data set was compared, the largest differences observed at any given time was -1.7 degrees colder in the Climate battery tunnel than the control, but as high as 12.4 degrees warmer.
| T3 Daily Average Temp | T4 Daily Average Temp | |
| 17-Nov | 45.9 | 41.0 |
| 18-Nov | 39.9 | 34.2 |
| 19-Nov | 39.1 | 32.5 |
| 20-Nov | 46.6 | 42.7 |
| 21-Nov | 50.3 | 46.2 |
| 22-Nov | 40.5 | 36.9 |
| 23-Nov | 44.8 | 43.0 |
| 24-Nov | 43.5 | 38.9 |
| 25-Nov | 37.1 | 32.5 |
| 26-Nov | 41.4 | 38.3 |
| 27-Nov | 45.3 | 42.6 |
| 28-Nov | 46.2 | 44.2 |
| 29-Nov | 44.2 | 39.5 |
| 30-Nov | 40.9 | 38.3 |
| 1-Dec | 56.8 | 56.3 |
| 2-Dec | 43.8 | 42.1 |
| 3-Dec | 43.5 | 39.2 |
| 4-Dec | 44.2 | 41.1 |
| 5-Dec | 39.1 | 37.0 |
| 6-Dec | 38.6 | 35.4 |
| 7-Dec | 37.4 | 32.6 |
| 8-Dec | 36.8 | 32.5 |
| 9-Dec | 35.7 | 31.2 |
| 10-Dec | 39.4 | 35.4 |
| 11-Dec | 38.4 | 33.9 |
| 12-Dec | 38.0 | 35.1 |
| 13-Dec | 41.4 | 40.0 |
| 14-Dec | 38.3 | 35.8 |
| 15-Dec | 37.0 | 32.5 |
| Hi Avg Temp | 56.8 | 56.3 |
| Lo Avg Temp | 35.7 | 31.2 |
| Overall Avg Temp | 41.9 | 38.3 |
Table 1. Daily Air Temperatures in the Climate Battery Tunnel (T3) and the Non-Climate Battery Tunnel (T4).
| Degrees warmer T3 was than T4 (Avg daily temperature) | |
| 17-Nov | 4.9 |
| 18-Nov | 5.7 |
| 19-Nov | 6.6 |
| 20-Nov | 4.0 |
| 21-Nov | 4.1 |
| 22-Nov | 3.6 |
| 23-Nov | 1.8 |
| 24-Nov | 4.6 |
| 25-Nov | 4.6 |
| 26-Nov | 3.2 |
| 27-Nov | 2.7 |
| 28-Nov | 2.0 |
| 29-Nov | 4.7 |
| 30-Nov | 2.6 |
| 1-Dec | 0.5 |
| 2-Dec | 1.6 |
| 3-Dec | 4.2 |
| 4-Dec | 3.1 |
| 5-Dec | 2.1 |
| 6-Dec | 3.2 |
| 7-Dec | 4.8 |
| 8-Dec | 4.3 |
| 9-Dec | 4.5 |
| 10-Dec | 4.0 |
| 11-Dec | 4.4 |
| 12-Dec | 2.9 |
| 13-Dec | 1.3 |
| 14-Dec | 2.5 |
| 15-Dec | 4.5 |
| Hi Avg Temp | 6.6 |
| Lo Avg Temp | 0.5 |
| Overall Avg Temp | 3.6 |
Table 2. Degrees F warmer the average daily air temperature was in the Climate Battery Tunnel (T3) when compared to the Non-Climate Battery Tunnel (T4).
Something of particular interest to Winter growers may come when analyzing daily low temperatures in each tunnel. Between the dates of November 17th and December 15th, the Climate Battery Tunnel only had a low point temperature below freezing on 7 of the 29 days with the lowest temperature being 29o F, while the non-climate battery tunnel had a low point temperature below freezing 19 of the 25 days with the lowest temperature being 22.3o F (Table 3).
| T3 Temp Lo | T4 Temp Lo | |
| 17-Nov | 37.1 | 31.9 |
| 18-Nov | 32.5 | 26.8 |
| 19-Nov | 29.0 | 22.3 |
| 20-Nov | 37.4 | 32.4 |
| 21-Nov | 39.7 | 36.2 |
| 22-Nov | 33.5 | 28.6 |
| 23-Nov | 41.1 | 38.8 |
| 24-Nov | 35.4 | 31.4 |
| 25-Nov | 31.0 | 25.5 |
| 26-Nov | 38.5 | 34.5 |
| 27-Nov | 39.6 | 36.0 |
| 28-Nov | 40.0 | 37.9 |
| 29-Nov | 33.9 | 29.2 |
| 30-Nov | 35.1 | 30.9 |
| 1-Dec | 45.1 | 45.5 |
| 2-Dec | 36.3 | 33.3 |
| 3-Dec | 33.0 | 28.4 |
| 4-Dec | 34.9 | 31.3 |
| 5-Dec | 37.3 | 34.4 |
| 6-Dec | 35.2 | 31.1 |
| 7-Dec | 31.4 | 26.0 |
| 8-Dec | 31.6 | 27.1 |
| 9-Dec | 29.2 | 24.6 |
| 10-Dec | 32.9 | 28.3 |
| 11-Dec | 31.1 | 26.6 |
| 12-Dec | 33.5 | 29.4 |
| 13-Dec | 37.9 | 36.5 |
| 14-Dec | 33.7 | 30.0 |
| 15-Dec | 29.7 | 25.5 |
| Days with Lo Temp under 32 degrees F | 7 | 19 |
| Lowest temp | 29.0 | 22.3 |
Table 3. Daily Low Air Temperatures between the Climate Battery Tunnel (T3) and the Non-Climate Battery Tunnel (T4).
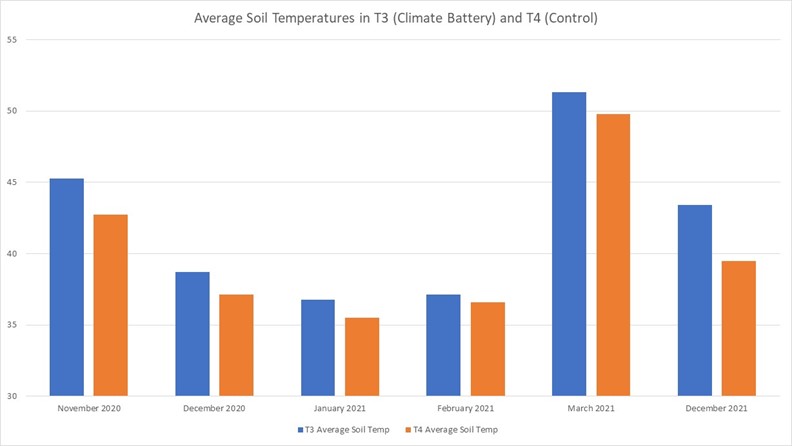
Soil temperature showed similar, though less drastic results. The soil temperature in the Climate Battery tunnel was higher than the non-Climate Battery tunnel for 27 or the 29 days. The highest average daily temperature difference was 4.2 degrees warmer in the Climate Battery Tunnel, the lowest average daily temperature difference was -1.6 degrees, and the overall average daily temperature difference was 1.8 degrees warmer in the Climate Battery Tunnel (Tables 4 and 5).
| Date | T3 Soil Temp Avg | T4 Soil Temp Avg |
| 17-Nov | 48.1 | 45.1 |
| 18-Nov | 44.4 | 41.9 |
| 19-Nov | 42.3 | 38.0 |
| 20-Nov | 46.3 | 42.1 |
| 21-Nov | 49.8 | 46.6 |
| 22-Nov | 43.7 | 43.1 |
| 23-Nov | 45.1 | 43.6 |
| 24-Nov | 45.0 | 42.8 |
| 25-Nov | 40.2 | 38.3 |
| 26-Nov | 41.7 | 39.2 |
| 27-Nov | 45.1 | 42.1 |
| 28-Nov | 46.4 | 44.8 |
| 29-Nov | 45.3 | 43.3 |
| 30-Nov | 41.9 | 41.3 |
| 1-Dec | 54.4 | 51.1 |
| 2-Dec | 45.5 | 47.1 |
| 3-Dec | 44.8 | 43.8 |
| 4-Dec | 45.2 | 43.8 |
| 5-Dec | 40.6 | 41.6 |
| 6-Dec | 39.7 | 39.1 |
| 7-Dec | 38.8 | 37.1 |
| 8-Dec | 38.2 | 36.5 |
| 9-Dec | 37.0 | 34.8 |
| 10-Dec | 40.0 | 36.9 |
| 11-Dec | 39.3 | 36.9 |
| 12-Dec | 38.9 | 37.3 |
| 13-Dec | 41.4 | 40.1 |
| 14-Dec | 39.2 | 38.8 |
| 15-Dec | 38.6 | 37.4 |
| Hi Avg Temp | 54.4 | 51.1 |
| Lo Avg Temp | 37.0 | 34.8 |
| Overall Avg Temp | 43.0 | 41.2 |
Table 4. Daily Average Soil Temperatures in the Climate Battery Tunnel (T3) and the Non-Climate Battery Tunnel (T4).
| Date | Avg Change |
| 17-Nov | 2.9 |
| 18-Nov | 2.4 |
| 19-Nov | 4.2 |
| 20-Nov | 4.2 |
| 21-Nov | 3.2 |
| 22-Nov | 0.6 |
| 23-Nov | 1.4 |
| 24-Nov | 2.2 |
| 25-Nov | 2.0 |
| 26-Nov | 2.5 |
| 27-Nov | 3.0 |
| 28-Nov | 1.7 |
| 29-Nov | 1.9 |
| 30-Nov | 0.6 |
| 1-Dec | 3.3 |
| 2-Dec | -1.6 |
| 3-Dec | 1.1 |
| 4-Dec | 1.4 |
| 5-Dec | -1.0 |
| 6-Dec | 0.7 |
| 7-Dec | 1.7 |
| 8-Dec | 1.7 |
| 9-Dec | 2.3 |
| 10-Dec | 3.1 |
| 11-Dec | 2.4 |
| 12-Dec | 1.6 |
| 13-Dec | 1.3 |
| 14-Dec | 0.4 |
| 15-Dec | 1.2 |
| Hi Avg Temp | 4.2 |
| Lo Avg Temp | -1.6 |
| Overall Avg Temp | 1.8 |
Table 5. Degrees F warmer the average daily soil temperature was in the Climate Battery Tunnel (T3) when compared to the Non-Climate Battery Tunnel (T4).
Perhaps the most surprising outcome to come from this preliminary data was that the average daily RH in the Climate Battery Tunnel was consistently lower than the non-Climate Battery tunnel. Only one day of the 29 measured measured the Non-Climate Battery Tunnel lower in RH, by 0.1%, though the Climate Battery Tunnel had an average daily RH of 1.2% lower overall, with the highest difference being 3.5% lower (Tables 6 and 7). This is especially surprising because when the Climate Battery starts introducing warm air into the cold tunnel, moisture condenses consistently, creating a fog-like atmosphere, especially in the early mornings. This does not seem to create a large raise in RH in the Climate Battery Tunnel because this typically occurs when RH is around 99-100% in the control tunnel as well. It has yet to be determined if this small drop in RH would have any impact on disease pressures without adding additional controls such as venting, though it appears that the Climate Battery will not pose an additional disease pressure in the form of increased RH.
| T3 Daily Average RH% | T4 Daily Average RH% | |
| 17-Nov | 95.3 | 96.6 |
| 18-Nov | 92.5 | 94.7 |
| 19-Nov | 92.0 | 95.4 |
| 20-Nov | 95.4 | 97.1 |
| 21-Nov | 92.7 | 95.3 |
| 22-Nov | 97.1 | 97.9 |
| 23-Nov | 99.0 | 99.1 |
| 24-Nov | 92.0 | 93.8 |
| 25-Nov | 96.3 | 97.9 |
| 26-Nov | 99.1 | 99.4 |
| 27-Nov | 98.5 | 99.2 |
| 28-Nov | 97.7 | 98.3 |
| 29-Nov | 94.6 | 97.0 |
| 30-Nov | 99.0 | 99.4 |
| 1-Dec | 95.0 | 95.8 |
| 2-Dec | 96.6 | 97.3 |
| 3-Dec | 94.1 | 96.2 |
| 4-Dec | 95.1 | 97.2 |
| 5-Dec | 99.2 | 99.3 |
| 6-Dec | 98.5 | 98.4 |
| 7-Dec | 96.5 | 97.7 |
| 8-Dec | 97.5 | 98.2 |
| 9-Dec | 96.6 | 98.0 |
| 10-Dec | 97.2 | 98.2 |
| 11-Dec | 96.1 | 97.9 |
| 12-Dec | 98.5 | 99.0 |
| 13-Dec | 98.4 | 99.0 |
| 14-Dec | 99.0 | 99.0 |
| 15-Dec | 93.9 | 96.1 |
| Hi Avg RH% | 99.2 | 99.4 |
| Lo Avg RH% | 92.0 | 93.8 |
| Overall Avg RH% | 96.3 | 97.5 |
Table 6. Daily Average Air RH% in the Climate Battery Tunnel (T3) and the Non-Climate Battery Tunnel (T4).
| % Change in RH in T4 as Compared to T3 | |
| 17-Nov | 1.34 |
| 18-Nov | 2.17 |
| 19-Nov | 3.47 |
| 20-Nov | 1.73 |
| 21-Nov | 2.59 |
| 22-Nov | 0.83 |
| 23-Nov | 0.14 |
| 24-Nov | 1.84 |
| 25-Nov | 1.59 |
| 26-Nov | 0.32 |
| 27-Nov | 0.66 |
| 28-Nov | 0.60 |
| 29-Nov | 2.35 |
| 30-Nov | 0.41 |
| 1-Dec | 0.80 |
| 2-Dec | 0.69 |
| 3-Dec | 2.13 |
| 4-Dec | 2.13 |
| 5-Dec | 0.12 |
| 6-Dec | -0.14 |
| 7-Dec | 1.22 |
| 8-Dec | 0.66 |
| 9-Dec | 1.44 |
| 10-Dec | 1.02 |
| 11-Dec | 1.78 |
| 12-Dec | 0.54 |
| 13-Dec | 0.57 |
| 14-Dec | 0.07 |
| 15-Dec | 2.23 |
| Hi Avg RH% Change | 3.5 |
| Lo Avg RH% Change | -0.1 |
| Overall Avg RH% Change | 1.2 |
Table 7. RH% higher the average daily air RH was in the Non-Climate Battery Tunnel (T4) when compared to the Climate Battery Tunnel (T3).
Moving forward, the setpoint for the Climate Battery will be adjusted for the remainder of the Winter. Up until now, fans would turn on to store heat in the Climate Battery when a thermostat hung from the center of the tunnel reached 80o F or warmer, and shut off when lower than 80o F. Additionally, the fans would turn on to draw heat from the Climate Battery if the temperature dropped below 40o F, and turn off when temperatures raised above that threshold. Moving forward, the setpoint for the Climate Battery to store heat will be adjusted for the remainder of the Winter from 80o F down to 65o F. This is due to air temperatures in the tunnel rarely getting above 80o F, and average daily exhaust temperatures from the Climate Battery steadily dropping from 51.4o F on November 17th, to 41.6o F on December 15th (Table 8). It is assumed that by banking heat of 65o F or warmer, it will increase the Climate Battery's warming potential during Winter months, without too much of a deleterious effect on the overall max temperature during the day. The reason for this is that the tunnel does not have to warm back up from such cold temperatures, and can reach its maximum temperature much higher than the non-Climate Battery tunnel. The low-temperature threshold will not be adjusted at this time.
| Climate Battery Exhaust Daily Average Temp | T3 Daily Average Temp | T4 Daily Average Temp | |
| 17-Nov | 51.4 | 45.9 | 41.0 |
| 18-Nov | 48.4 | 39.9 | 34.2 |
| 19-Nov | 47.6 | 39.1 | 32.5 |
| 20-Nov | 48.7 | 46.6 | 42.7 |
| 21-Nov | 51.8 | 50.3 | 46.2 |
| 22-Nov | 45.6 | 40.5 | 36.9 |
| 23-Nov | 45.9 | 44.8 | 43.0 |
| 24-Nov | 48.6 | 43.5 | 38.9 |
| 25-Nov | 44.0 | 37.1 | 32.5 |
| 26-Nov | 44.0 | 41.4 | 38.3 |
| 27-Nov | 46.1 | 45.3 | 42.6 |
| 28-Nov | 47.1 | 46.2 | 44.2 |
| 29-Nov | 47.9 | 44.2 | 39.5 |
| 30-Nov | 43.9 | 40.9 | 38.3 |
| 1-Dec | 53.2 | 56.8 | 56.3 |
| 2-Dec | 46.1 | 43.8 | 42.1 |
| 3-Dec | 47.4 | 43.5 | 39.2 |
| 4-Dec | 46.7 | 44.2 | 41.1 |
| 5-Dec | 43.6 | 39.1 | 37.0 |
| 6-Dec | 42.9 | 38.6 | 35.4 |
| 7-Dec | 42.7 | 37.4 | 32.6 |
| 8-Dec | 41.3 | 36.8 | 32.5 |
| 9-Dec | 40.4 | 35.7 | 31.2 |
| 10-Dec | 42.0 | 39.4 | 35.4 |
| 11-Dec | 41.7 | 38.4 | 33.9 |
| 12-Dec | 40.2 | 38.0 | 35.1 |
| 13-Dec | 40.9 | 41.4 | 40.0 |
| 14-Dec | 40.7 | 38.3 | 35.8 |
| 15-Dec | 41.6 | 37.0 | 32.5 |
| Hi Avg Temp | 53.2 | 56.8 | 56.3 |
| Lo Avg Temp | 40.2 | 35.7 | 31.2 |
| Overall Avg Temp | 45.3 | 41.9 | 38.3 |
Table 8. Daily Average Temperature in the Climate Battery Exhaust, Tunnel 3, and Tunnel 4.
Planned Materials and Methods
Treatments:
Two 30’X96’ Rimol Nor’Easter high tunnels will be used as treatments with one 30’X52’ Rimol Nor’Easter high tunnel utilized as a comparison. The treatments will be known by their on farm designation until the final report to avoid confusion. One of the 30’X96’ tunnels, Tunnel 4 (T4), will utilize only a radiant heating system, with hot water PEX piping installed in a serpentine pattern. Pipes are placed roughly 8” apart spanning the width and length of the tunnel at a 2 foot depth. Three separate zones will supply the tunnel with hot water fired from a spent cooking oil furnace in a separate building.
Tunnel 3 (T3) is the other 30’X96’ tunnel and will utilize an Earth Air Heat Exchanger (EAHE) in addition to the radiant heating system. The radiant heating system will be powered by the same furnace as T4. The EAHE was constructed by lining the perimeter of the high tunnel with 4’X8’X1” rigid insulation, starting from the top of the soil line to a four foot depth. The entire tunnel was excavated to about 4 and a half foot depth, and a base of crushed stone was laid roughly 3-6” thick. Running along the inside of each end wall, a 15” diameter rigid corrugated pipe was used as a manifold to connect all flexible lines. The manifold pipe was laid about 3’ from the end wall, running the width of the high tunnel. A 15” diameter pipe attaches to the manifold running vertically on each end. On one end is the intake, and on the other end is the exhaust. Attached to the manifolds on either end are 4” perforated, flexible pipes covered in a fabric “sock”, designed to send air throughout the crushed stone. There are 22 rows of 4” pipes, separated by about 16” each. The bottom layer is then covered with about a foot of crushed stone, and a layer of landscape fabric is laid over top. A second layer of the EAHE is then laid, identical to the first, but at about a 3.5’ depth. On top of the second layer of landscape fabric is where the radiant heating system is installed, followed by topsoil.
On either end of the tunnel, intake manifolds will run up to the top ridge of the tunnel to pull warm air from the highest point in the tunnel. Mounto 16” fans (SN – 190706060) will be placed in-line on each intake manifold to move air throughout the EAHE. Fans will be controlled by air temperature sensors at the peak, and 1 foot above the soil line. When peak temperatures exceed 75 degrees F, fans will turn on. When soil temperatures at the growing zone drop below 40 degrees F, the fans will turn on, unless EAHE temperatures drop below soil line temperatures, and will turn off when soil line temperatures reach 50 degrees.
Tunnel 2 (T2) is a 30’X52’ tunnel, identical in its design except for the length, and will have neither a radiant heating system, nor an EAHE. While not identical in size, the tunnel has a similar orientation, and can be used as a rough comparison. Finally, an outdoor (O) treatment will be prepared to measure ambient outdoor air temperature and relative humidity, as well as soil temperature.
Data collection:
Each treatment will collect data for soil temperature, air temperature and relative humidity. All high tunnels will utilize Agribon AG-19 fabric, covering beds about 6” off the ground in the winter to create an additional microclimate, exhaust fans to reduce maximum temperatures in the shoulder season, and roll up sides in the summer. Roll up sides will only be put up or down at the same time, and temperatures for the exhaust fans will all be set to identical temperatures. When fabrics are installed or removed, all will be installed or removed at the same time to reduce variability. Two pieces of fabric will be installed per tunnel, one covering 4 beds on the left side of the tunnel, and one covering 4 beds on the right side of each tunnel. Because of this, 2 sensors for air and soil temperature, and air RH will be placed on the right and left sides of the tunnel, one on each end, totaling 4 of each sensor per tunnel. During the winter, T3 will send the exhaust from the EAHE underneath the Agribon covering by way of a flexible heating duct. T3 will also measure air temperature and RH at the intake and exhaust of each EAHE duct. All data will be sent to a HOBO RX3000 Remote Monitoring Station Data Logger for automatic collection, and data will be sent to a cloud storage system to be analyzed at the end of the trial.
For T3 and T4, each of the 3 hot water PEX zones per tunnel will be equipped with an inline water meter to measure the amount of water being sent through the system. Each zone will also have temperature sensors taped to the outside of the incoming and outgoing PEX pipe. At the end of the trial, the average outgoing water temperature will be compared to the average incoming water temperature to determine the BTU requirements, and ultimately cost, of heating the amount of water used per tunnel. Soil and air temperature will be collected from T2 and outdoors for comparison.
Data will be sent from the Data Logger to the cloud storage system from June 2020 through June 2022. At the end of the trial, all data will be interpreted to average temperatures and relative humidity levels for different hours of each month. Average cost of heating for T4 and T3 will be compared to determine the efficacy of an EAHE in reducing tunnel heating costs.
Technical Advisors:
UNH Extension Field Specialist Jeremy Delisle and UNH Extension Field and Greenhouse Specialist Jonathan Ebba will act as technical advisors for this project. UNH Extension Sustainable Horticulture State Specialist Becky Sideman has assisted in experimental design for this trial.
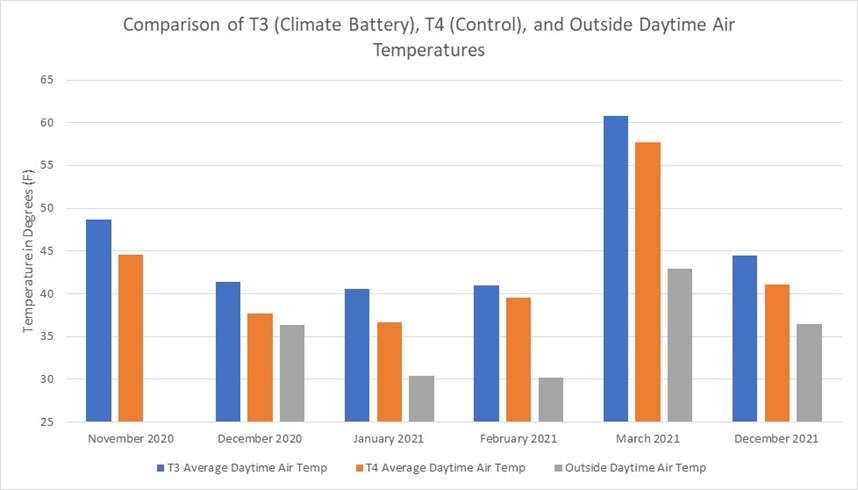
2021 Progress: The recycled cooking-oil boiler proposed in the original grant has proven to be more challenging to get running than initially thought. The install process is underway, but it appears that it may not be finished until the data collection portion of the project is completed. Upon speaking with Jonathan Ebba, Greenhouse Field Specialist at the University of New Hampshire's Cooperative Extension program, we determined the best course of action moving forward would be to analyze these data using Tunnel 4 as our new control and observing the temperature differences between Tunnels 3 (Climate Battery Treatment), Tunnel 4 (control), and outside temperature. From there, an equation will be developed to determine cost savings gained by heating a tunnel to the temperature gain we receive with the climate battery. For this report, all temperature reporting will be in degrees Fahrenheit.
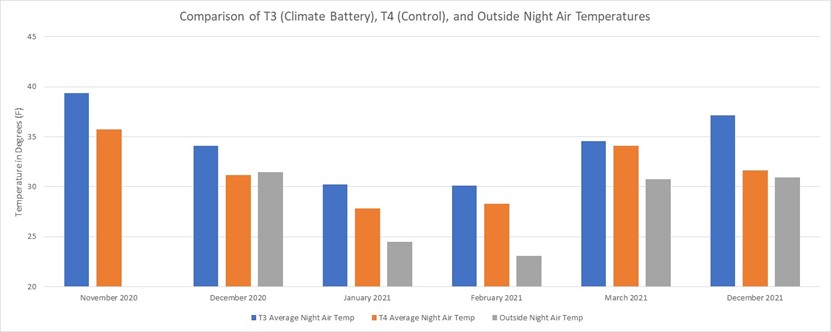
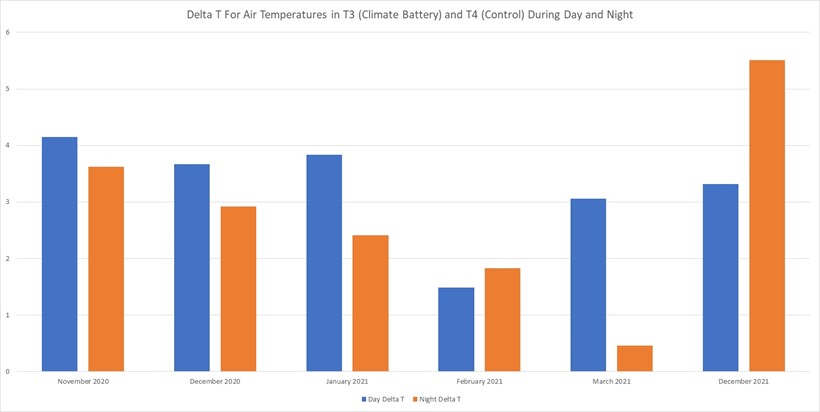
Since implementation of the project, we have collected data starting in November of 2020, and collecting up until March of 2021, then resumed data collection again in December of 2021. As of this reporting, we have data up until December 15th of 2021. During the roughly 6 months of data reporting, The Climate Battery tunnel saw air temperatures that were 3.3 degrees warmer on average during the daytime (8:00 AM - 7:59 PM), and 2.8 degrees warmer on average for an overall average of 3.0 degrees warmer using the Climate Battery.
The project was terminated before research conclusions were made.
Education & Outreach Activities and Participation Summary
Participation Summary:
No outreach or education was conducted.
Learning Outcomes
NA
Project Outcomes
NA
NA