Final report for FNE21-997
Project Information
This projects objective was to determine an ideal sap analysis profile for lowbush blueberries and to investigate the effectiveness of using foliar sprays to maximize yield, fruit quality, and disease resistance. Plant sap analysis was performed on the “best” and “worst” plants in the fields. Differences in nutrient data were analyzed and used to design treatment plots that were sprayed weekly over the 2021 and 2022 growing seasons with a foliar blend of macro and micro nutrients. Sap analysis was performed every other week and disease resistance, blossom density, berry quality, and yield were measured across treatment and control plots. For identified key nutrients, levels in the sap of high yielding plants as well as plants with high fruit quality were found to be between 40% and 158% higher than the nutrient levels in the sap of low-yielding plants and plants with low-quality fruit.
Berries sprayed with a base fertilizer blend with additional levels of Zinc resulted in higher brix readings with statistically significant p-values (p=0.0001). Macronutrients in the sprays were not well absorbed by the blueberry leaves, but micronutrient sprays in chelated form were well absorbed by the plants.
This project was successful in taking first steps towards creating an ideal sap analysis profile for lowbush blueberries; however research is needed across a wide range of fields and geographic locations in order to substantiate and refine this profile.
A slideshow presentation, posted on YouTube is available to growers to learn more about using plant sap analysis and foliar sprays in lowbush blueberry production.
The objectives are:
- To use sap analysis to identify key macro and micro nutrient variations in low bush blueberry plants that display both very high and very low production, disease resistance and fruit quality.
- To determine the extent to which production, disease resistance, and fruit quality in lowbush blueberries can be increased by foliar applying key macro and micro nutrients to different, larger field plots (containing genetically diverse plants displaying a mix of high, low and average production, disease resistance and fruit quality).
- To take the first steps in creating an ideal sap analysis profile for lowbush blueberries. My hope, given the limits and scope of this project would be to provide a useful working profile that could inspire and be refined by further research.
If this project is successful, growers will have increased information and, if desired, be able to compare sap analysis results from their fields with an ideal profile that is correlated with high levels of plant nutrition in order to obtain improved fruit quality, increased yield and heightened plant immunity. The industry and consumers can benefit from a more profitable, ecological approach.
The cultivation of lowbush blueberries is highly specialized. It differs from most agricultural systems in that it involves the management of an existing ecosystem, a lowbush blueberry barren. Like oak trees in a forest, there is remarkable genetic diversity on a given farm. Unlike most crops, high performing varieties are not selectively bred and planted. Lowbush blueberries grow naturally in interwoven patches with dense mat-like root systems ranging from 2-20 ft in diameter. Each patch is really one genetically unique plant, called a clone. Clones vary greatly in productivity, insect and disease resistance, and fruit quality; some fail to ripen all their fruit, some have more flavor, others are more susceptible to diseases, etc. Because of the interwoven mat-like nature of the patches, replacing poor varieties with higher performing ones is impractical; lowbush blueberry farmers, mostly, are stuck with the genetics evolved on their particular farms.
Thus, supplying nutrients with more precision provides a promising path towards minimizing this limitation by optimizing the genetic potential of each plant. The vast array of cellular processes that are catalyzed by enzymes require significant quantities of minerals, especially micronutrients. As a plant’s nutrient status improves, photosynthesis increases, plants produce more sugars and proteins, and complex phytochemicals, such as antioxidants, increase. Highly mineralized plants have heightened levels of resistance to pests and diseases. For example, many insects thrive on simple sugars and free amino acids, whereas the complex sugars and proteins that are so highly nutritious for humans are difficult for them to digest. Supplying sufficient quantities of minerals also affects fruit quality: optimizing calcium levels produces a firmer fruit that stores longer, adequate copper insures against splitting, and providing manganese, a mineral needed for hydrolysis, can increase photosynthetic rate resulting in not only increased yield, but also flavor and even ripening. Agriculturalist John Kempf writes, “Nutritional integrity has at least as big, if not a bigger impact on harvest timing and quality than genetics.”
Contrary to the image conjured by branding lowbush blueberries as “wild”, the nearly 200,000 acres of lowbush blueberries under cultivation in the US and Canada are managed primarily with chemical inputs. Little research has been conducted on the crop to determine optimal levels of nutrients, especially micronutrients. Conventional wisdom about aspects of lowbush blueberry nutrition can lead to a vicious cycle of decreased plant health and the subsequent necessity of pesticides and fungicides. For example, sulfur, in conjunction with herbicide, is often promoted as a means to reduce weed pressure by lowering the pH to 4.0, a level many weed species cannot tolerate. But a 4.0 pH inhibits calcium absorption, and the combination of high sulfur and inadequate calcium results in a softer fruit skin that is more easily penetrated by the ovipositors of lowbush blueberry pests such as spotted-winged drosophila and blueberry maggot fly. Chemicals used to combat pest infestations further weaken the plant and the cycle continues.
Plant Sap Analysis (PSA) is a promising new tool for measuring plant nutrient status in that it seems to more accurately reflect nutrient uptake and availability than previously available methods. Performing plant sap analysis throughout the growing season, and comparing results to an ideal profile for that crop allows growers to create a finely tuned fertility program that addresses deficiencies and excesses in order to optimize productivity, fruit quality and immunity. Currently, this technology has not yet been adopted by lowbush growers and too few samples taken, so an ideal profile for lowbush blueberries is not yet determined; lowbush blueberry results are currently compared to profiles for highbush blueberries. Although there are many similarities between these two Vaccinium species, the nutrient content of the fruit and sap differs significantly.
This project would be a strong first step towards ascertaining this crop’s “ideal” and “tolerable” ranges of key nutrients using plant sap analysis with the long-term aim of creating of a benchmark that growers throughout the US and Canada can work from to increase yield and address components of fruit quality that affect profitability, such as uniform ripening, fruit size, skin firmness (related to storage life and insect resistance), and flavor. Establishing a profile that correlates with heightened plant immunity also has the potential to significantly reduce the use of pesticides and fungicides in lowbush blueberry farming.
The Benson Place is a 50-acre certified organic lowbush blueberry farm in Heath, MA. We have been in business since 2011 and farm full-time. Blueberries are sold primarily in 20 lb. boxes directly to local customers. As well as offering U-pick, some of our berries also get sold wholesale to local markets, both fresh and frozen. Juice-quality berries are processed into a syrup.
Cooperators
- - Technical Advisor
Research
- Performed plant sap analysis (PSA) to identify nutrient variations in patches with very high and very low productivity, disease resistance and fruit quality.
- Disease resistance: Mummy berry is the prominent disease on our farm, and the one we studied. While scouting the whole farm in the mid-bloom, 10 clones each, with very high and very low rates of infection were identified. Two leaf samples from each group were taken, with leaves pooled between the 10 clones.* Patches with increased susceptibility due to low or wet ground were not sampled. An infection rate value (1-5) was recorded for each clone. 1= very low, 5= very high
- Productivity:
- Number of blossoms as a gauge of productivity controls for pollination variability. After field scouting the entire farm in the early-mid bloom, 10 clones each, with high and low numbers of blossoms were selected and sampled, pooling leaves from clones. The number of blossoms on each stem were counted and recorded on 10 stems for each clone.
- Prior to harvest, 10 clones with the highest density of berries and 10 clones with the lowest density of berries were selected by eye. 2 samples from each were collected. Total weight of all berries in a 3X 3 area within the clone was recorded.
- Fruit quality: Factors measured were Brix, fruit firmness, consistency of ripeness, and fruit size. After scouting in the middle of the harvest season, 20 clones each of high and low fruit quality were selected. The fruit quality of those clones was assessed using the fruit quality evaluation point system described at the end of the Materials and Methods section**. From this assessment, 2 samples from the 10 clones with the highest fruit quality and 2 samples from the clones with the lowest fruit quality were taken.
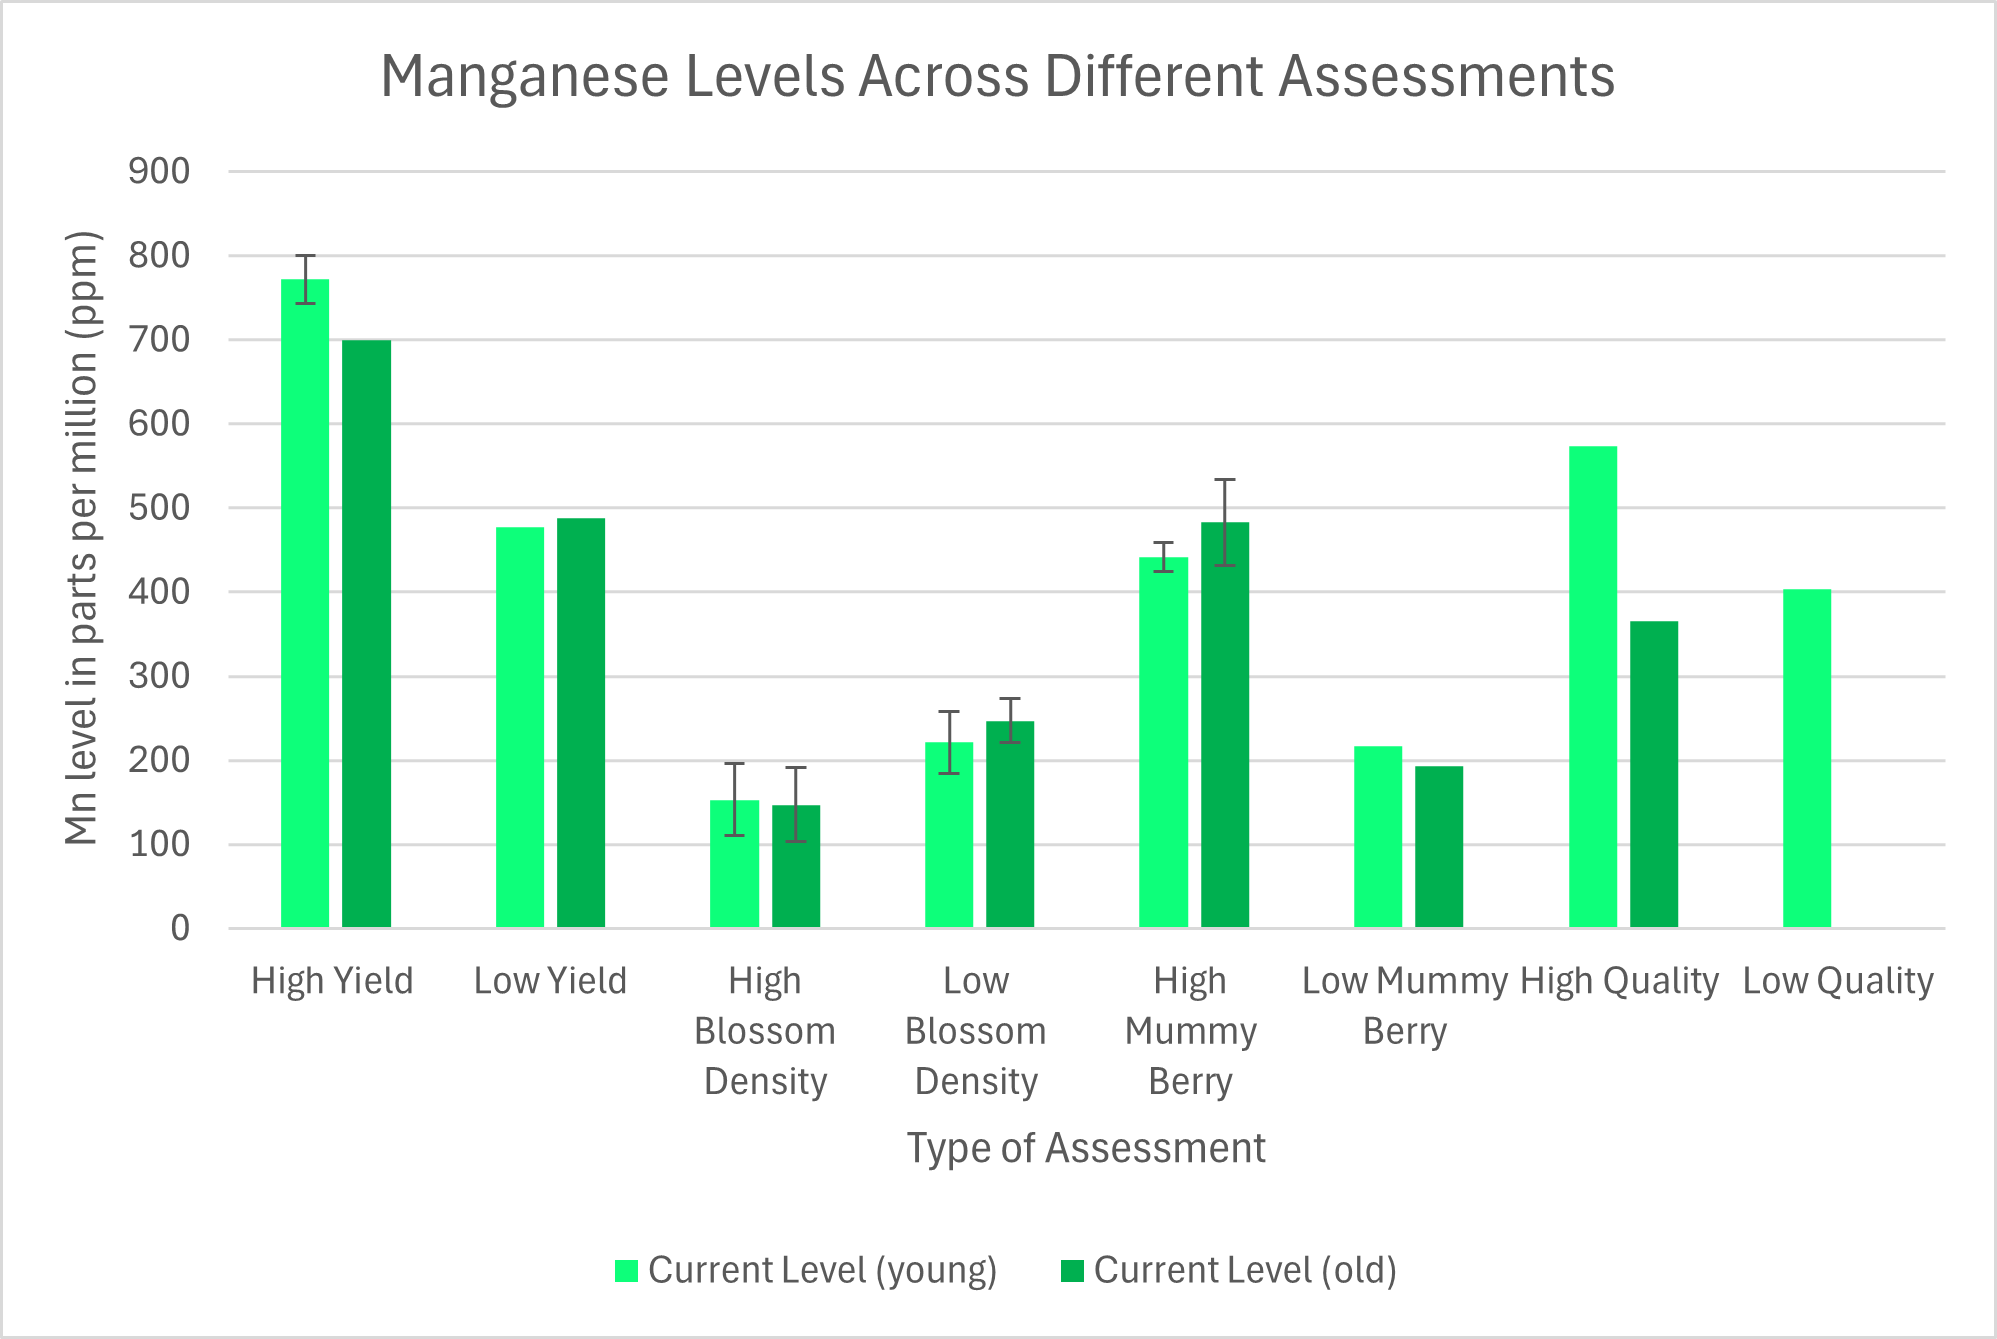
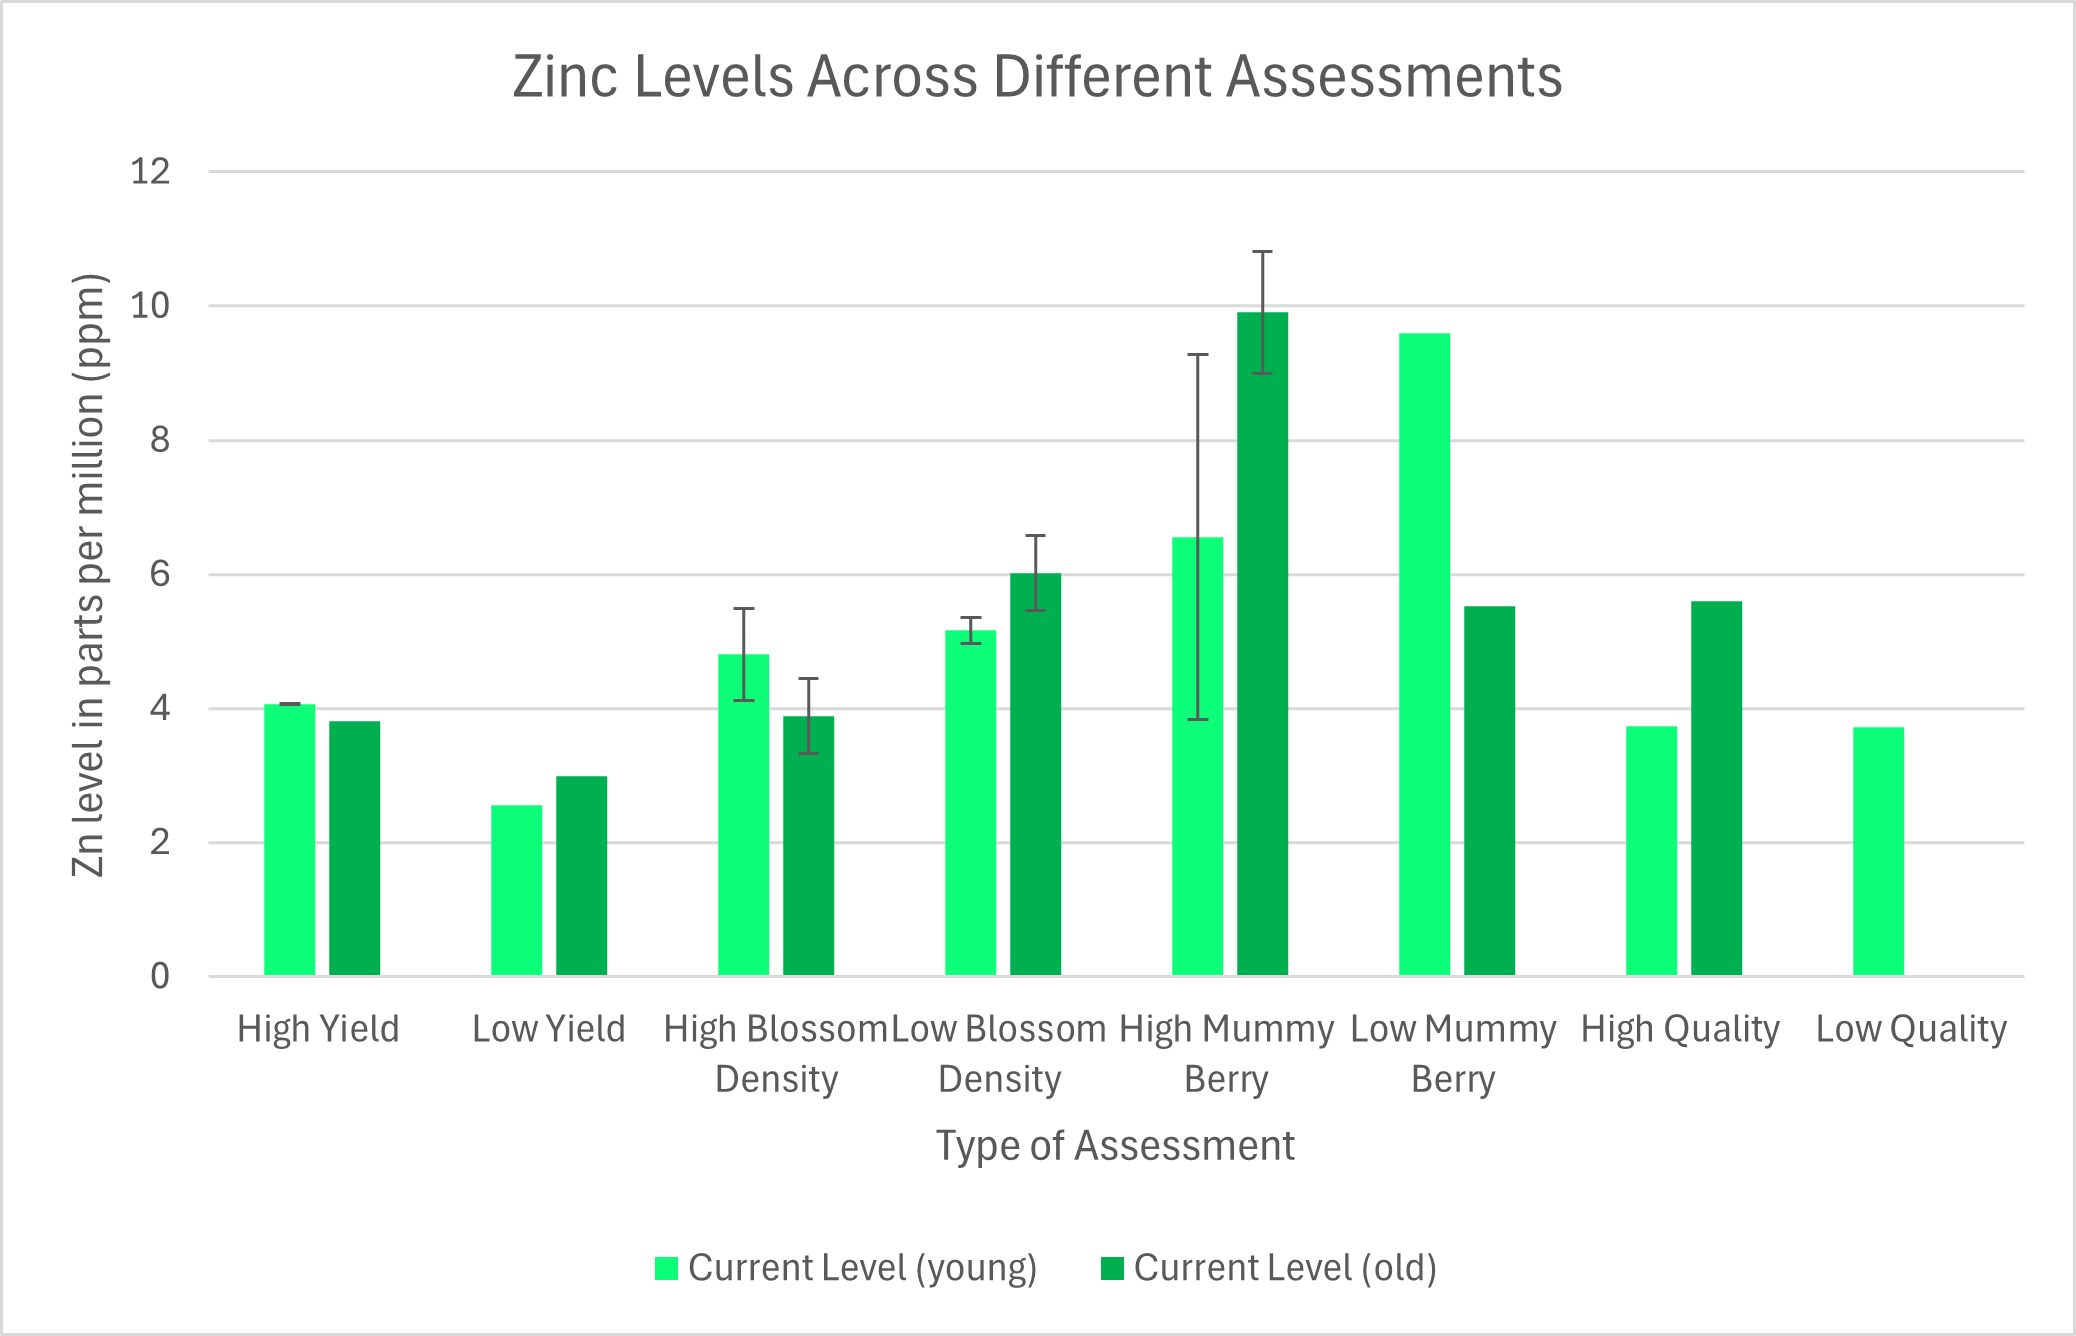
- Bloom and early harvest sap results were reviewed and discussed with my technical advisor and key nutrient differences were identified. Based on this data, the two nutrients with the most variability between high and low performing plants (Manganese and Zinc) were selected for further study.
- Applying micro and macro nutrients to test plots:
- 16 plots were staked out in four fields with relatively uniform sun exposure and slope as well as very low weed pressure. The plots within each field were separated by a 15 foot buffer to avoid spray drift. There were 4 treatment plots of 1/4 acre each. The four plots were replicated in 4 different fields for a total of 16 treatment plots.
Treatment 1: Control- no treatment
Treatment 2: Base Foliar Mix (BFM)
Treatment 3: BFM+ higher levels of Manganese
Treatment 4: BFM+ higher levels of Zinc
The Base Foliar Mix was designed to replicate the average sap analysis profile of the plants with high yield and fruit quality and was composed of a blend of macro and micro nutrients as well as the products SeaStim and SeaCrop from Advancing Eco Ag. This mix was slightly adjusted throughout the study in response to the ongoing sap tests, but the same mix was used on each of the three treatments each week. The BFM also included Manganese and Zinc.
- Initial PSA was performed prior to foliar applications, to test any pre-existing differences between plots.
- Weekly foliar sprays were applied using a backpack sprayer using rates recommended by the technical advisor specific to each treatment plot.
- Sap analysis was performed biweekly on each treatment. After the results of each sap analysis, a consultation with the technical advisor resulted in adjustments to the materials applied per trial.
- 16 plots were staked out in four fields with relatively uniform sun exposure and slope as well as very low weed pressure. The plots within each field were separated by a 15 foot buffer to avoid spray drift. There were 4 treatment plots of 1/4 acre each. The four plots were replicated in 4 different fields for a total of 16 treatment plots.
- Measuring productivity, fruit quality and disease resistance:
- Disease resistance was measured by estimating the percentage of blossoms infected with mummy berry during the mid-late bloom. A rating 1-5 was given to each plot with 1 being the least infected and 5 the most infected.
- Fruit quality (brix, evenness of ripeness, fruit size and berry firmness) was evaluated using the fruit quality evaluation system**. Sample locations in each plot were selected at random for each quality being measured and measurements recorded for 16 stems in each plot.
- Productivity was measured in two ways:
- Production potential was measured in order to control for variations in pollination. Total blossoms were counted and recorded on 16 stems in each plot.
- Yield was determined by harvesting and weighing the berries from each plot before the sorting process.
- Data was analyzed with the help of Nathan Harman to perform an ANOVA analysis.
- The beginnings of an optimal lowbush blueberry sap nutrient profile using the collected data was created with the help of Nathan Harman and Advancing Eco Ag. This profile is now available to growers, labs and university extensions- for use and further refinement.
*Because lowbush blueberry leaves are so small, many leaves of both old and new are required for each sap analysis sample. A sample taken from a given clone might require most of its leaves; therefore, a sizable area is needed to collect leaves without significantly damaging the plants. Although sap analysis of each separate clone would provide a larger data set, pooling the leaves from a few clones with similar characteristics prevented damage and still provided insights into nutrient variations between clones.
**The Fruit Evaluation System measured brix, fruit size, even ripening, and fruit firmness and assigned values to each sample using a point system:
- Brix measured using a digital refractometer. Berries on sample stems were crushed using a hand held press and the brix recorded. Points for each sample were calculated by multiplying the brix reading x 5.
- Fruit size measured by selecting 100 ripe berries in each sample location and recording their weight. Point score was 100*(W-1.2)/1.2 where W is the weight of the one hundred berries in ounces (1.2 is our average hundred berry weight).
- Even ripening measured by counting the total number of berries and the number of ripe berries in a sample. The point score was the percentage of ripe berries.
- Fruit firmness measured using a penetrometer for soft fruit with a range of 0.4- 11 lbs. The point score was the pounds multiplied by 10.
Phase 1:
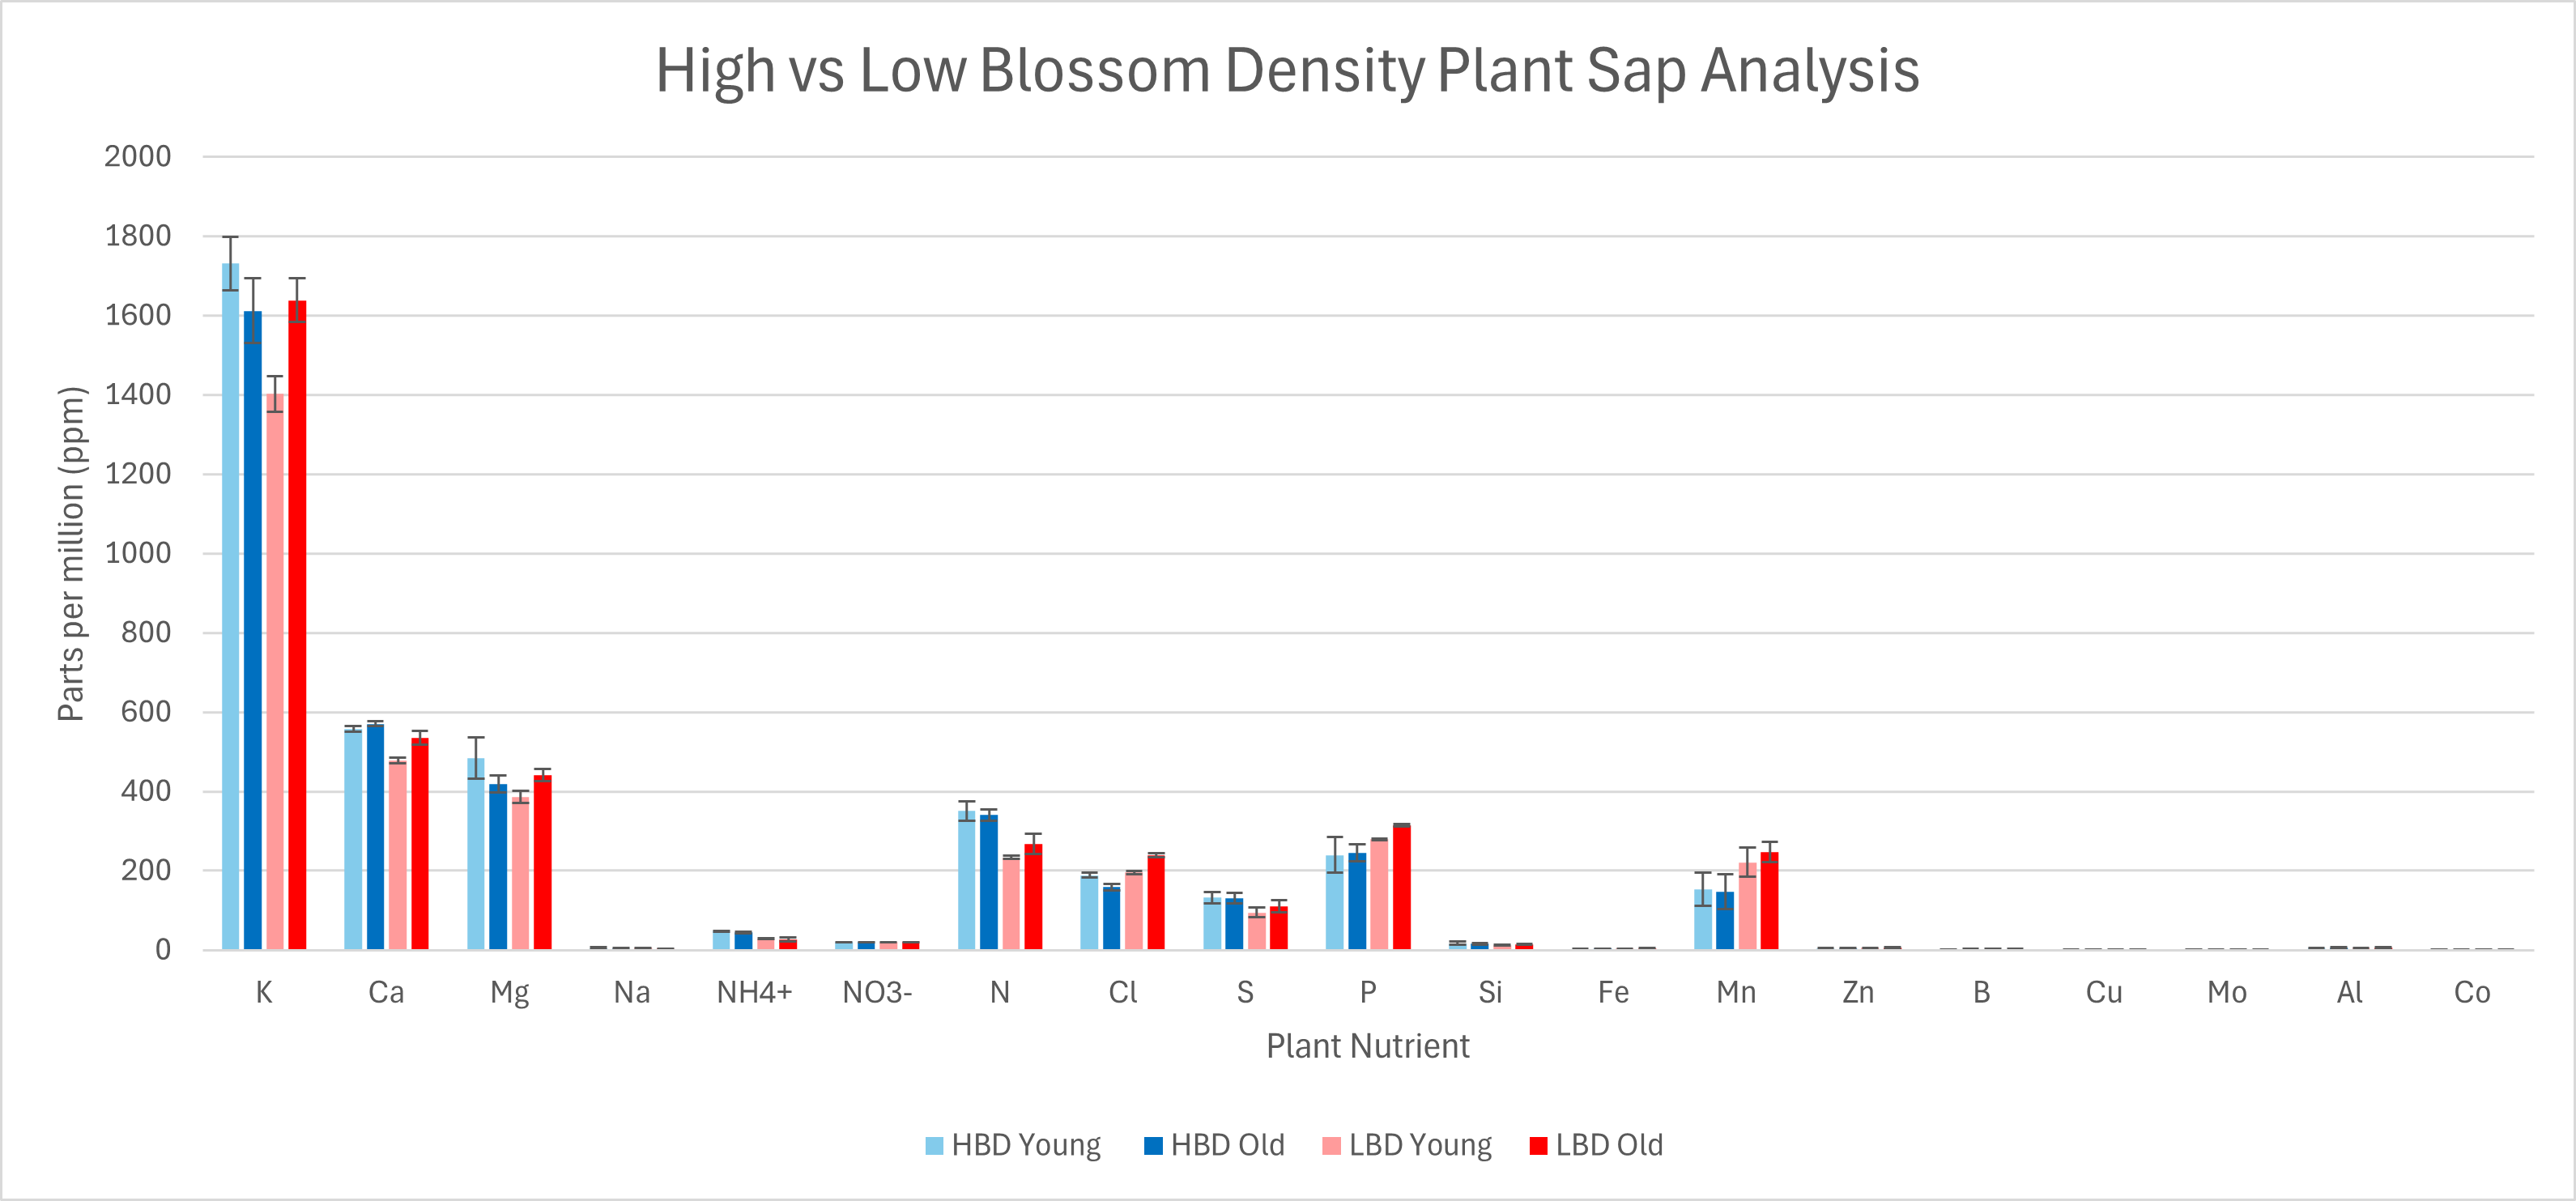
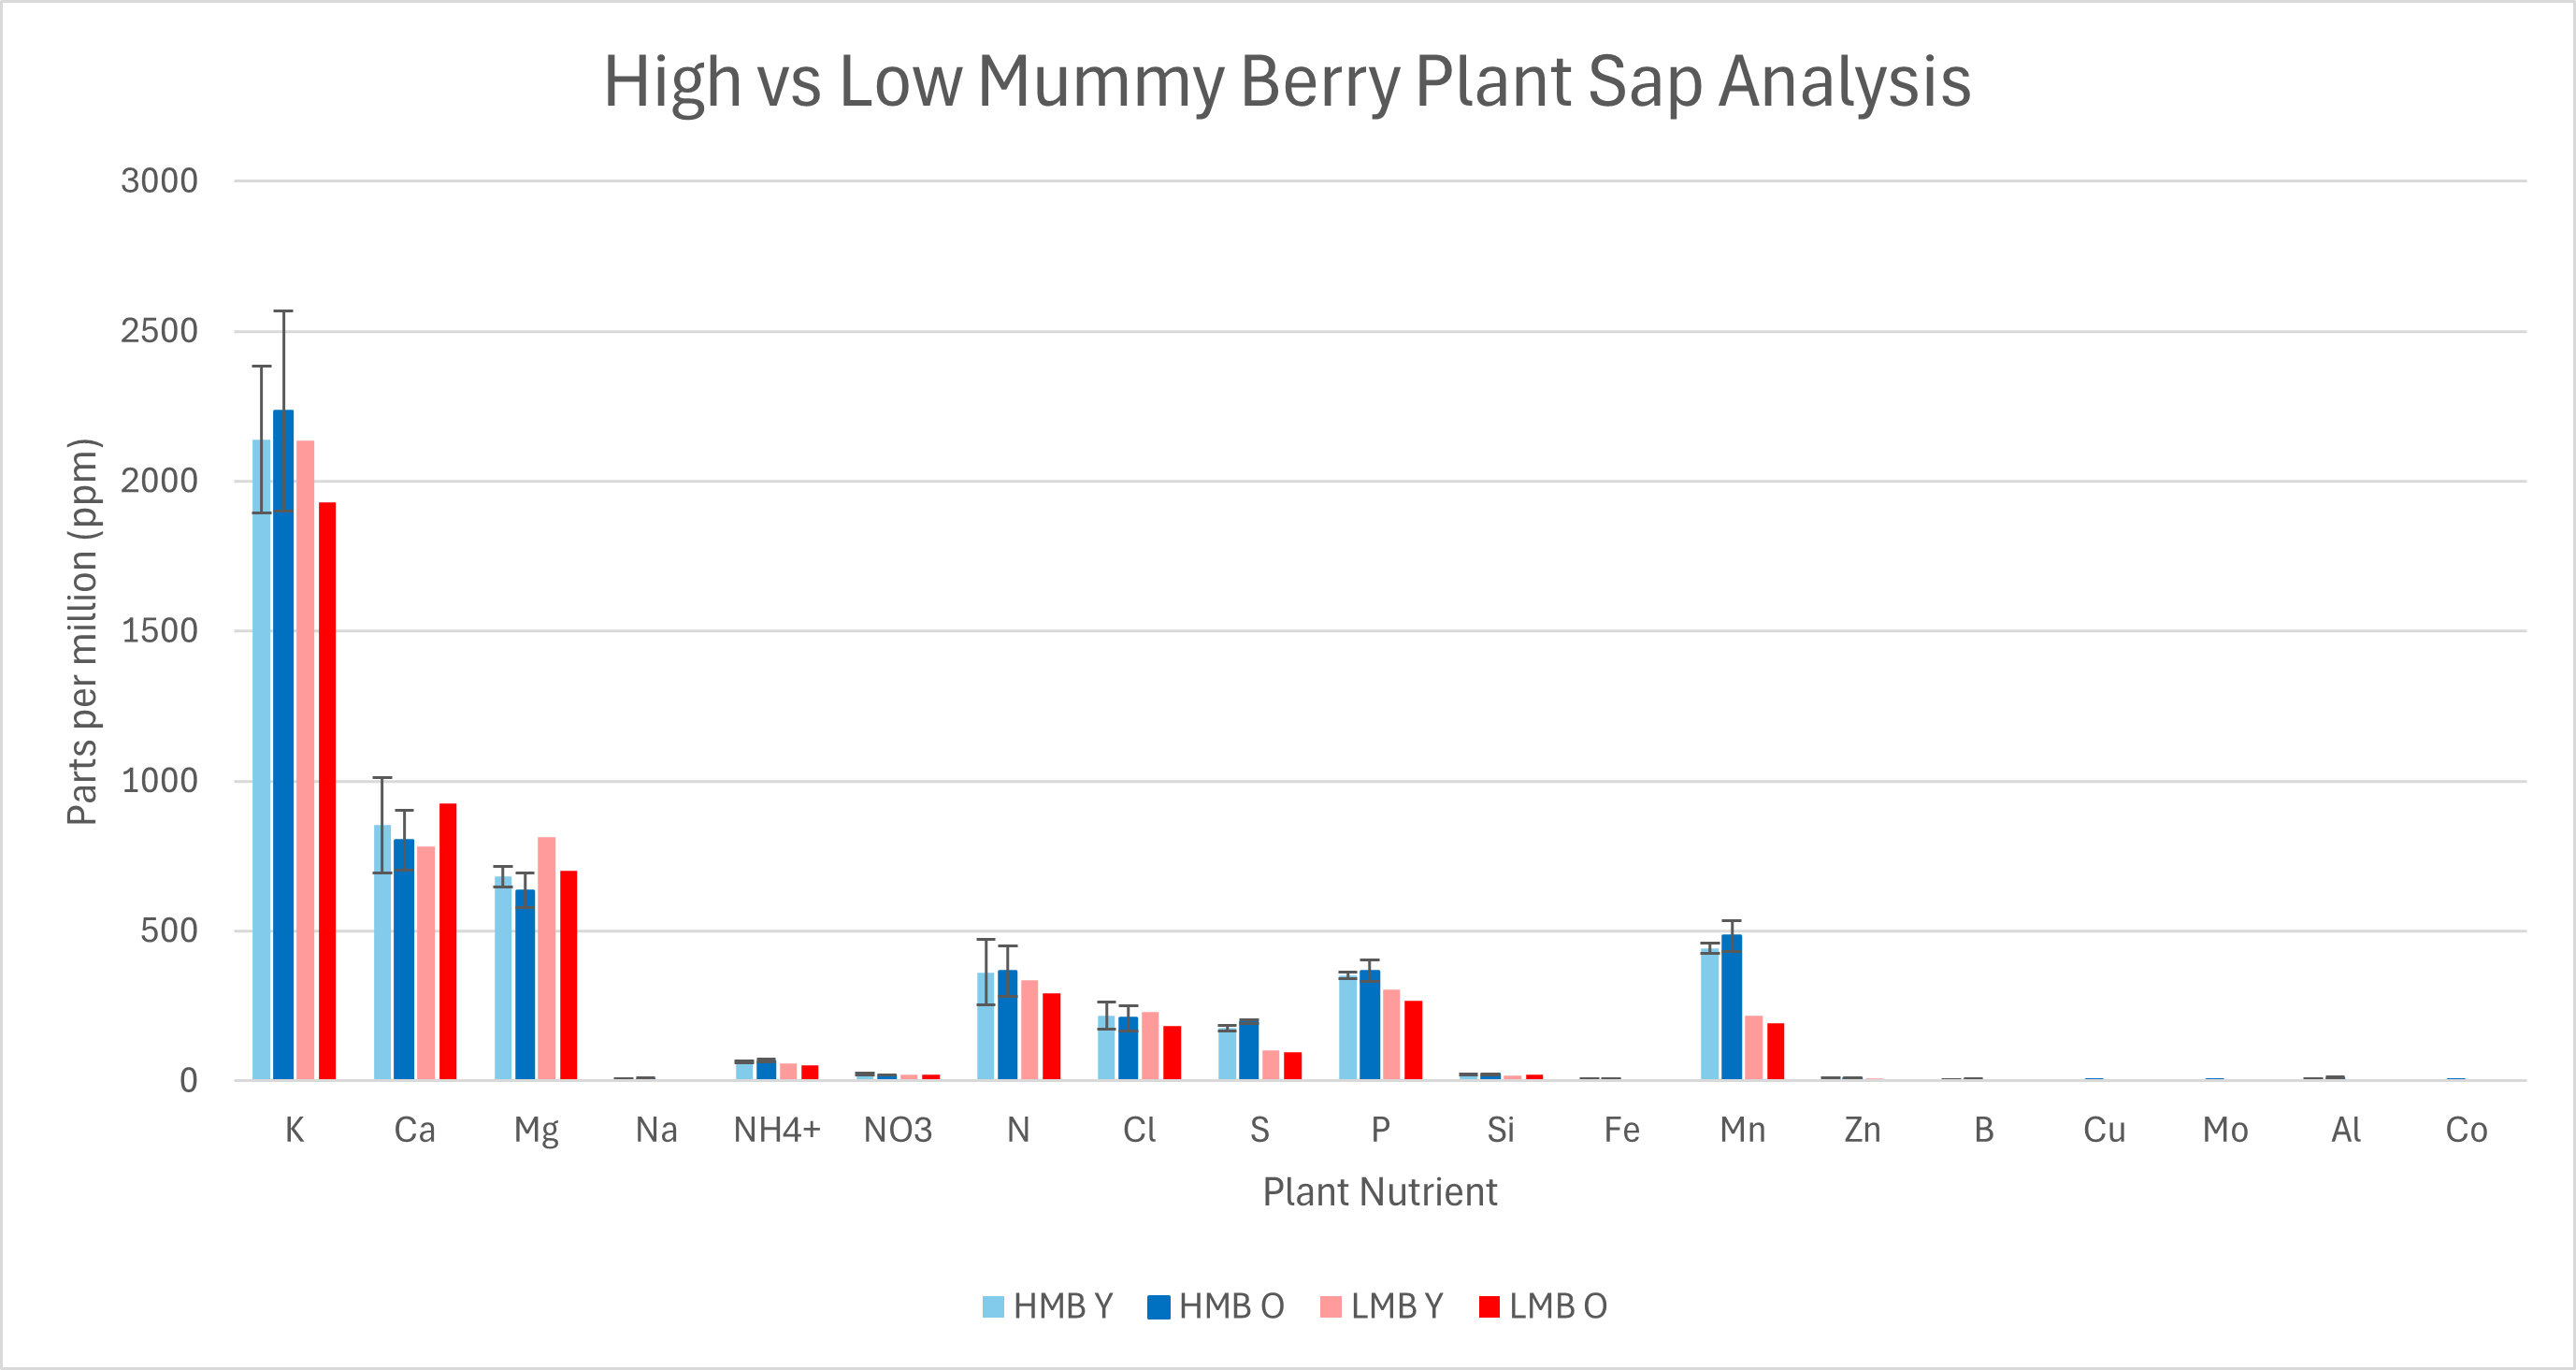
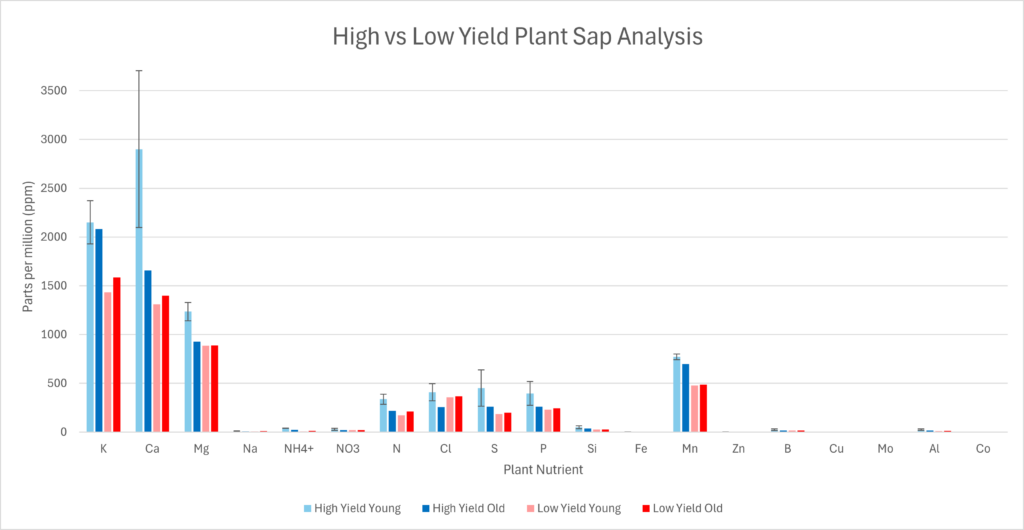
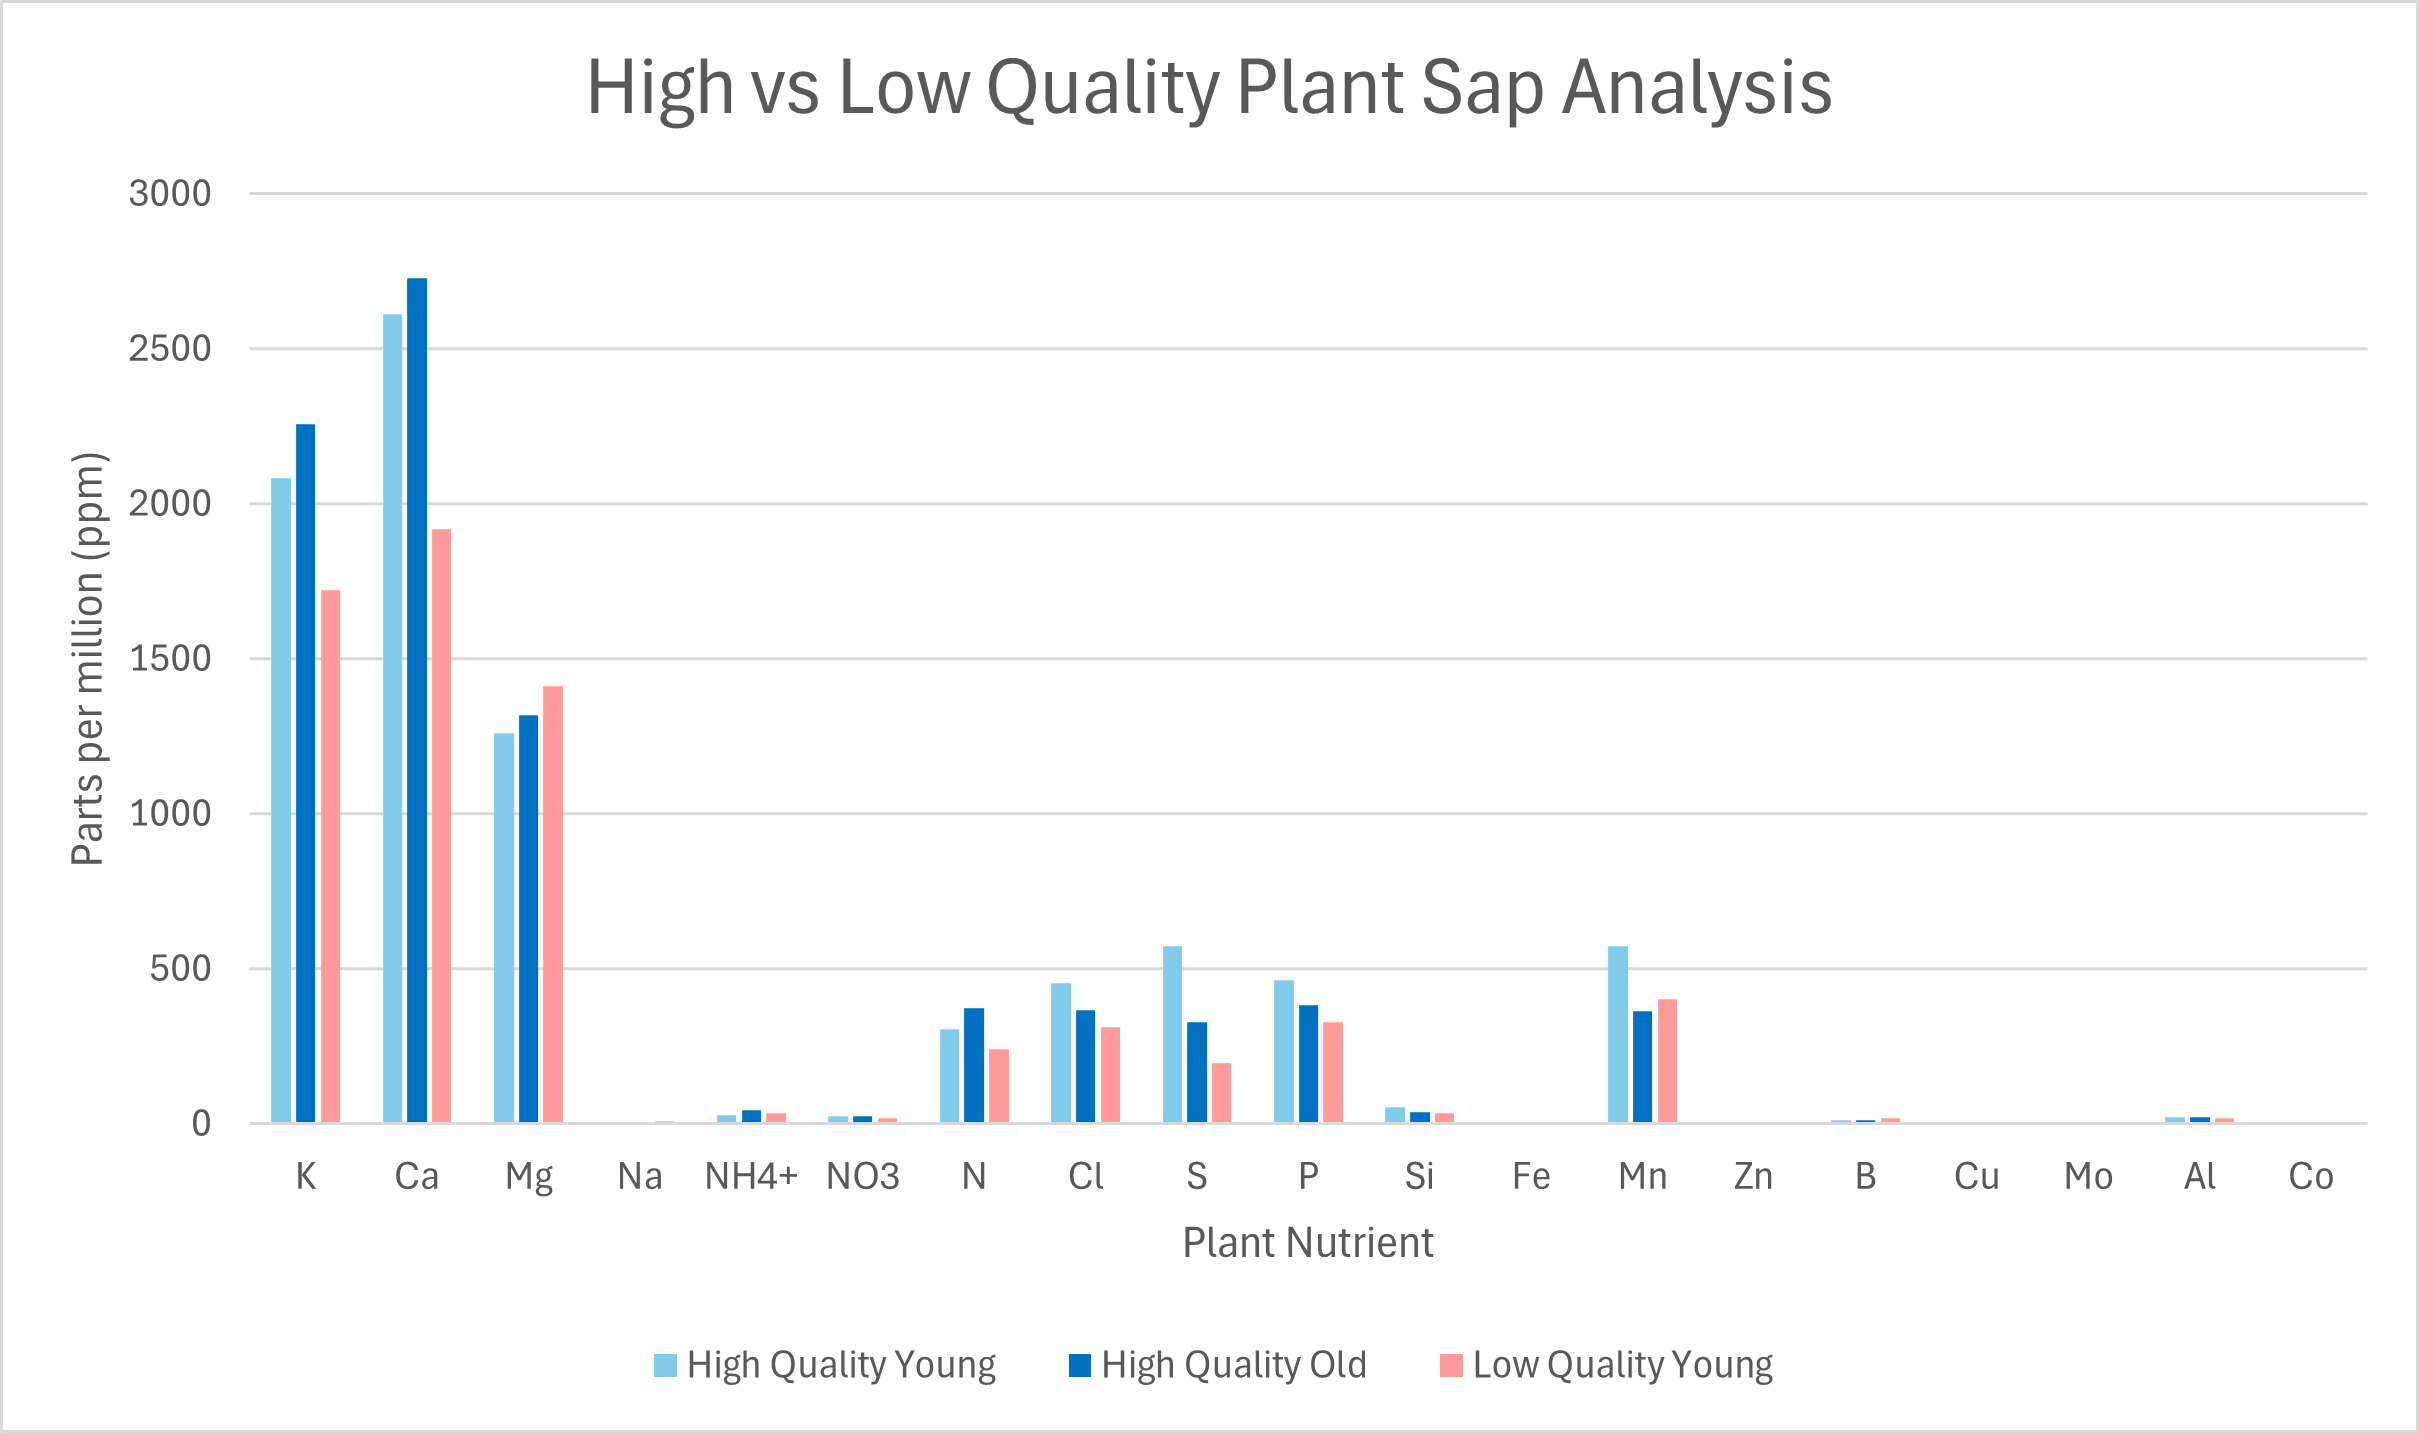
For the first phase of the project, we collected leaves and analyzed sap tests for the “best” and “worst” blueberry plants in our fields for the following parameters: highest and lowest blossom density, highest and lowest rates of mummy berry infection, highest and lowest yield, highest and lowest berry quality.
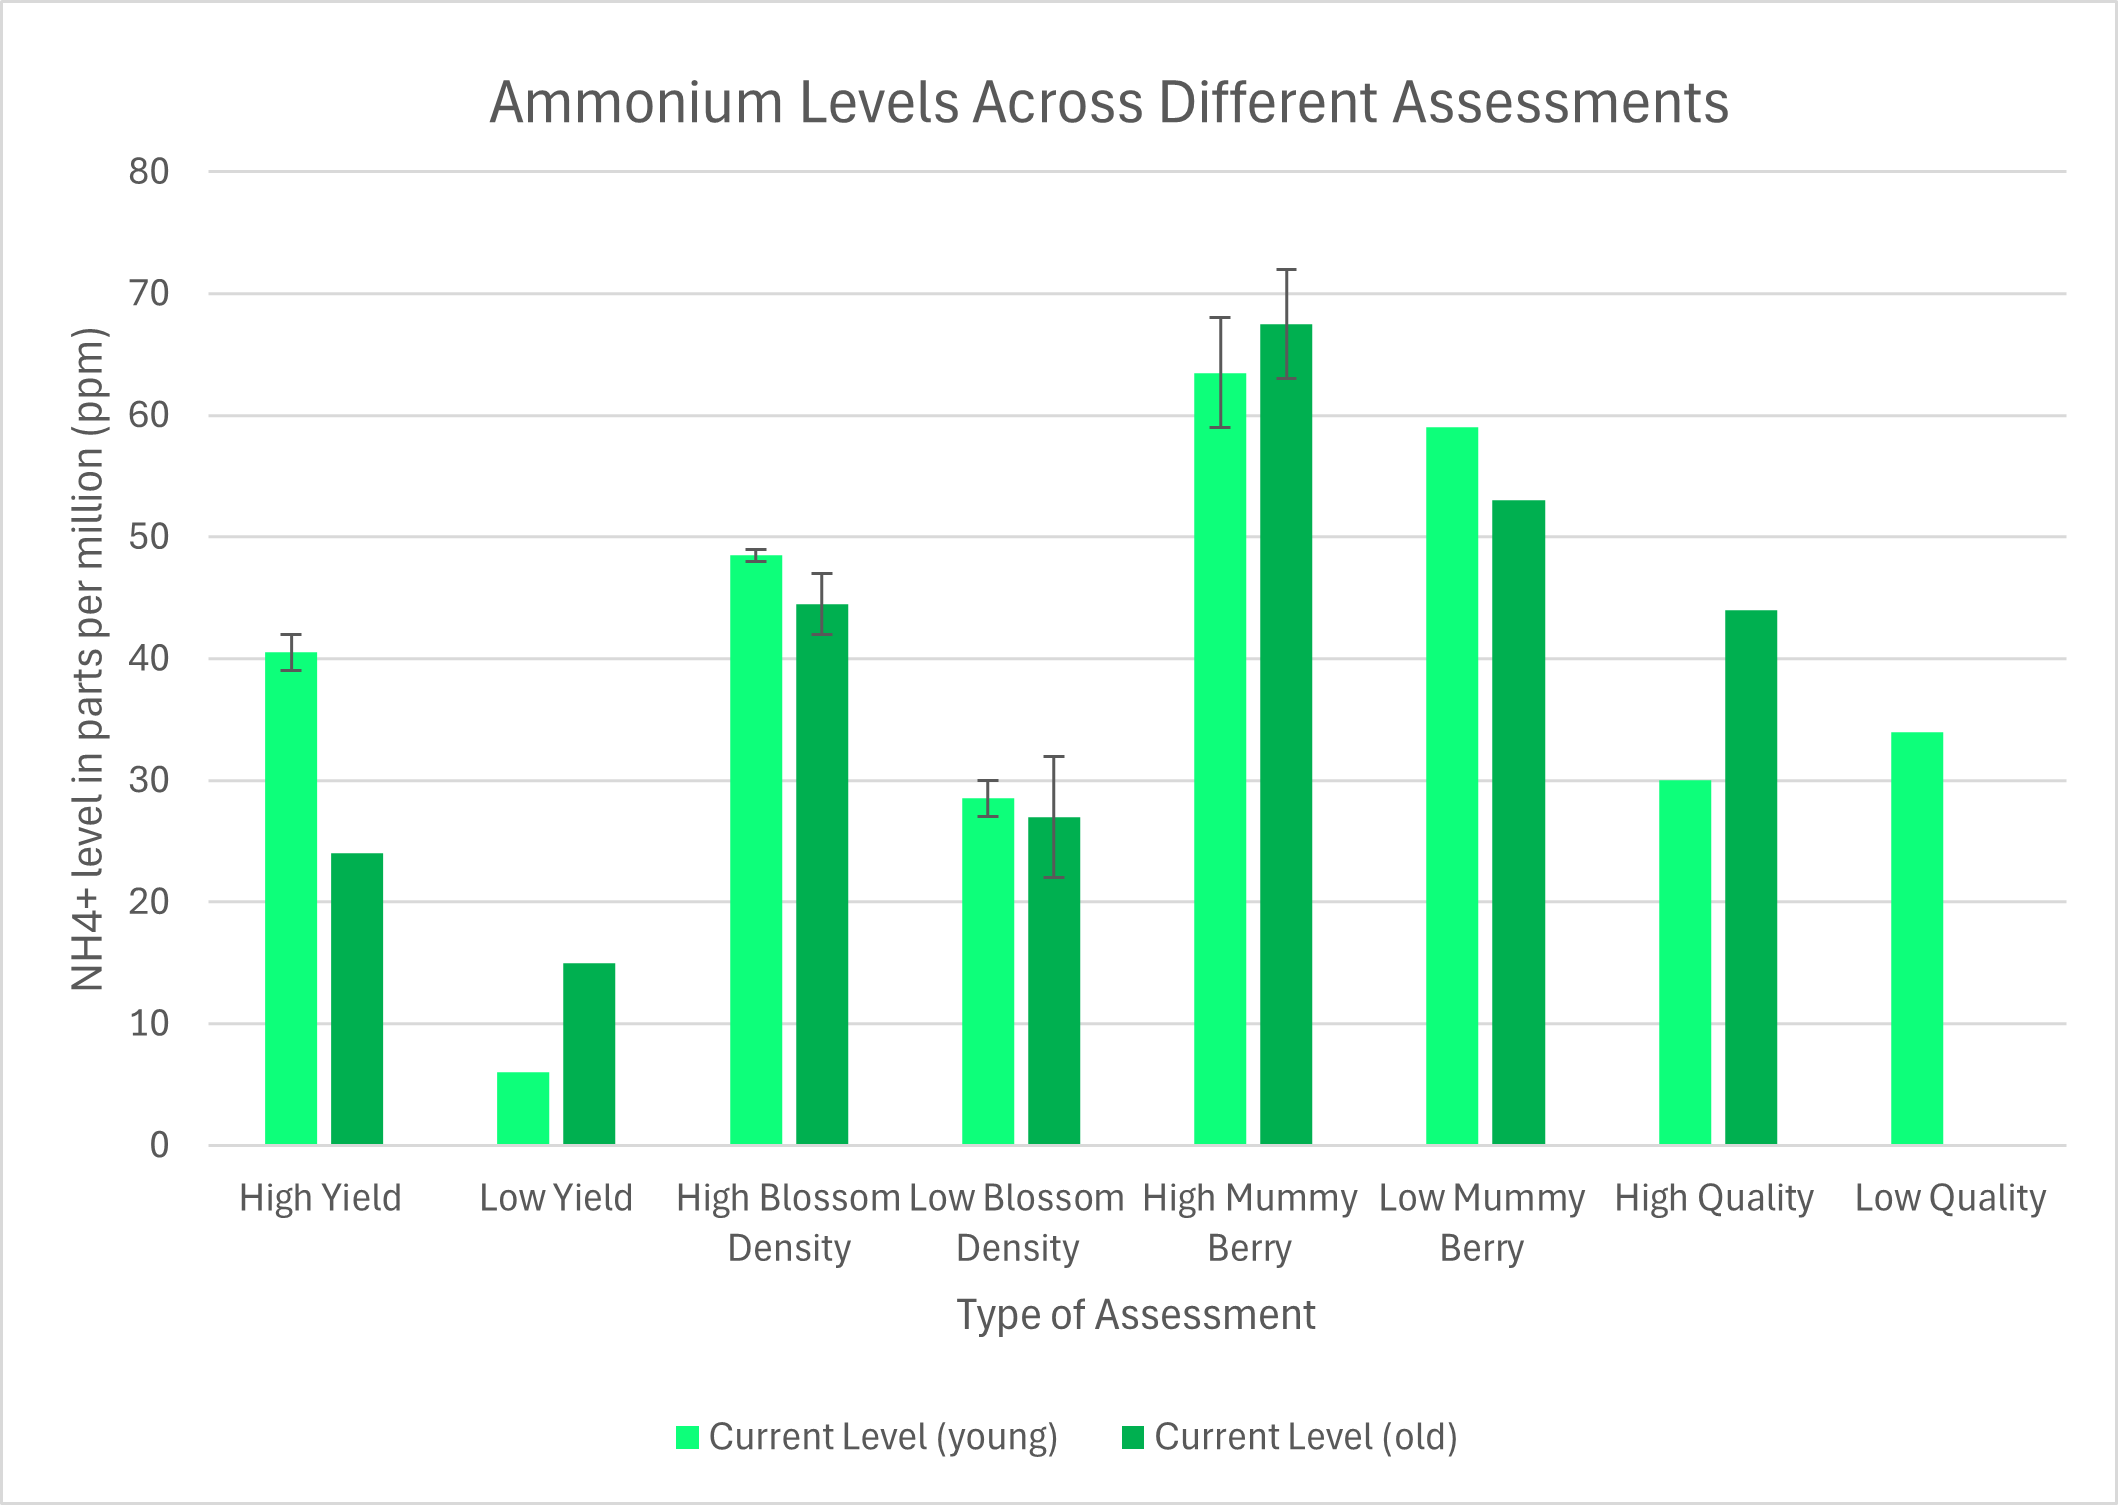
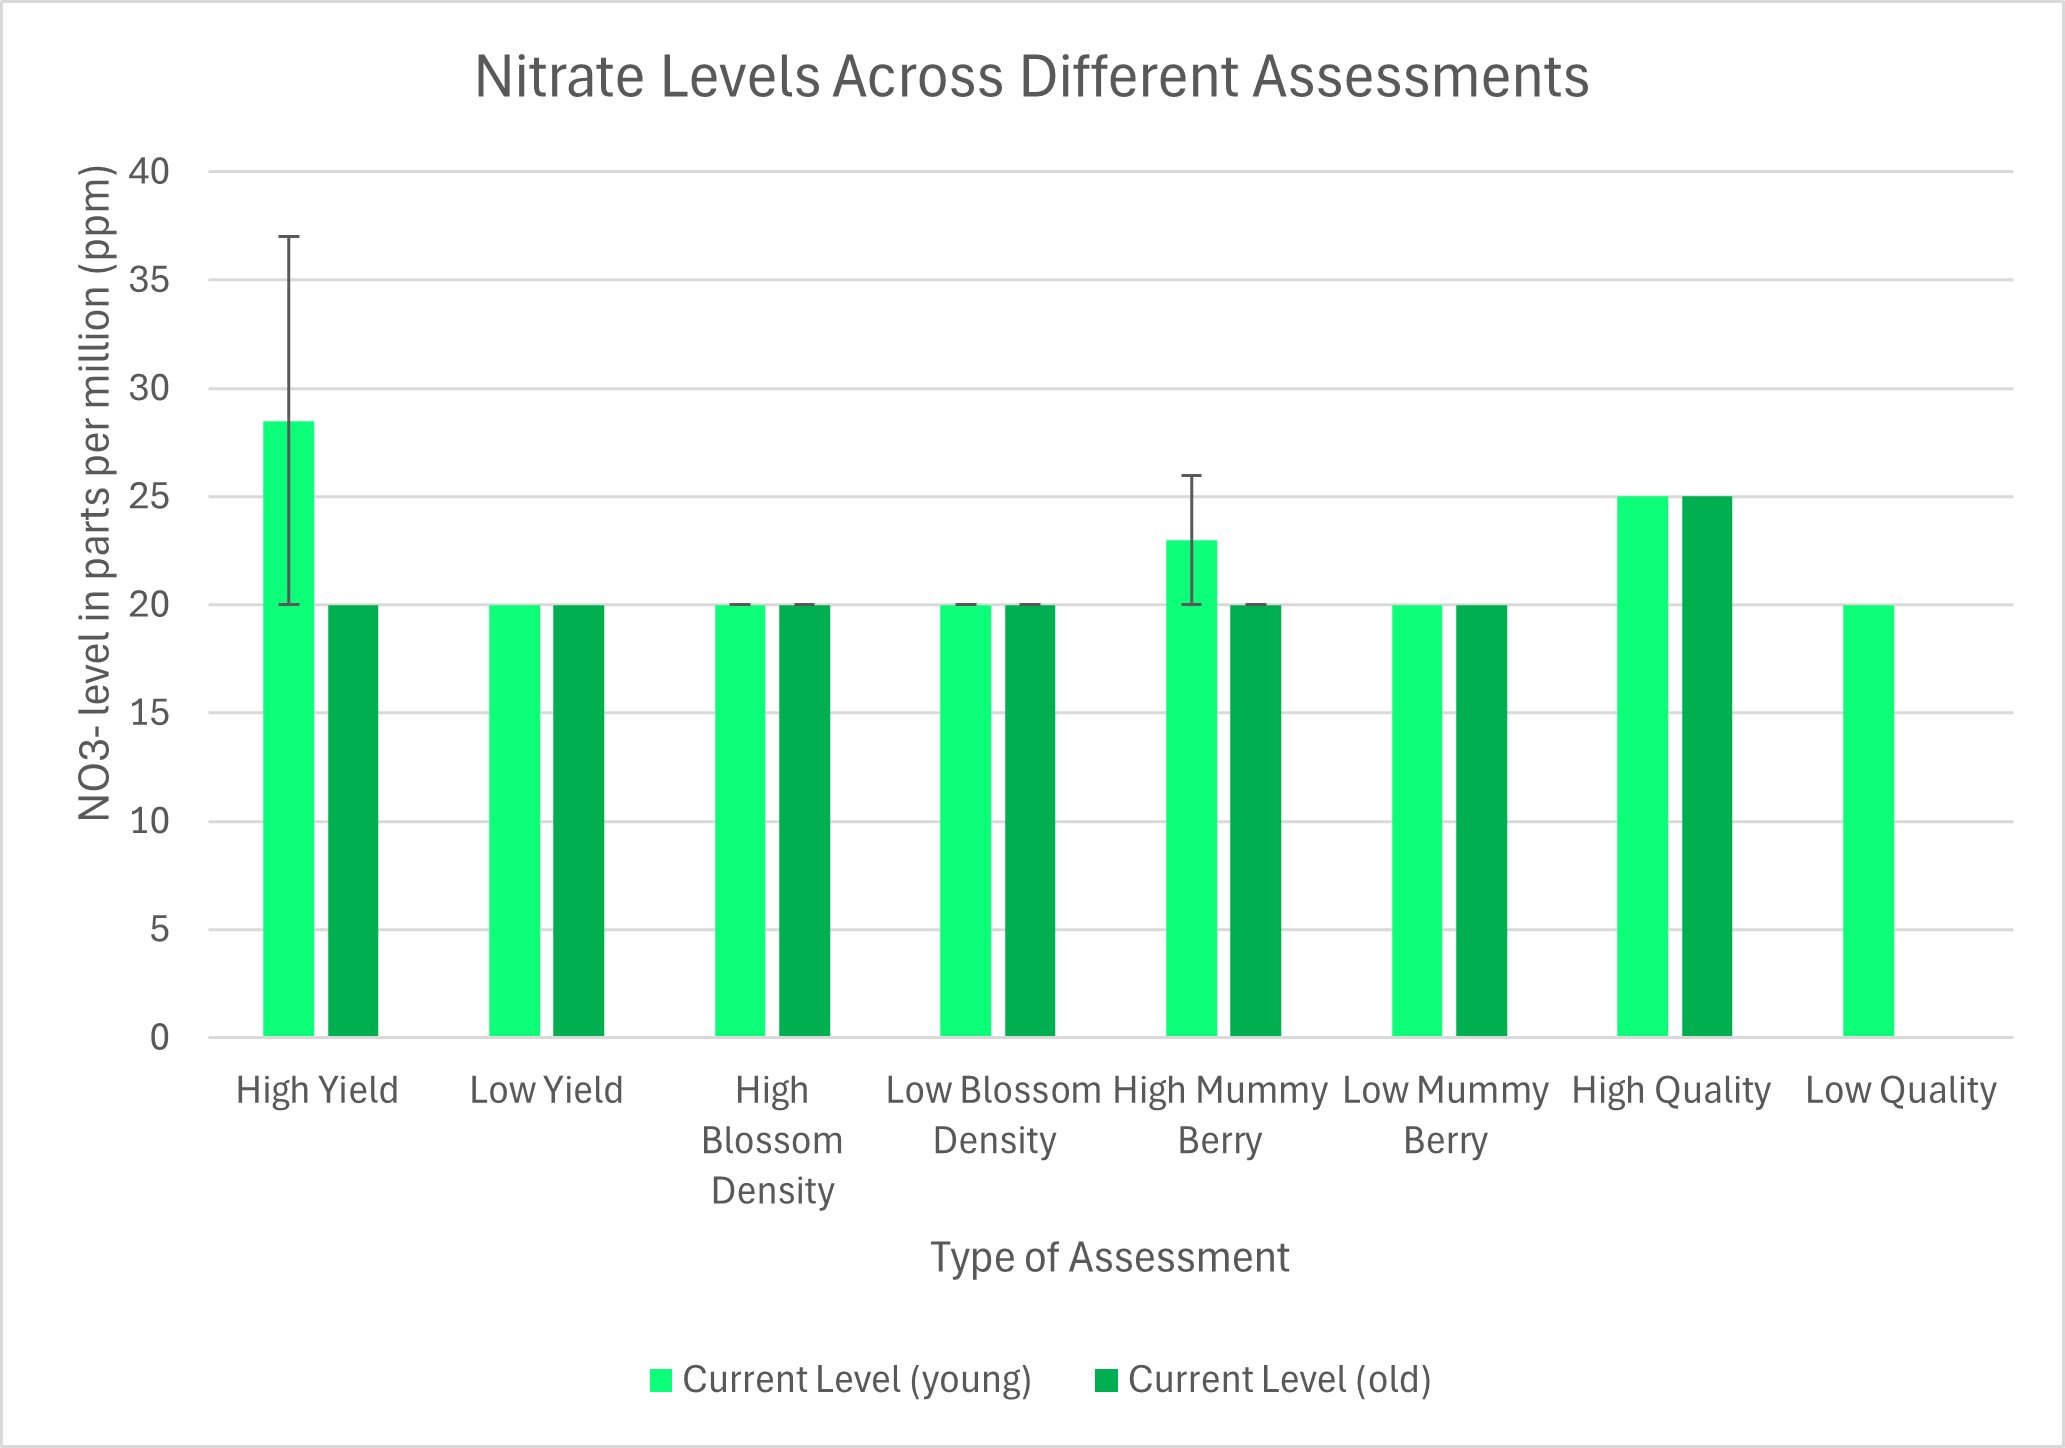
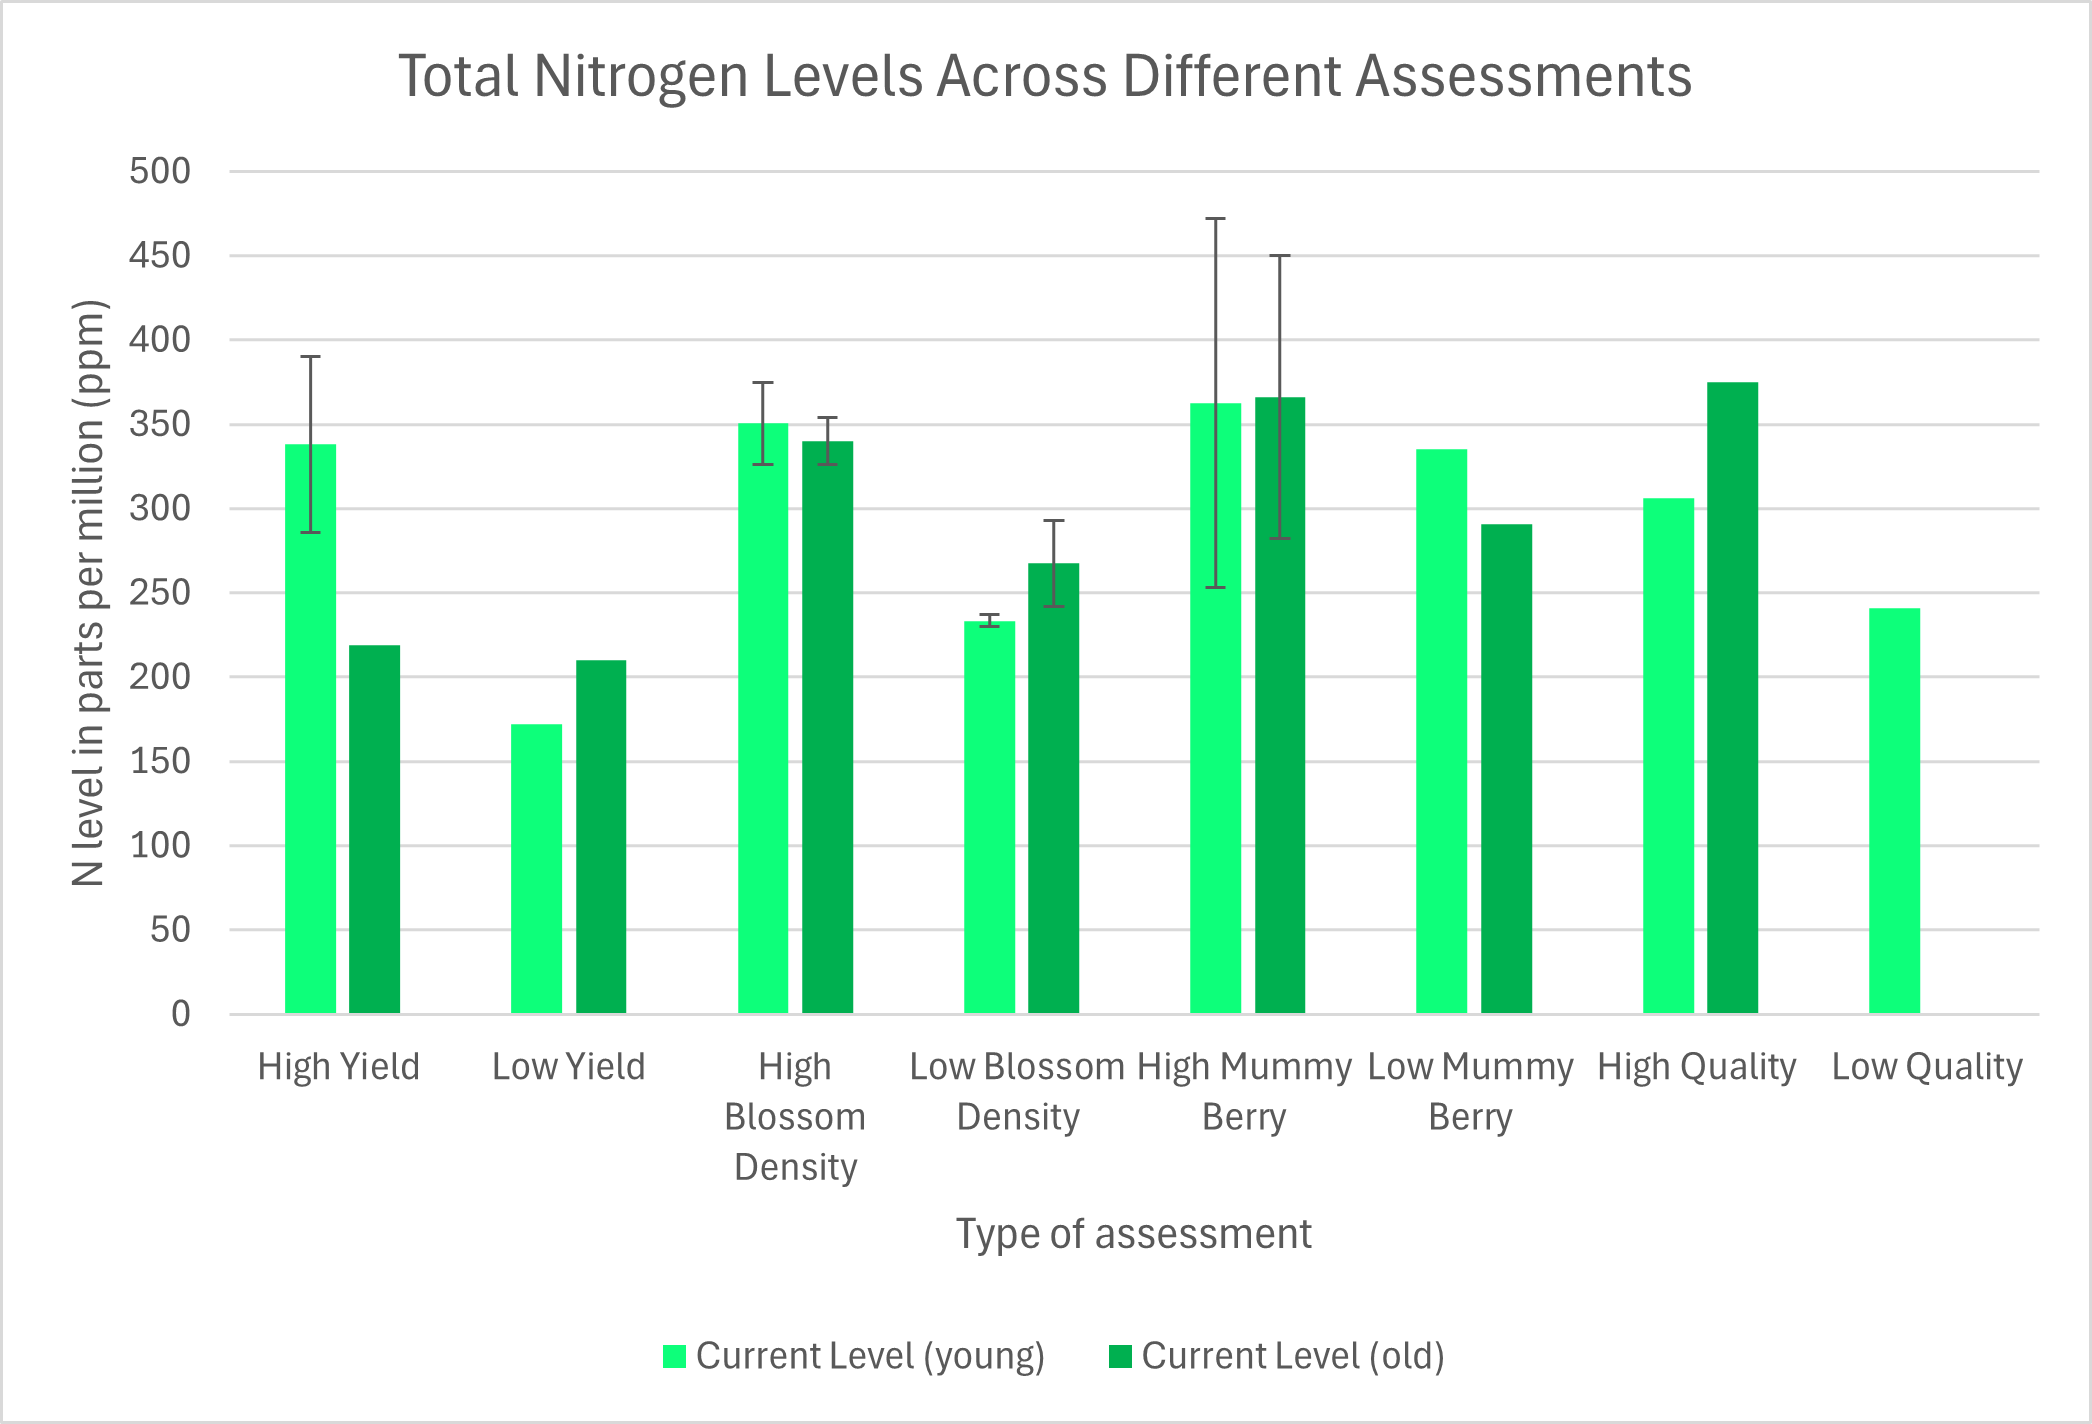
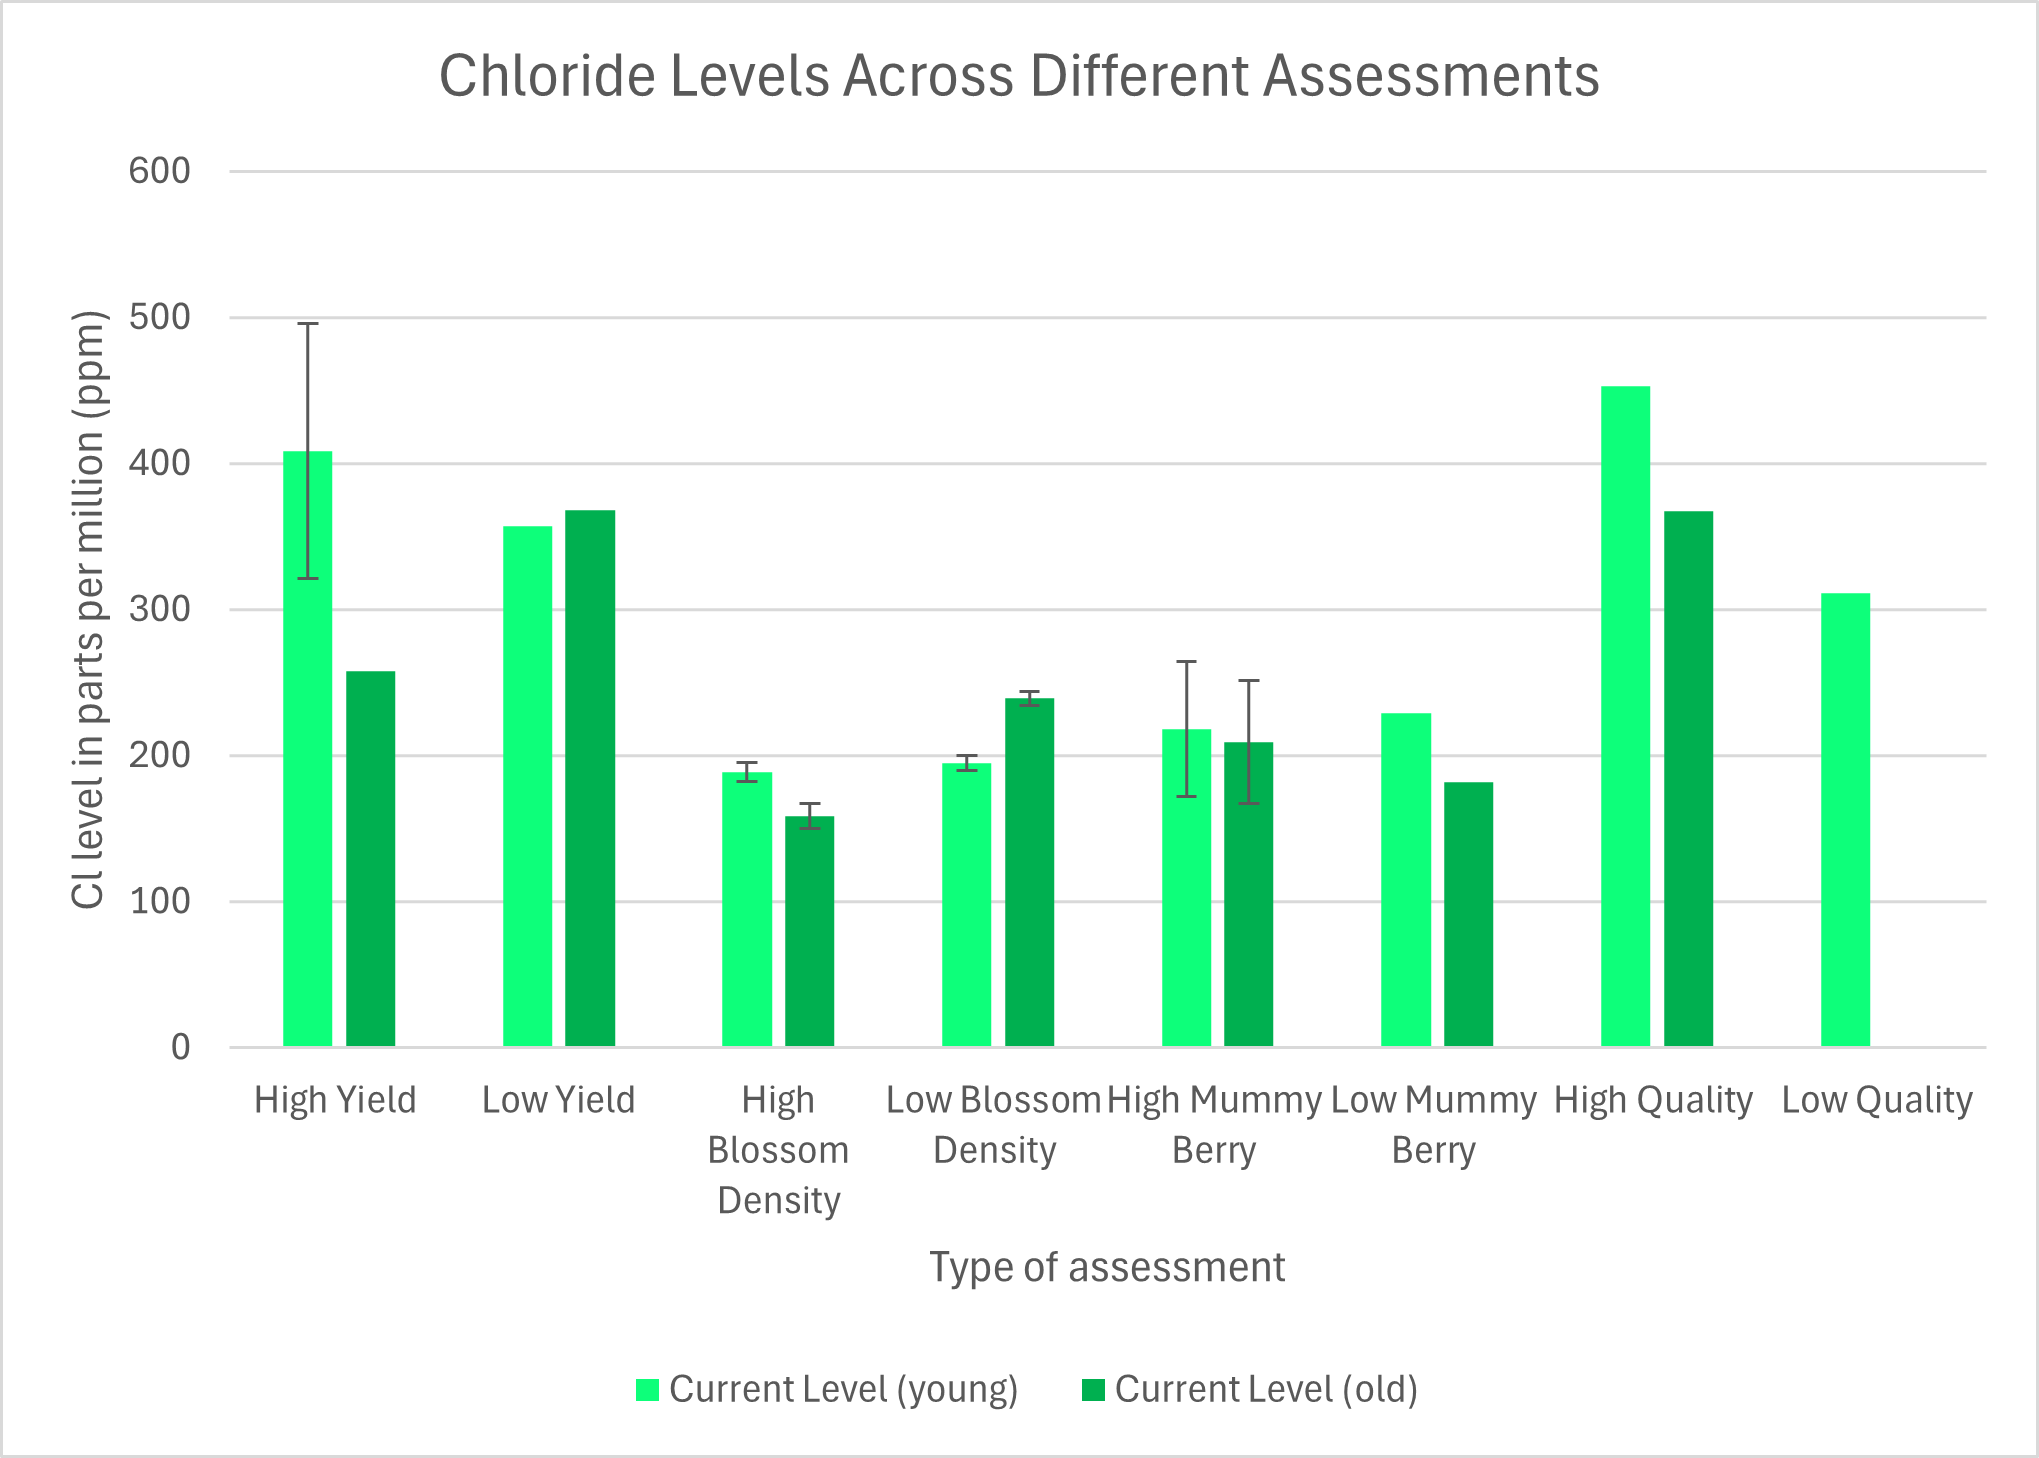
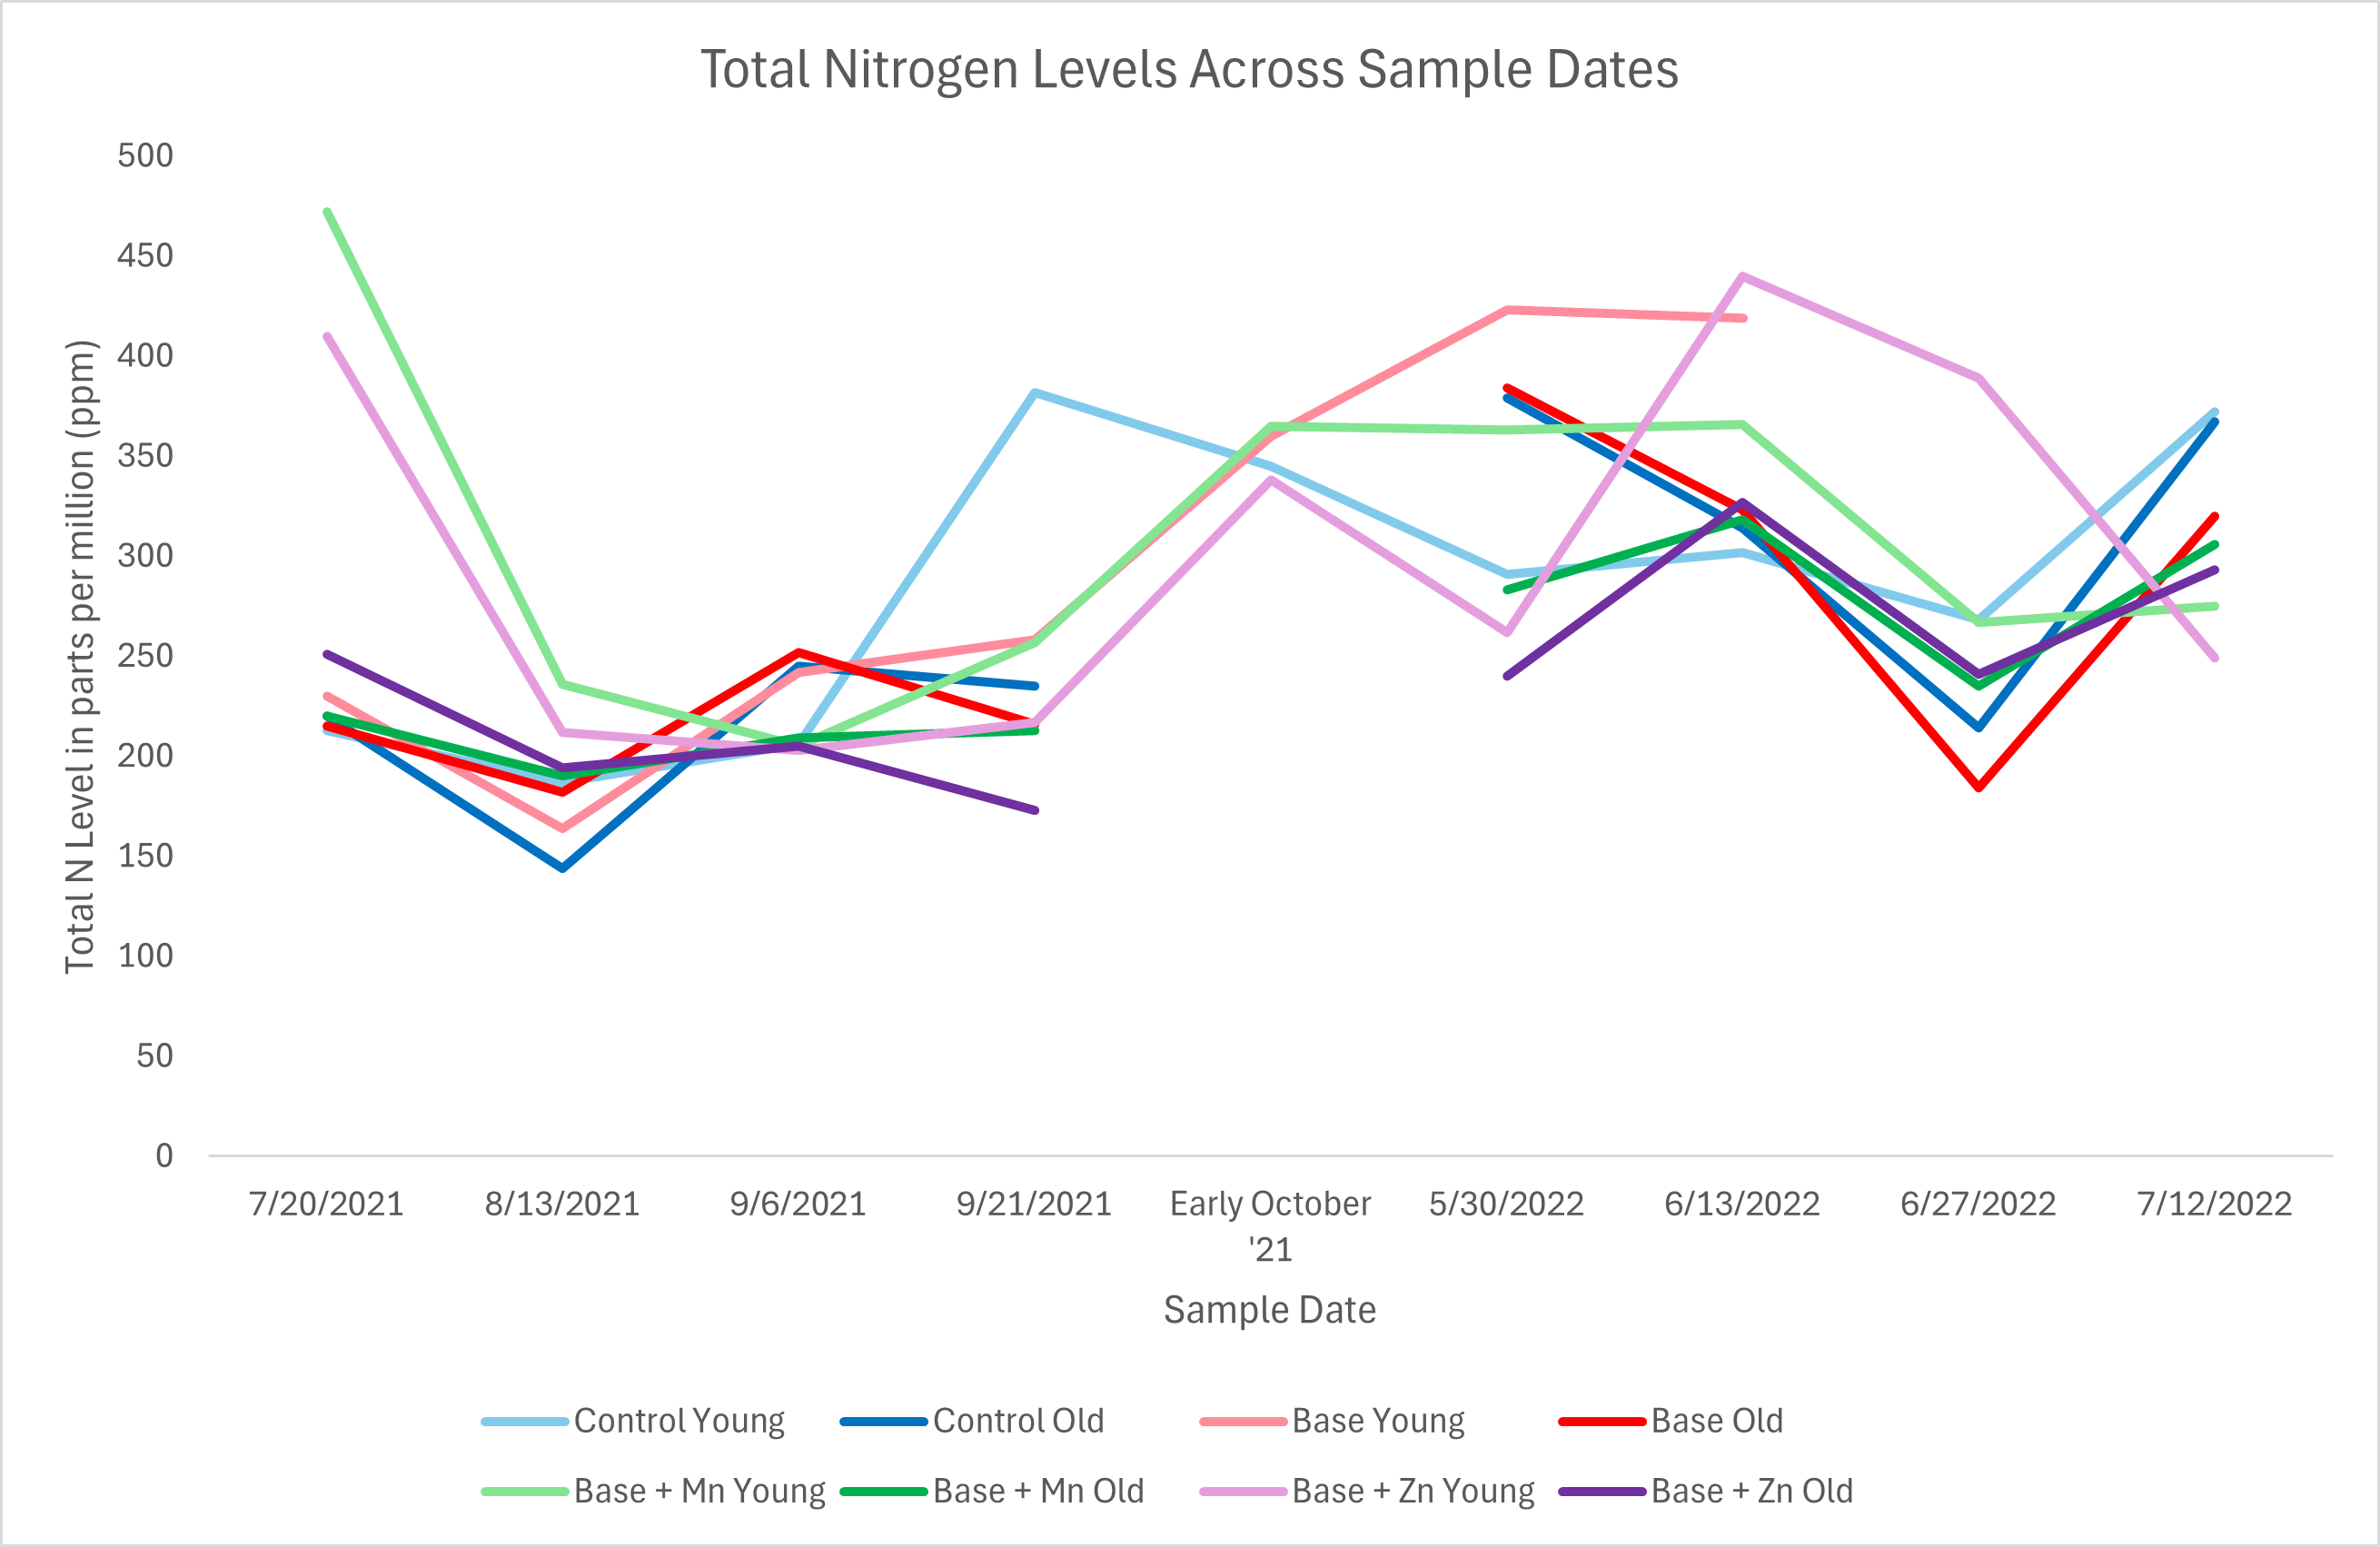
The nutrient levels from the sap analysis for the plants with very high and very low blossom density were very similar. The largest difference was seen in Nitrogen levels which were about 350 ppm for high blossom density plants and 250 ppm for low blossom density plants.
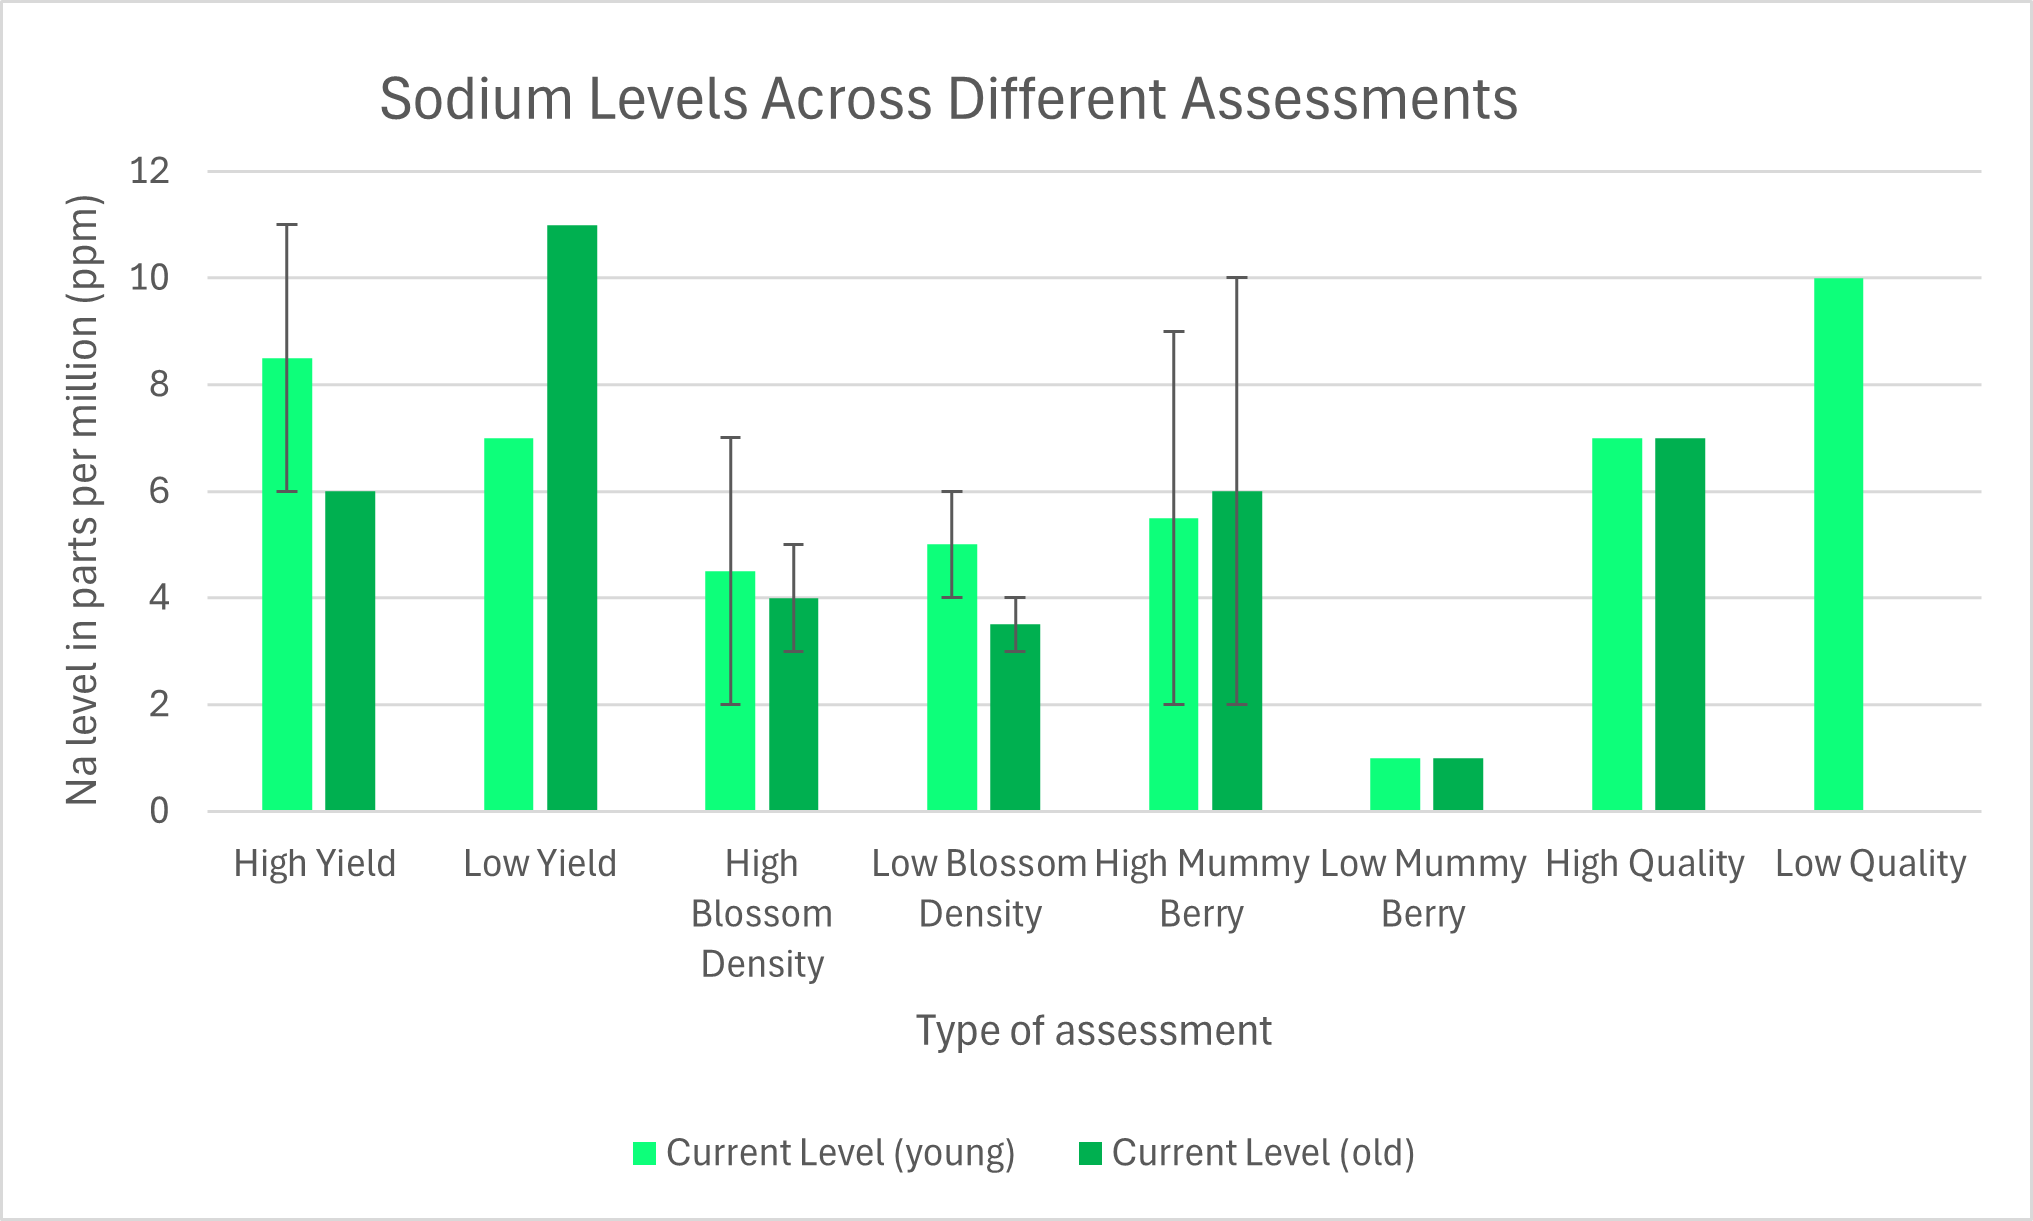
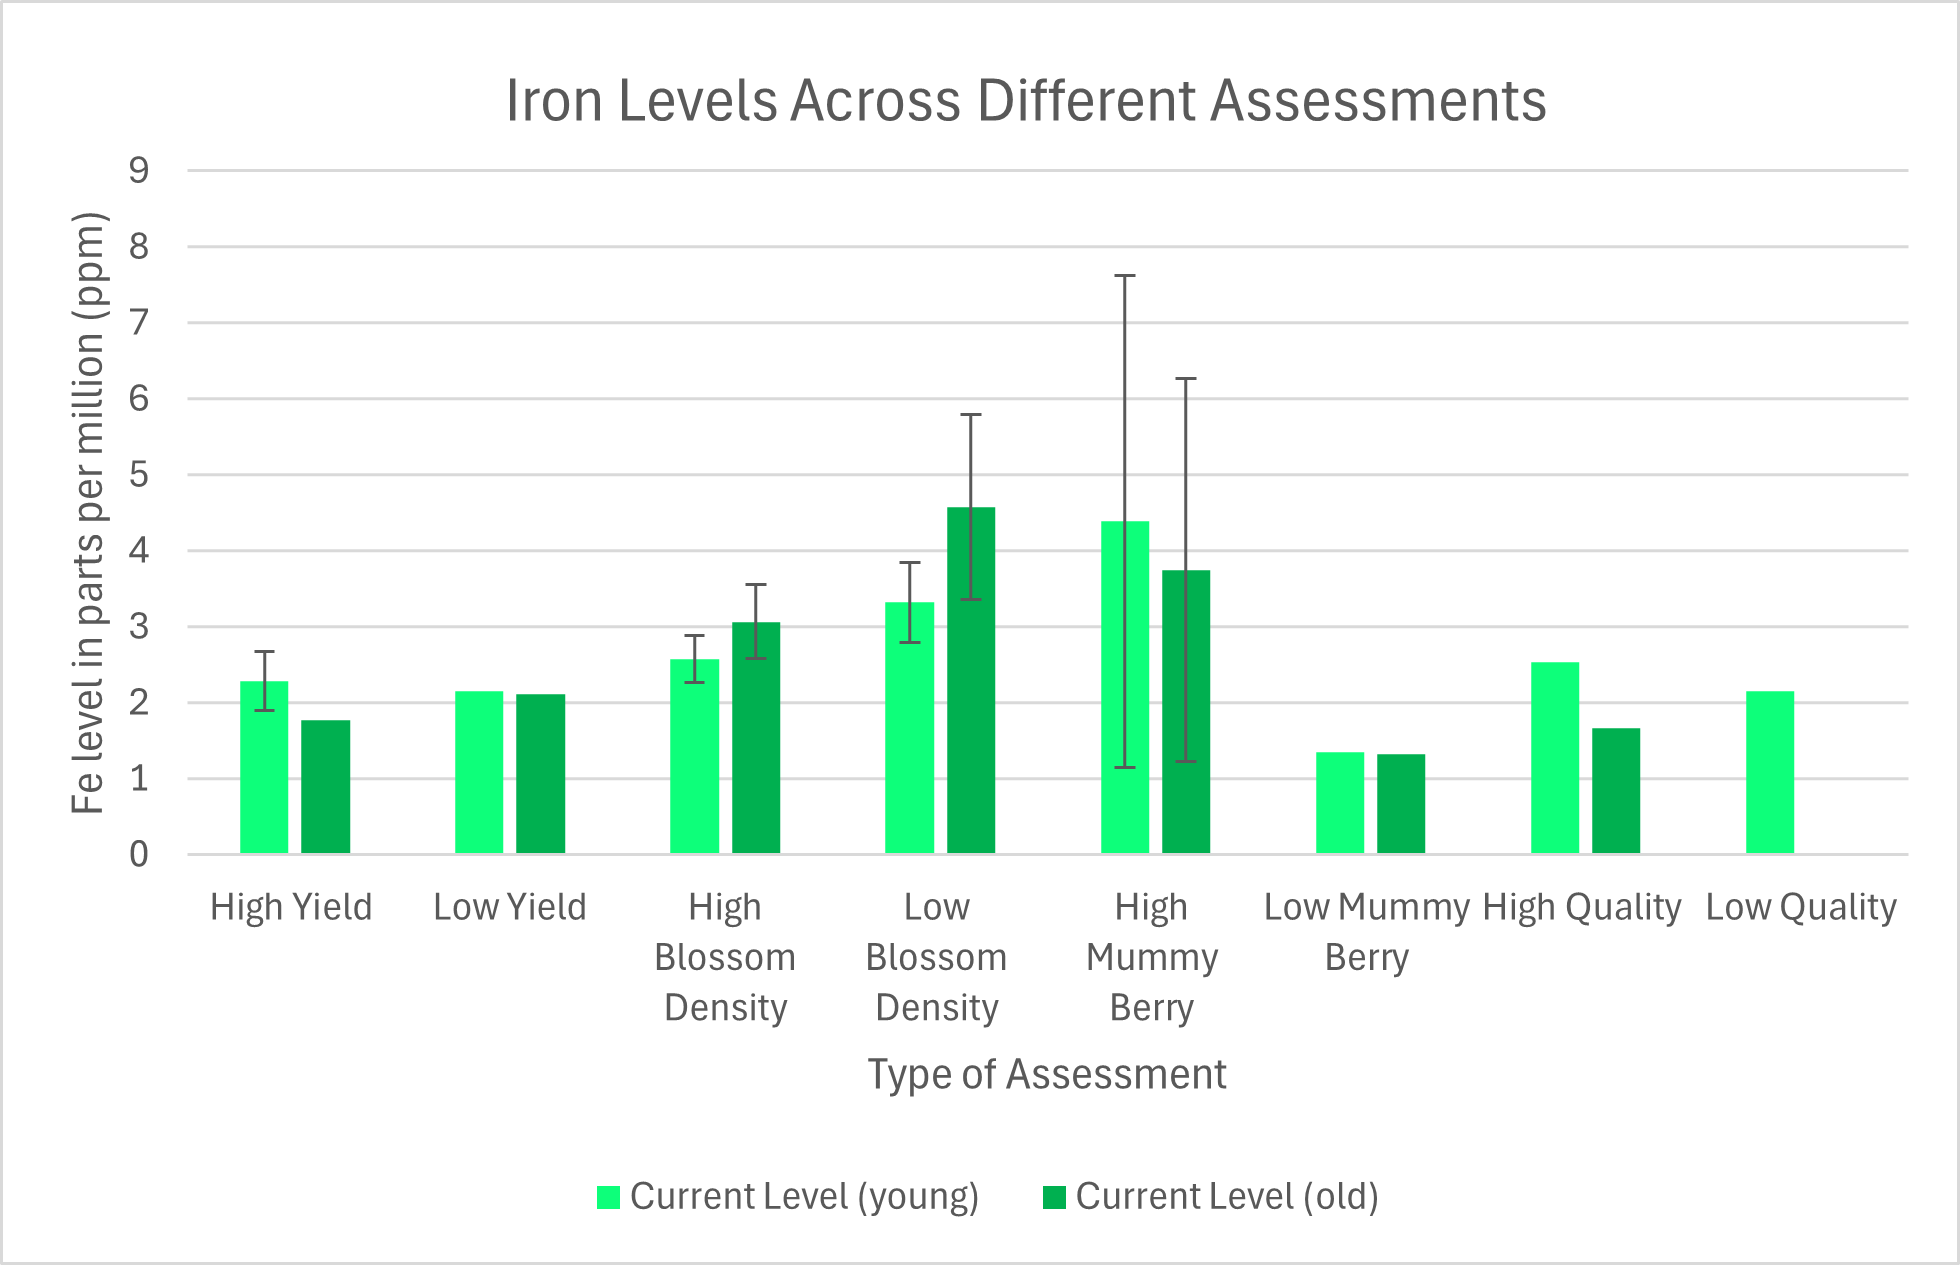
Sap tests performed on the plants with the highest levels of mummy berry infection showed much higher levels of sodium as well as higher levels of boron, copper, manganese, iron, and sulfur. However, the spring of 2021 was extremely dry and there was very little mummy berry occurrence in our fields. The only plants with mummy berry infection were in areas with standing water and it was not possible to know if we were selecting plants with a true susceptibility to infection due to the extremely low prevalence of mummy berry that year.
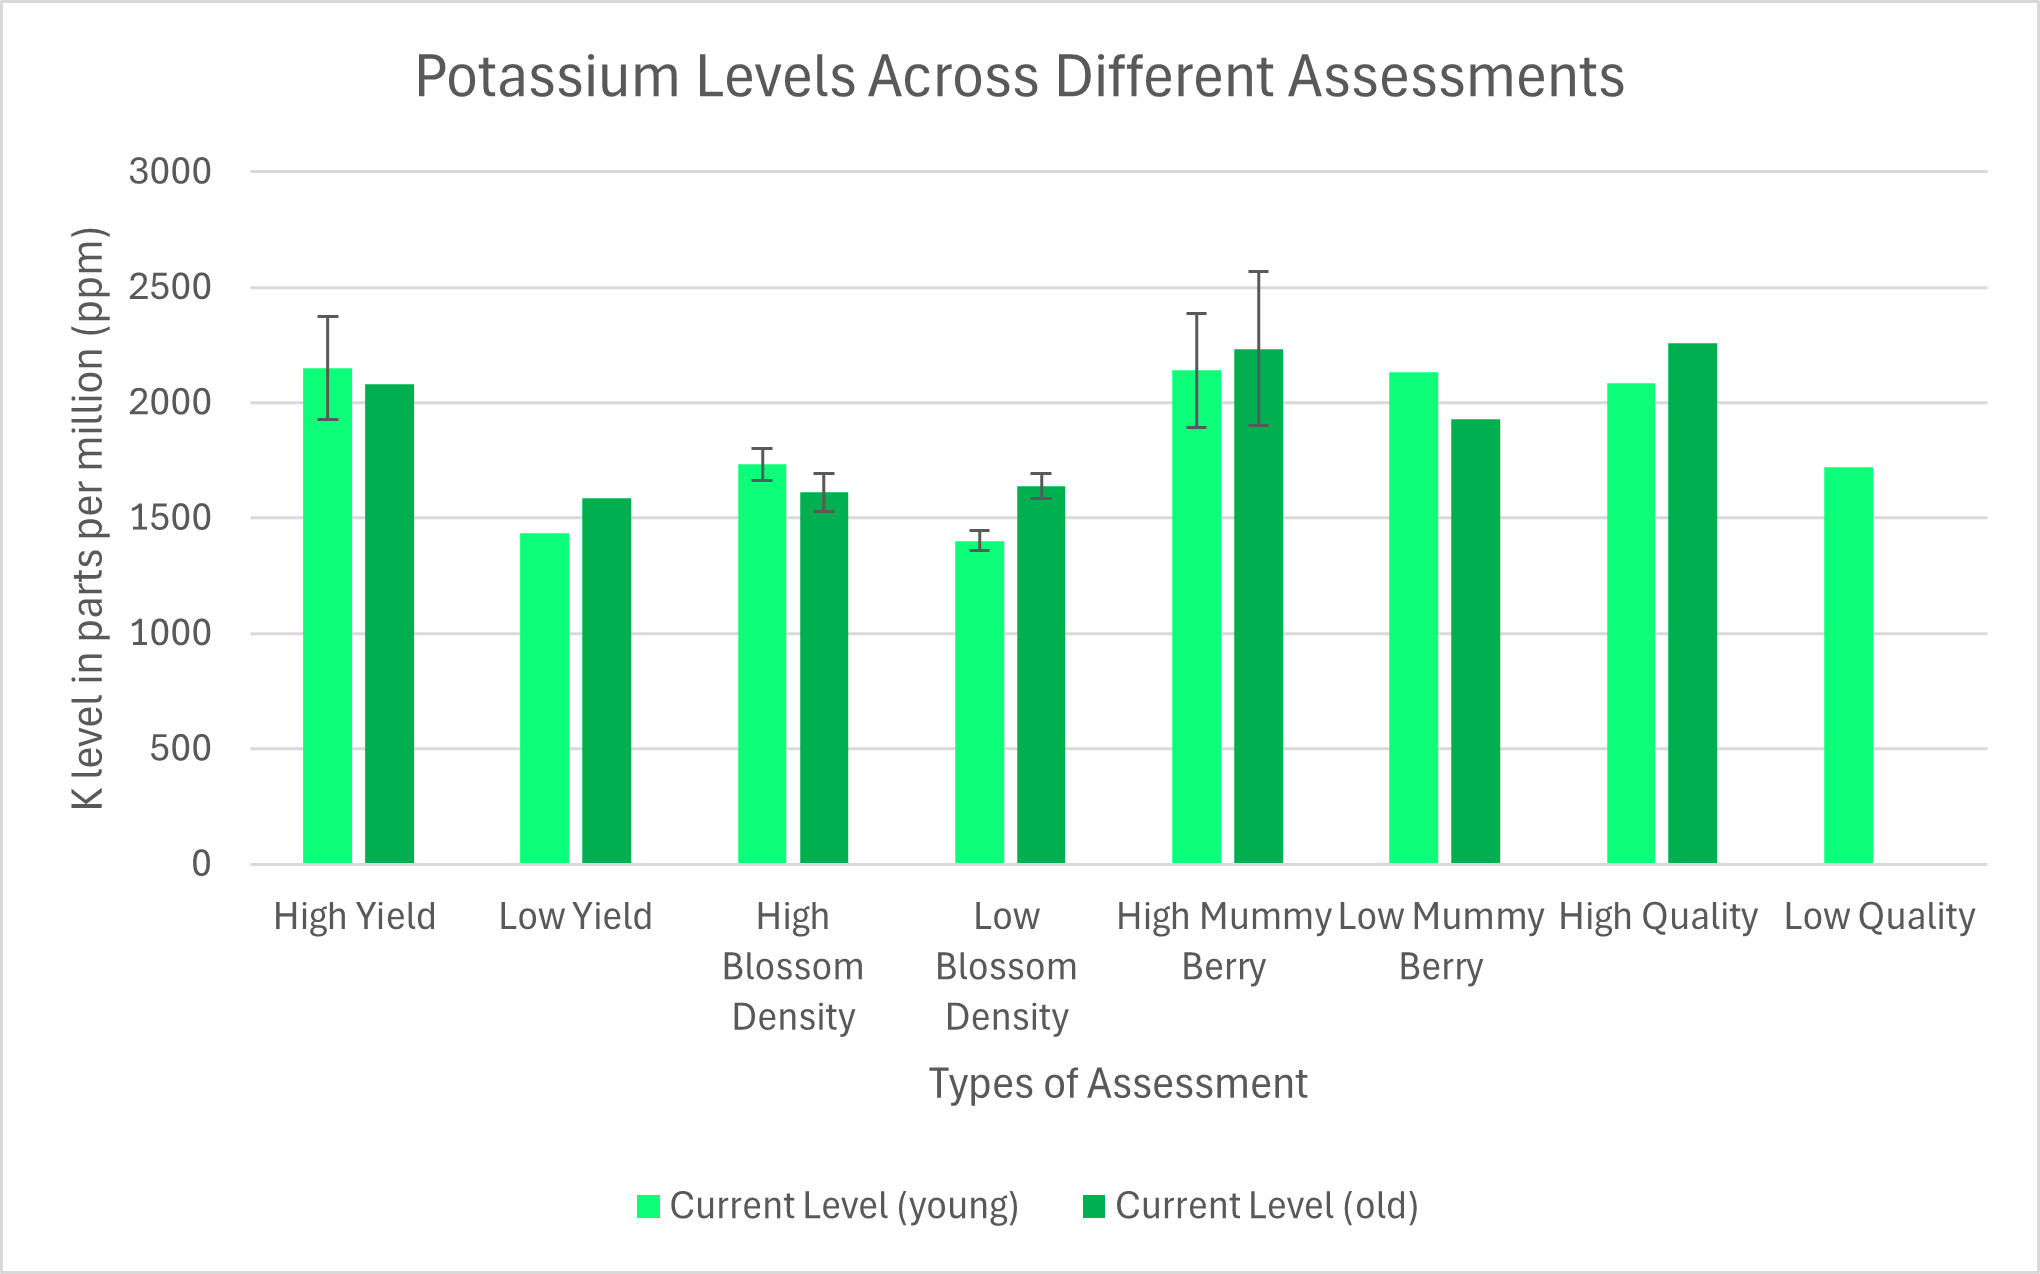
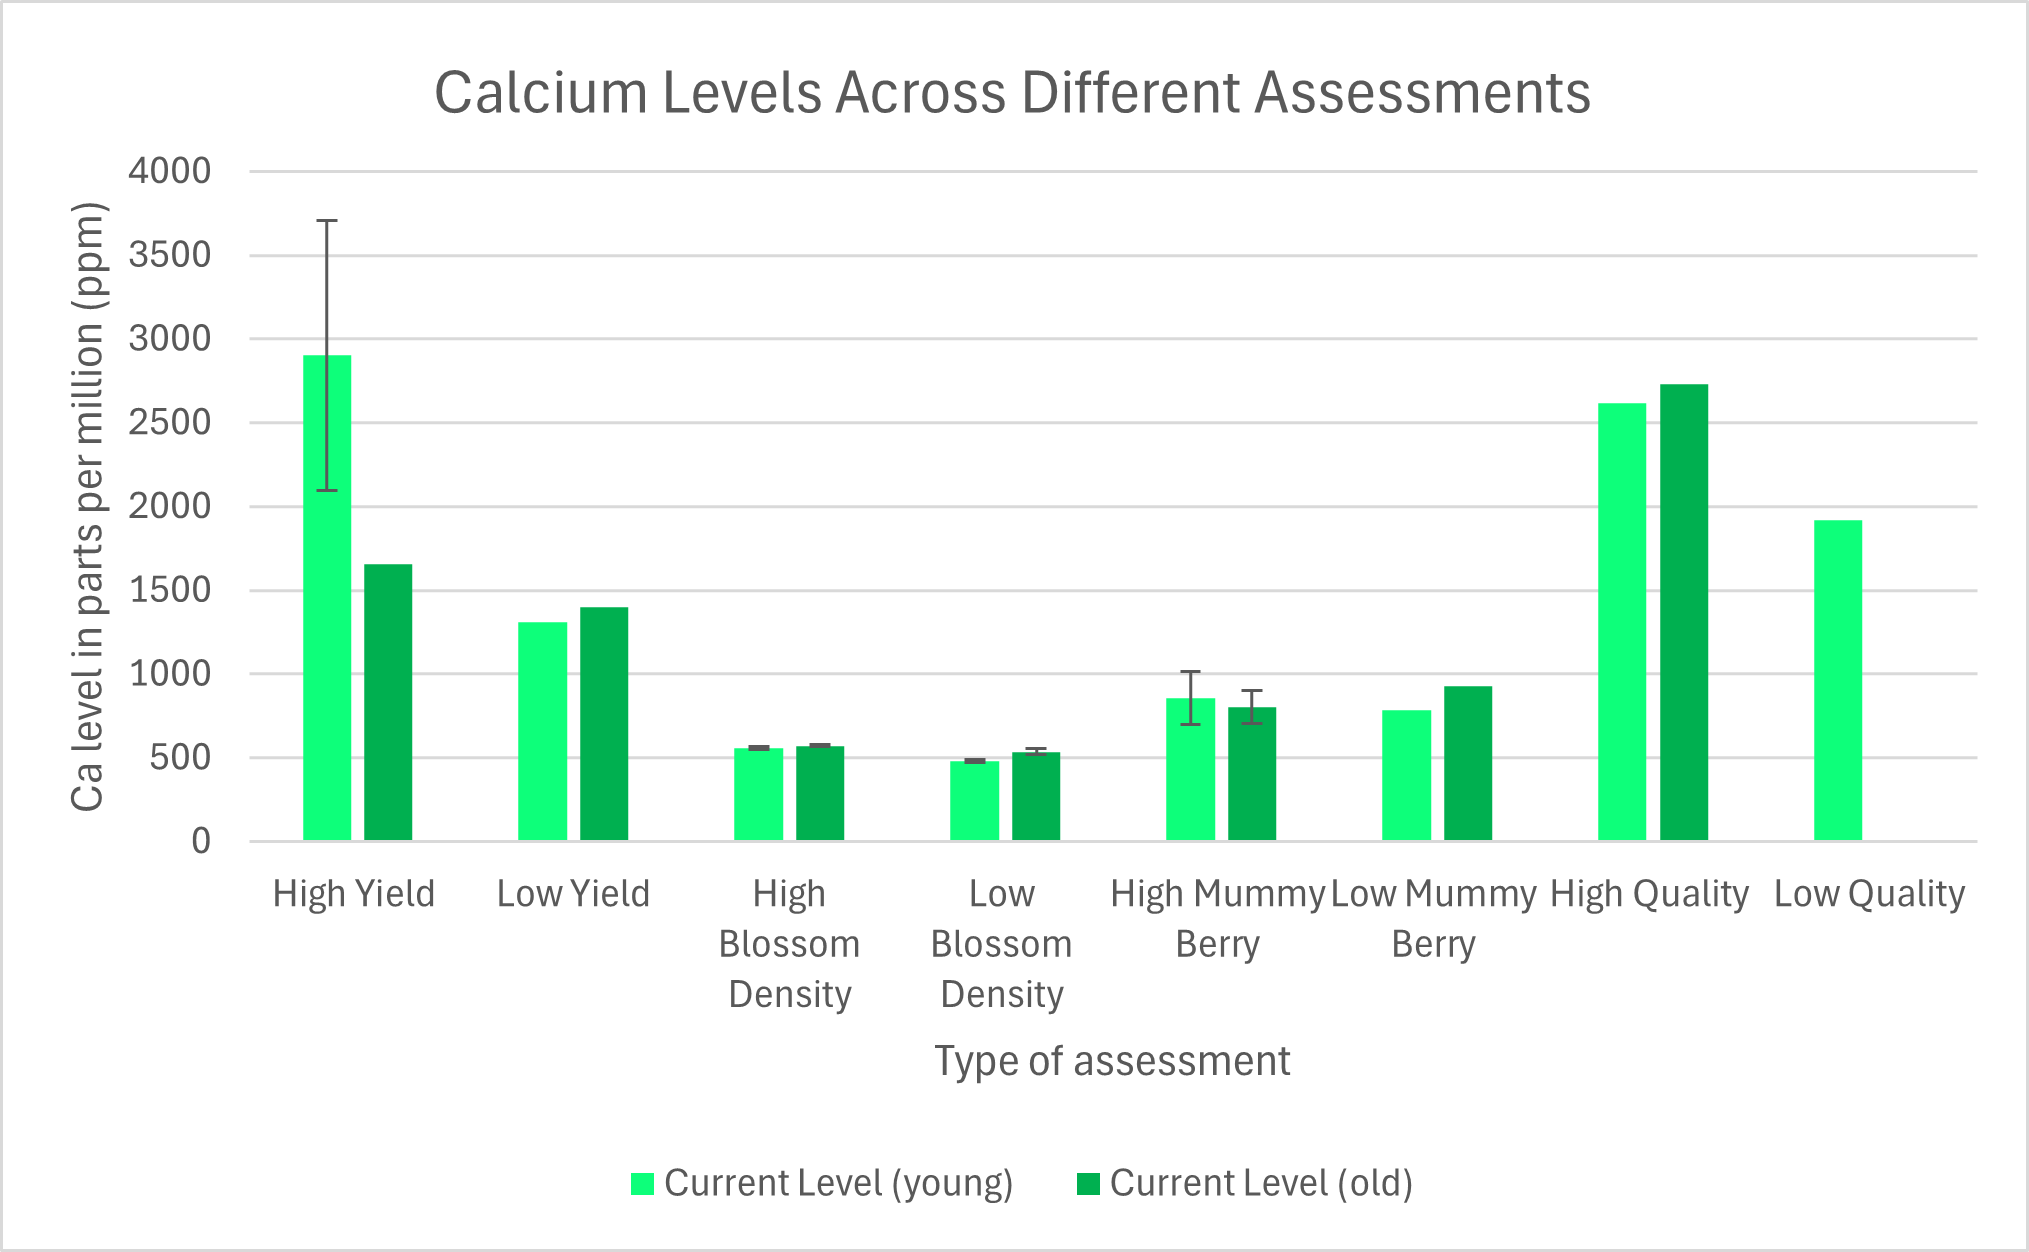
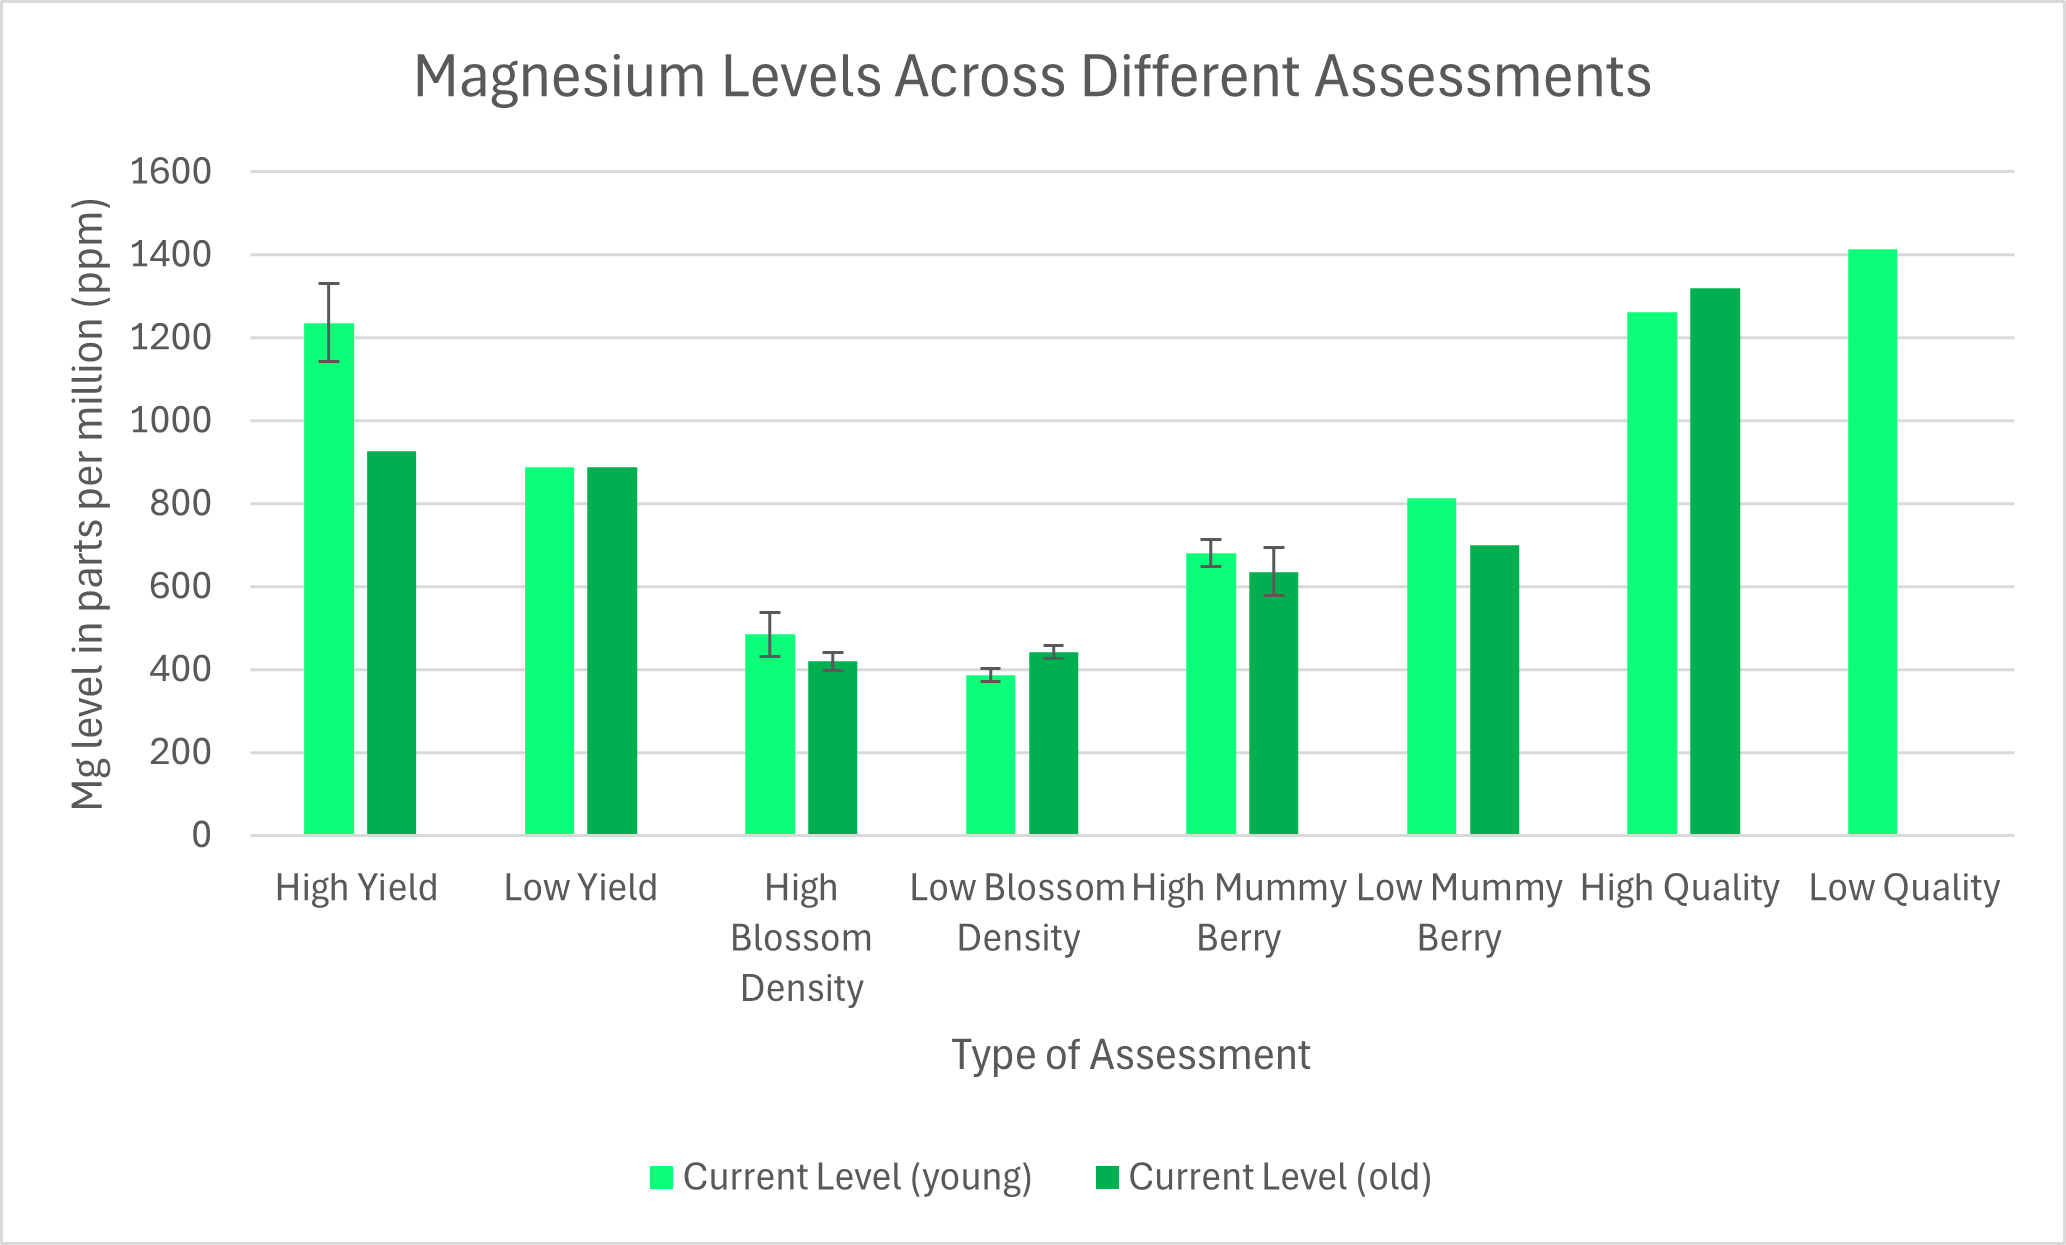
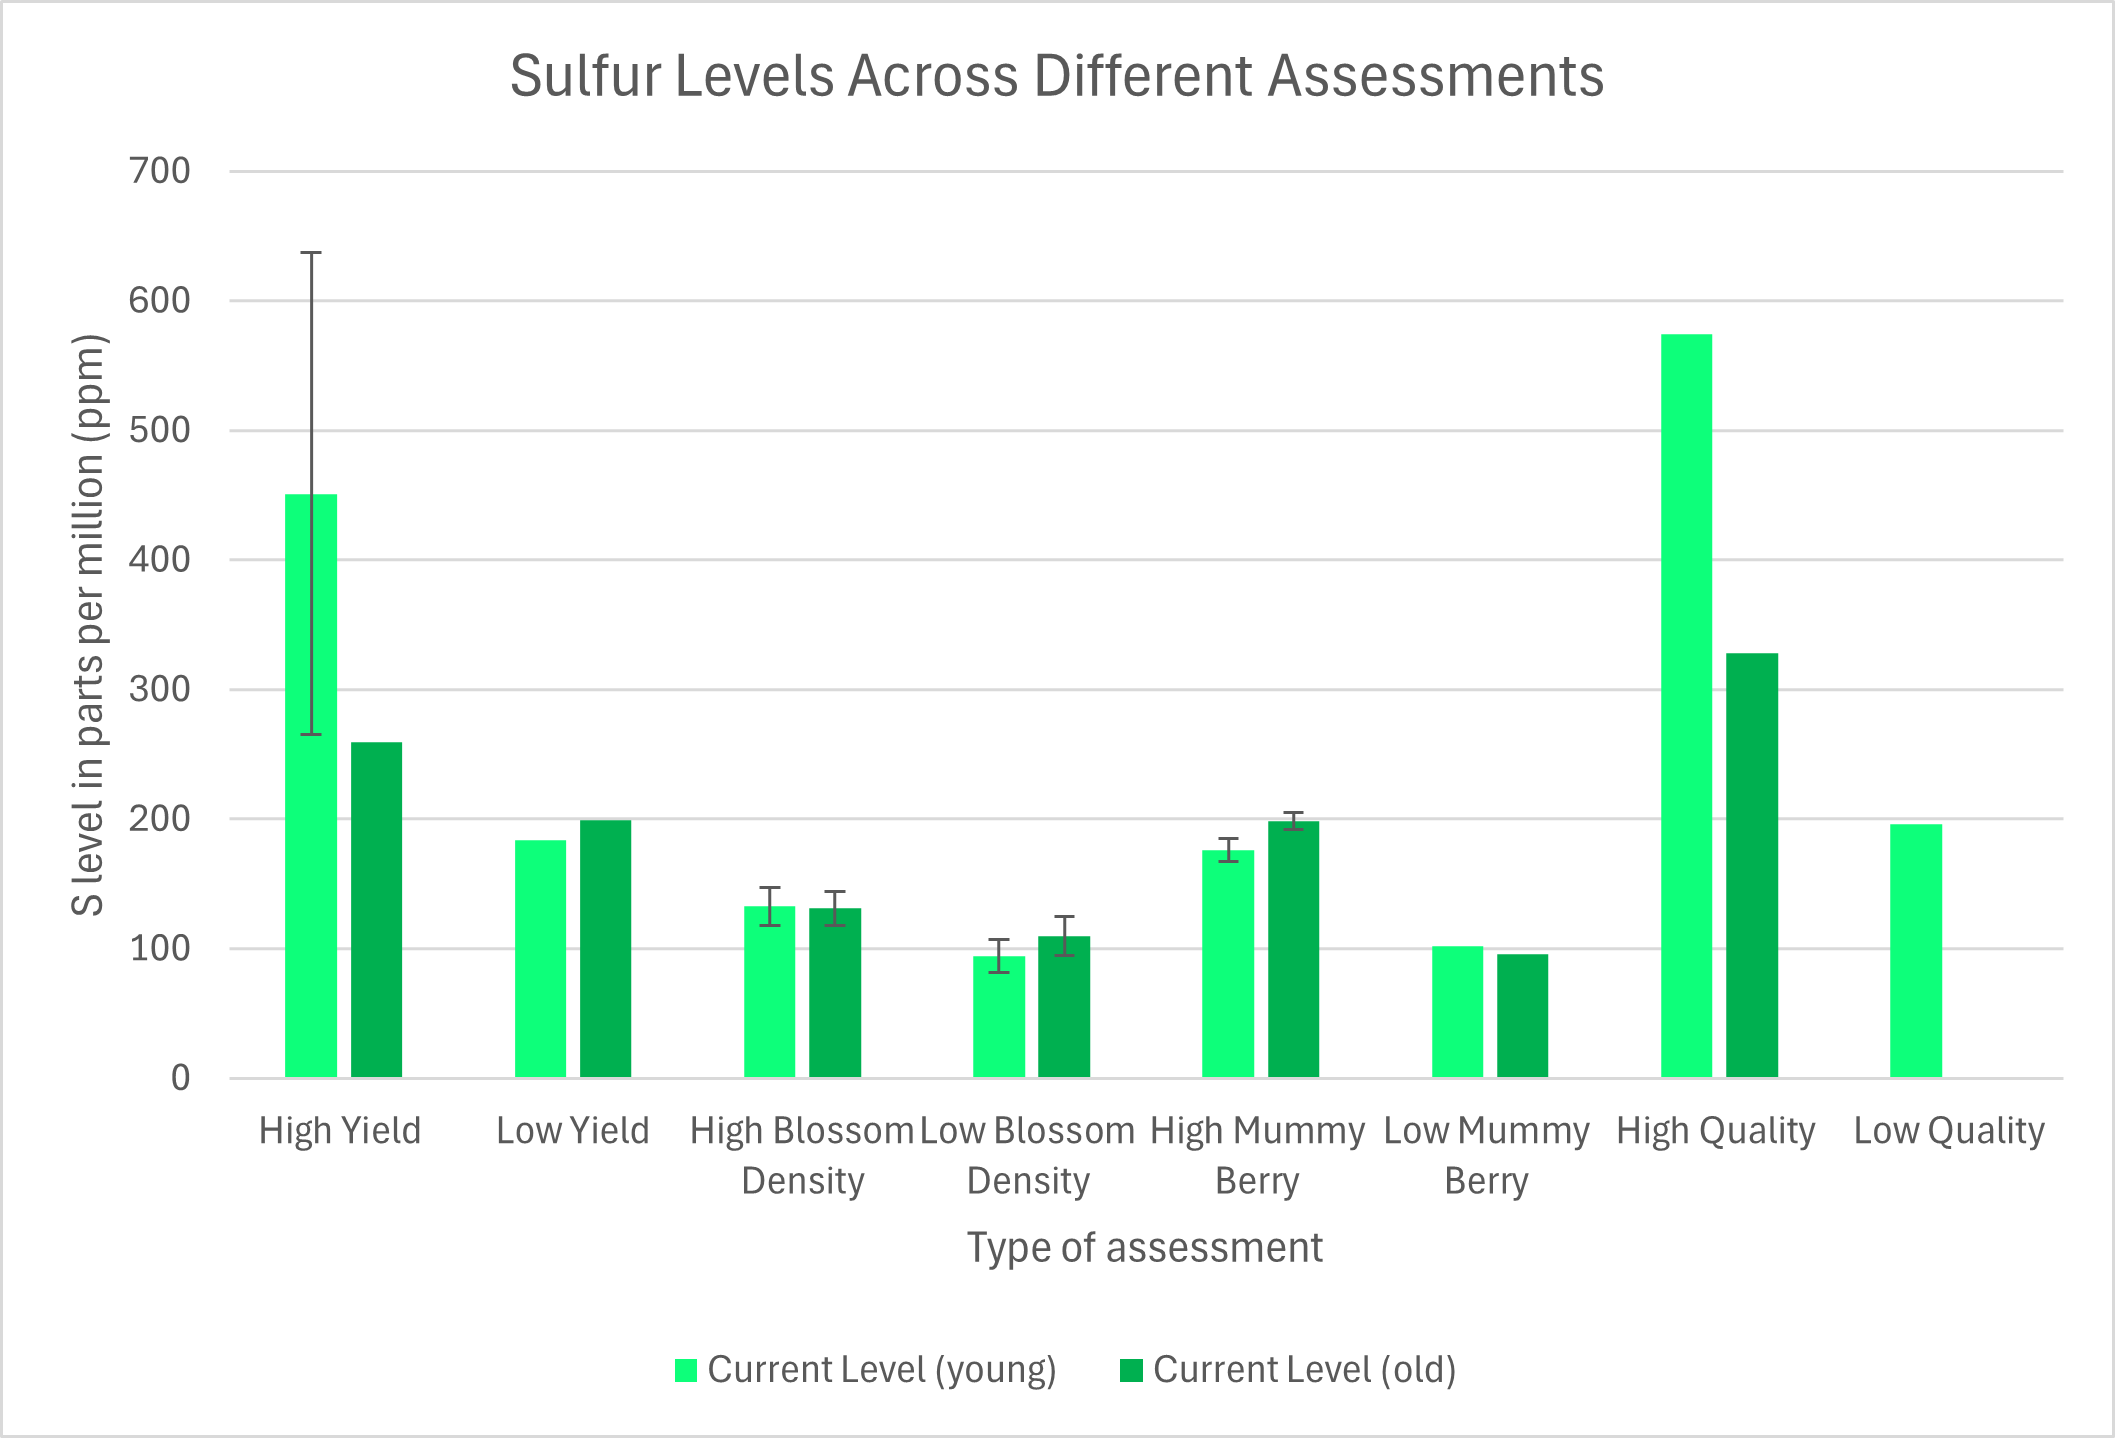
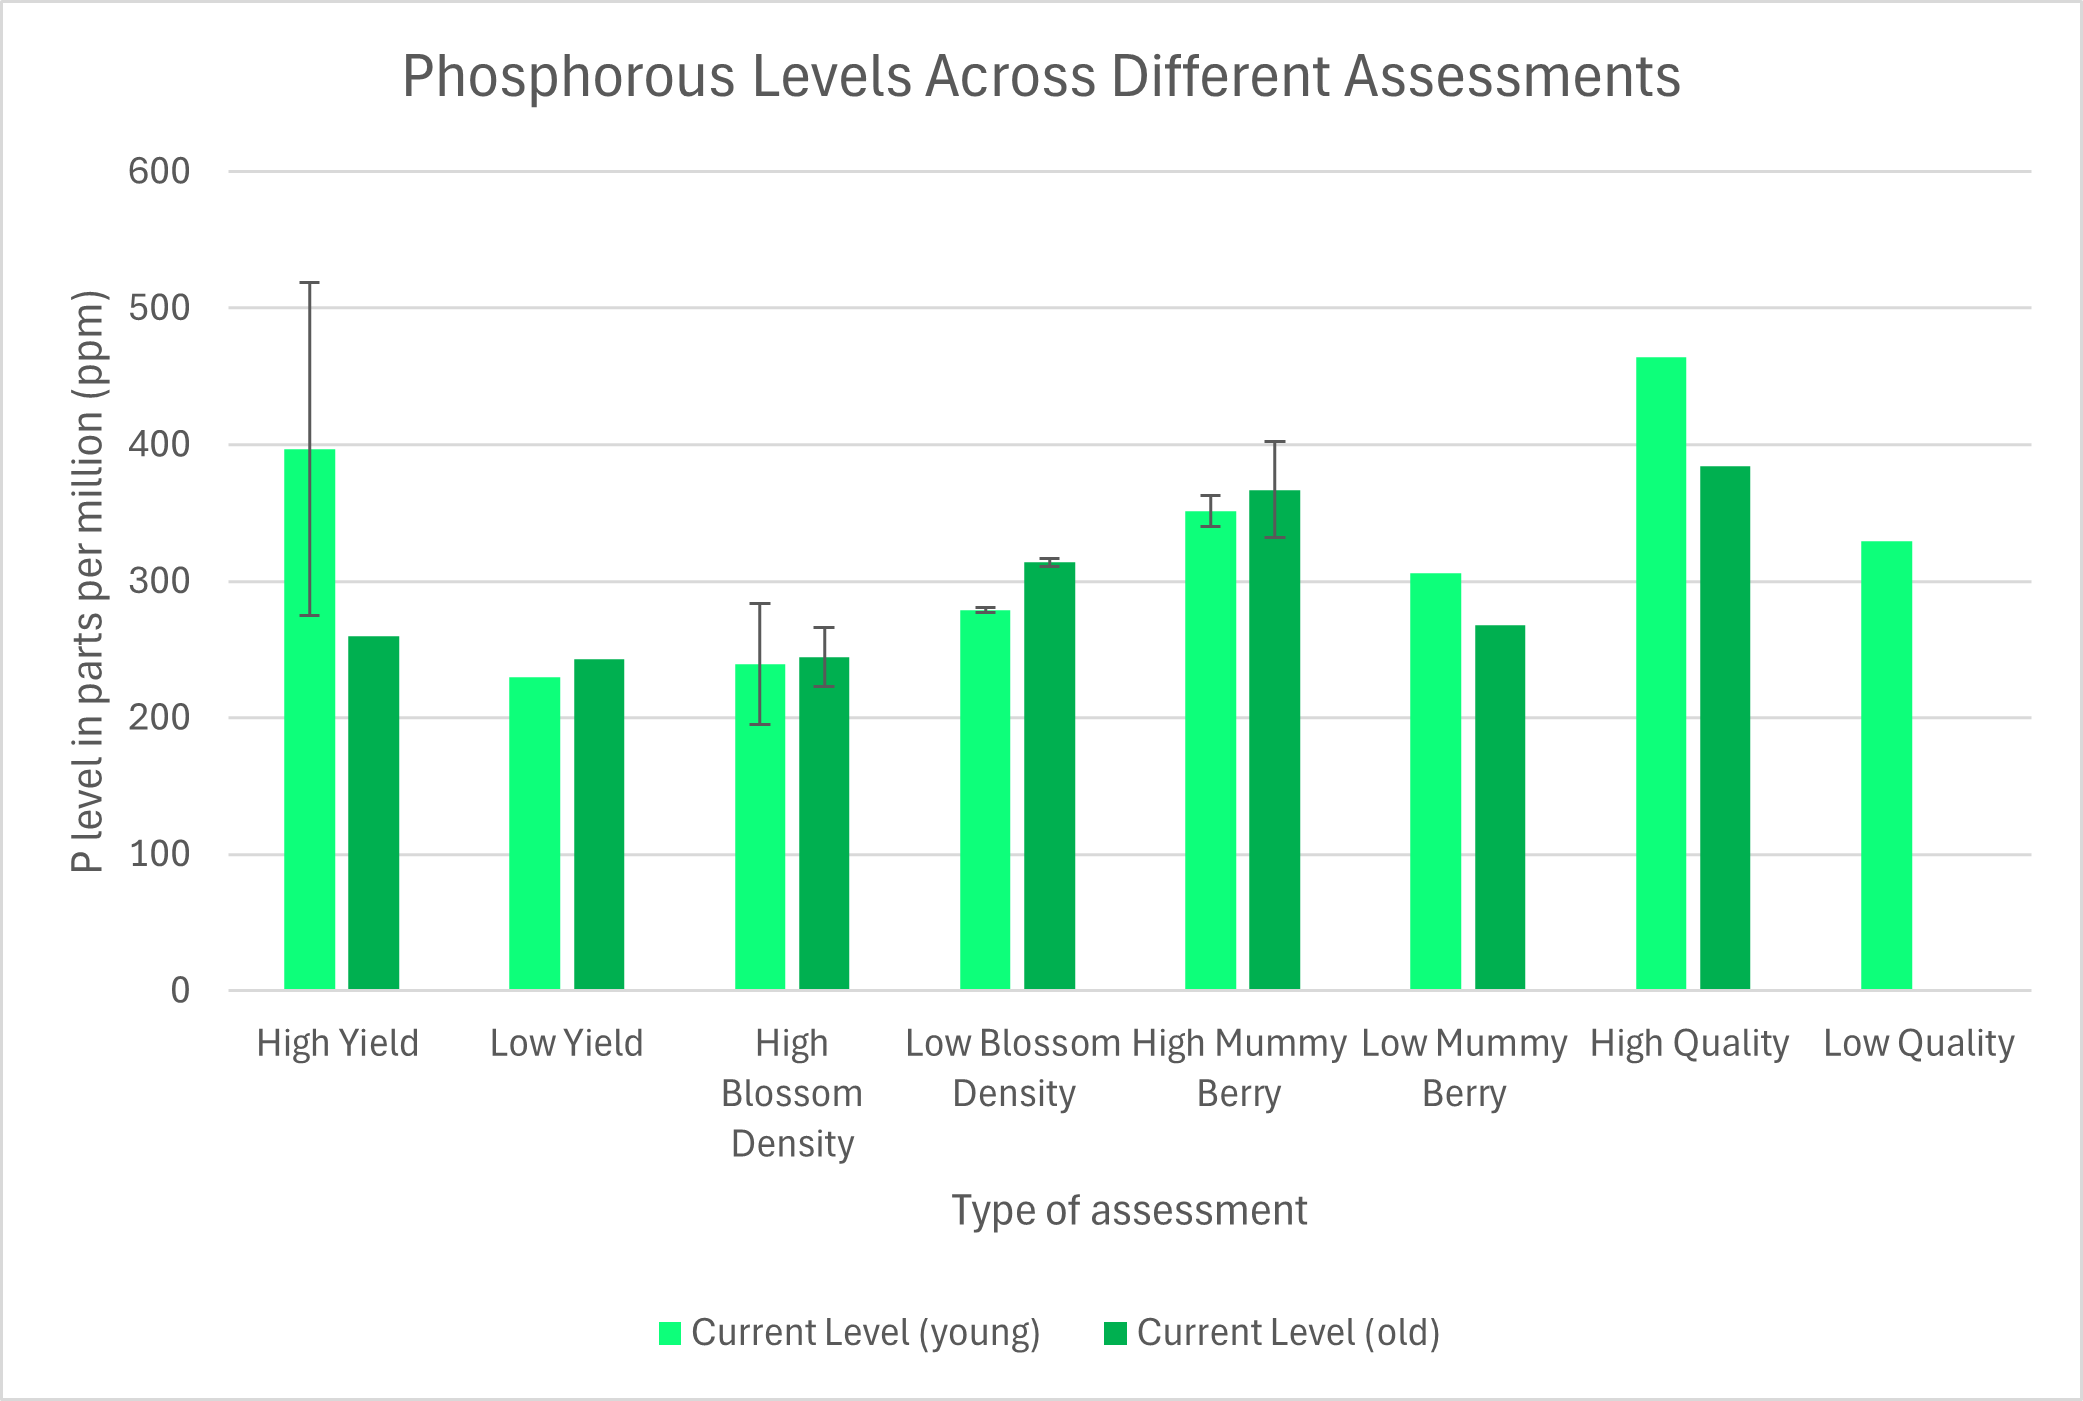
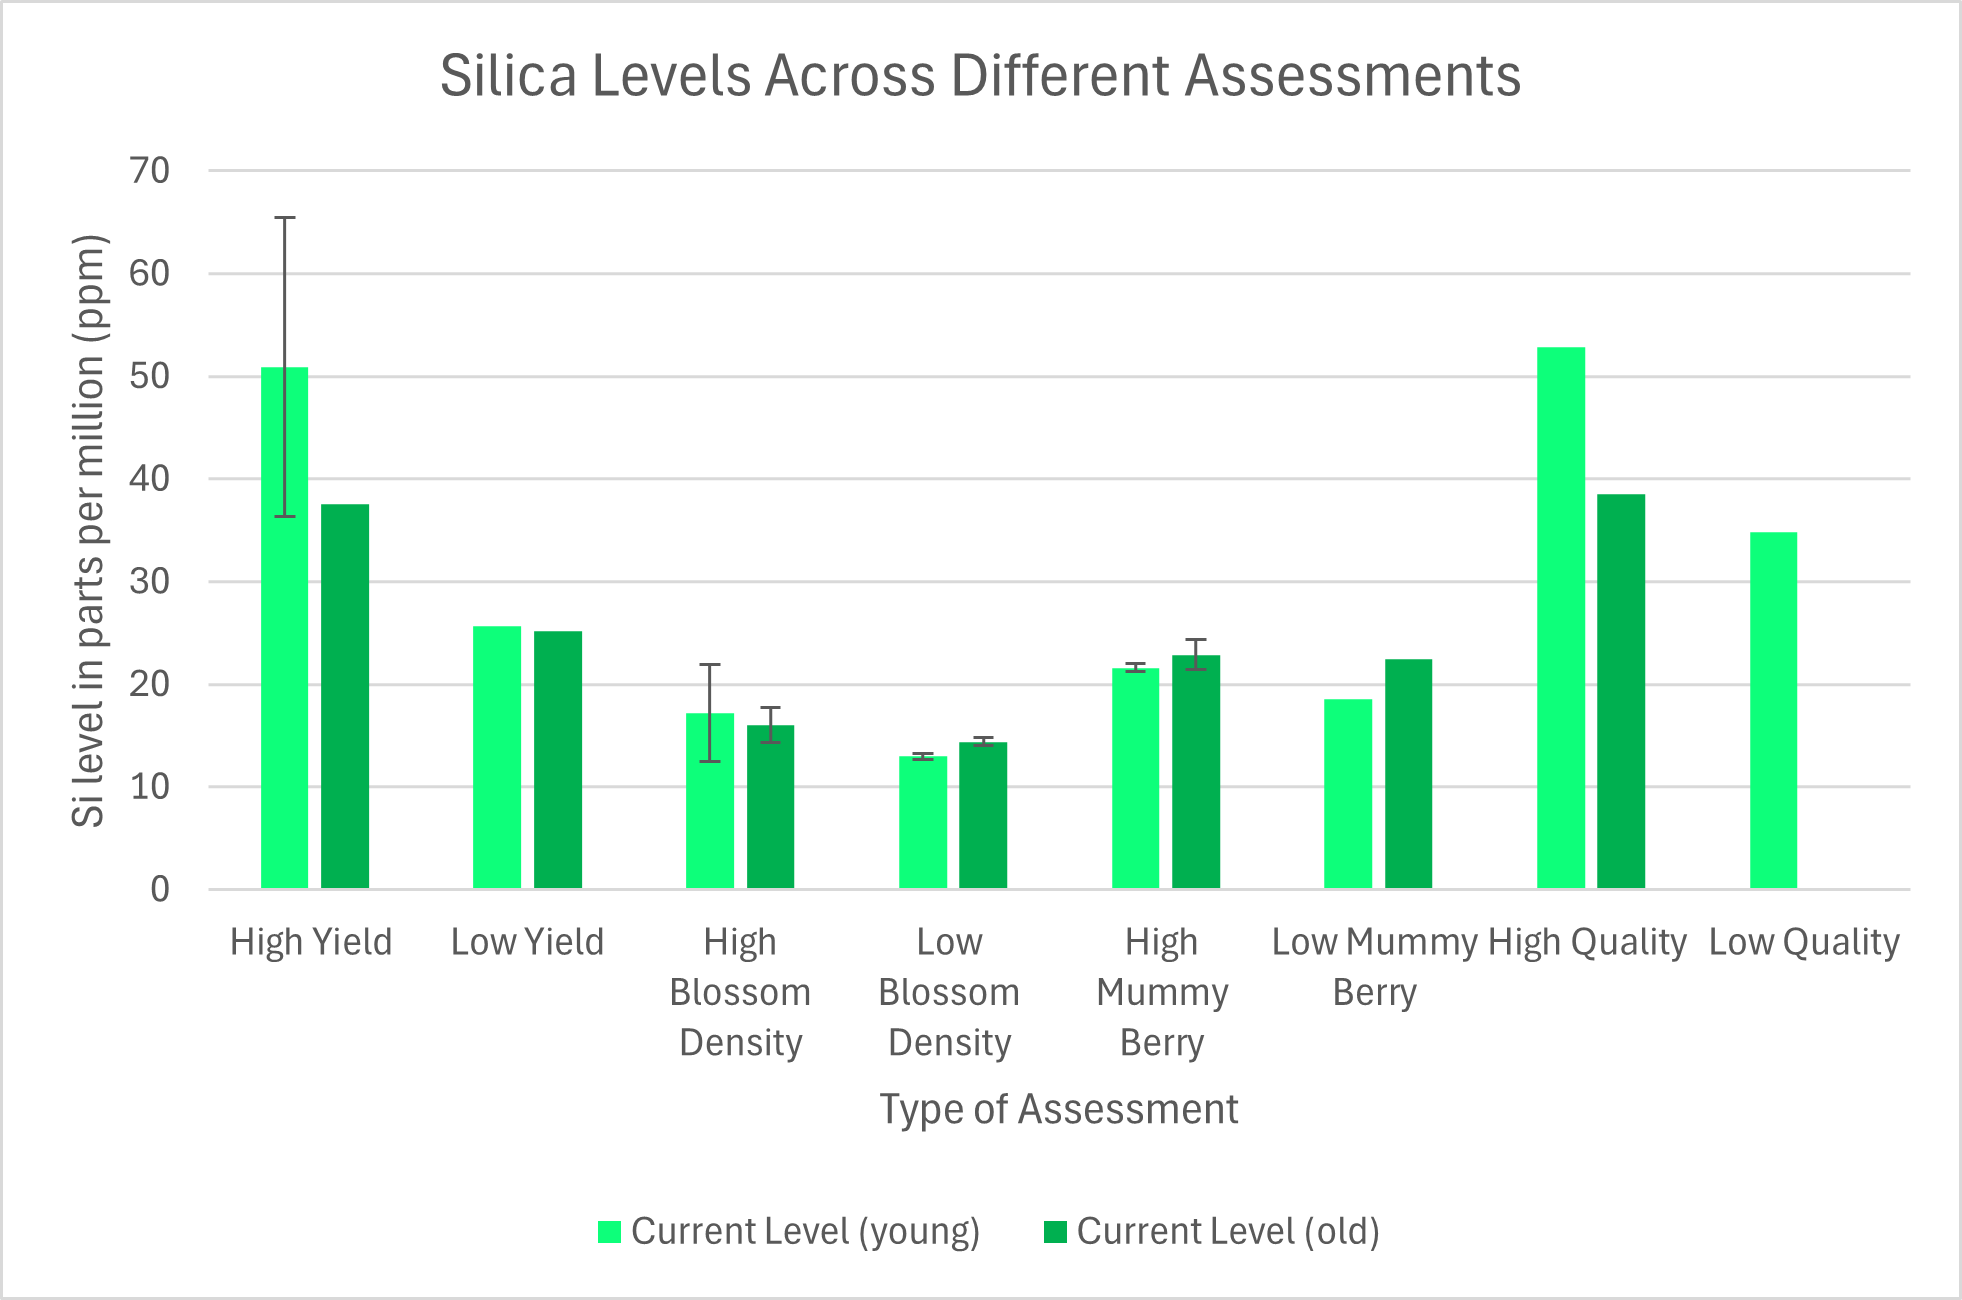
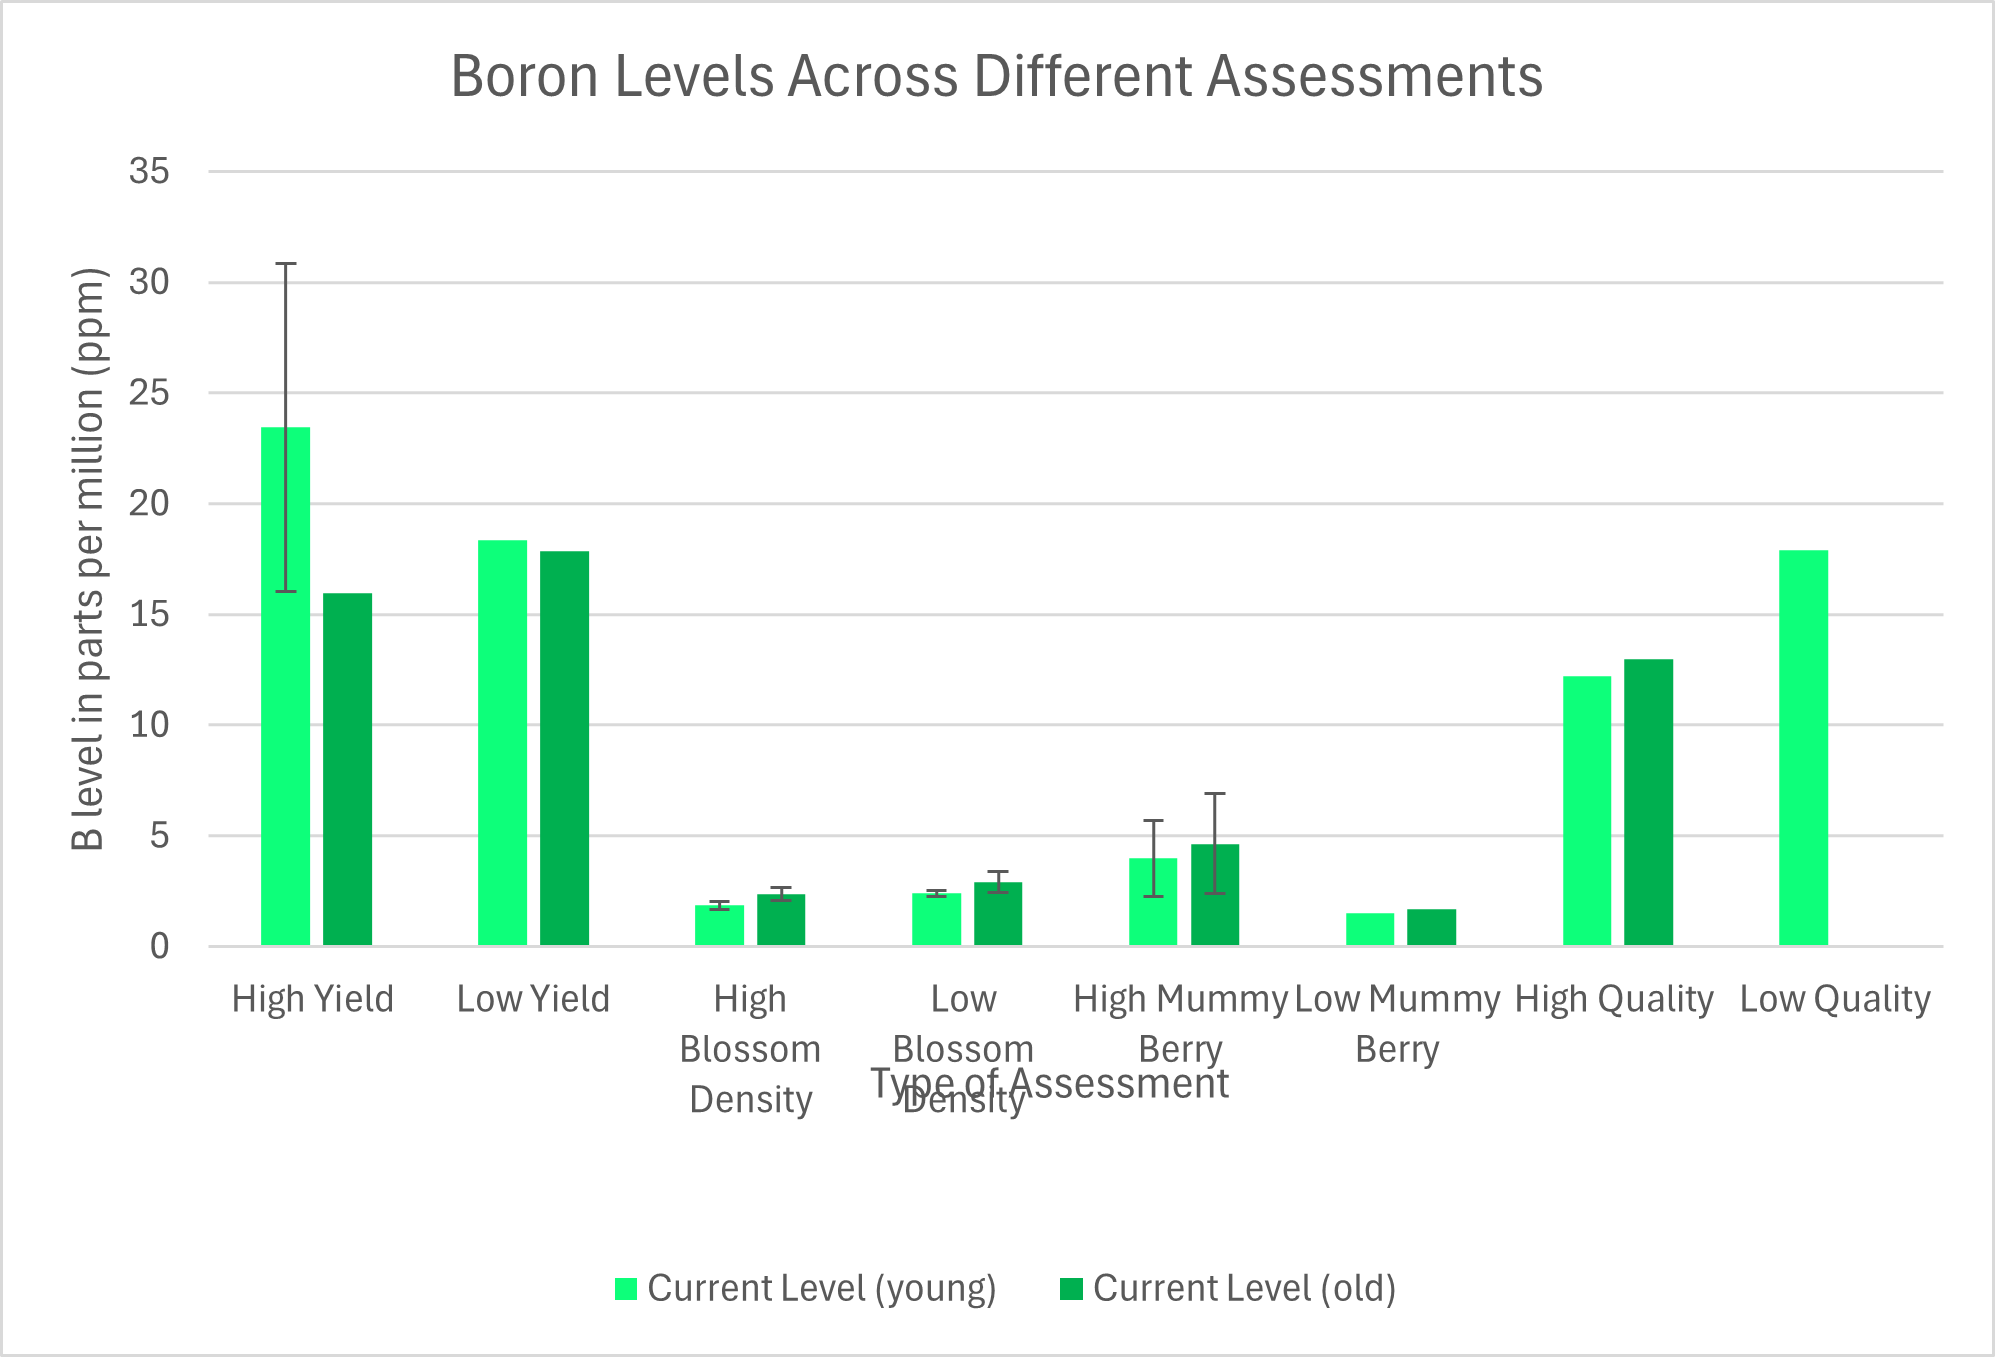
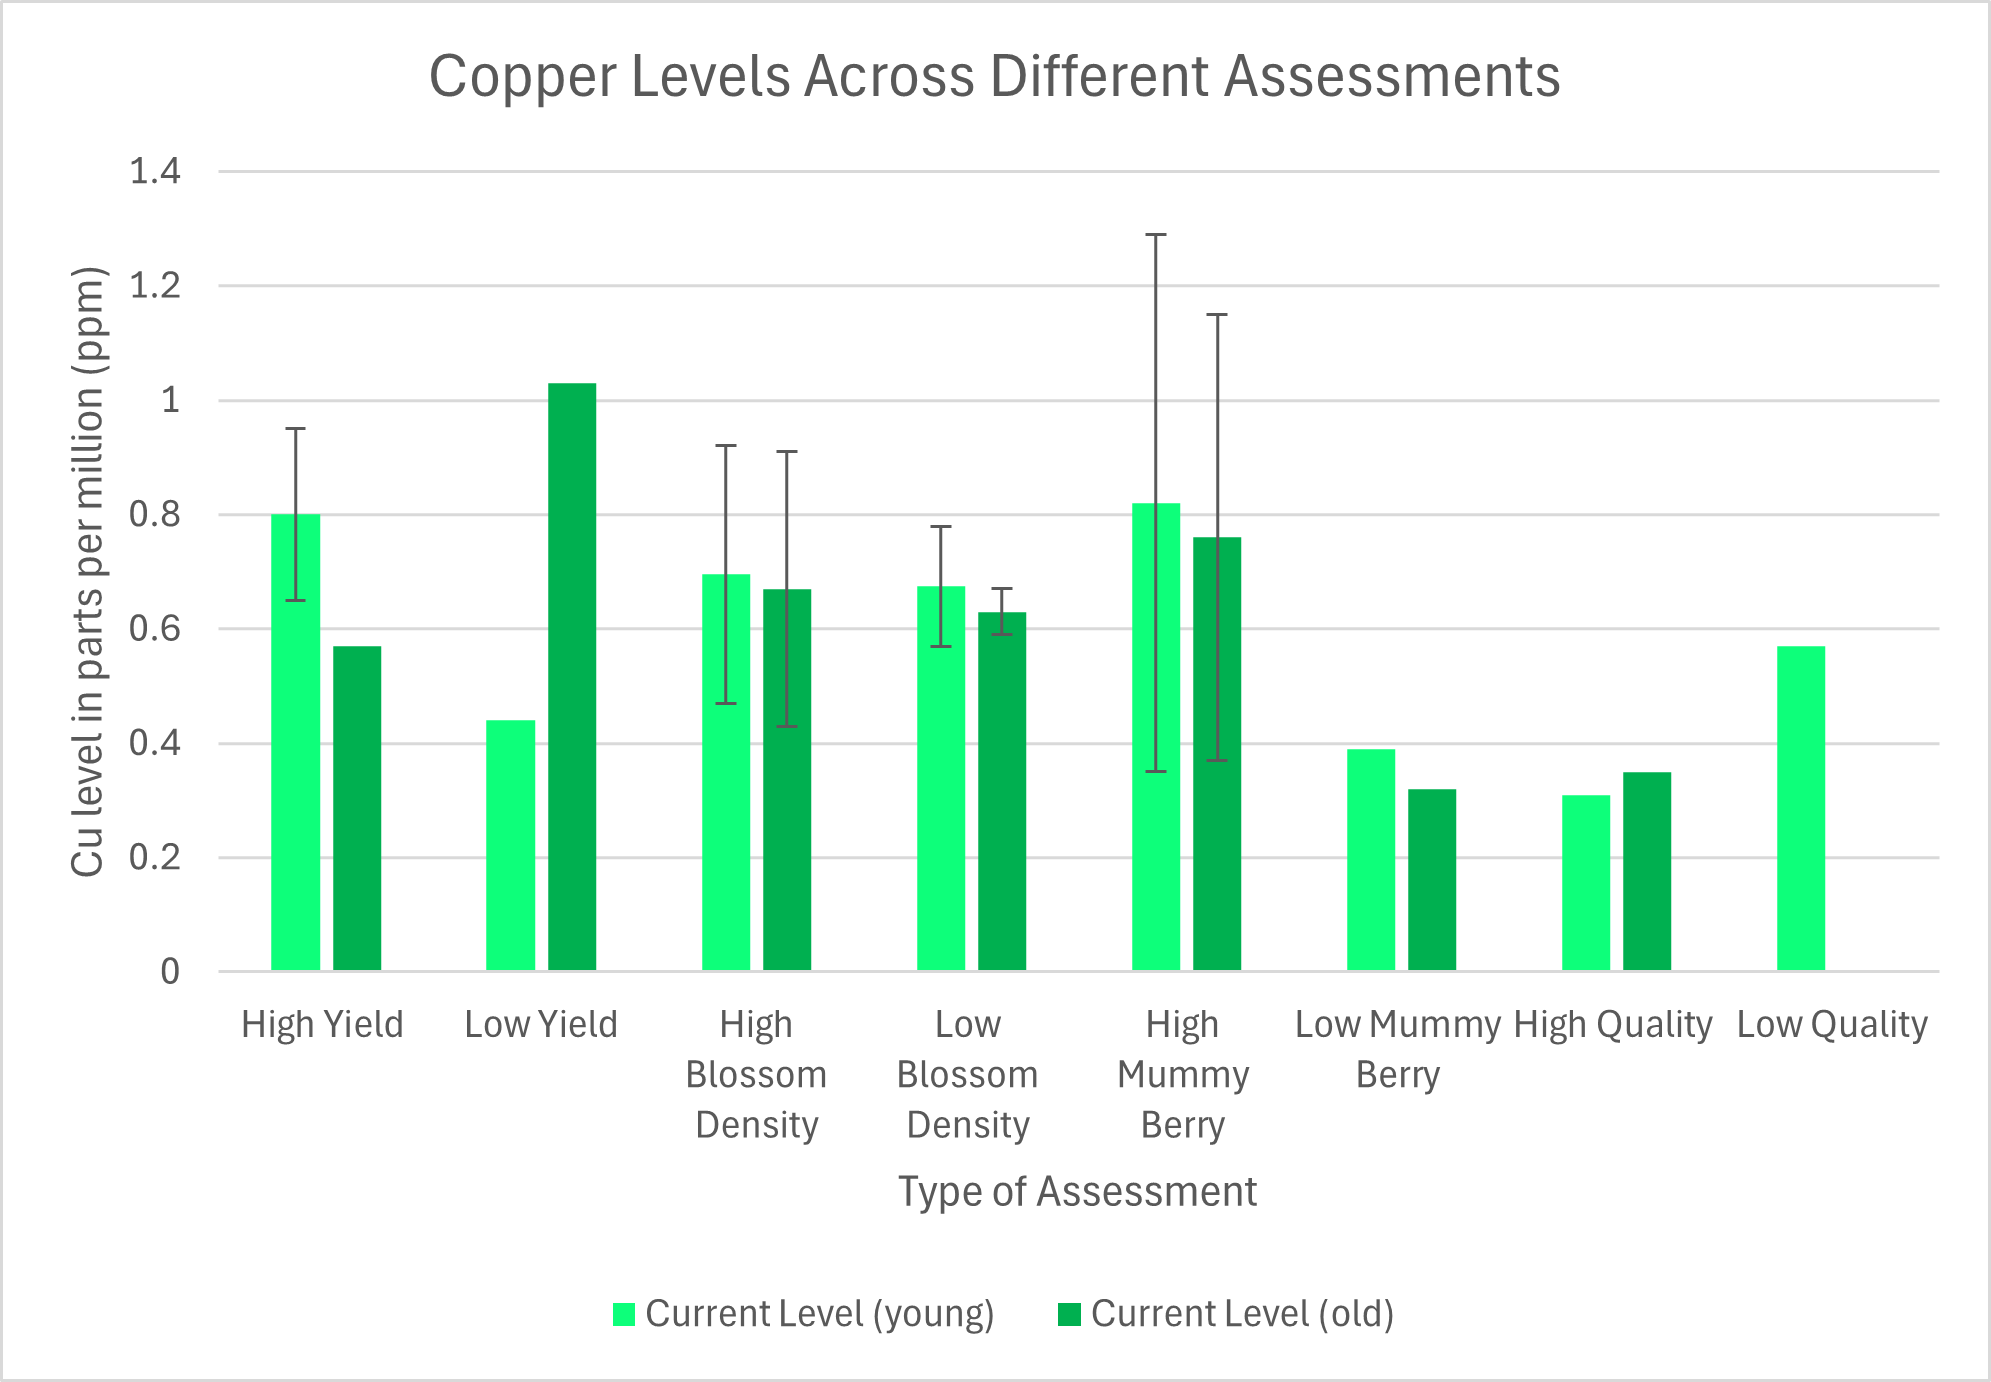
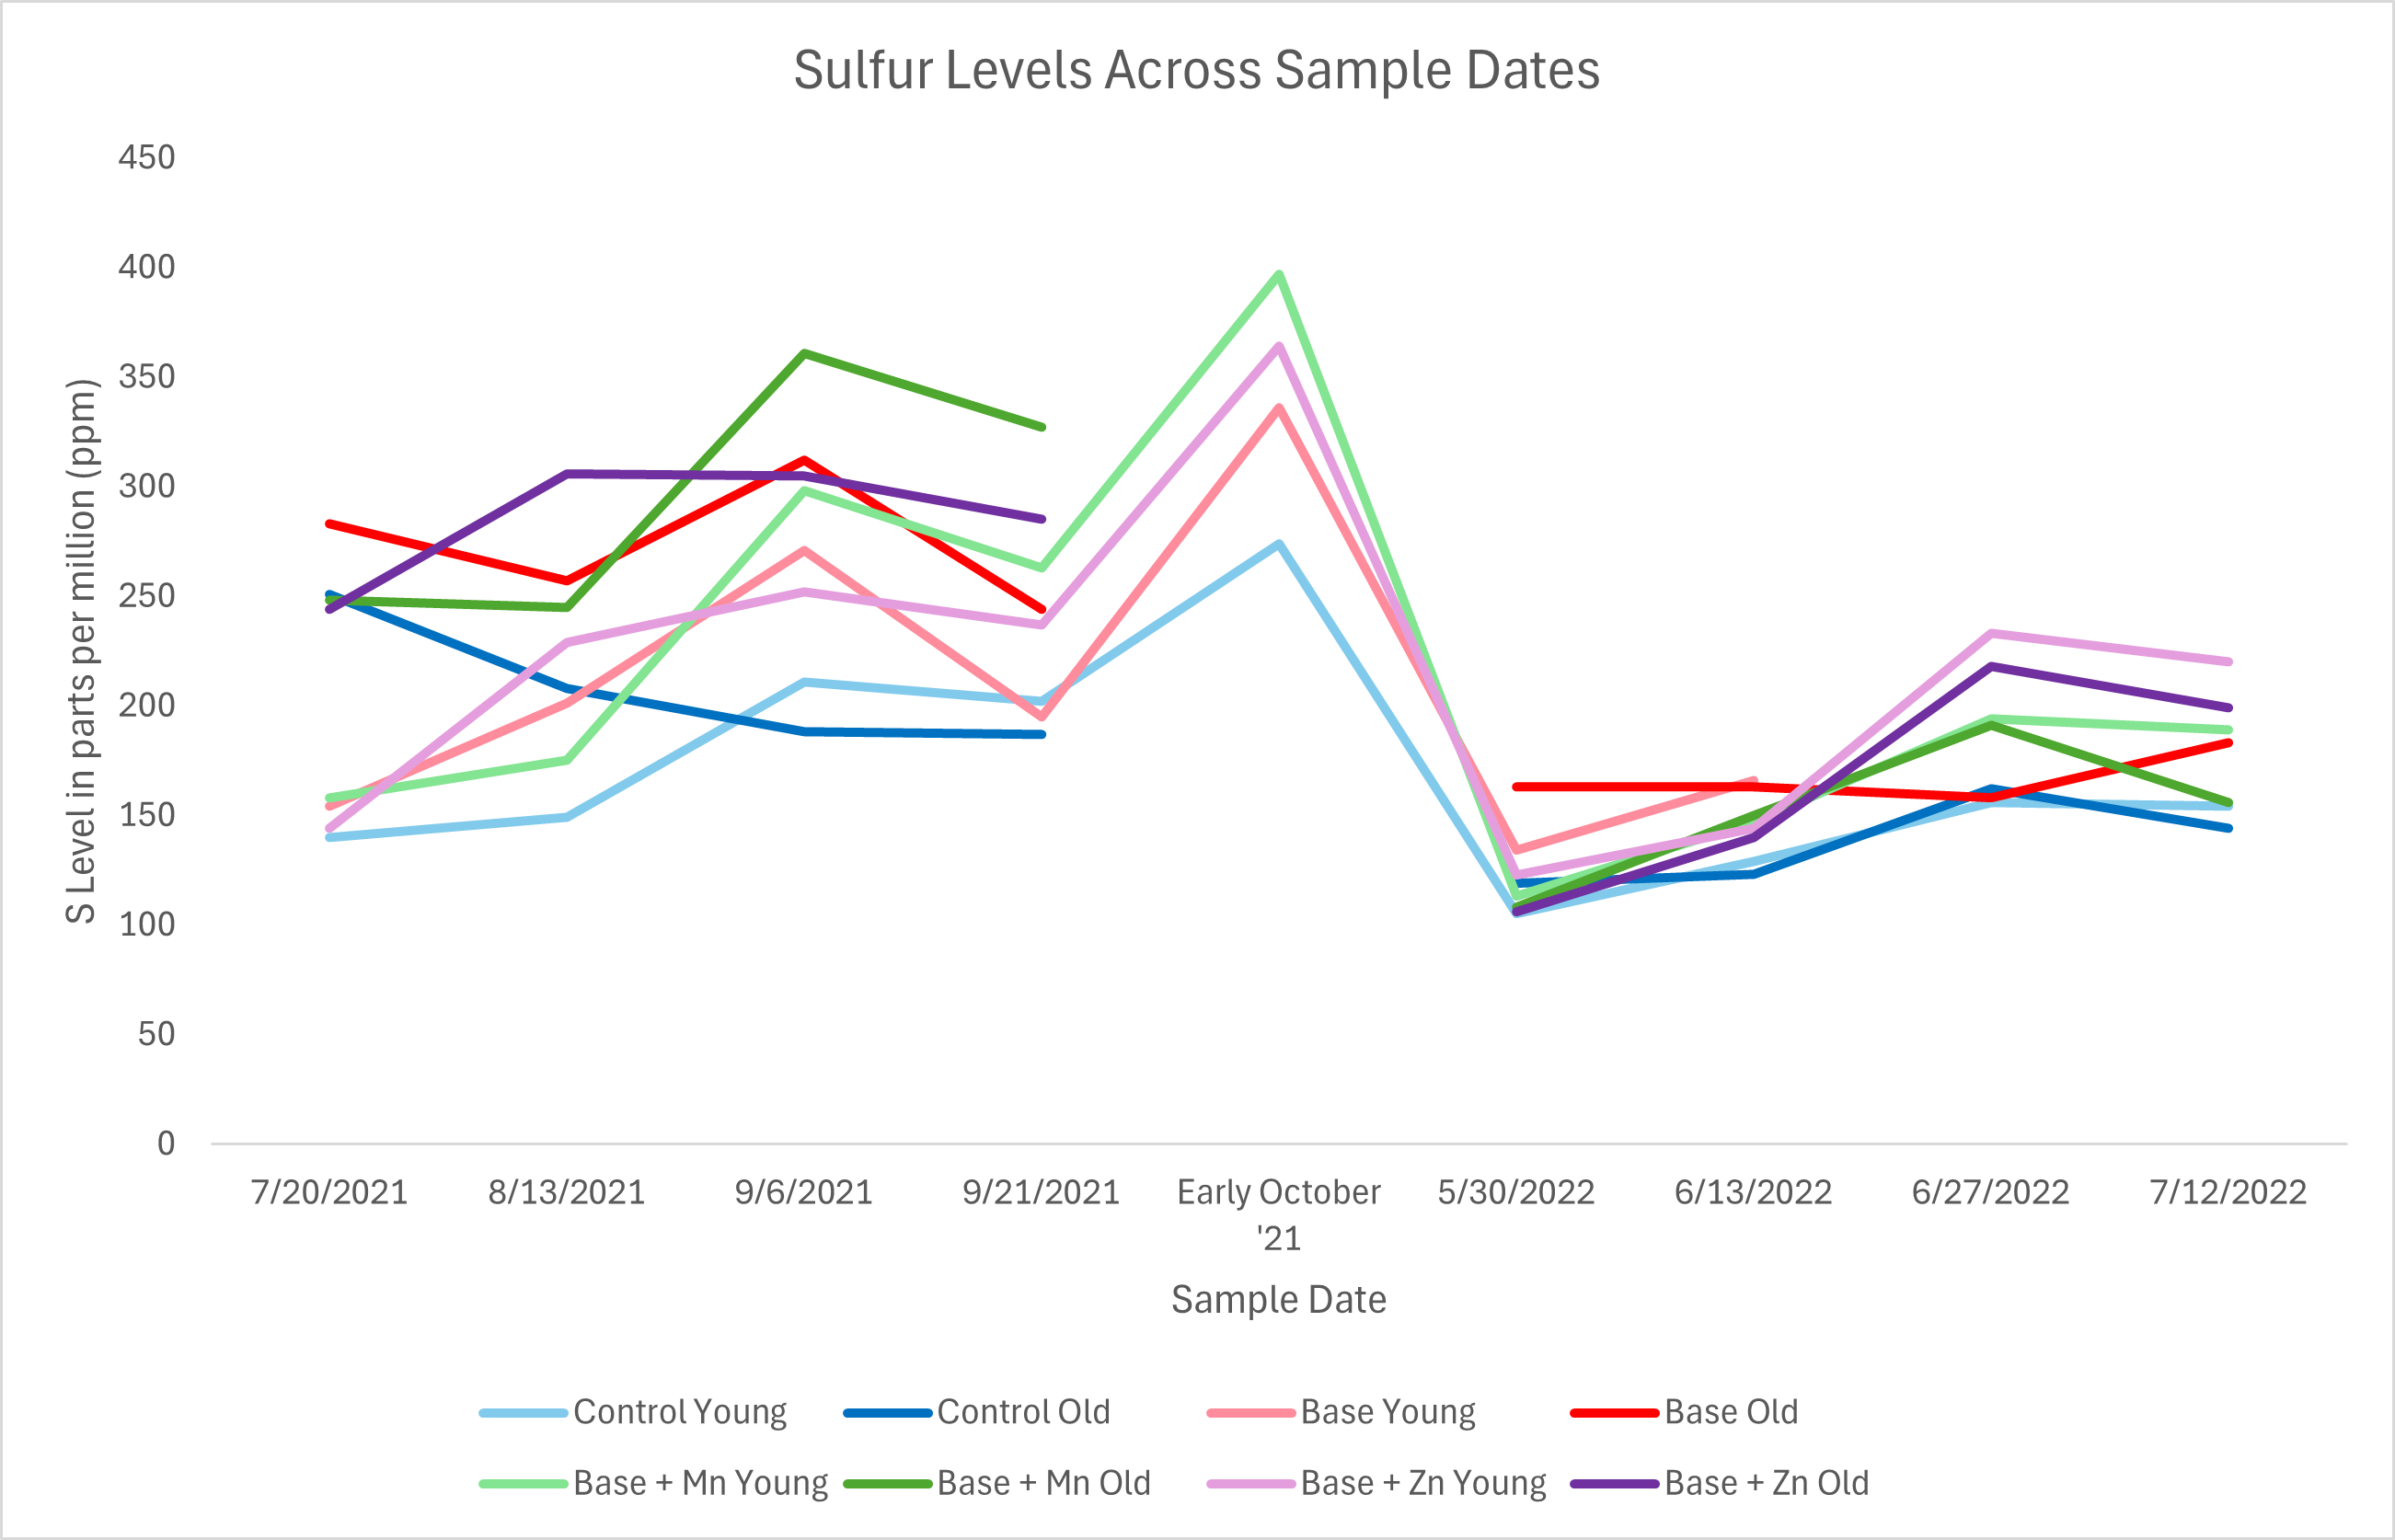
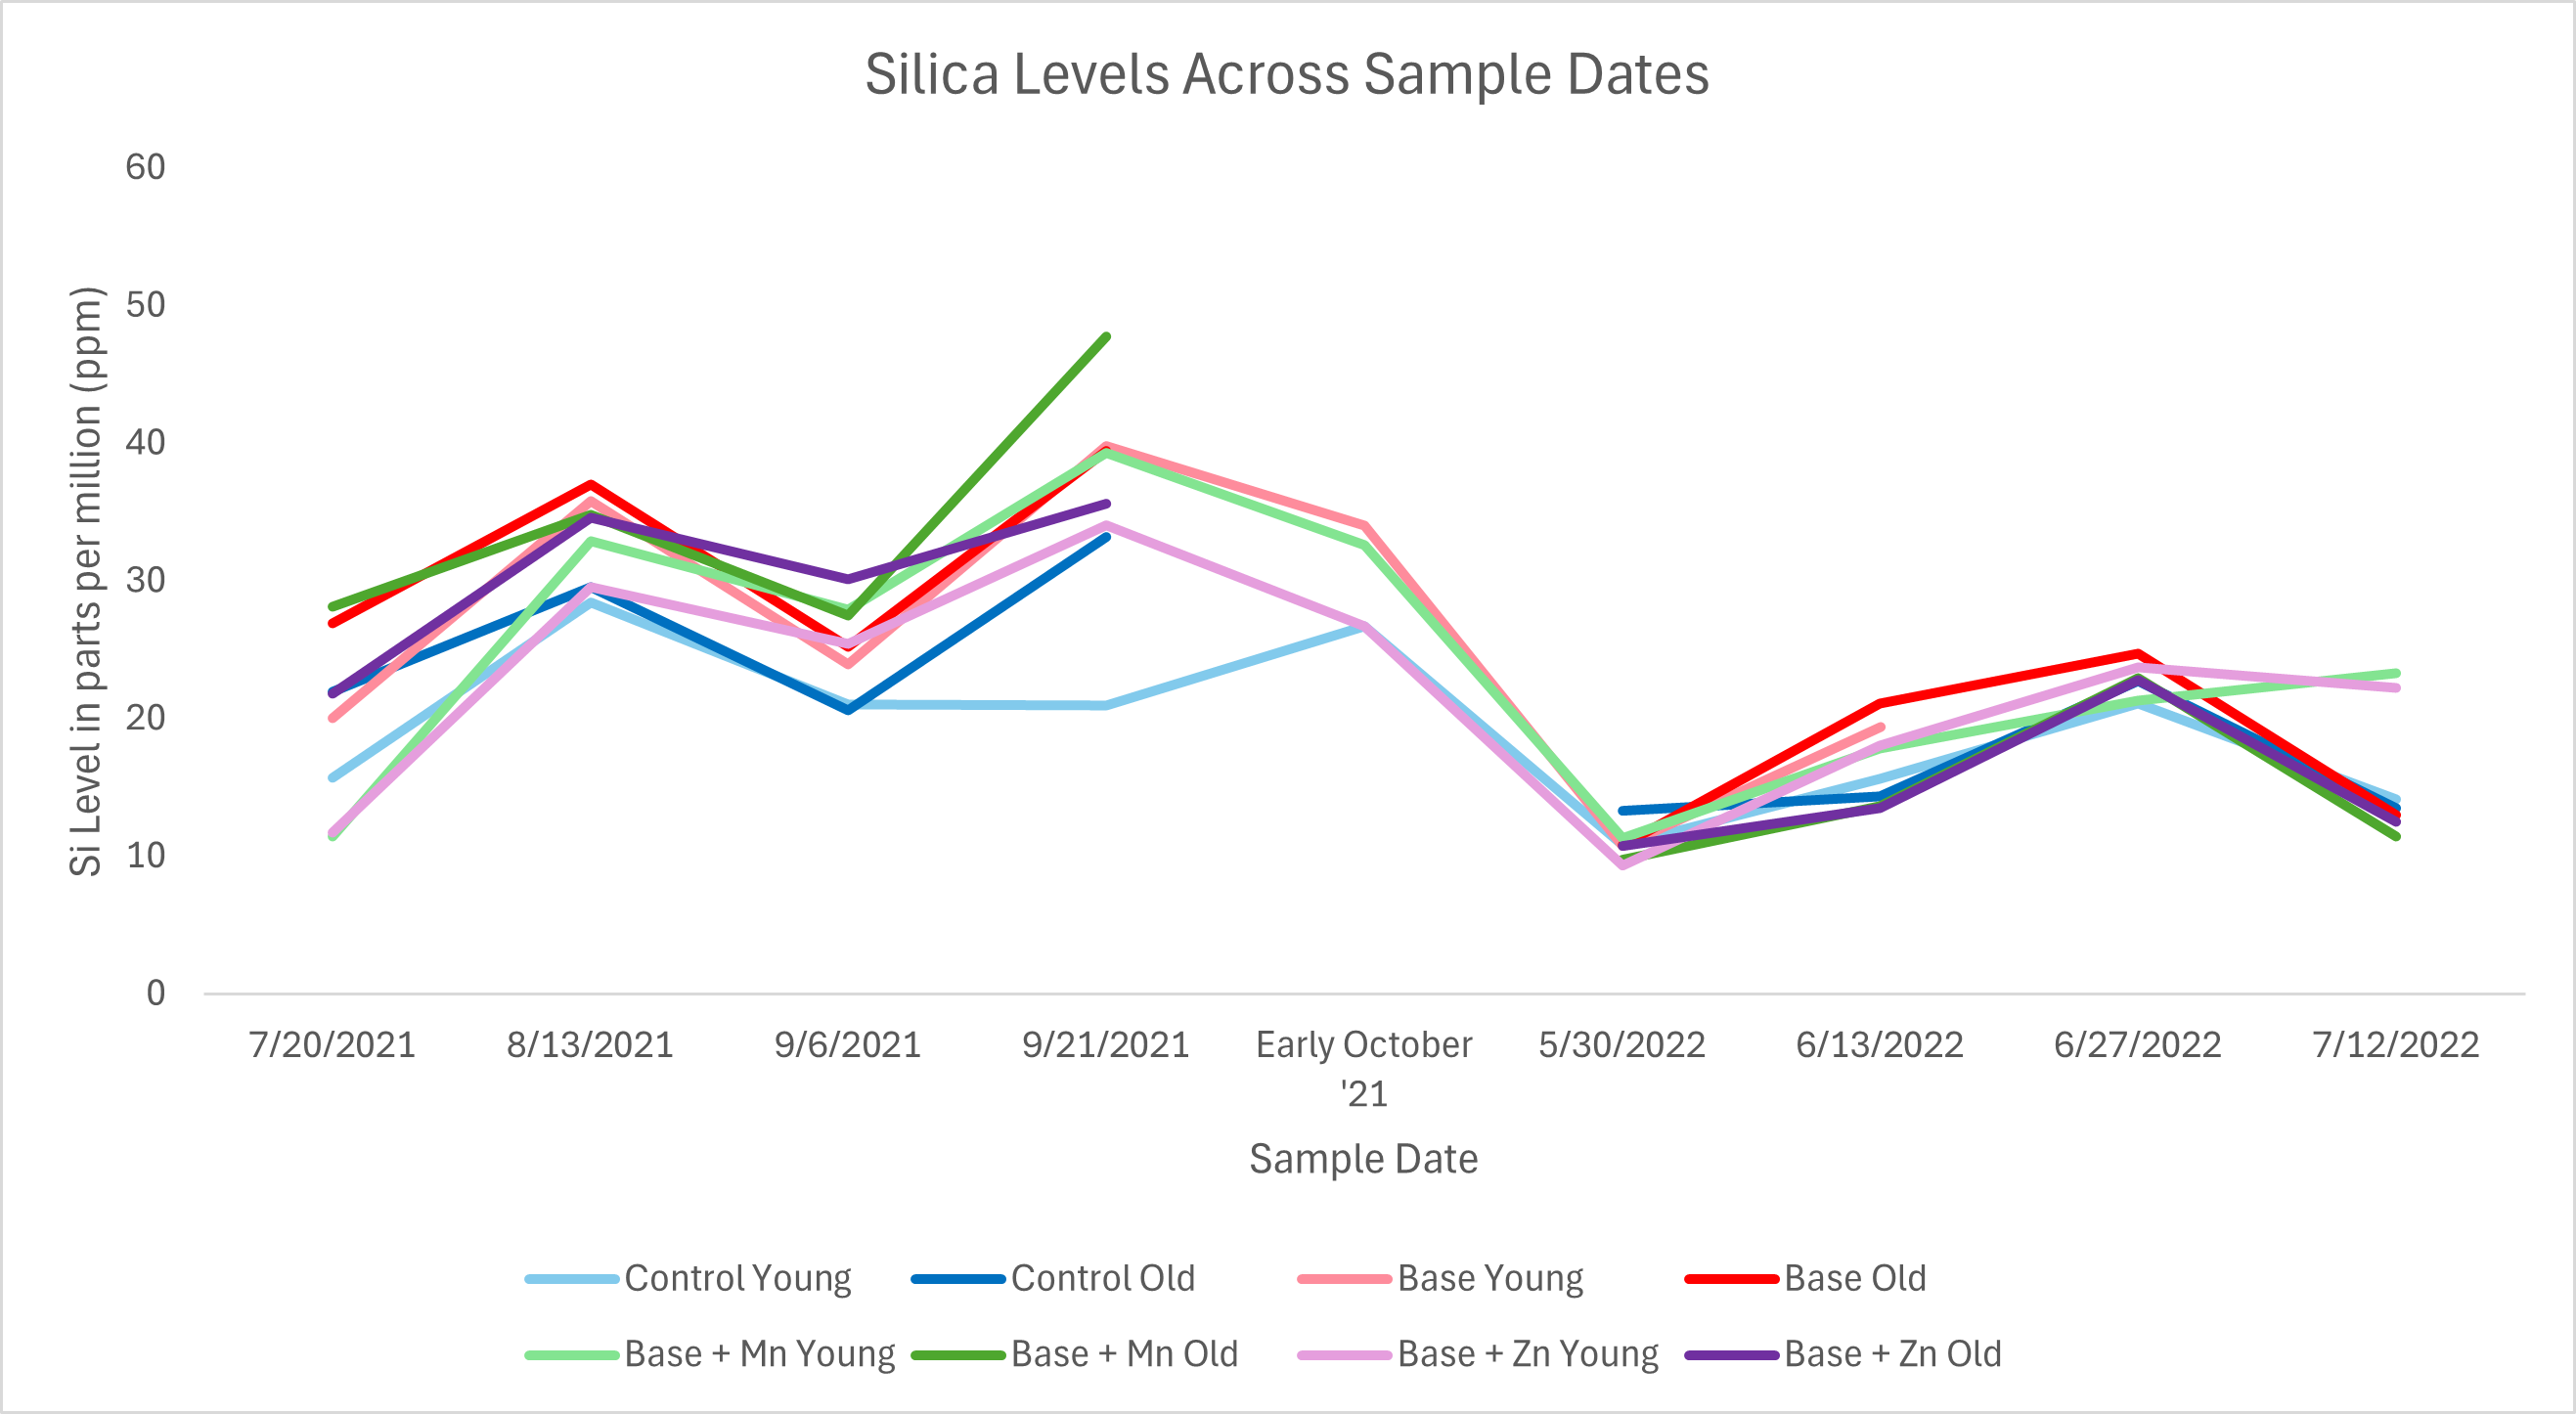
Larger differences in nutrient levels were found between very high yielding and very low yielding plants. Potassium levels in high yielding plants were 50% higher than in low yielding plants. Calcium levels were 120% higher, magnesium levels were 40% higher, nitrogen levels were 96% higher, sulfur levels were 158% higher, phosphorus levels were 72% higher, silica levels were 98% higher, manganese levels were 61% higher, and zinc levels were 58% higher. Iron, boron, and copper levels were all similar between the high and low yielding plants.
Plants with high quality berries showed higher potassium, nitrogen, calcium, manganese, silica, sulfur, and phosphorous.
If the mummy berry data is discounted due to the weather conditions, and only the blossom density, yield and fruit quality sap comparisons are considered, a large overlap between the yield and fruit quality data is found (7 of the 9 minerals that show a large variation for the yield sap test also show a large variation in the fruit quality sap test).
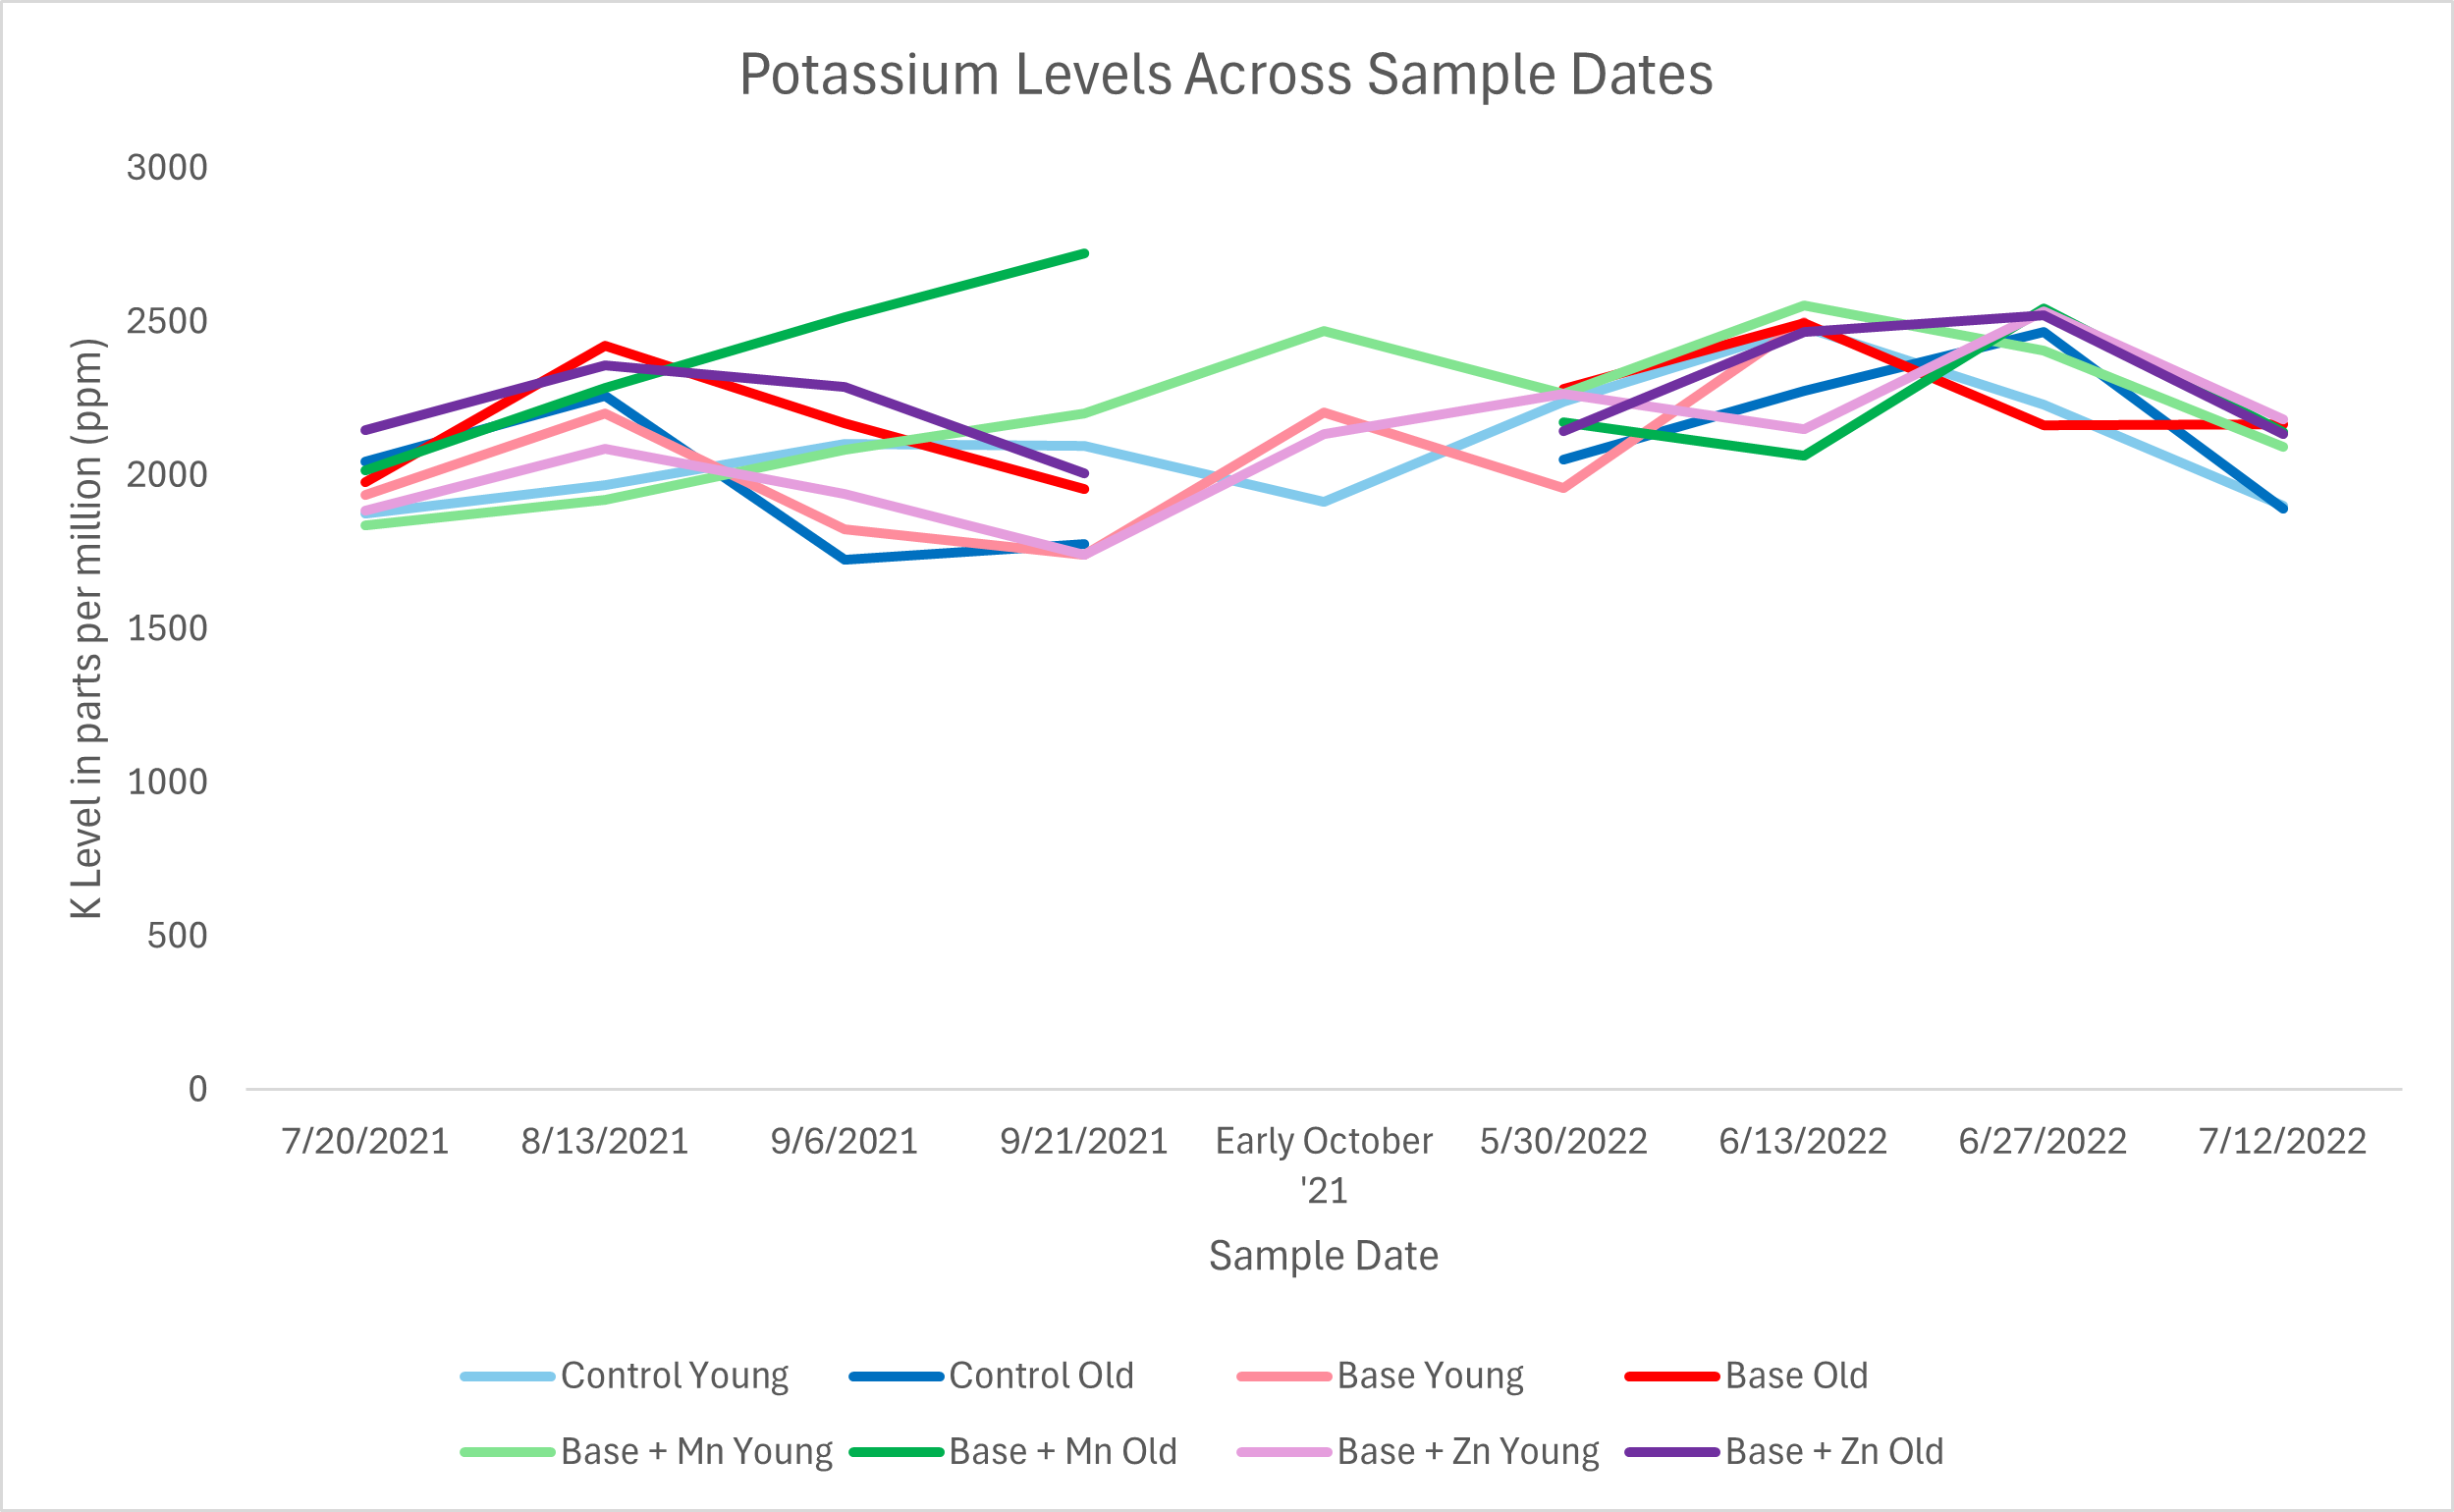
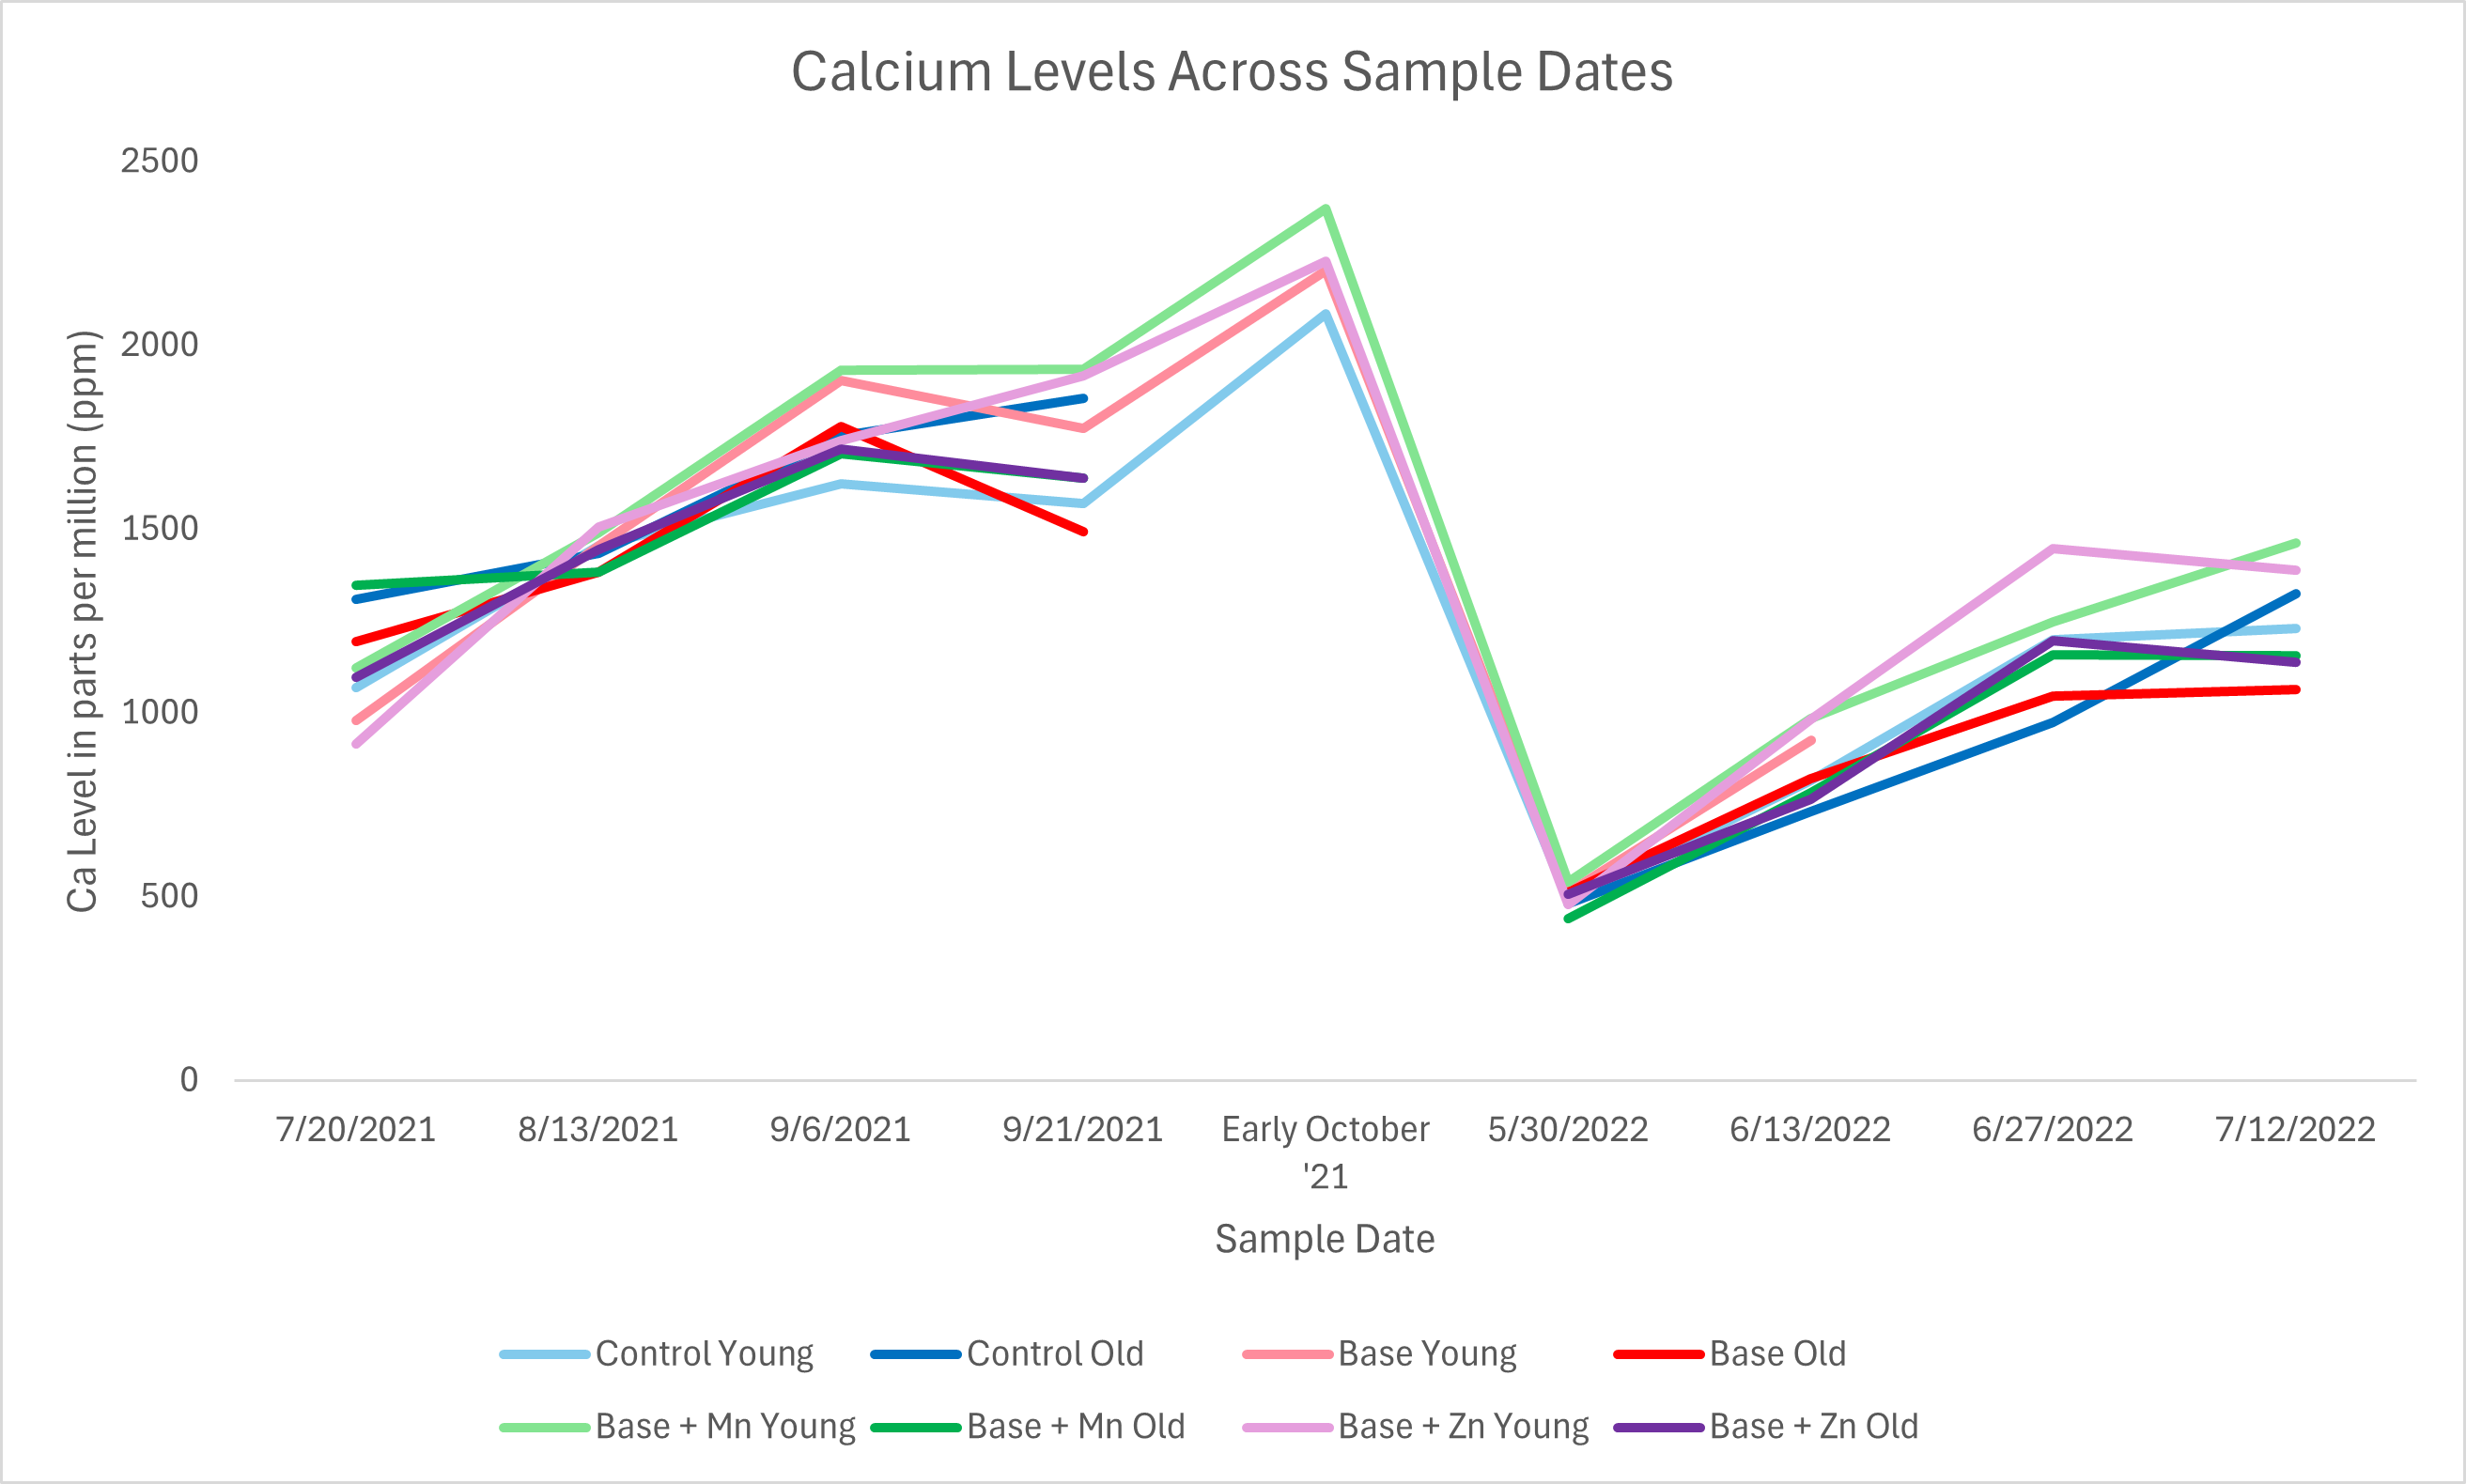
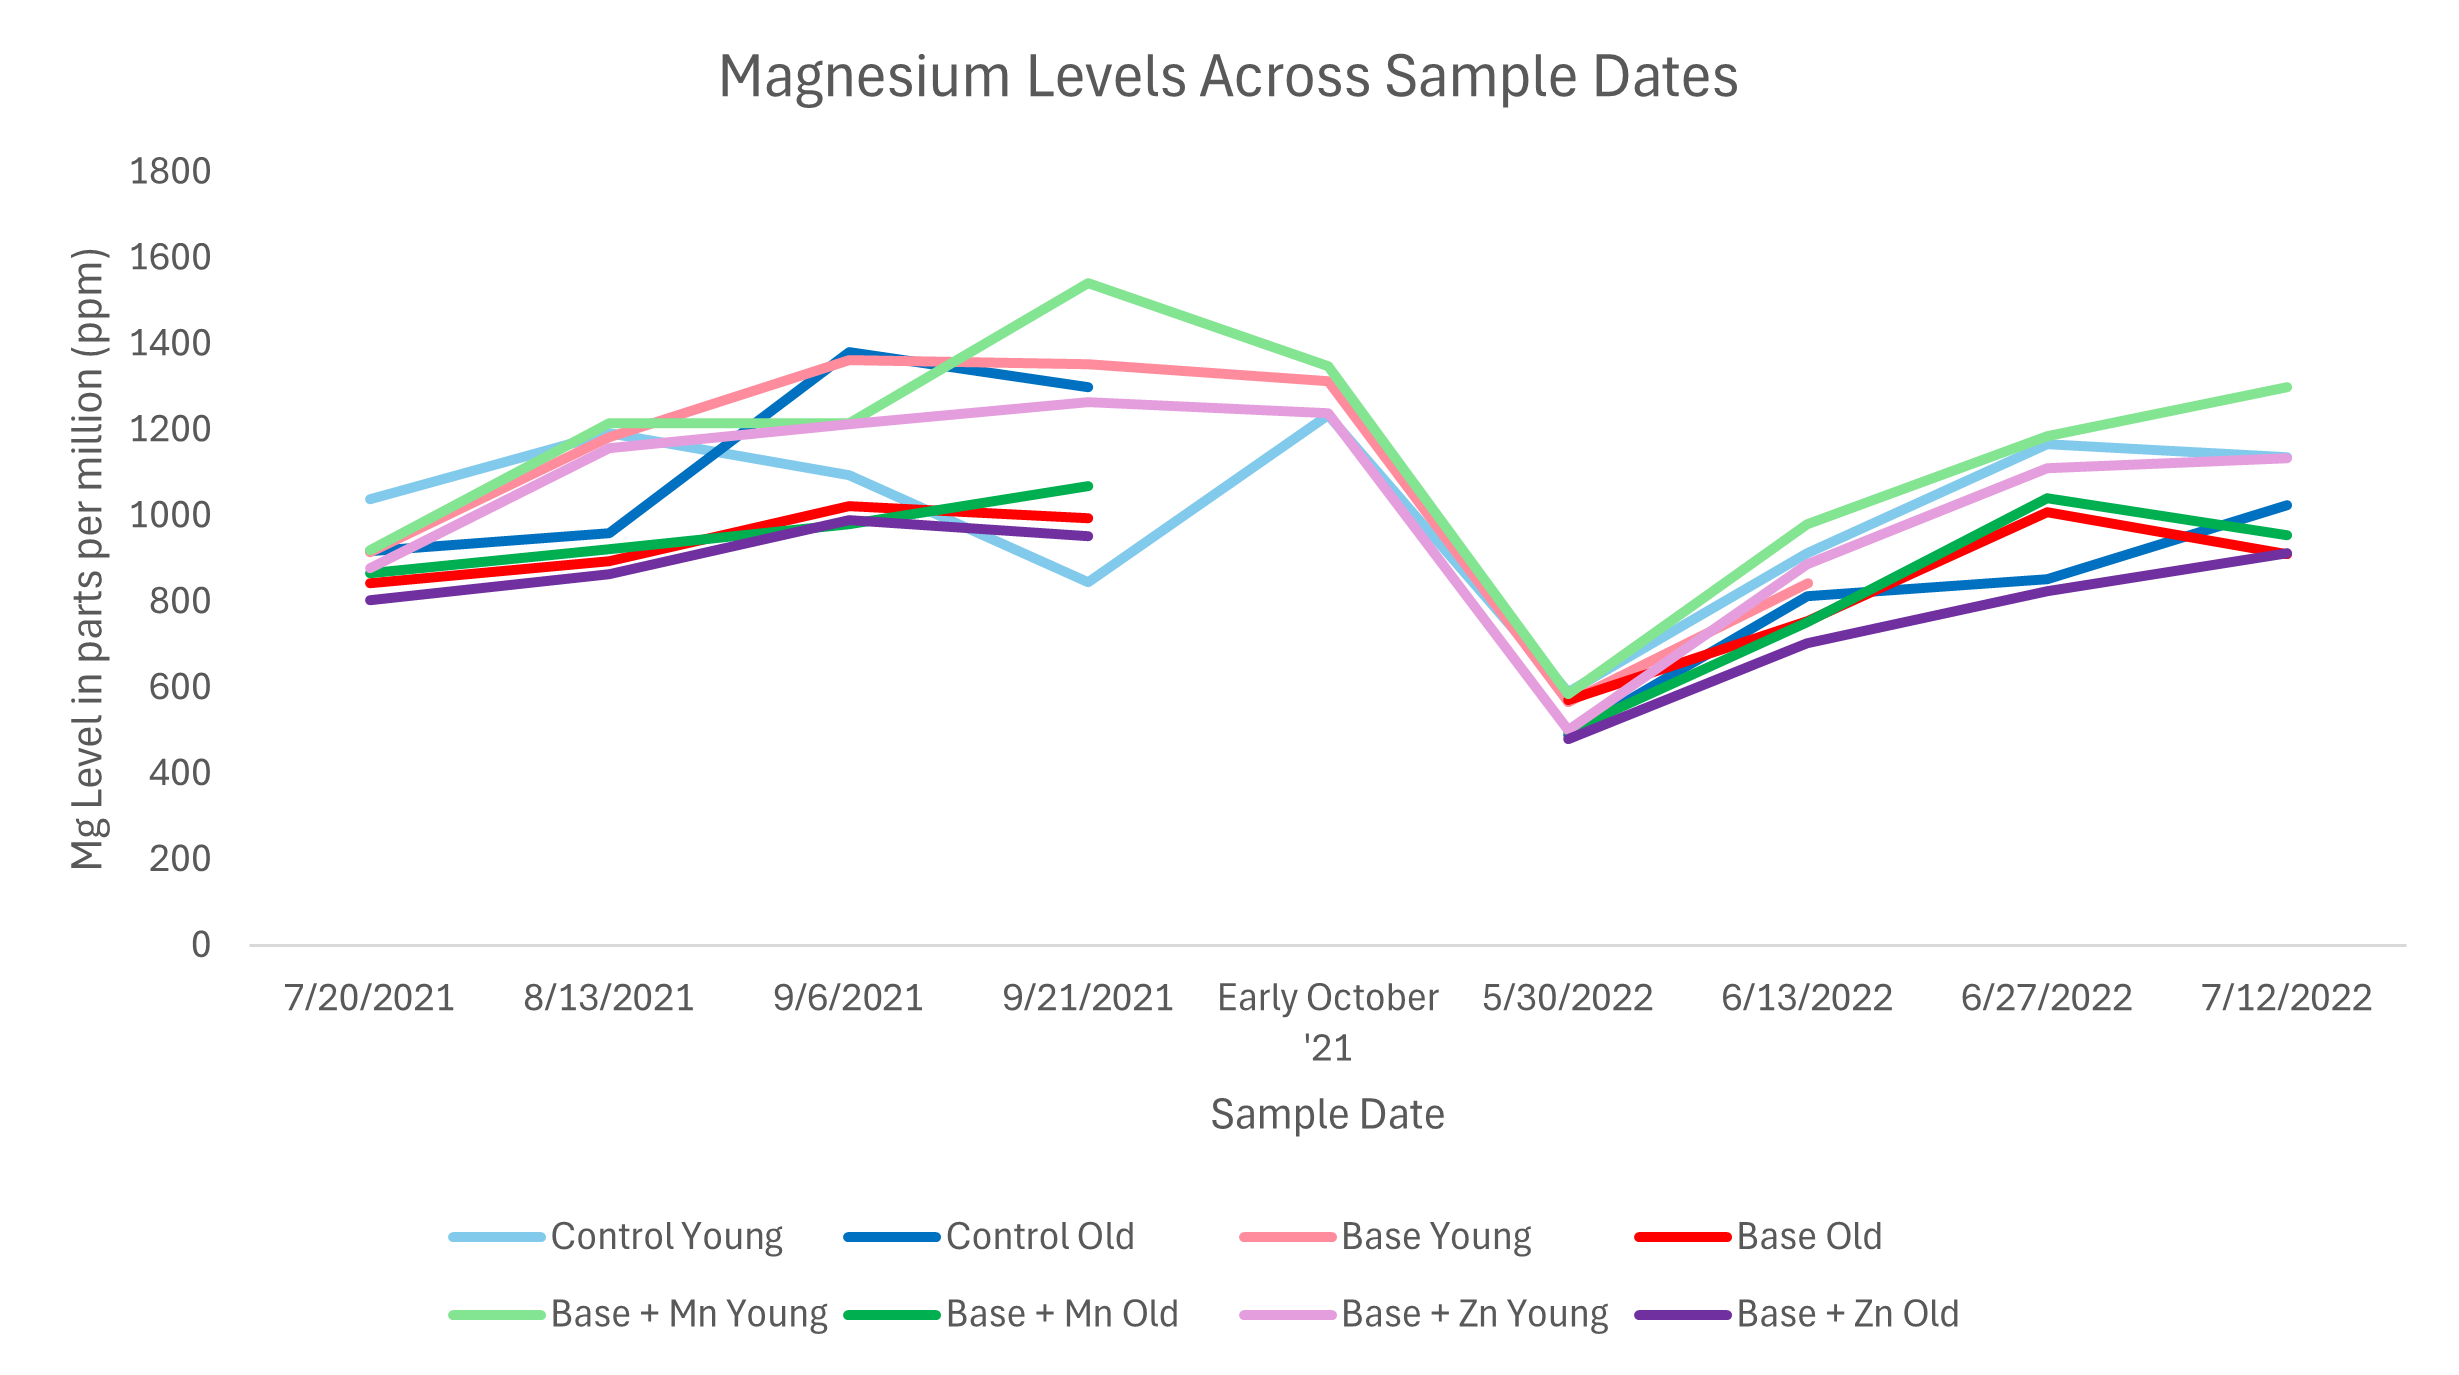
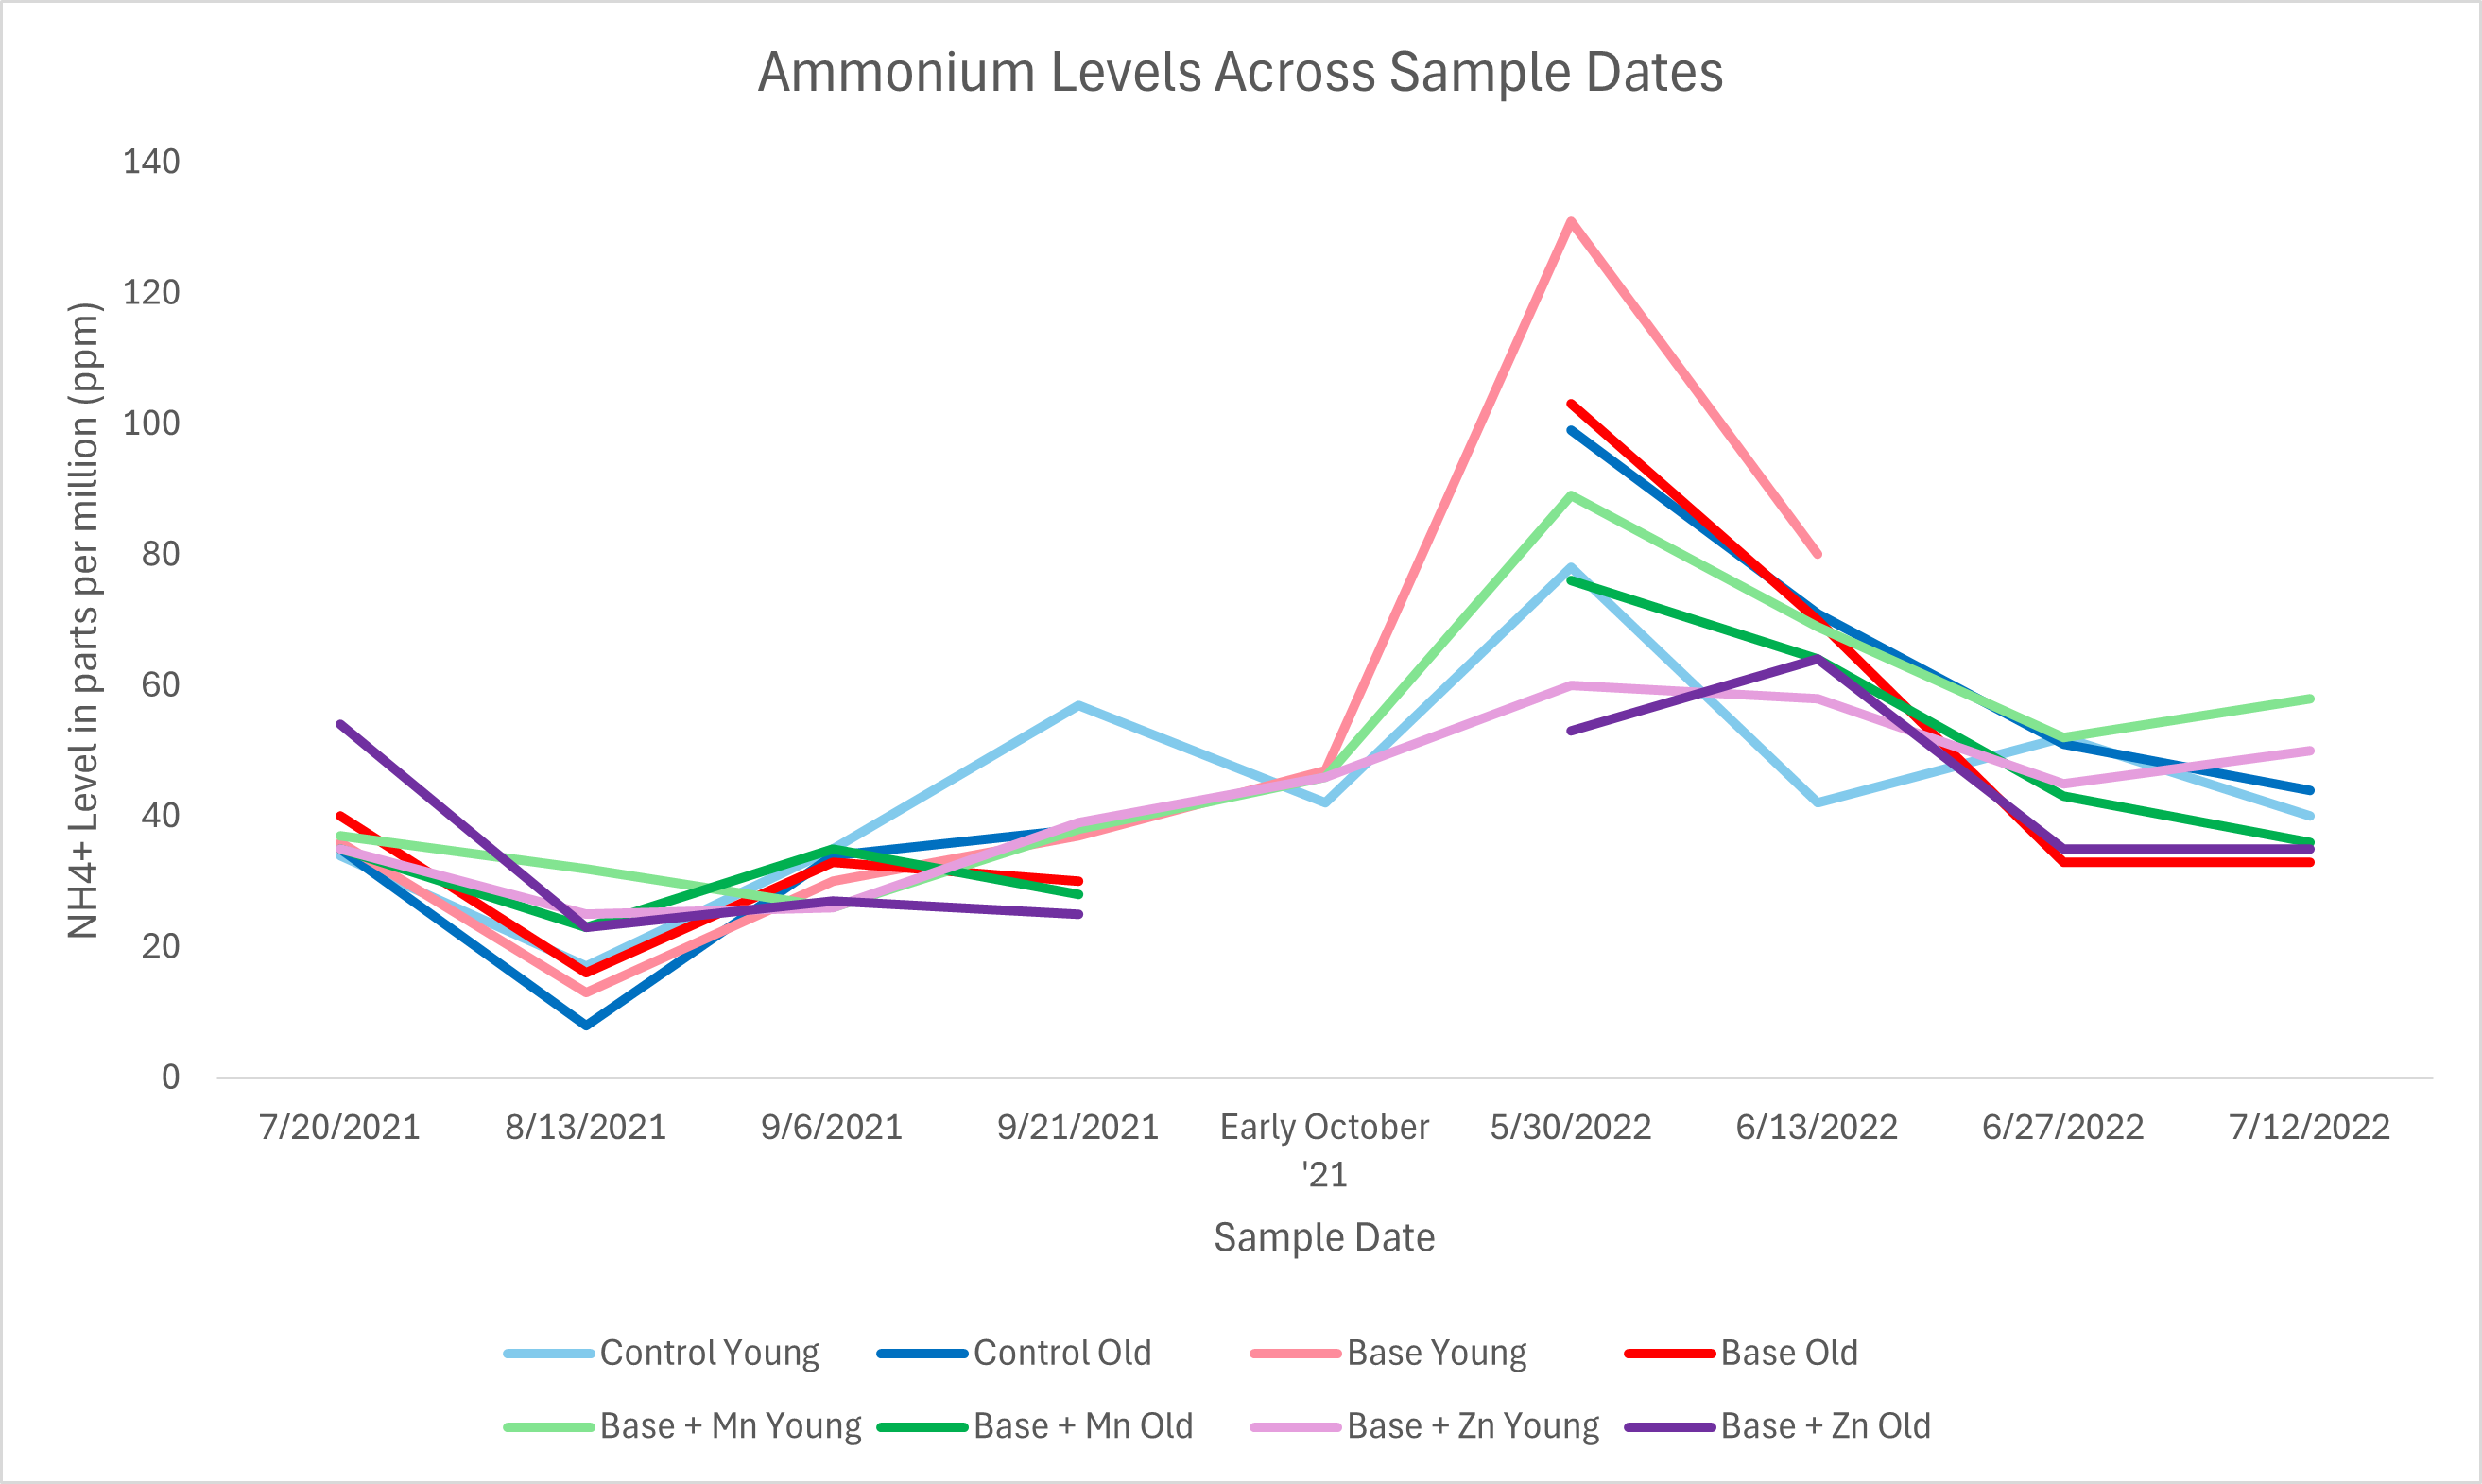
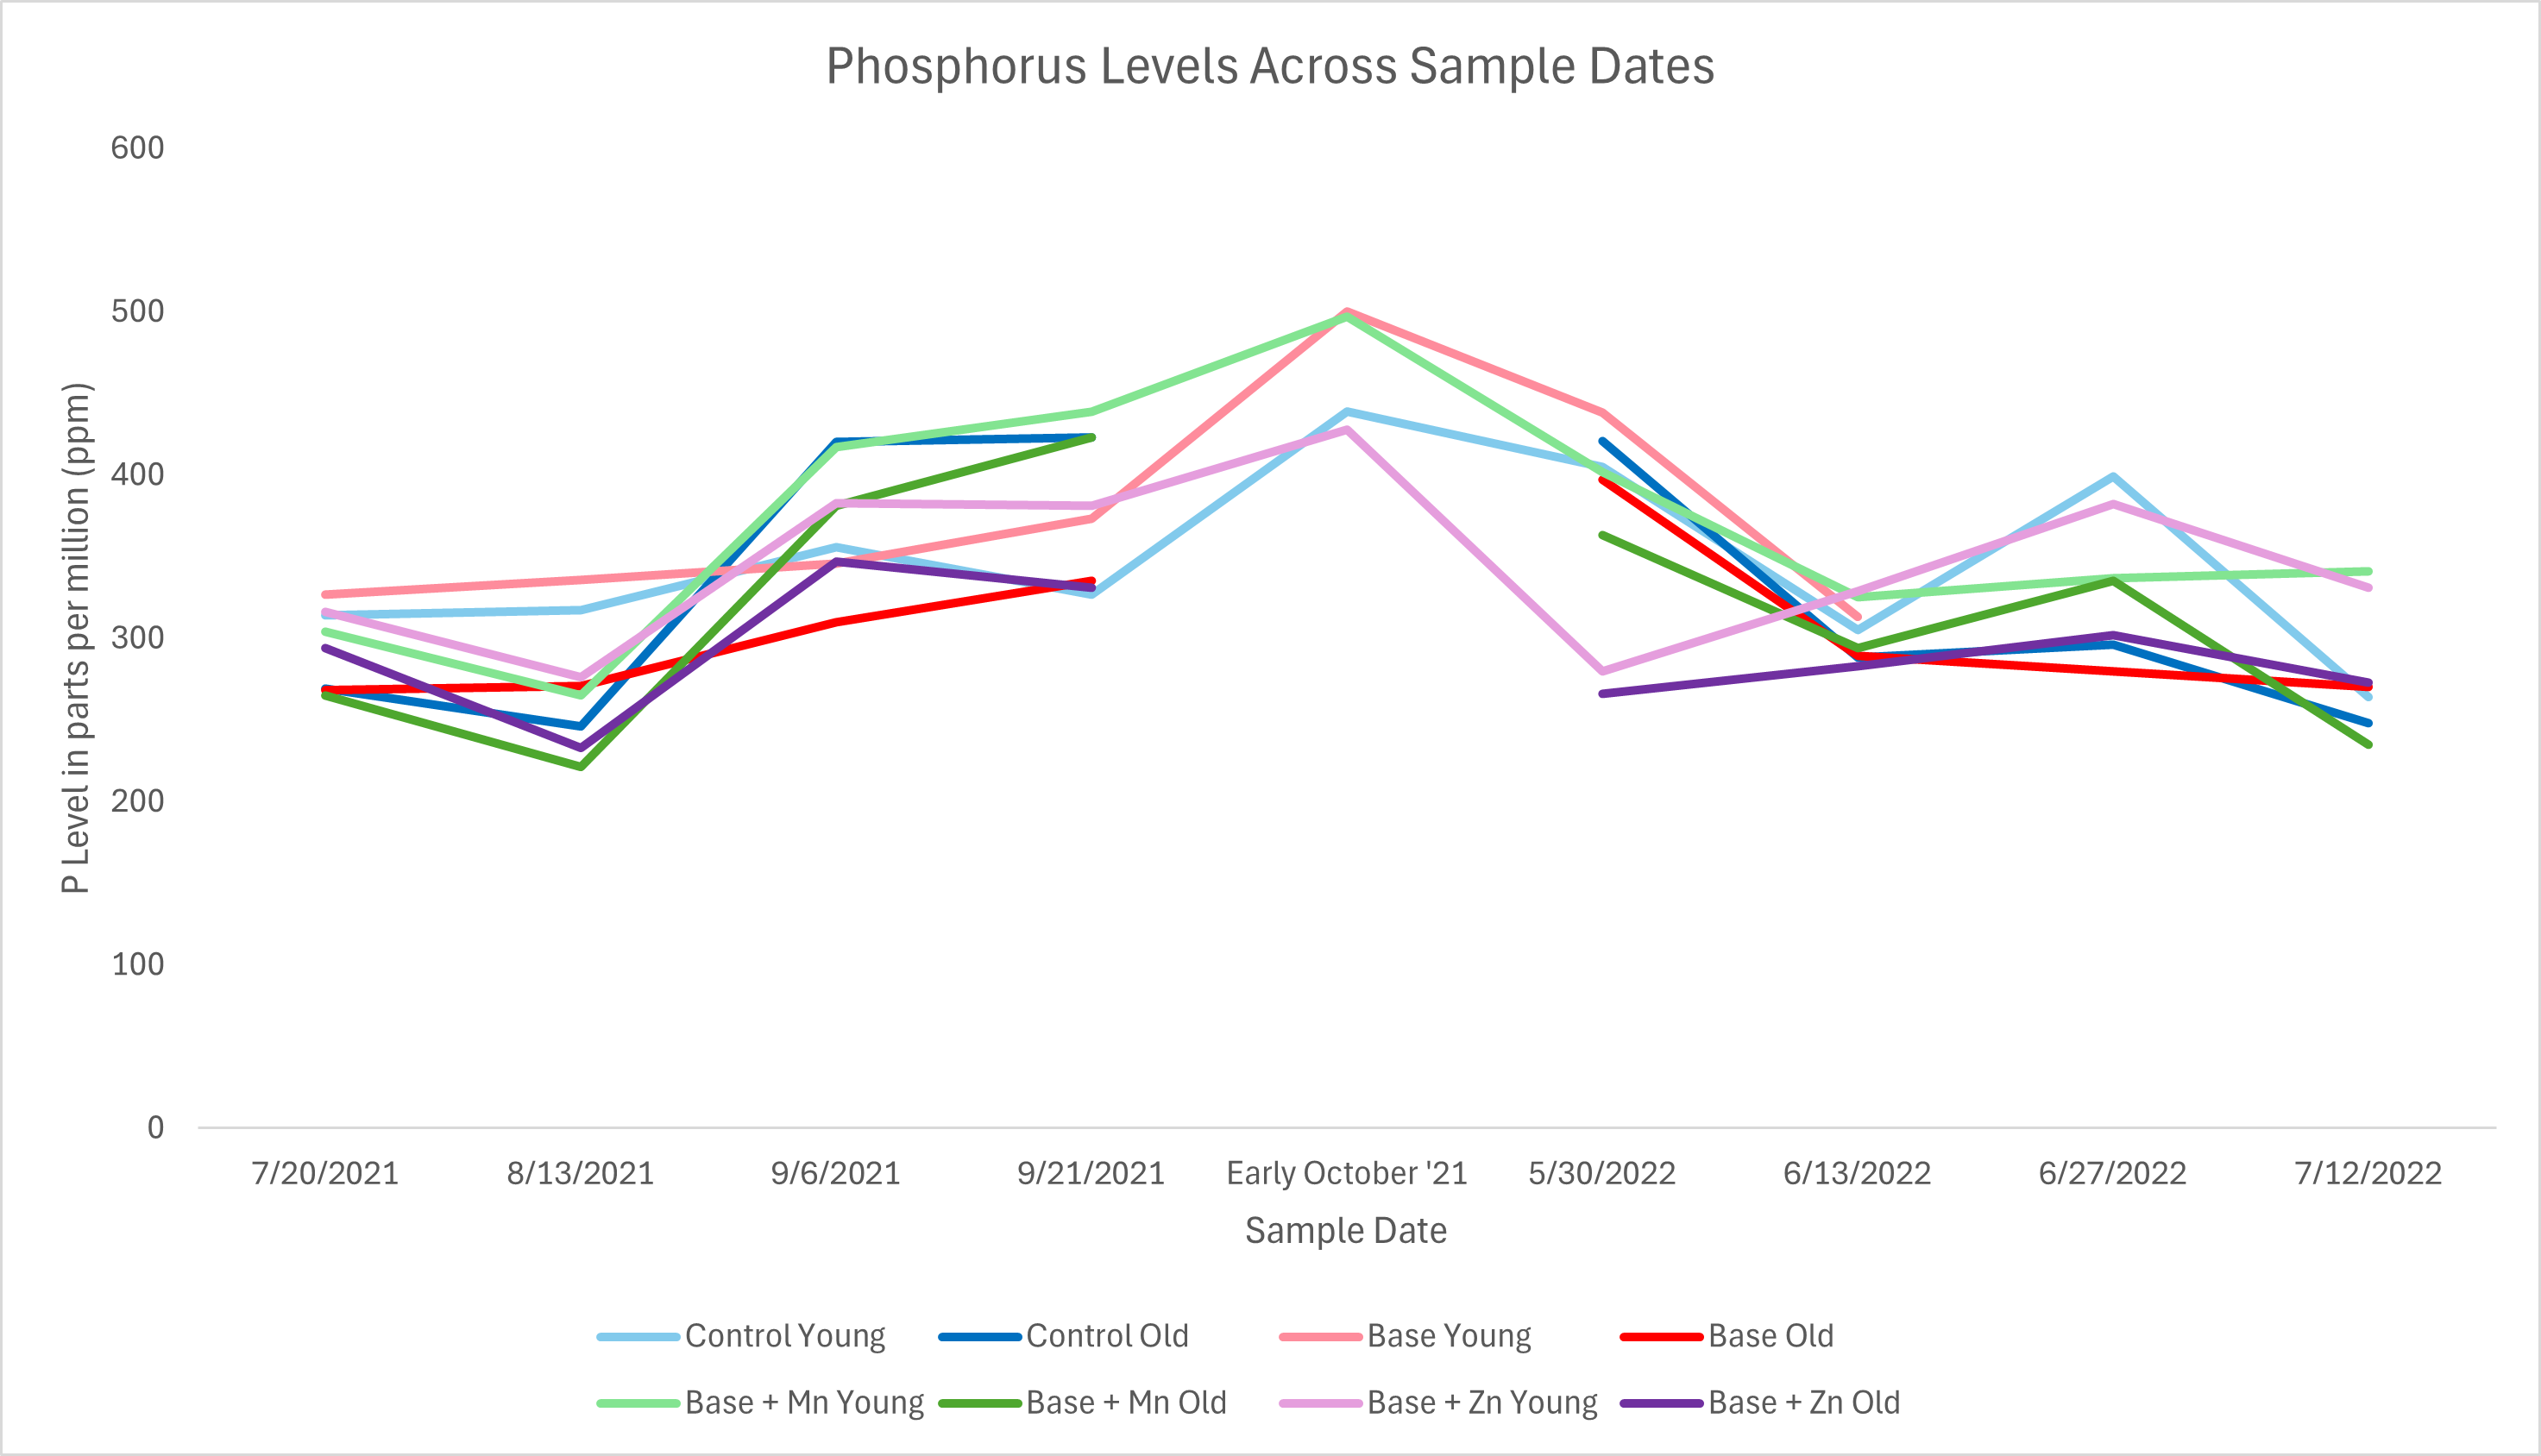
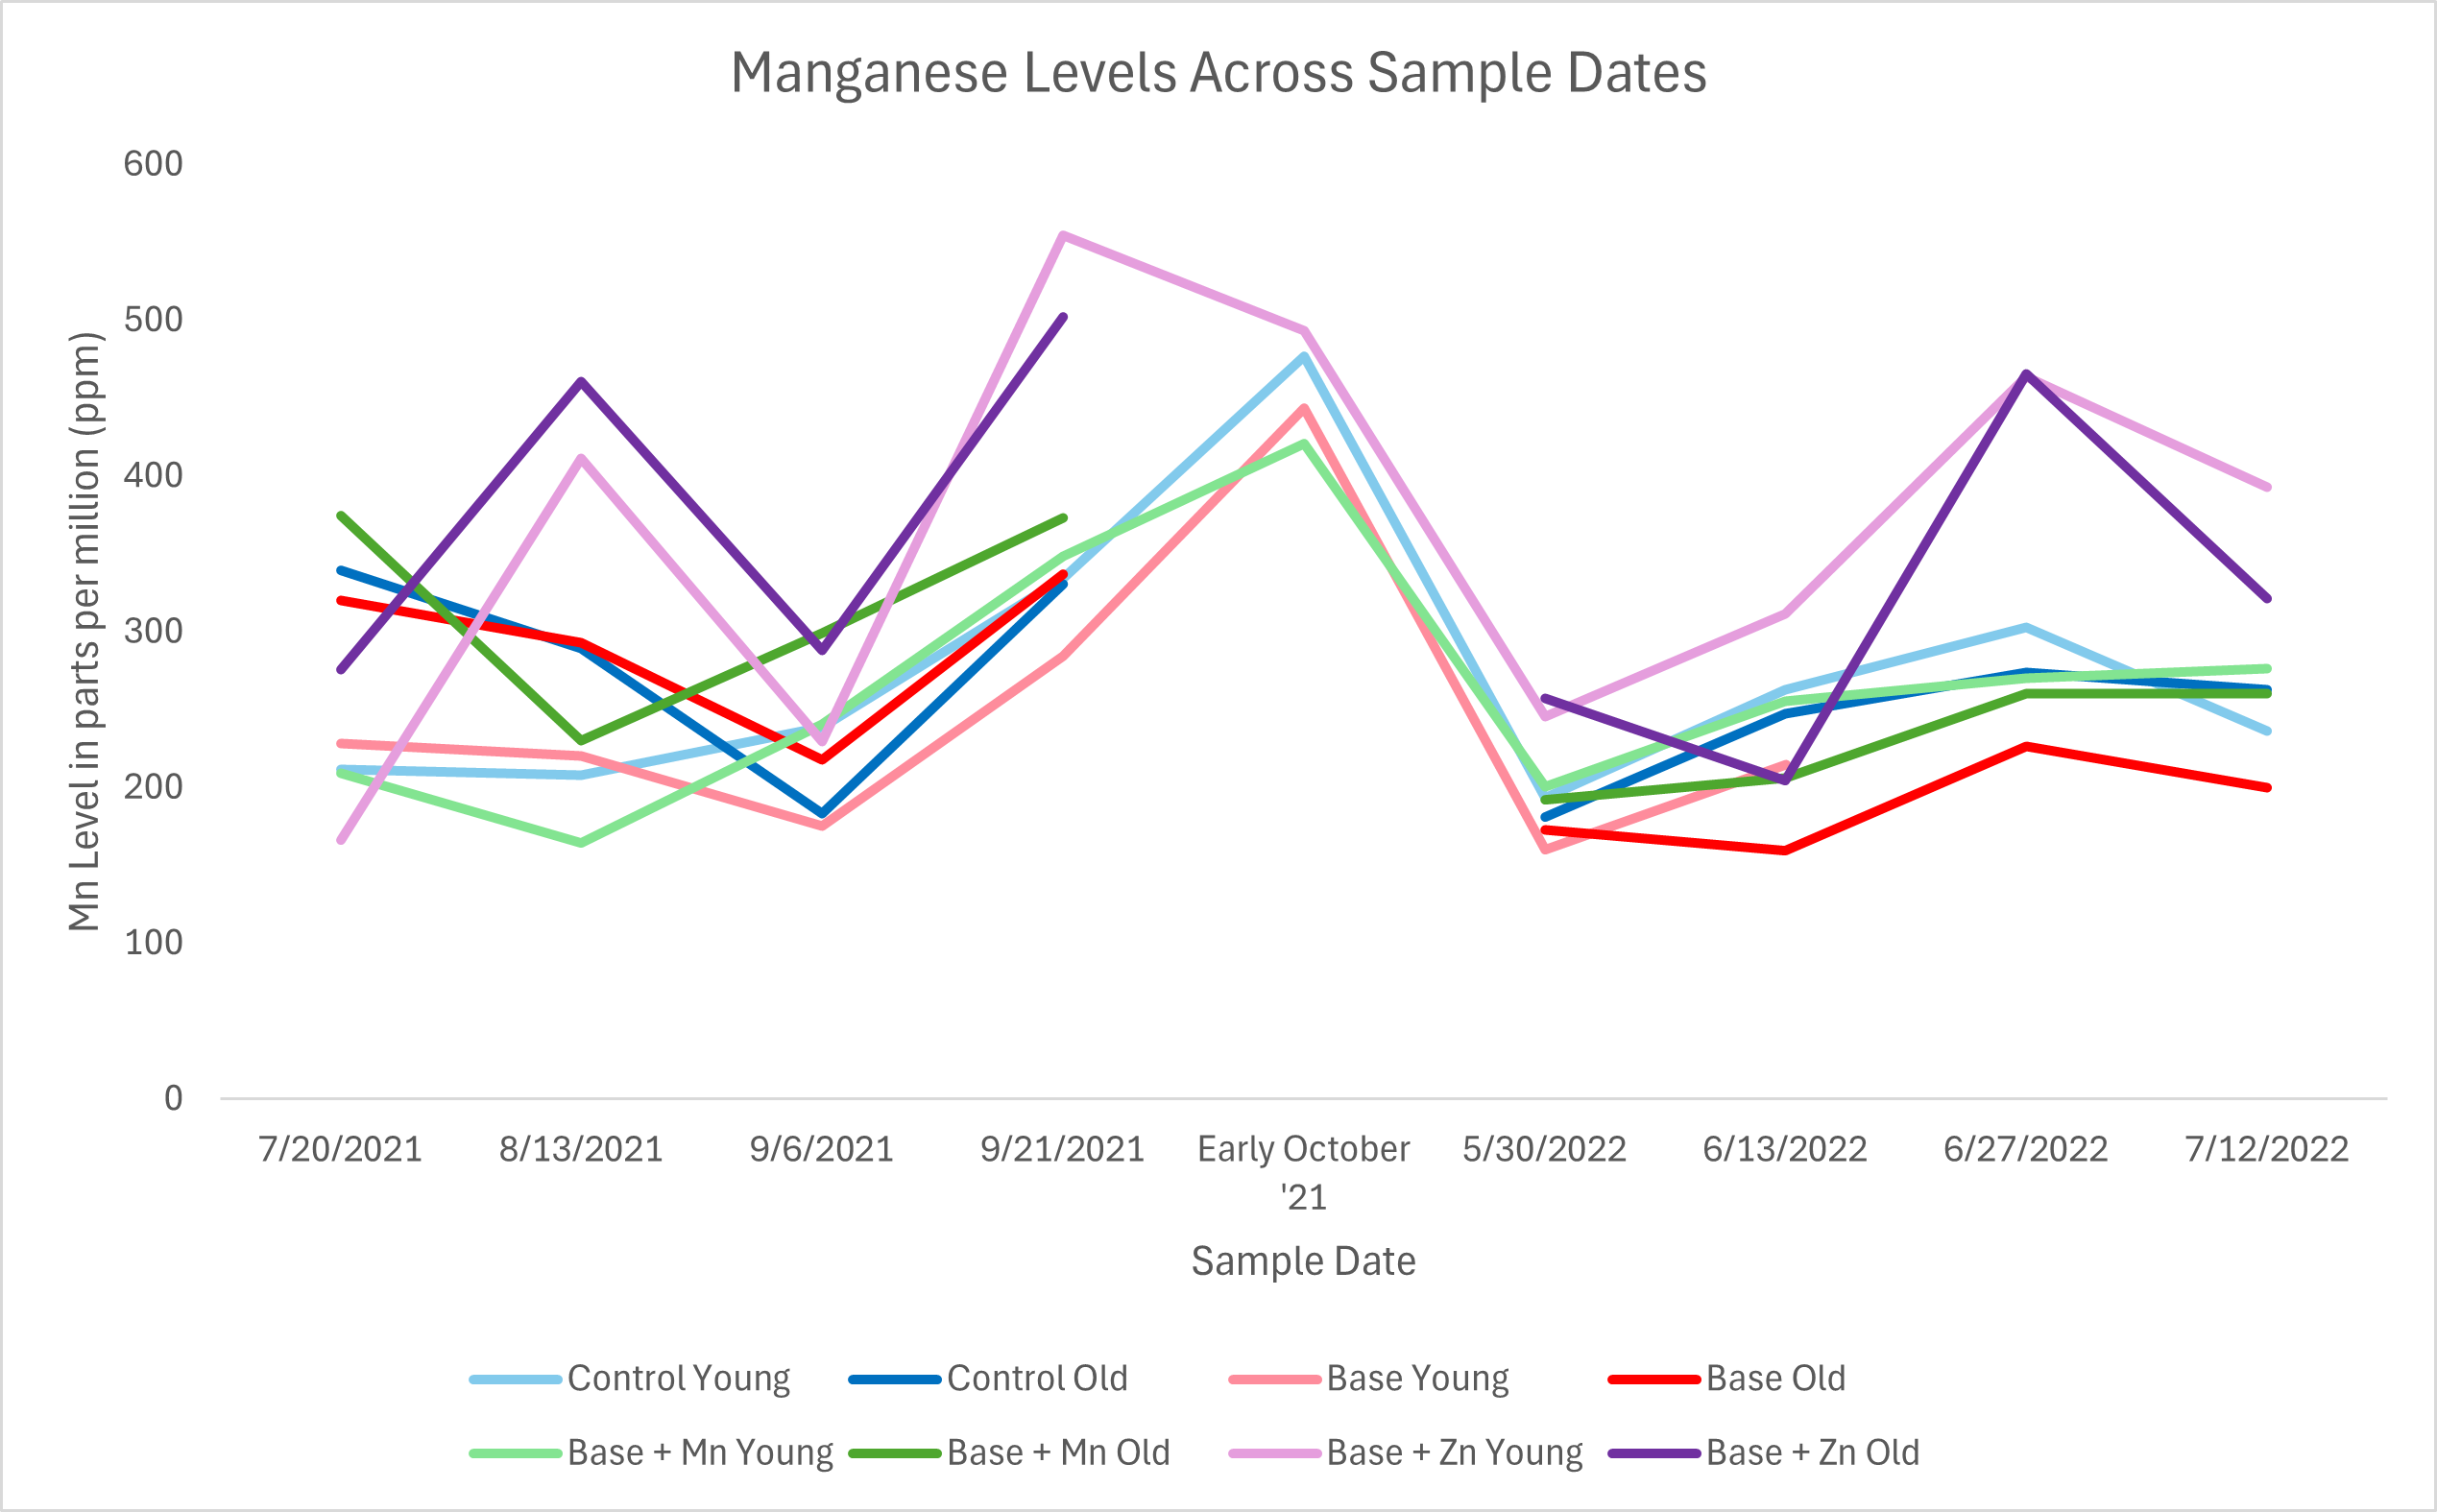
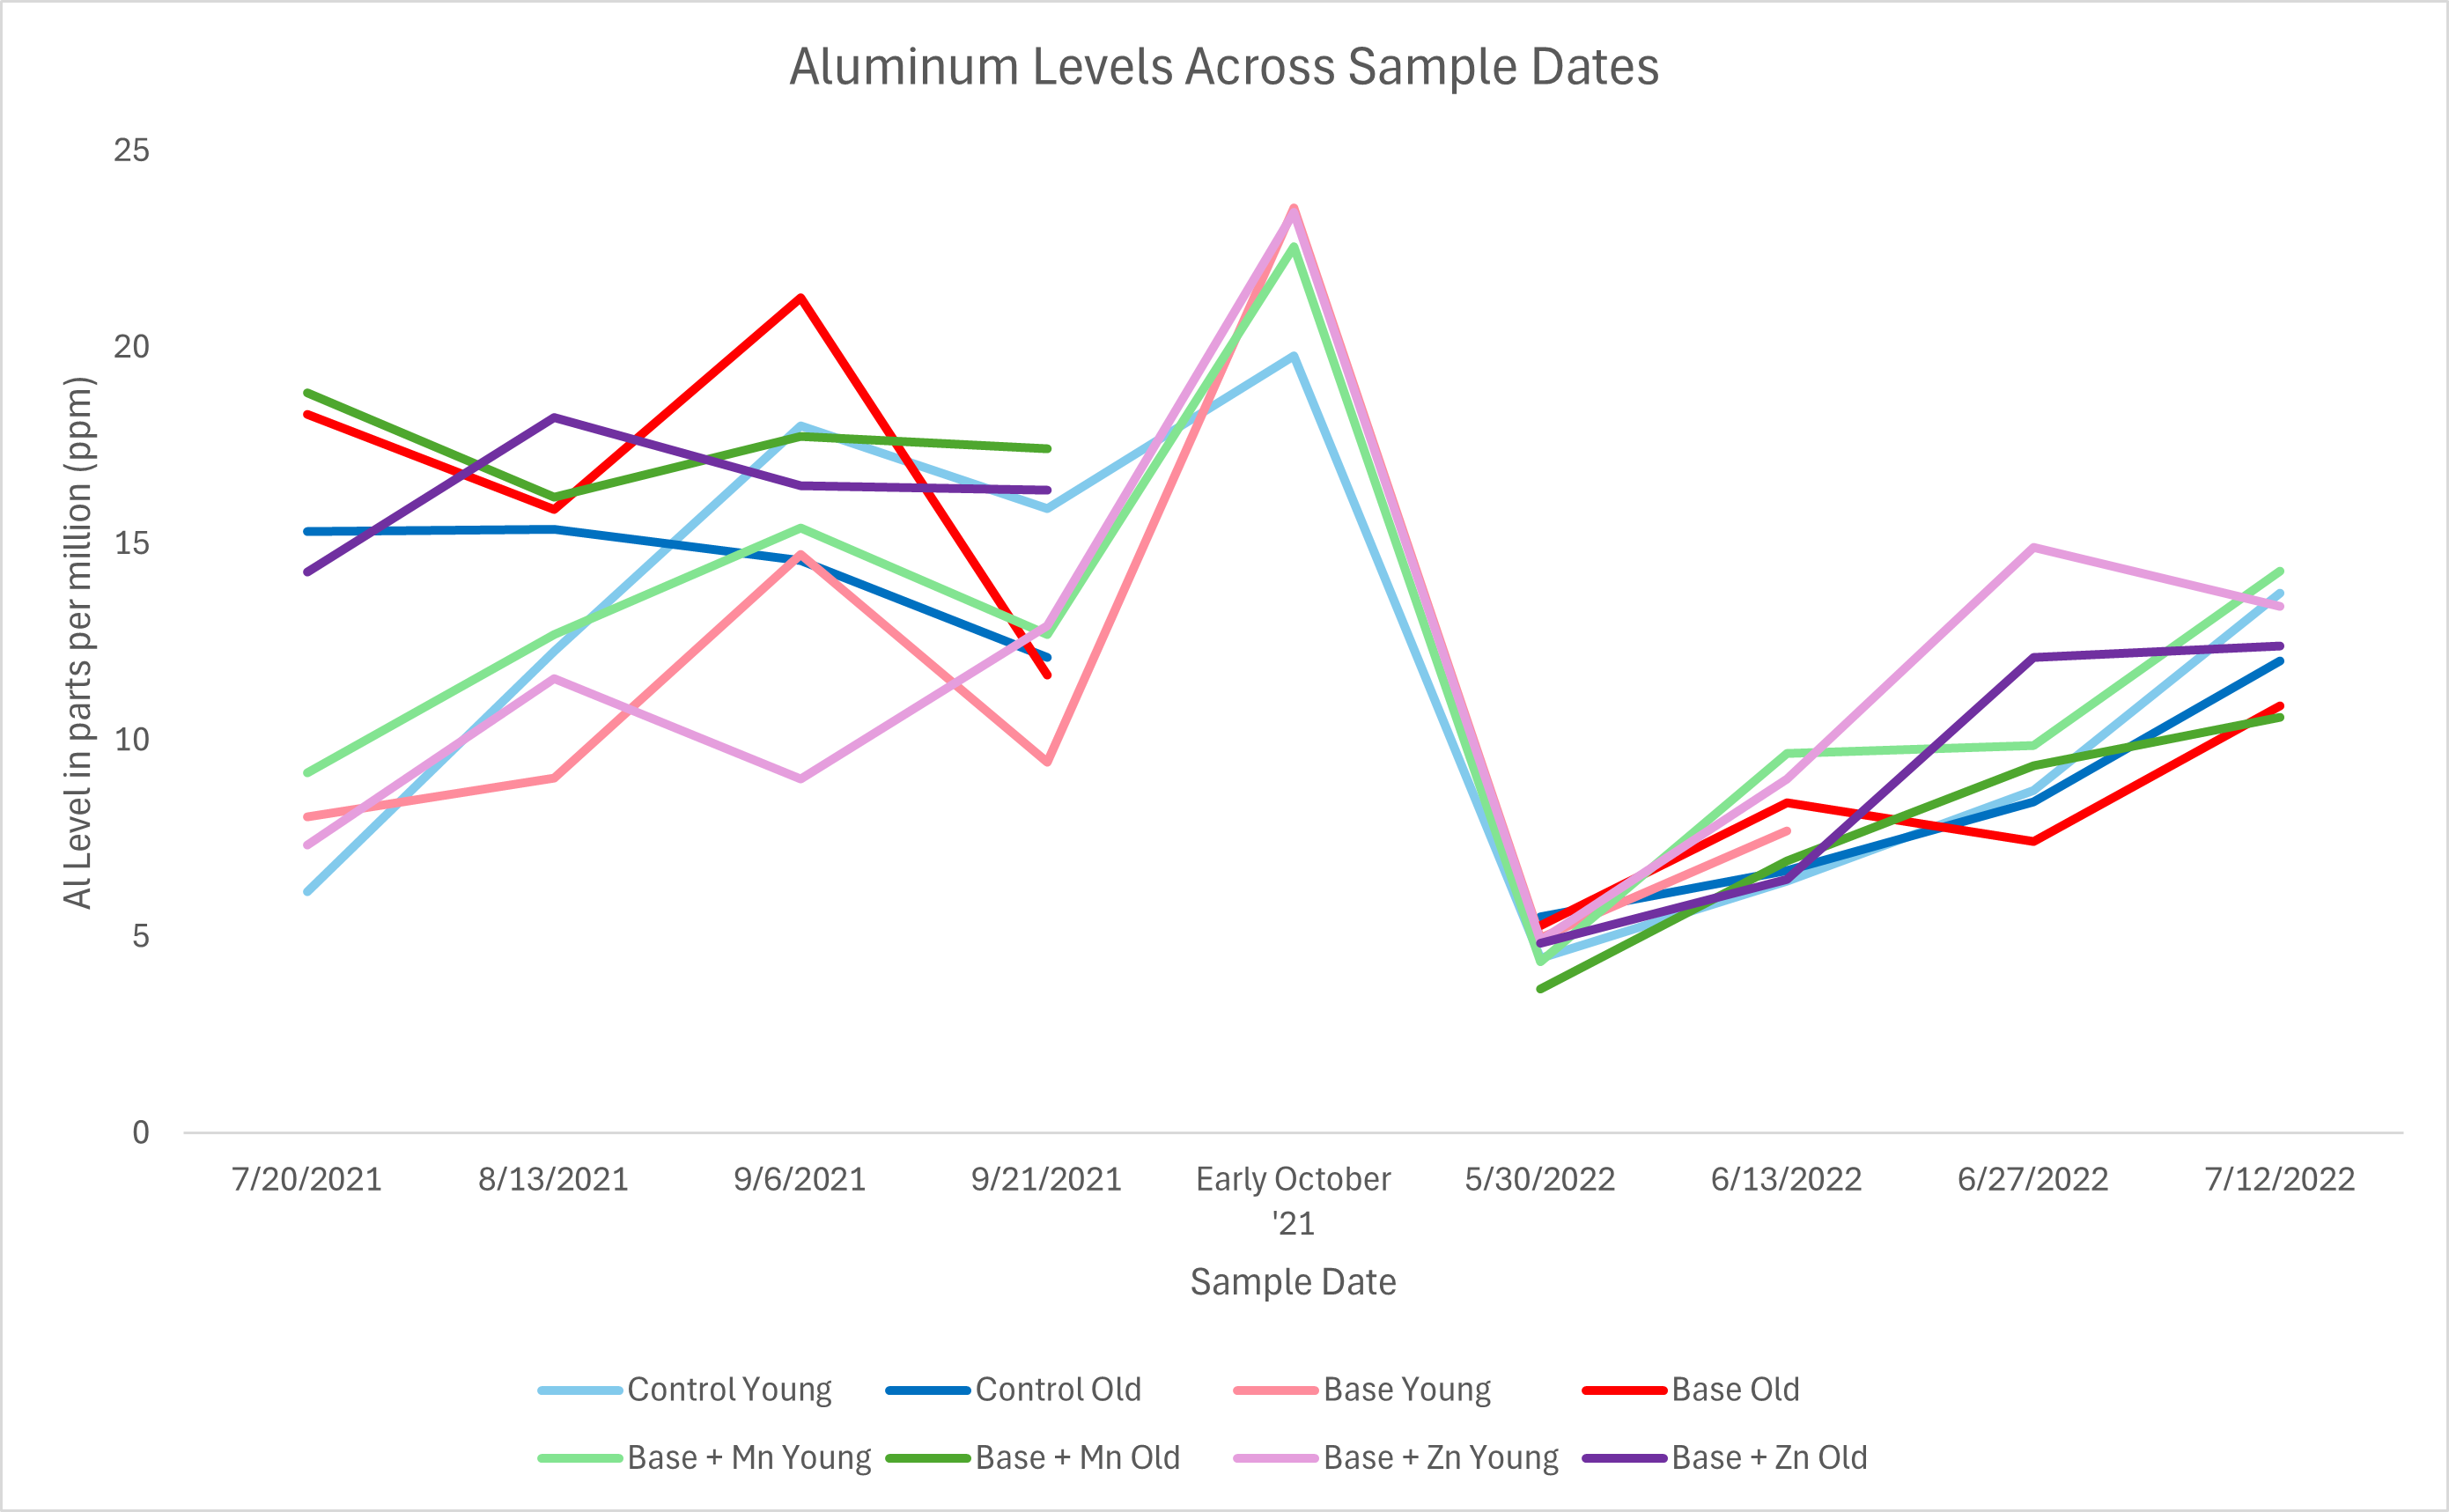
One question that arose from analyzing the sap tests is: why do we see a large overlap between yield sap tests and fruit quality sap tests but not blossom density sap tests? One possibility is the timing of the blossom density sap collection. The blossom density sap collection was taken in the spring, about two weeks after bud break. Large differences in sap levels for nutrients that accumulate through the season don't tend to be apparent in the spring. When looking at the graphs from phase 2 (see below), the gap between nutrient levels increases from the spring to the fall. Although the treatments showed higher levels of these nutrients in the fall of 2021, in the spring of 2022 levels drop down and even out. The differences between nutrient levels across different treatments increased again as the season progressed.
Phase 2:
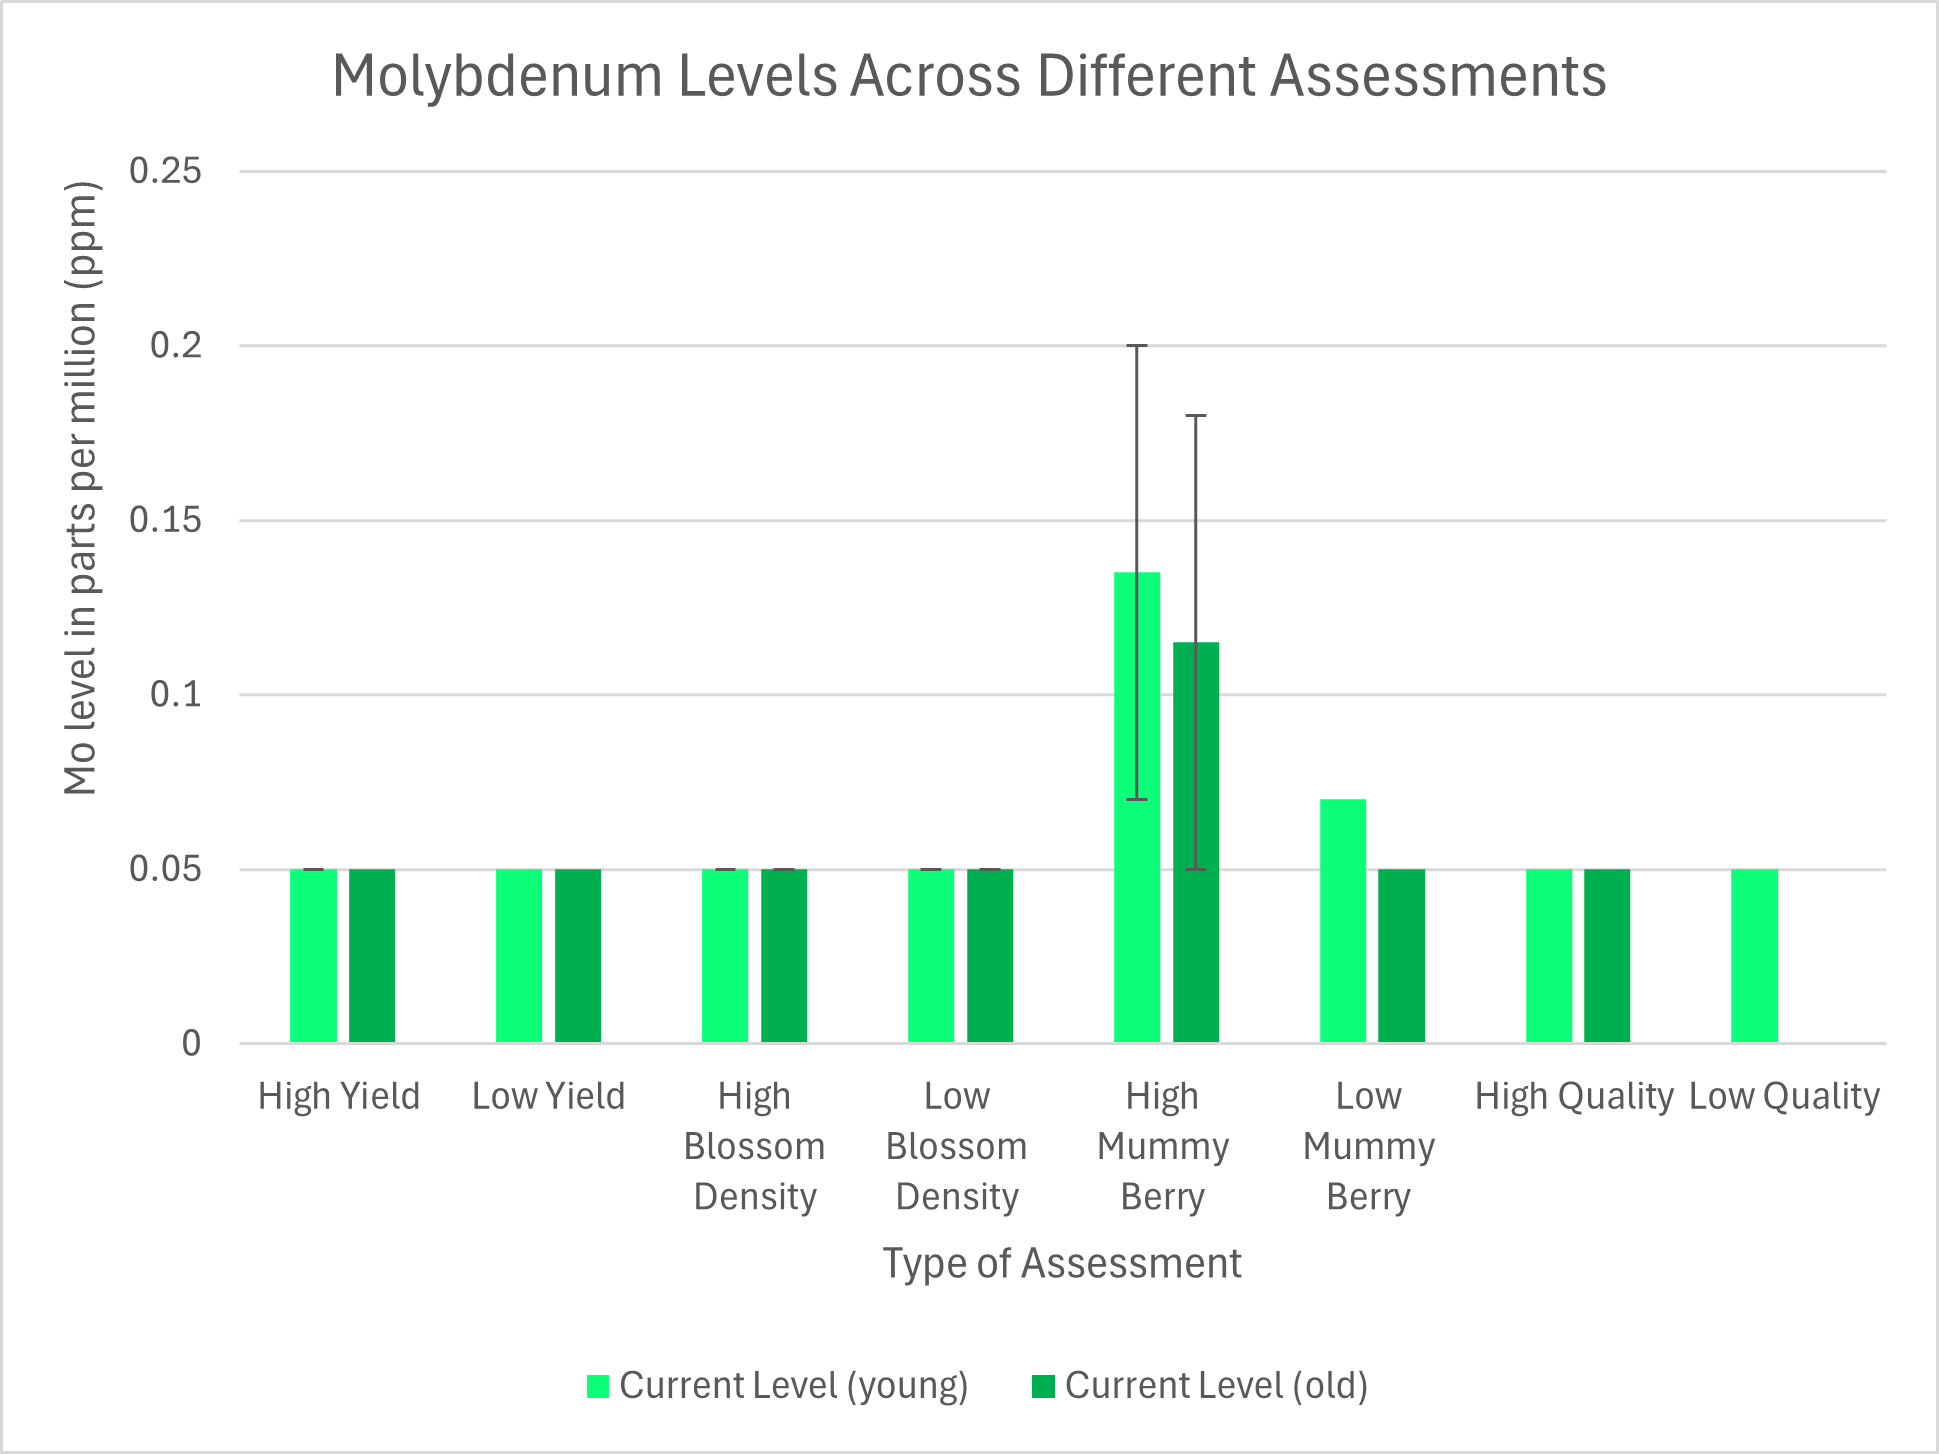
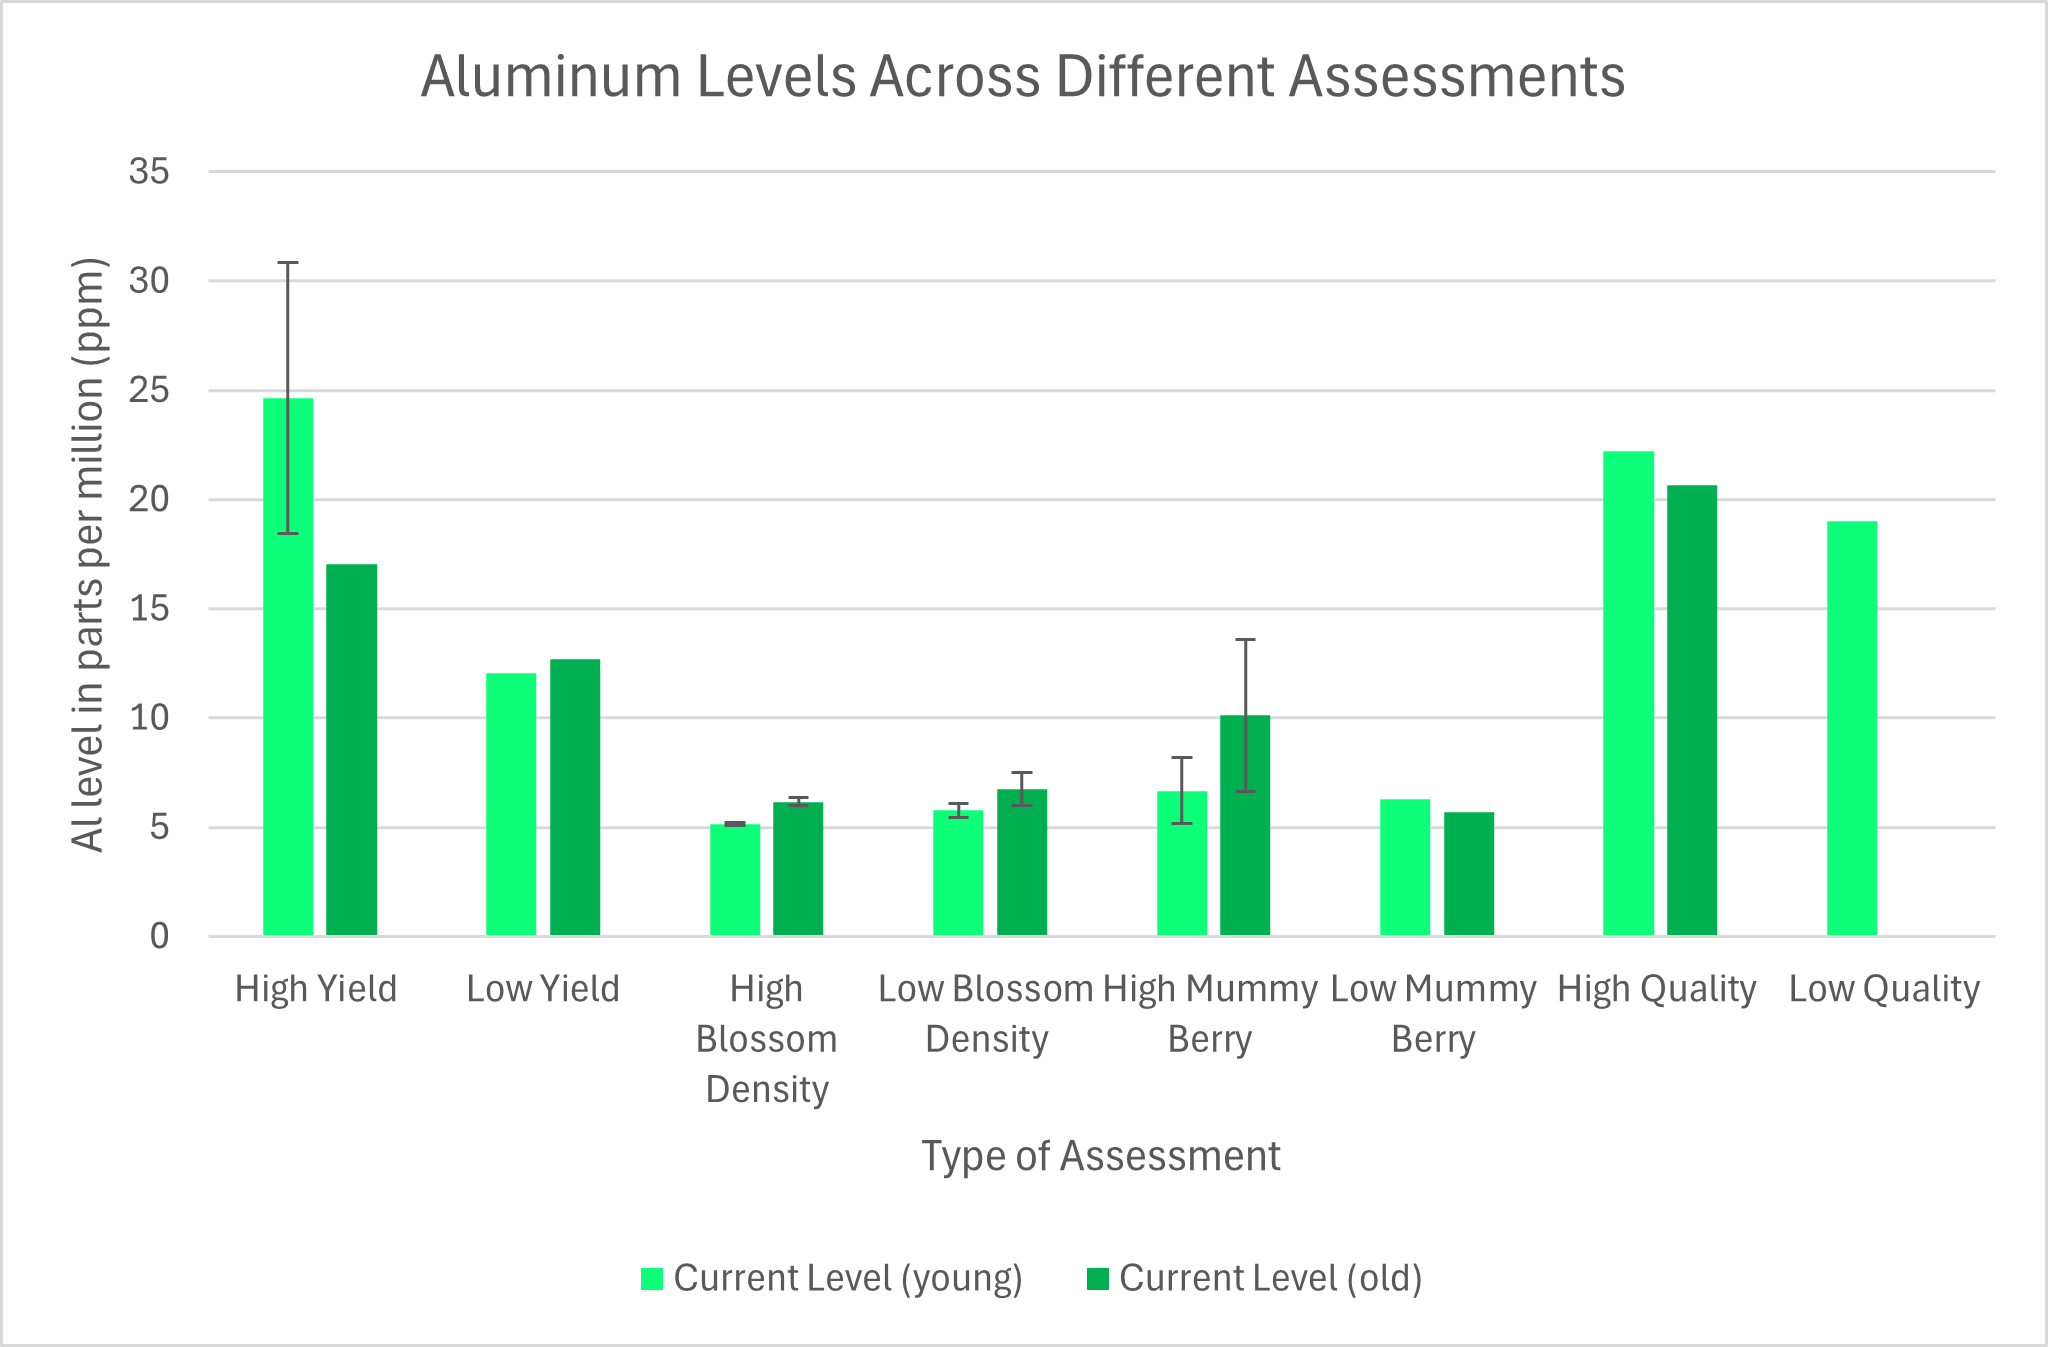
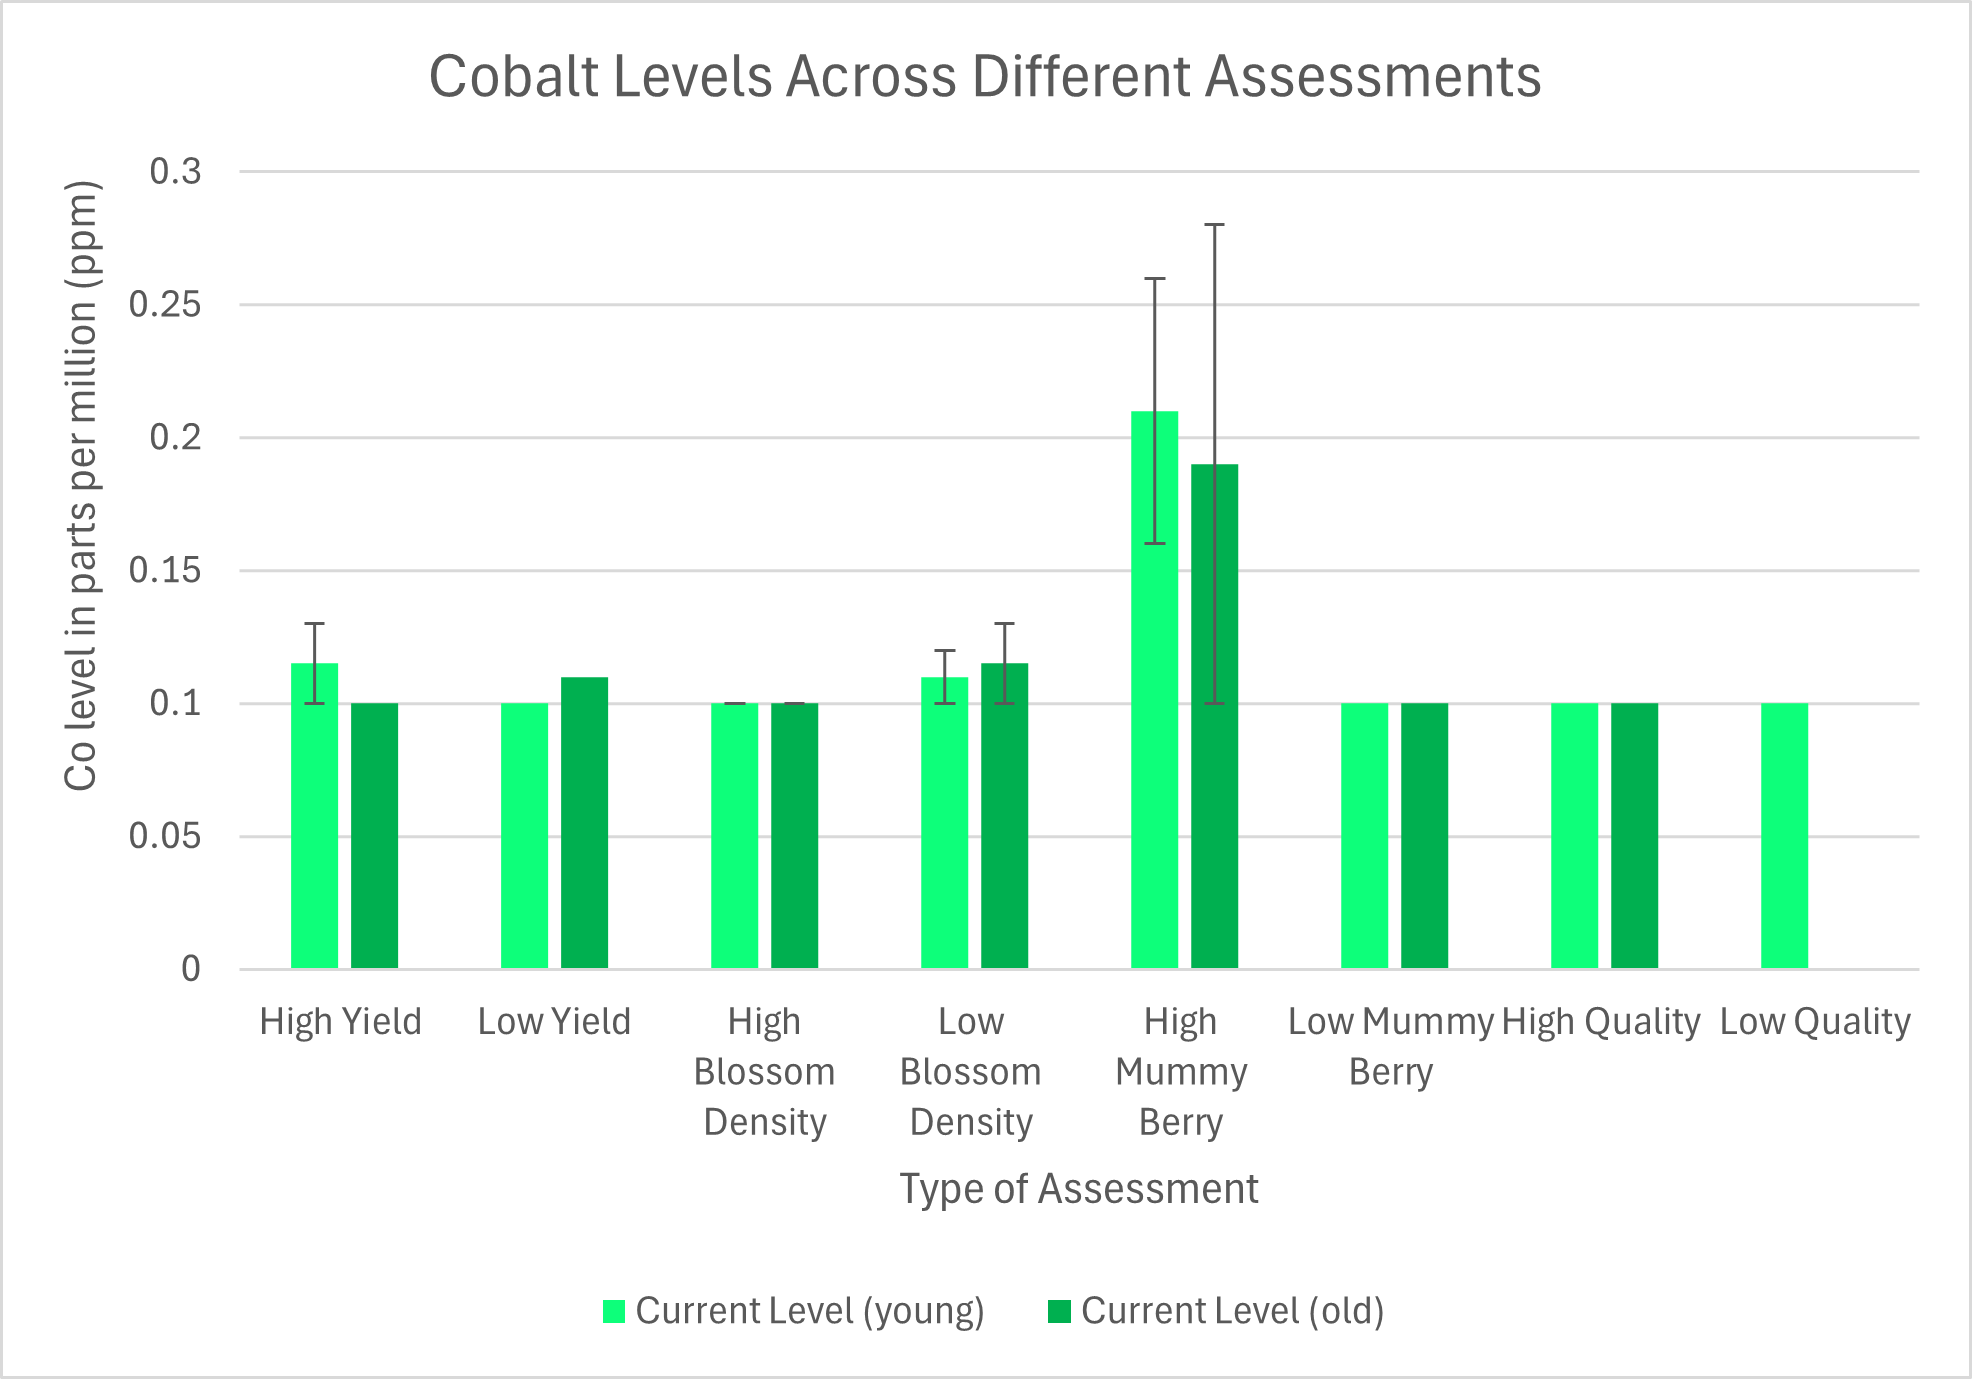
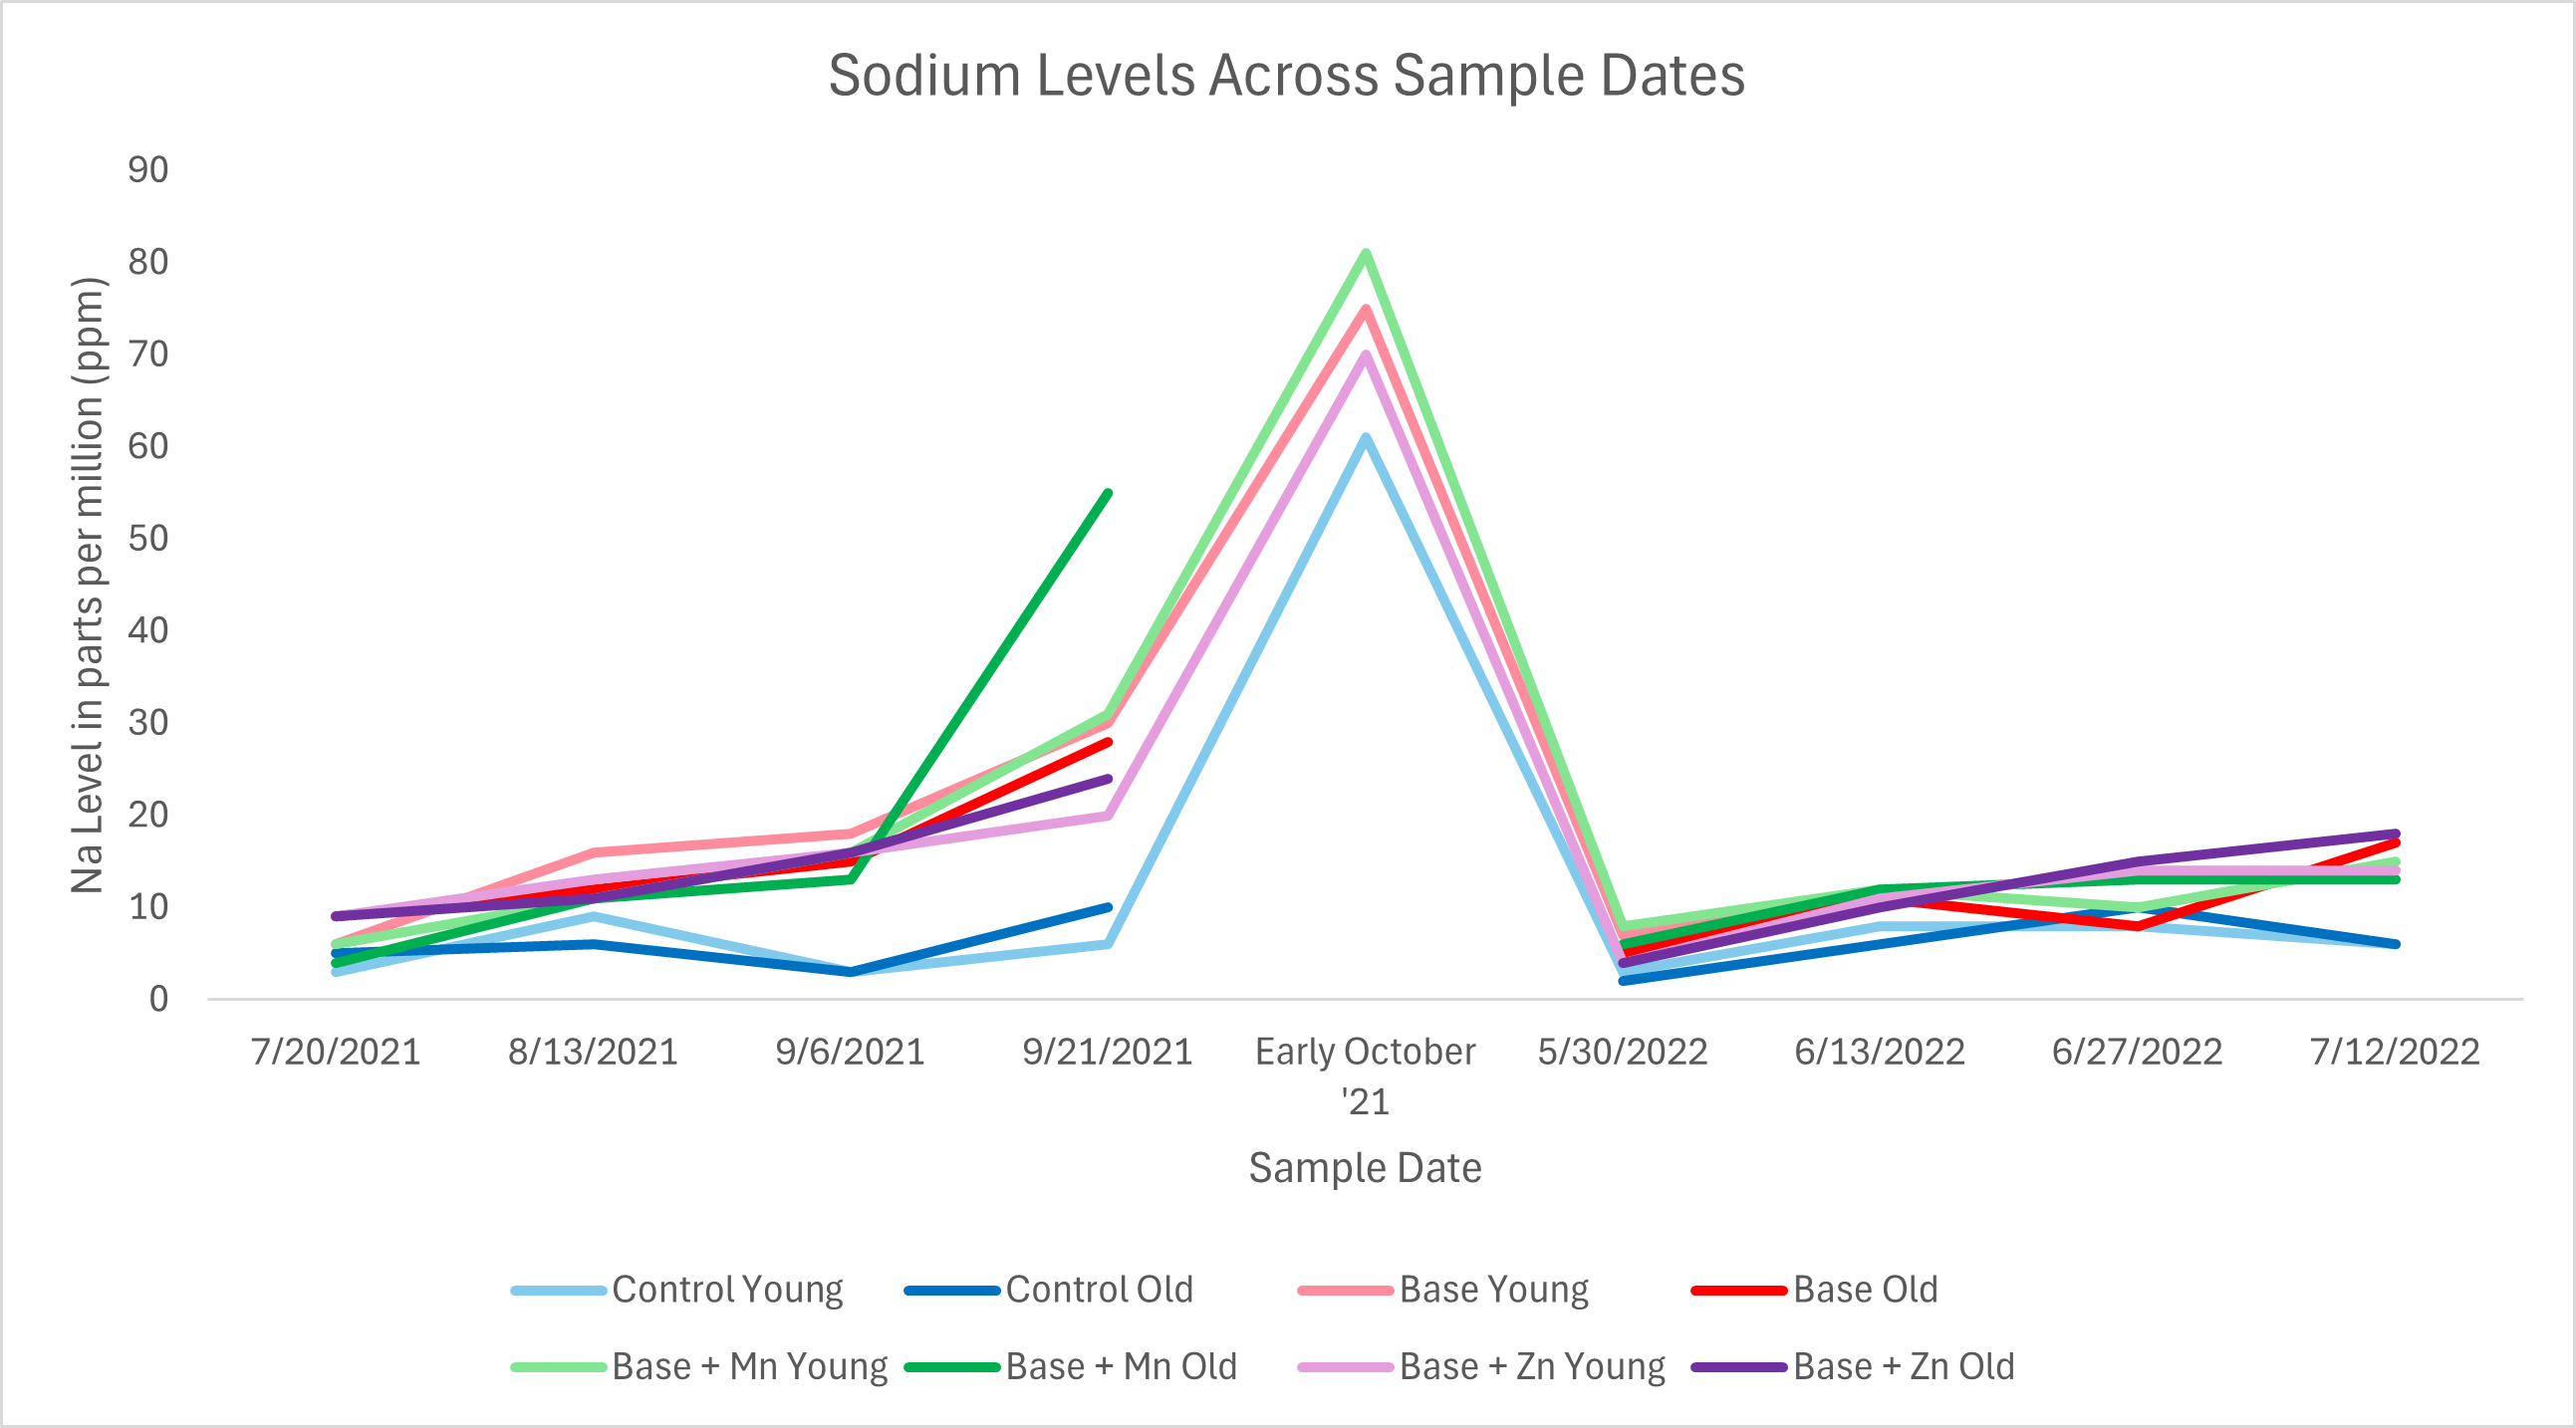
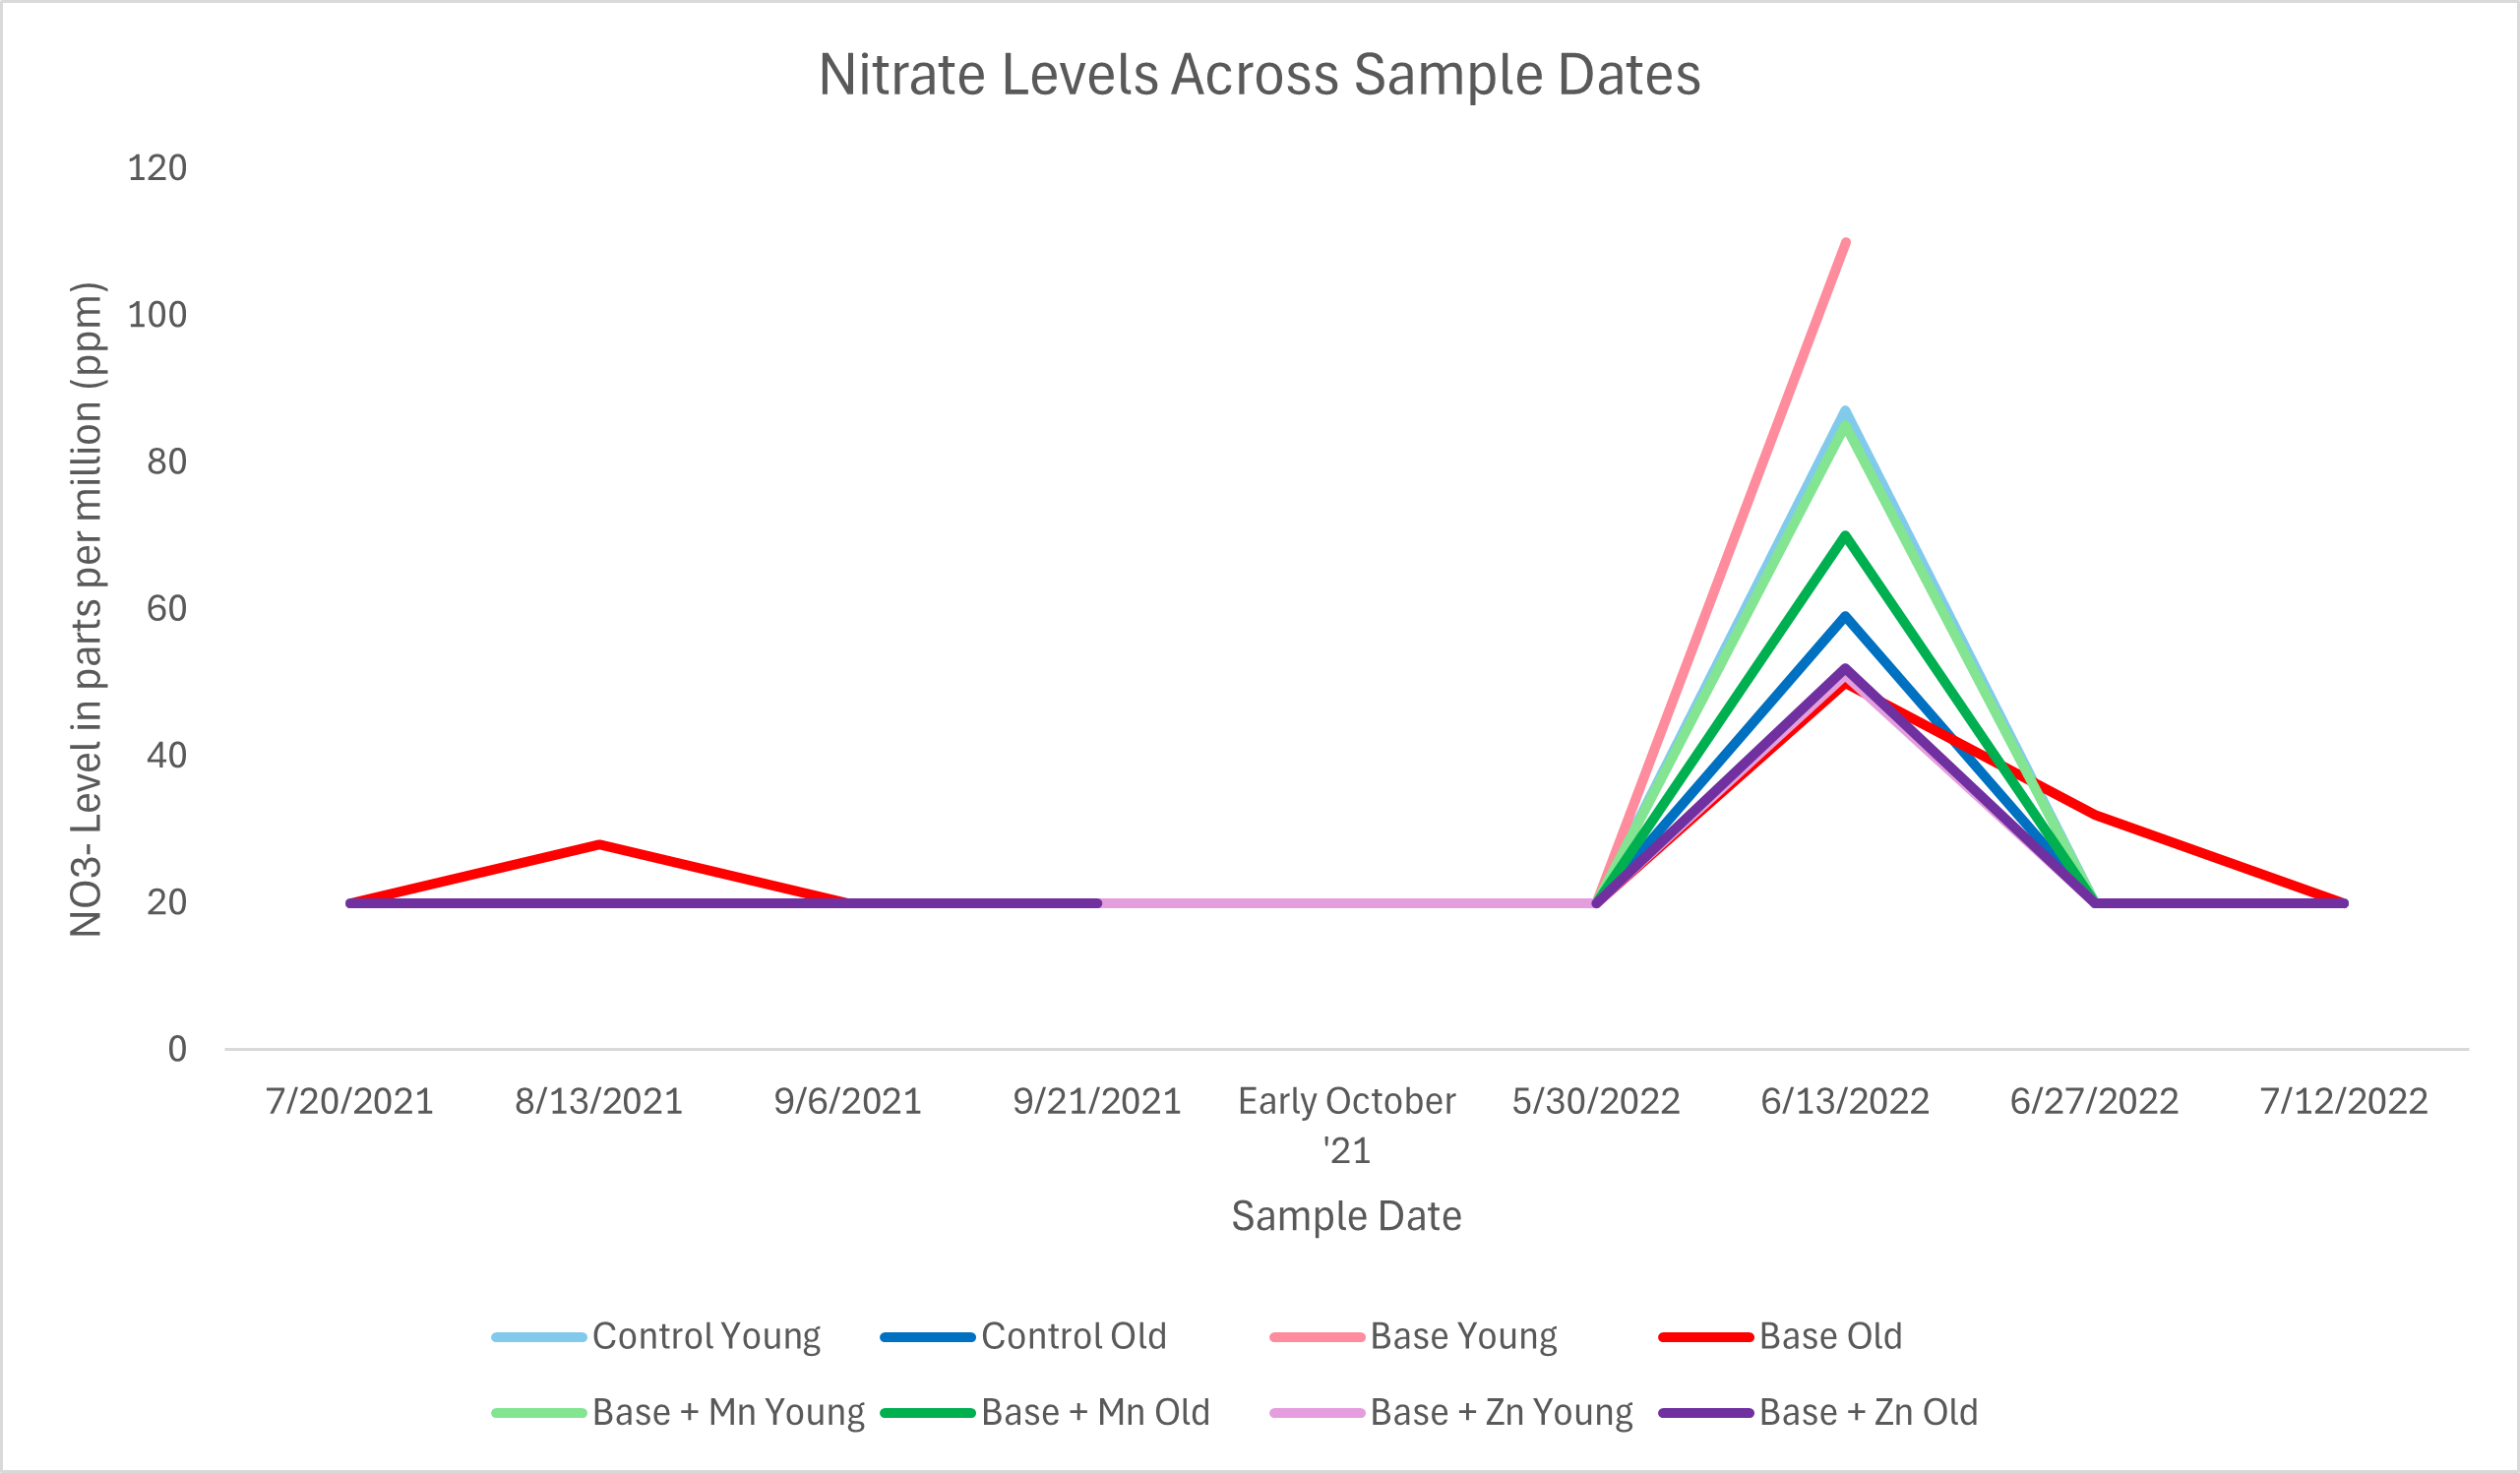
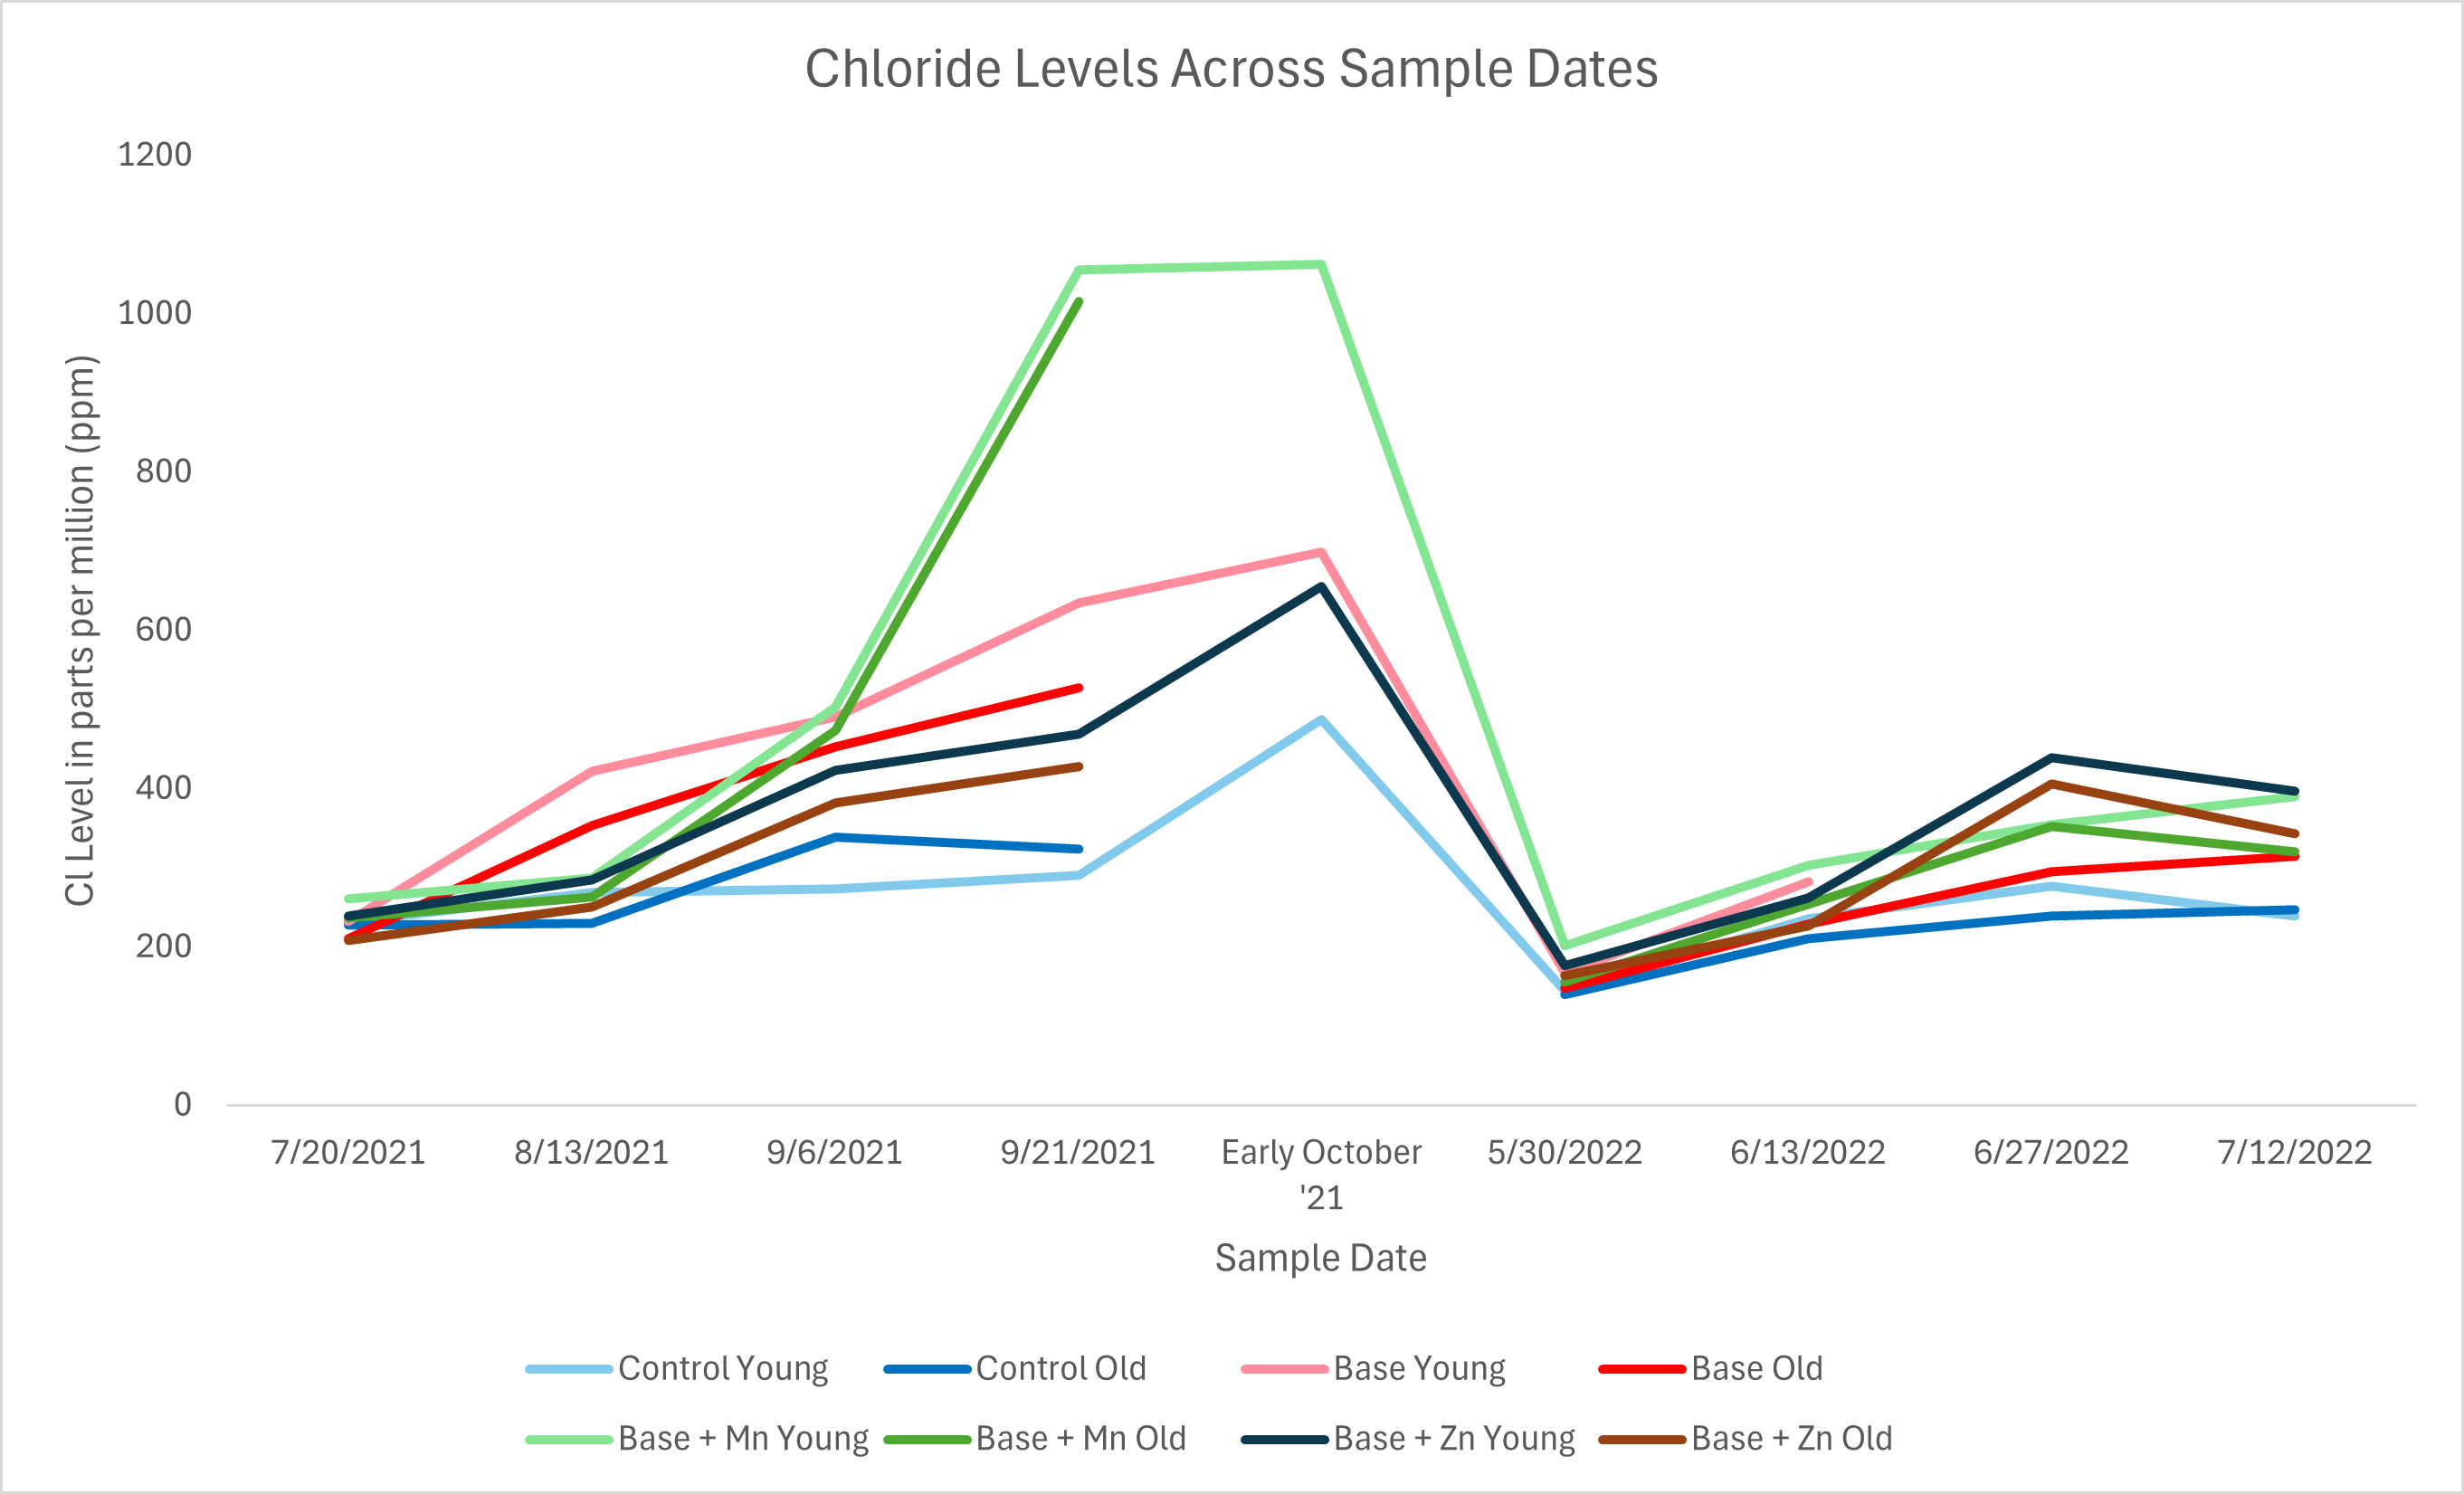
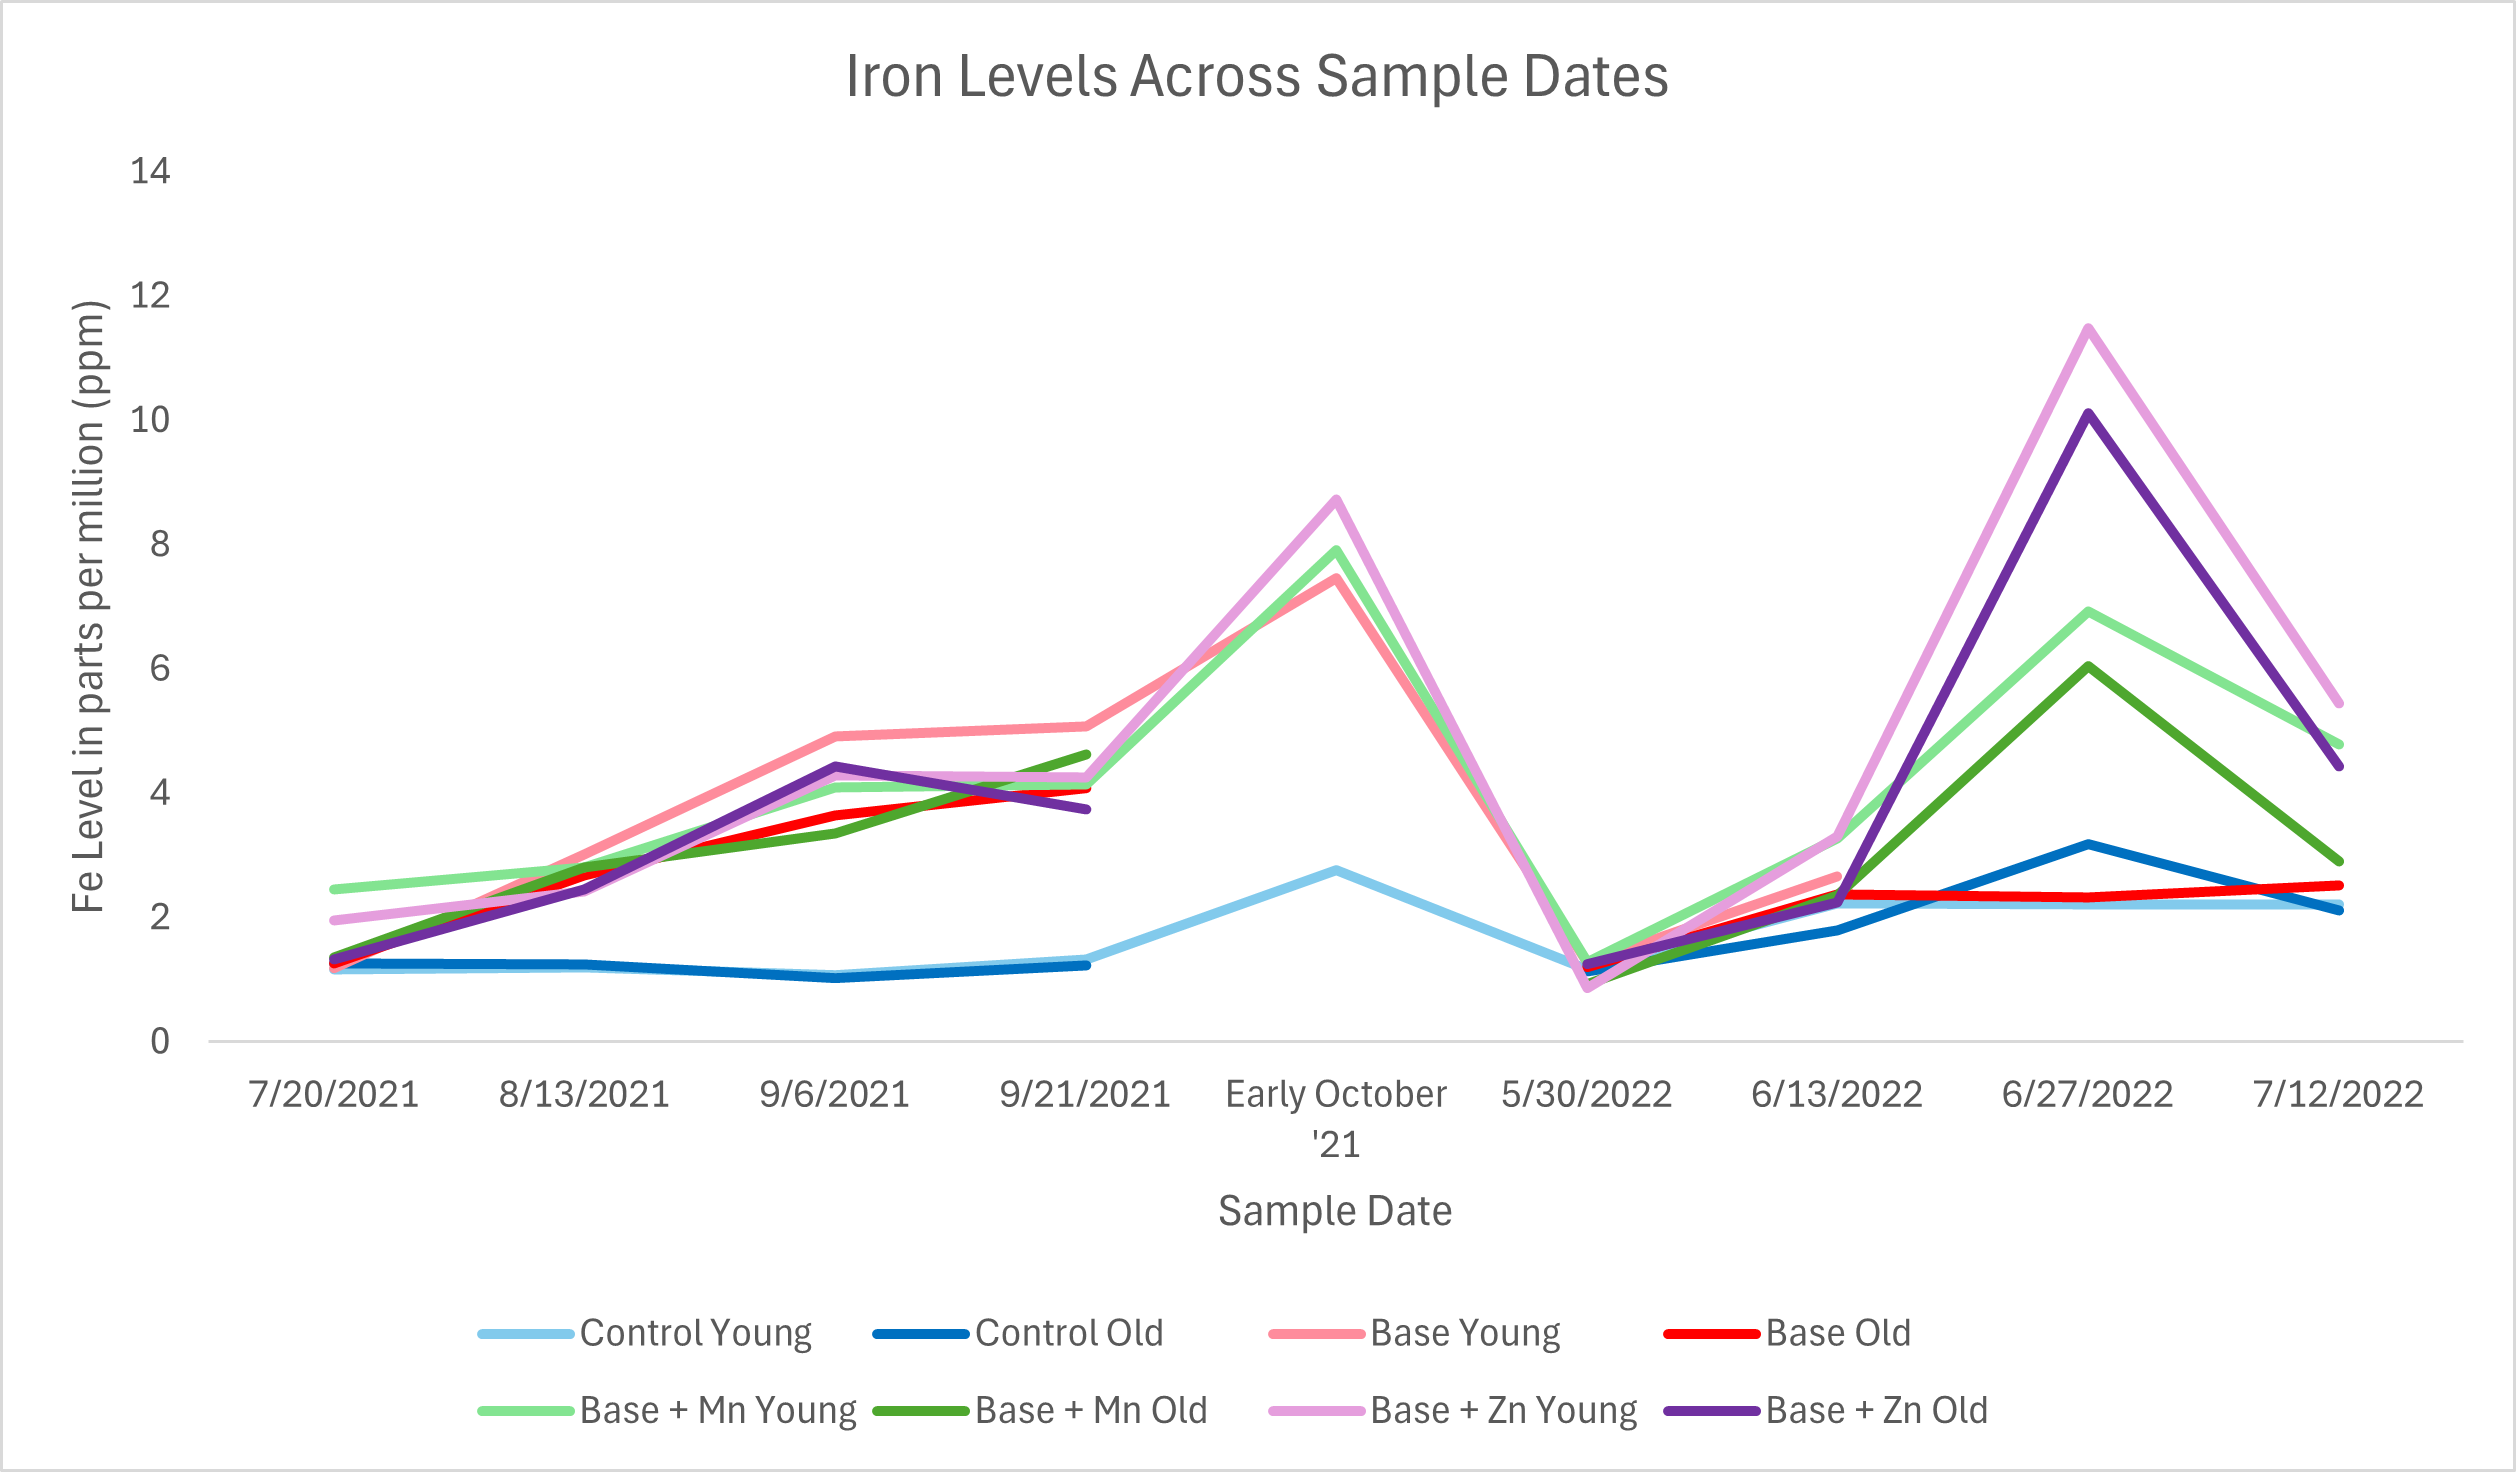
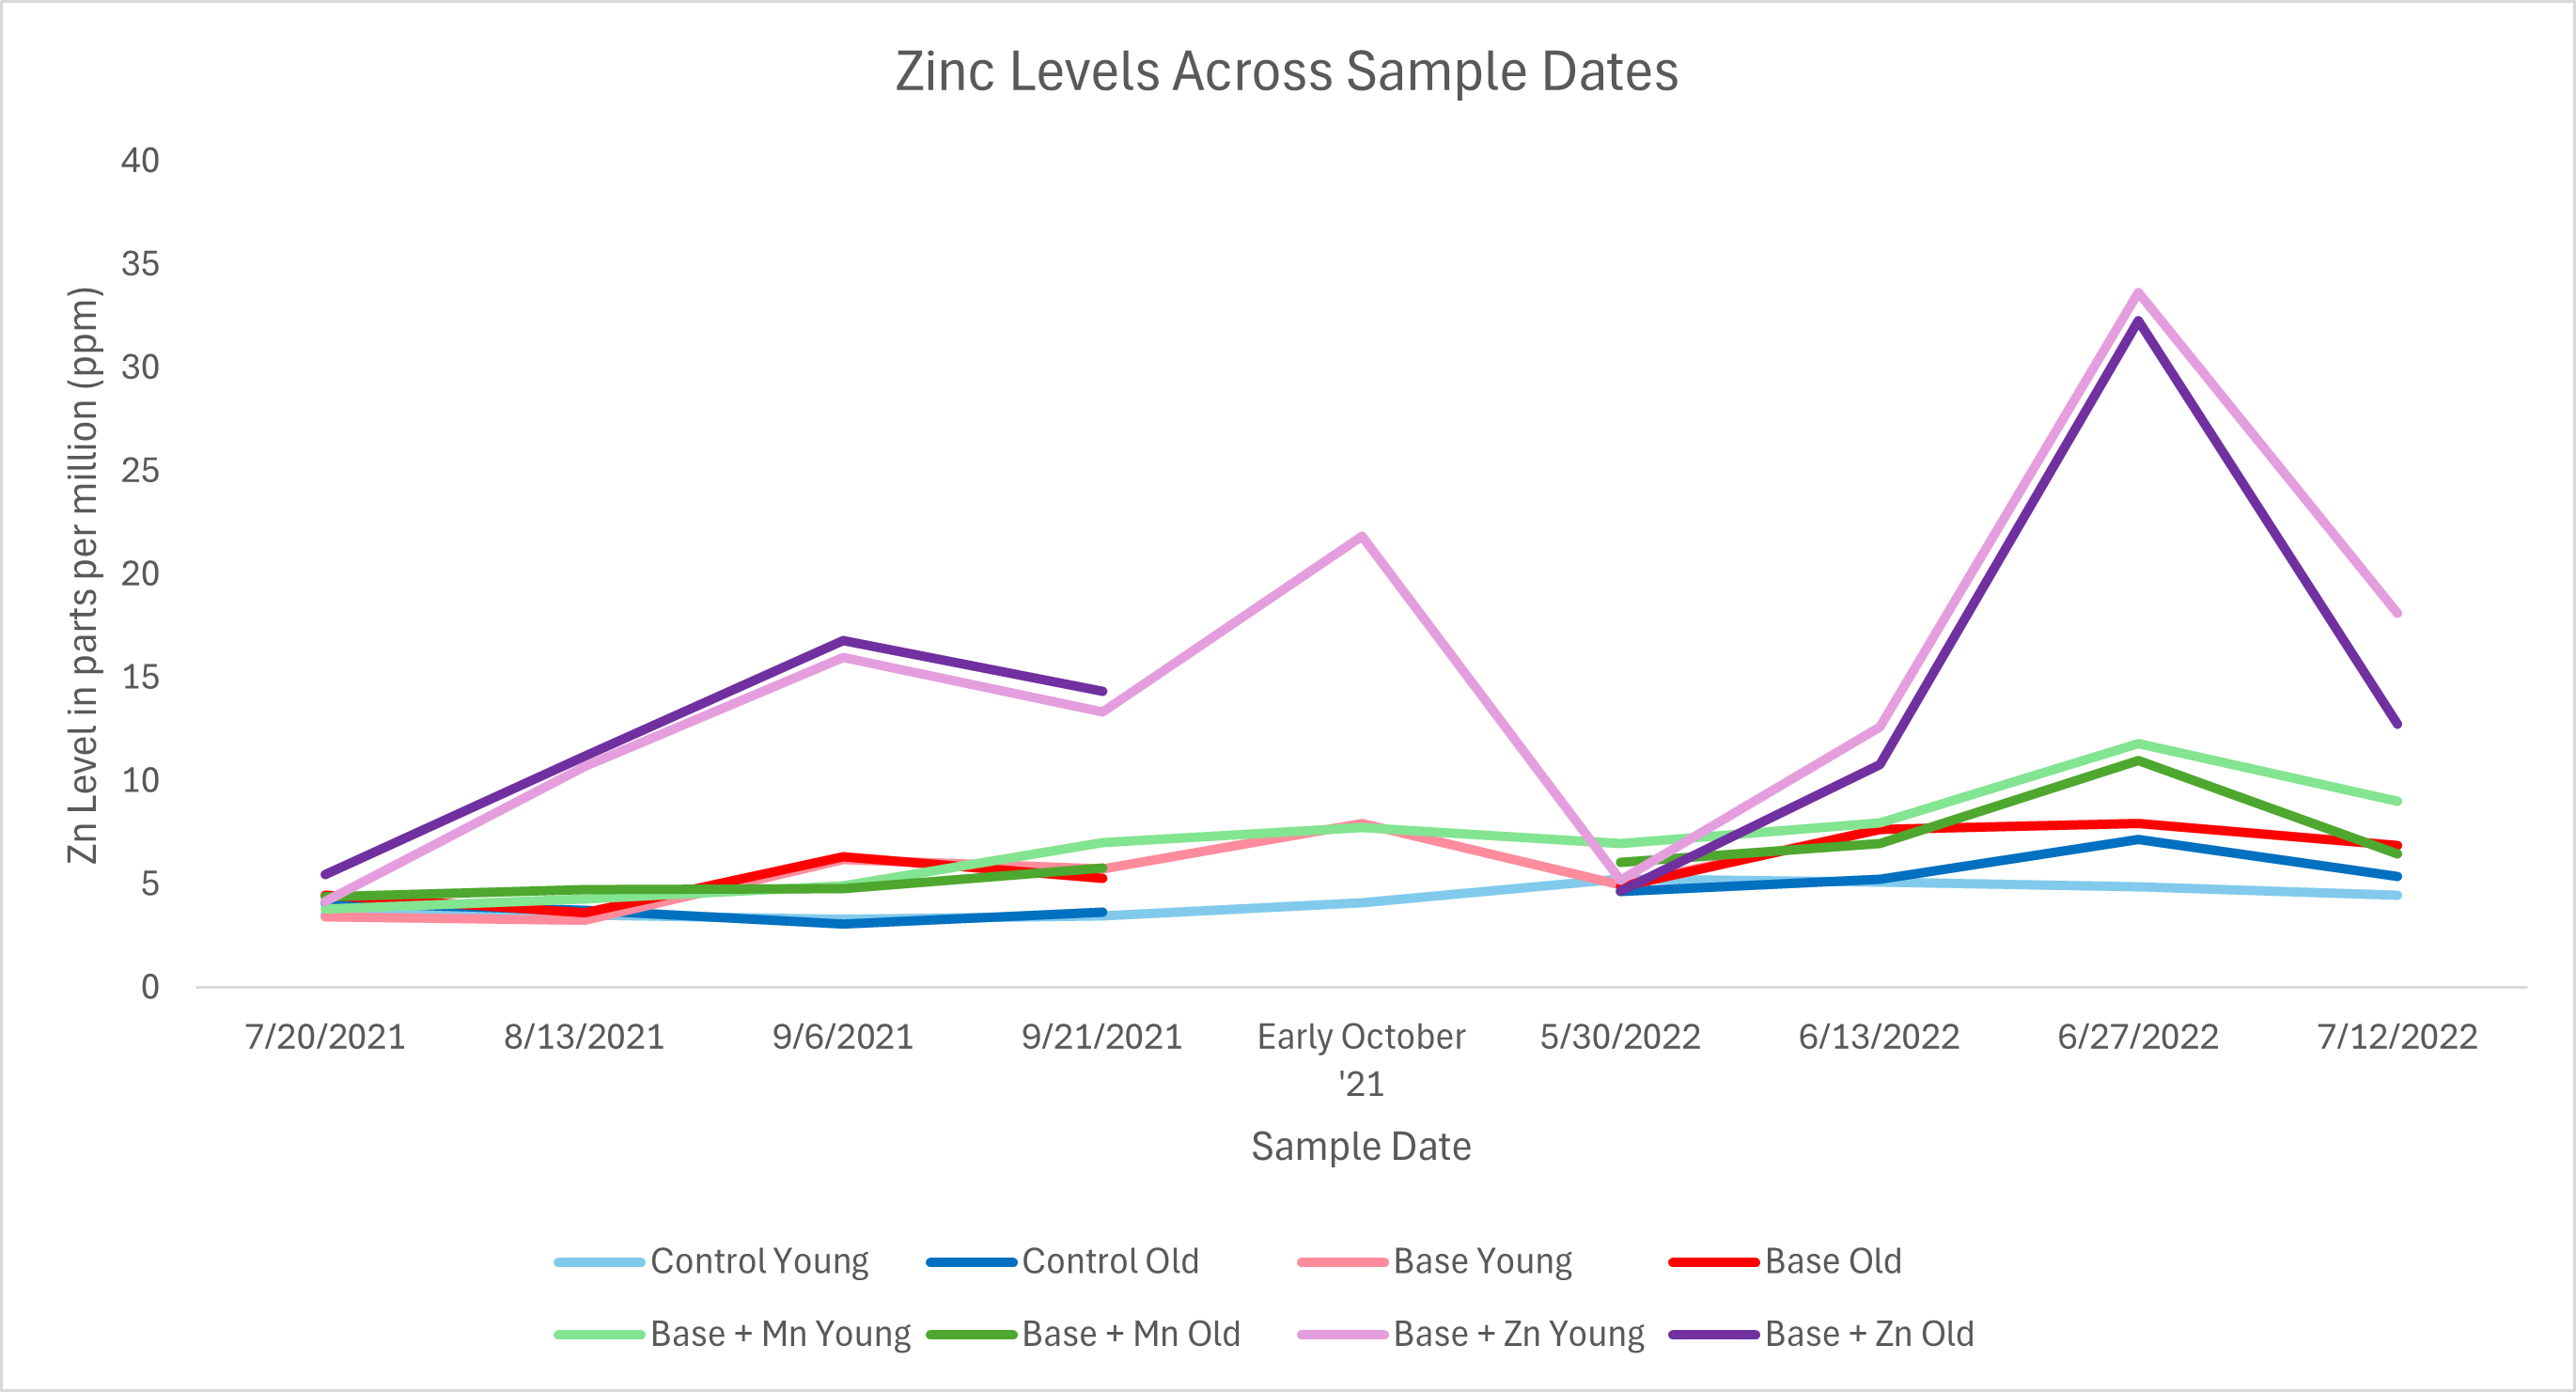
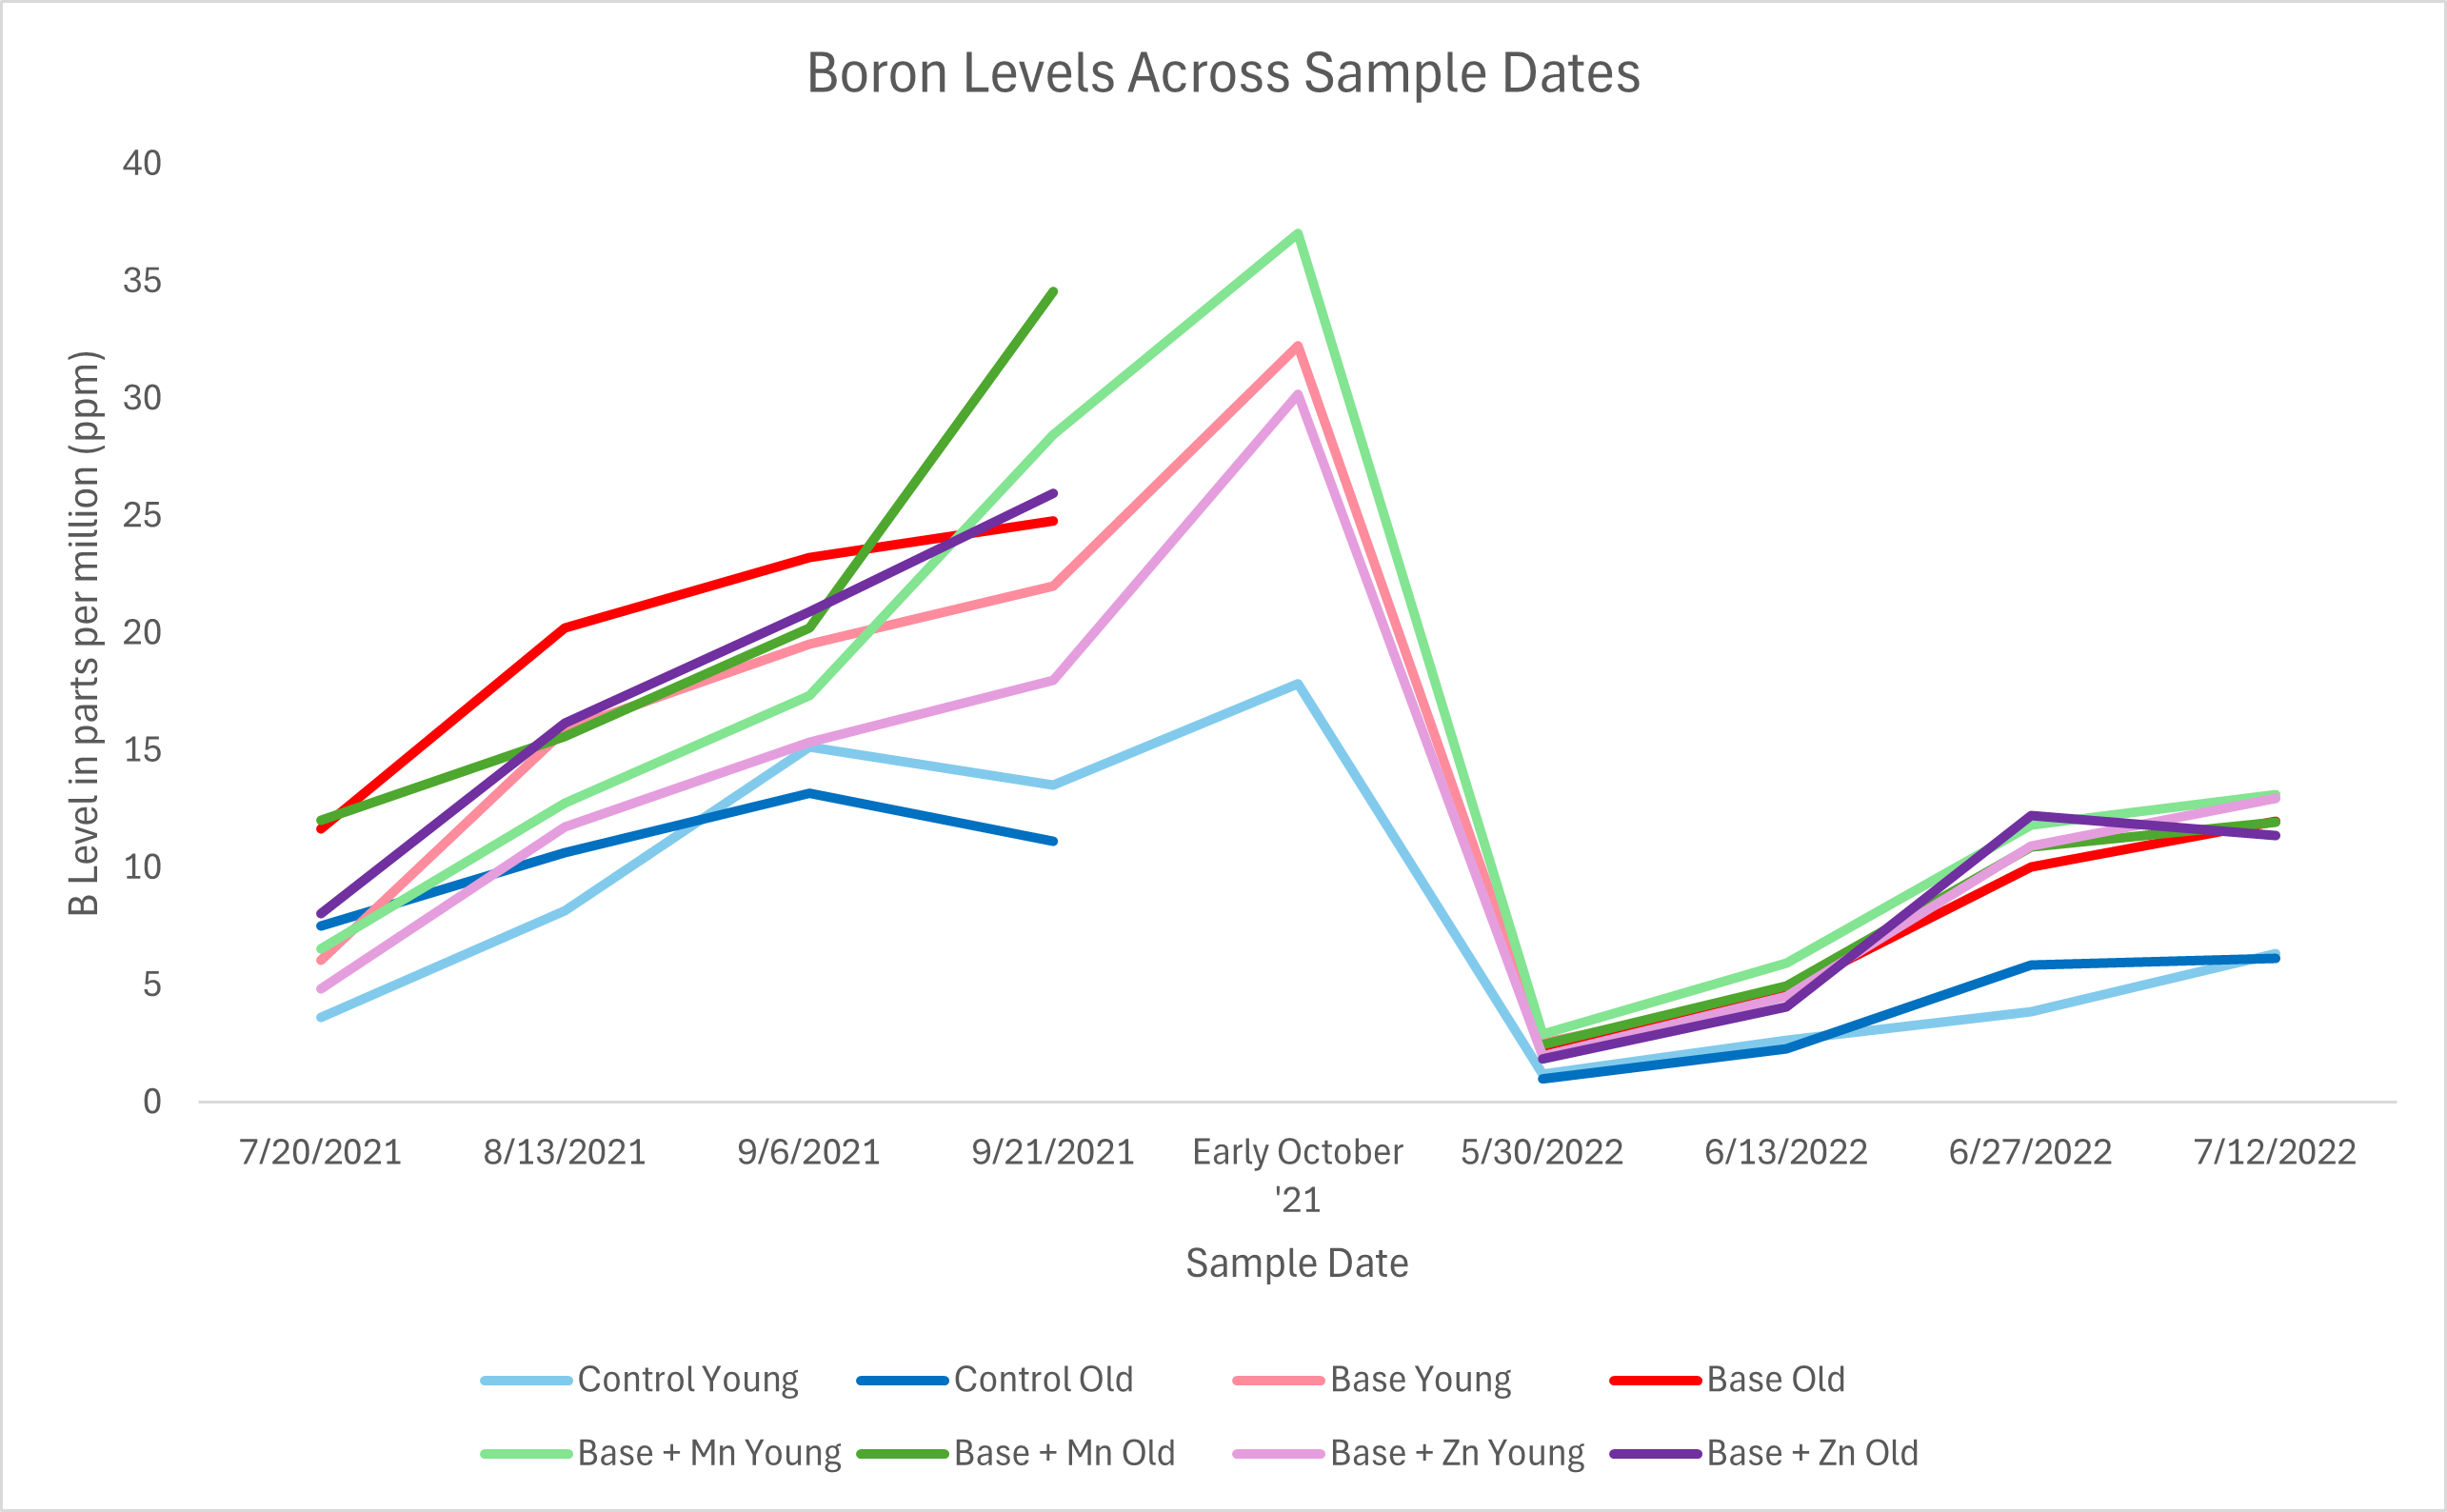
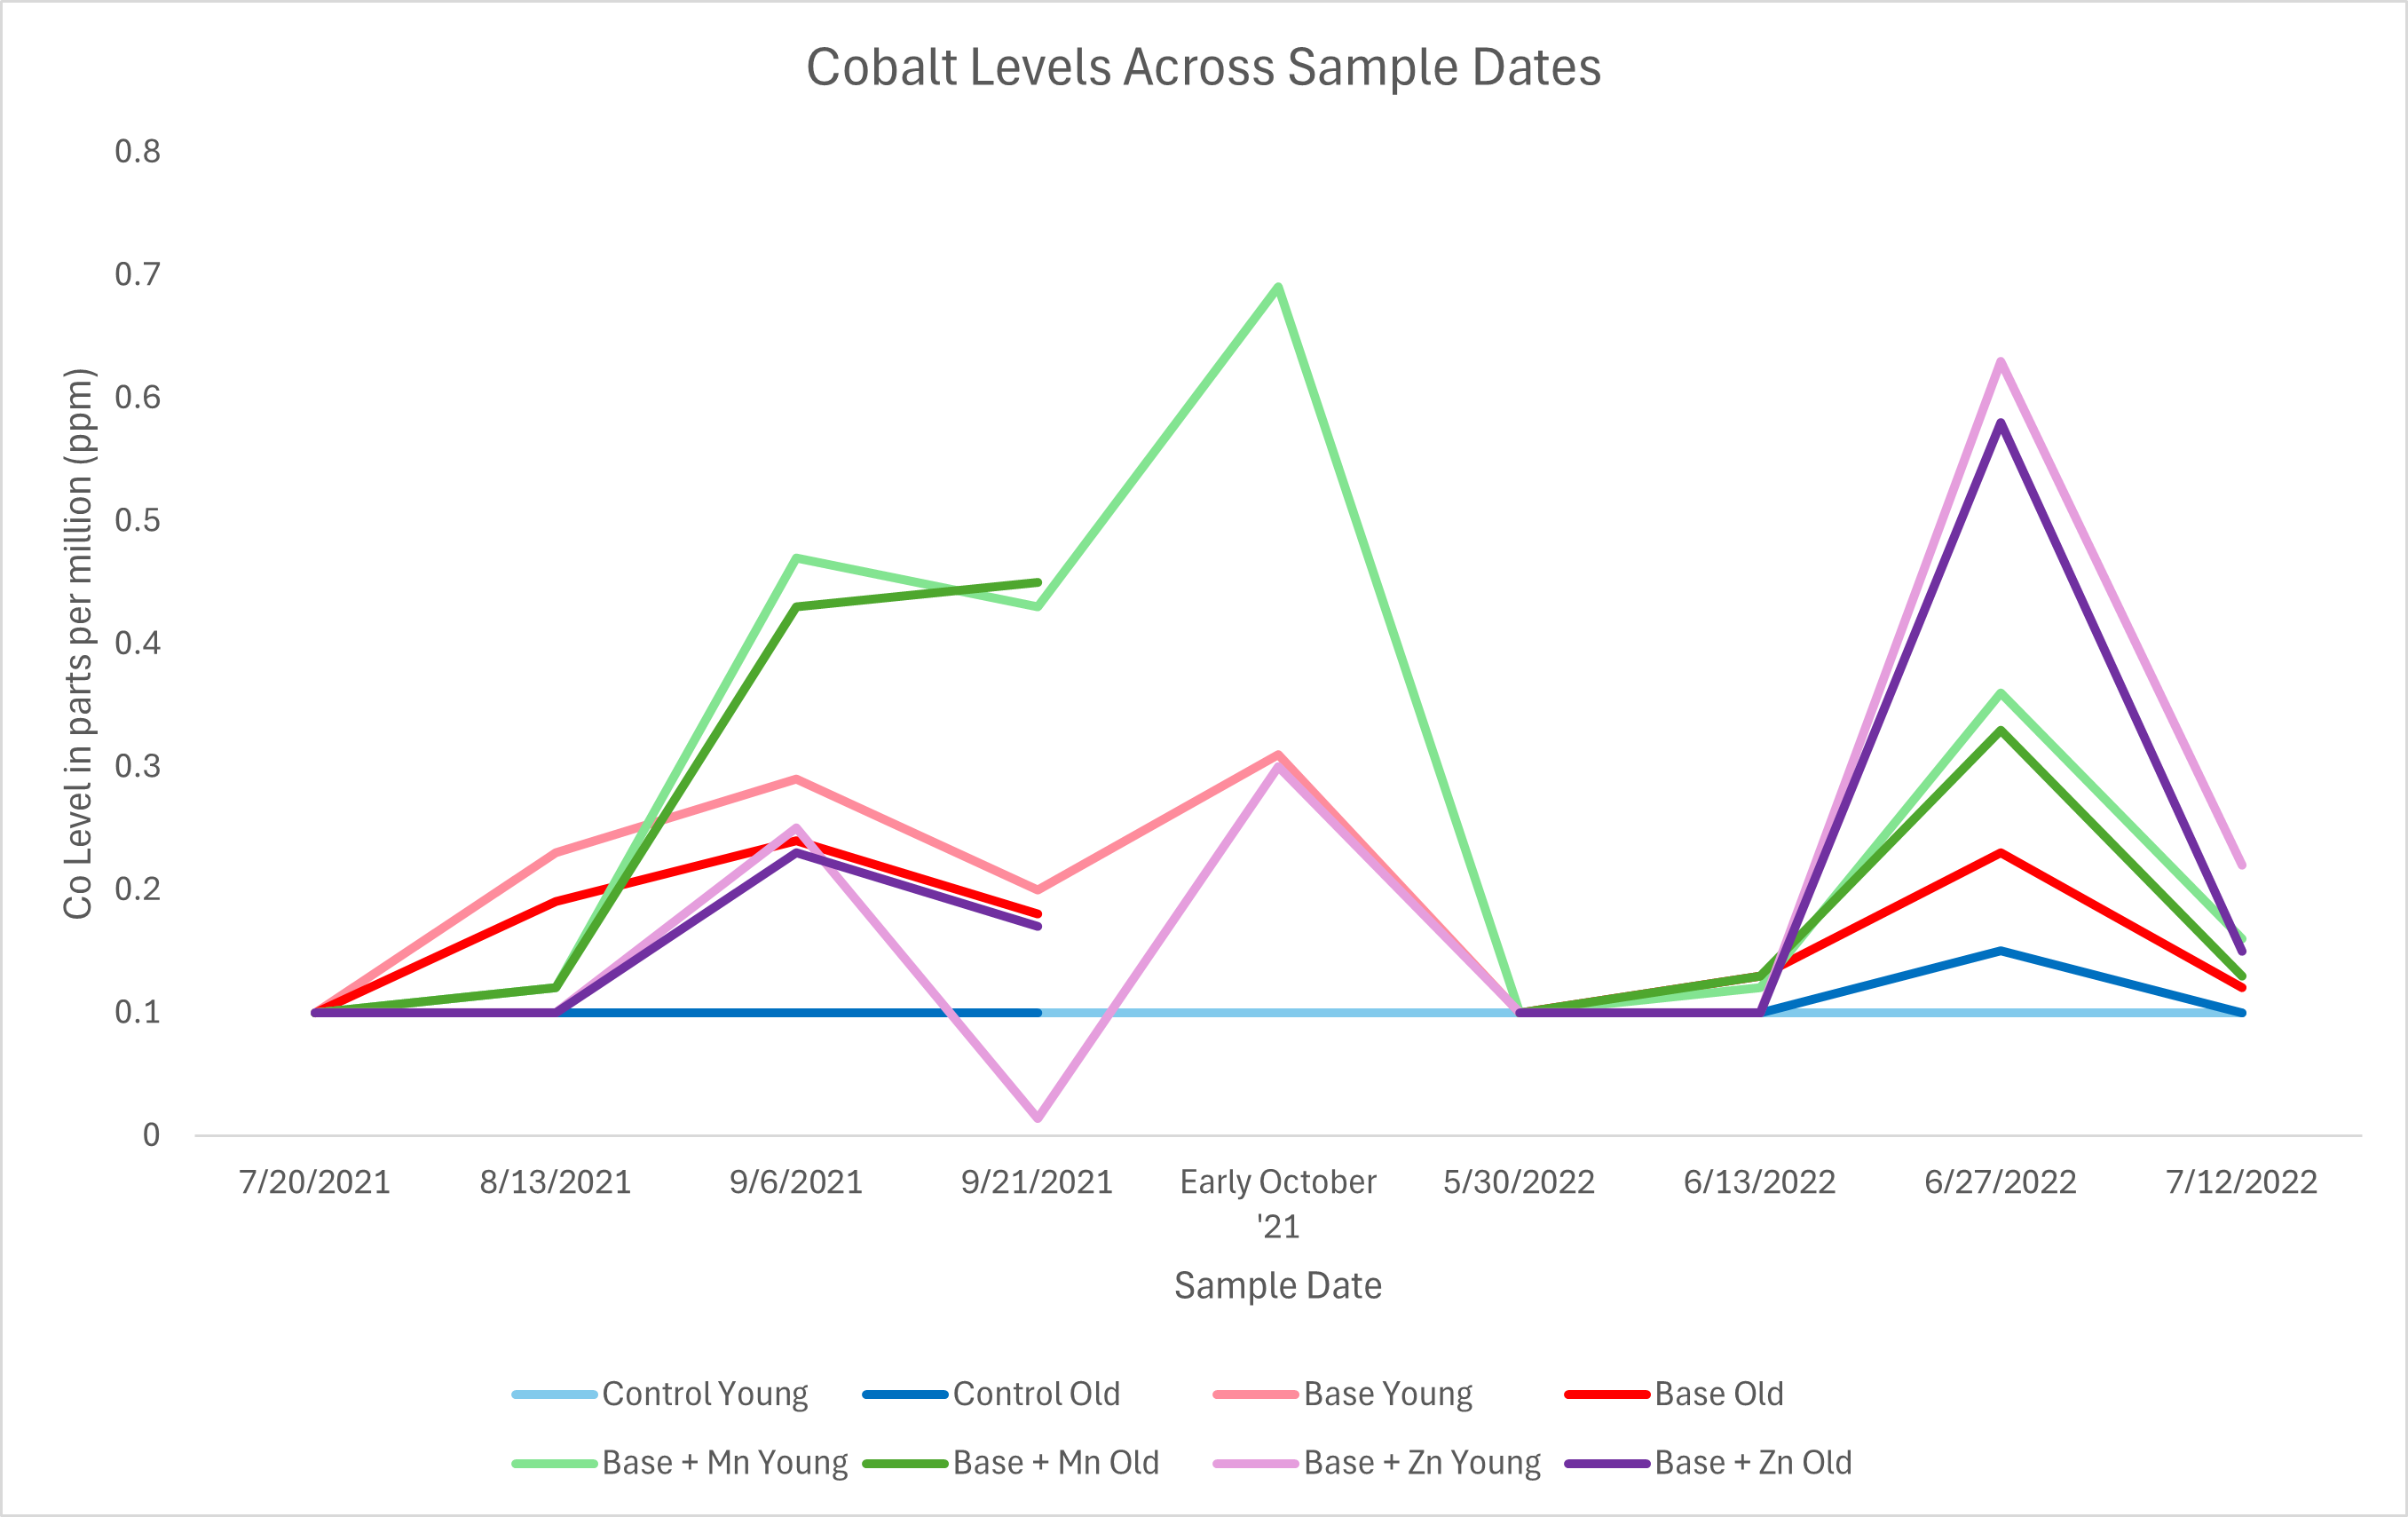
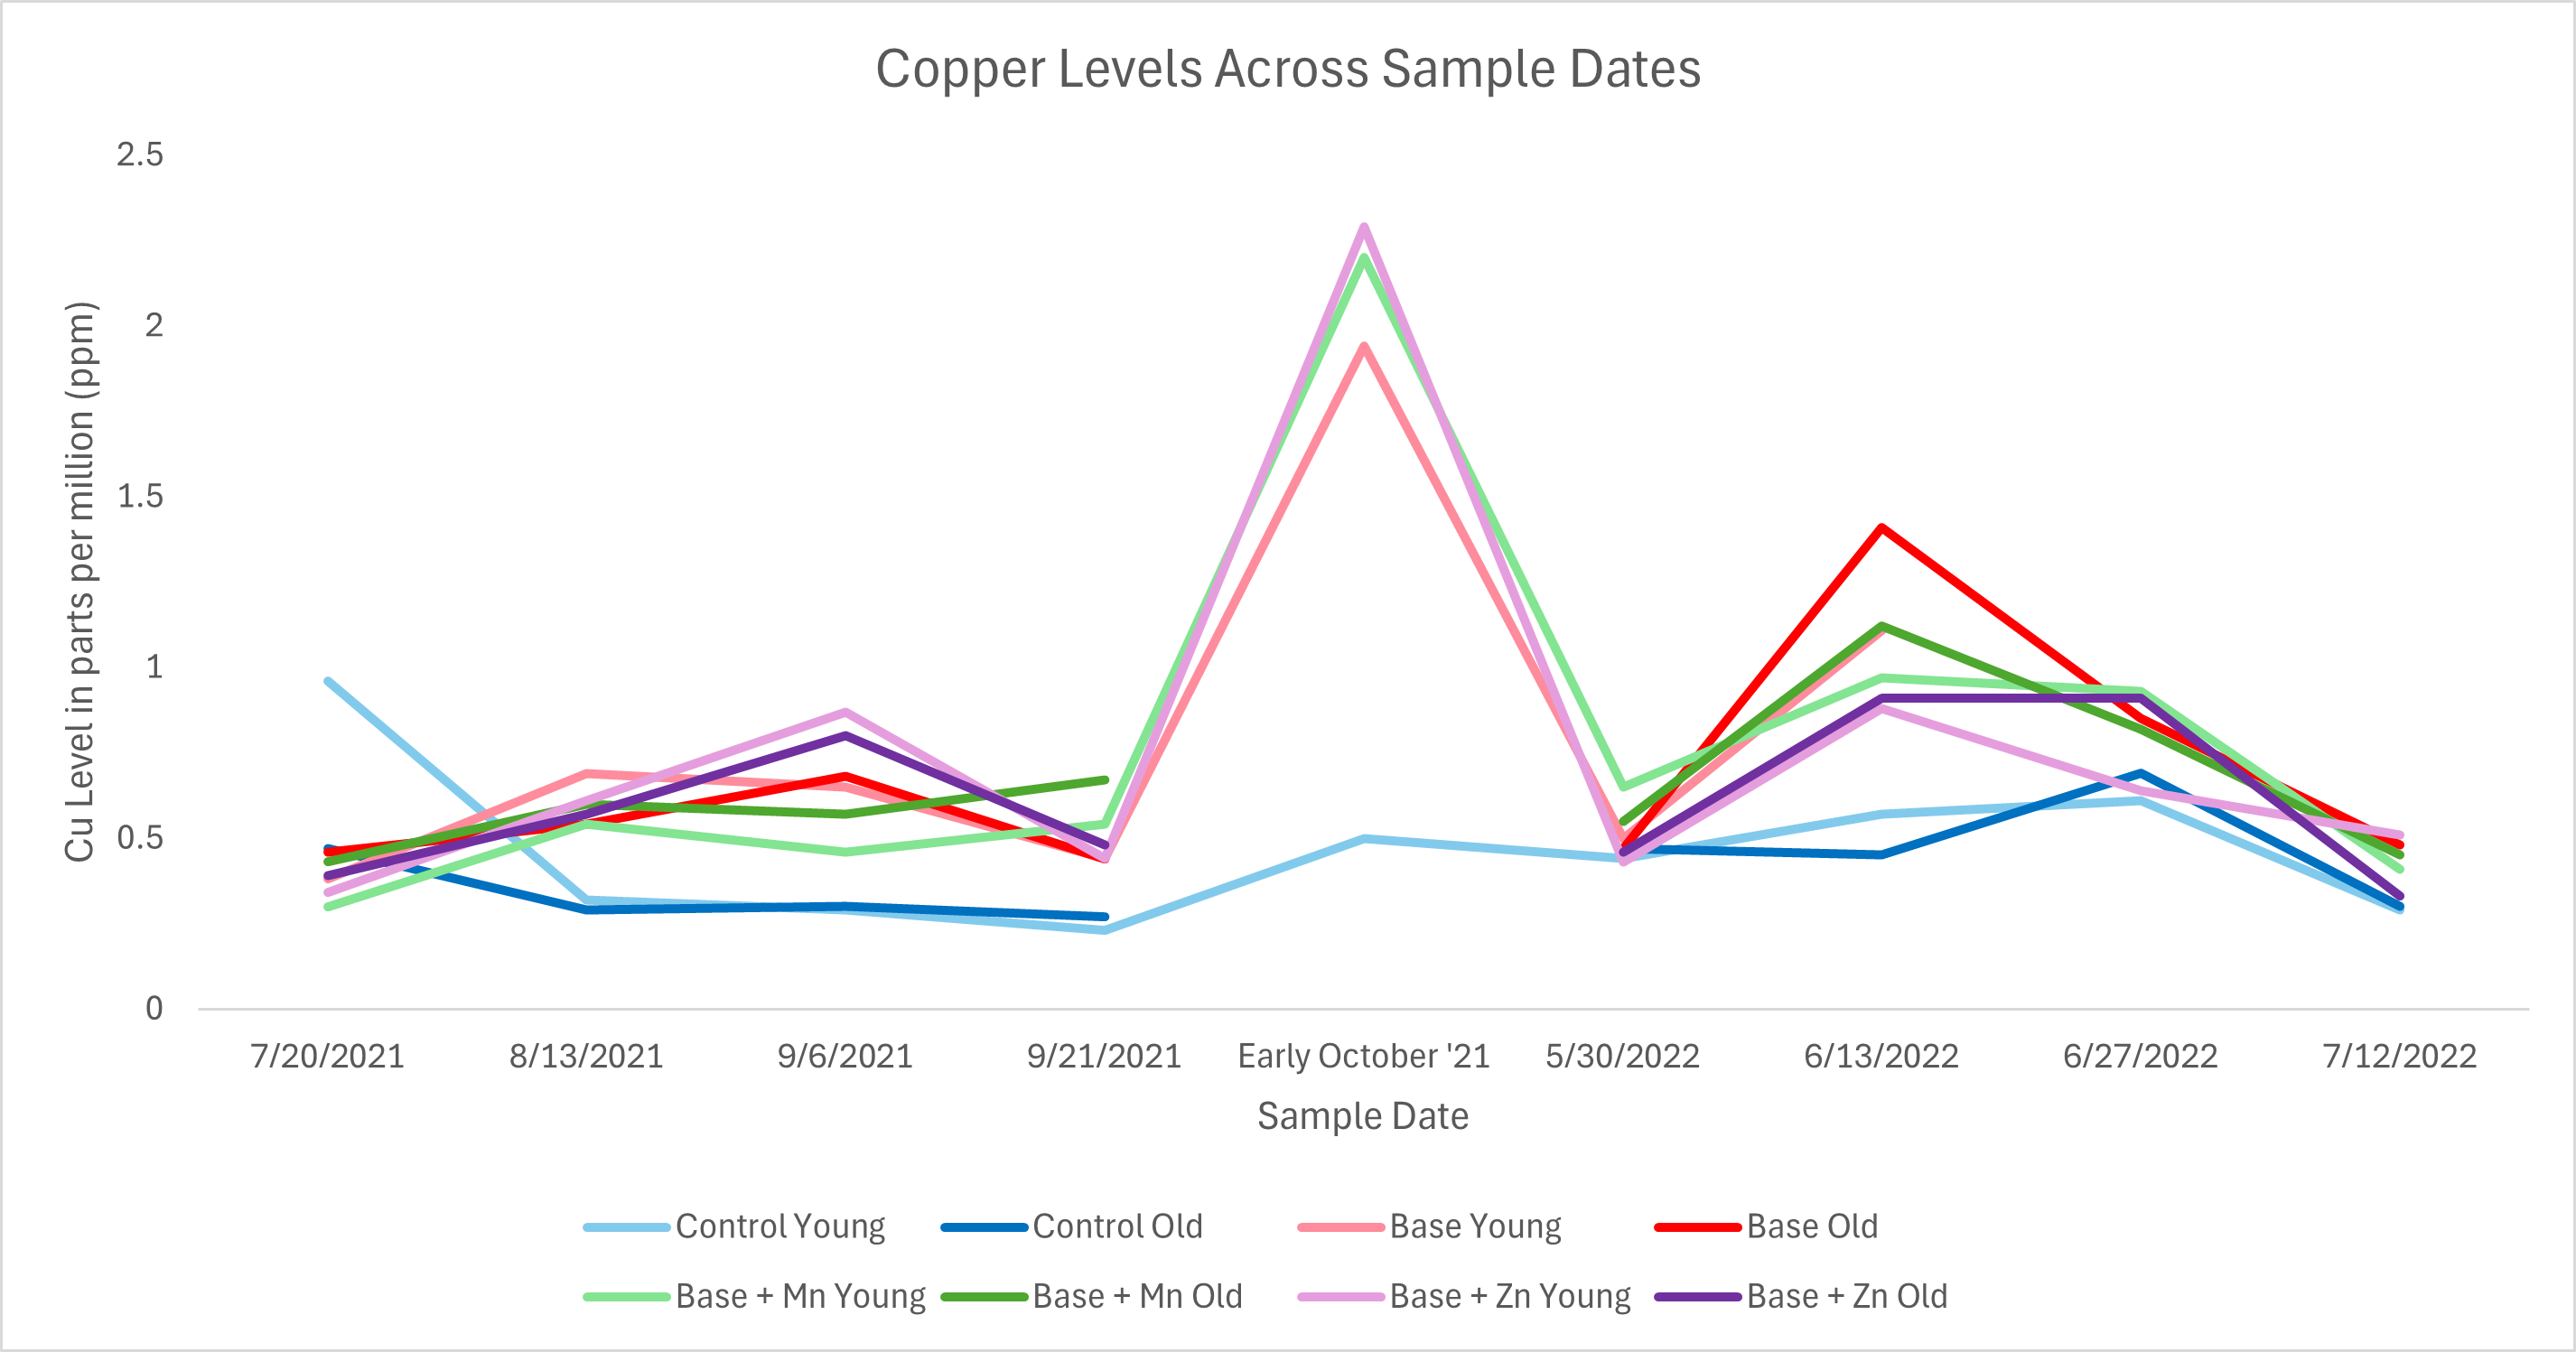
For the second phase of the project we tracked nutrient levels in the sap over time from the summer of 2021 to the summer of 2022. One of the most interesting results from this SARE project was that we were able to see what nutrients seemed to be well absorbed by the plants through the leaves and which did not. Potassium, calcium, magnesium, nitrogen and phosphorous levels did not differ significantly between the treatments and the control. On the other hand, iron, manganese, zinc, boron, cobalt, copper, and molybdenum were found in the treatments at levels significantly higher than the control for most of phase 2, indicating effective absorption through the leaves. Although this was not a stated objective of this project, it is an important finding that the application of micronutrients in the form of foliar sprays can result in a corresponding rise in sap micronutrient levels because the efficacy of using foliar sprays to address nutrient deficiencies has been a question among wild blueberry researchers. (Note: micronutrients were applied in chelated form using products from Advancing Eco Agriculture.)
In addition, the base plus zinc treatment, which included a quart of the AEA product Rebound Zinc per acre (1 oz. of soluble zinc) as opposed to the pint in the base fertilizer mix per acre (0.5 oz of soluble zinc) showed not only a significant increase in plant sap zinc over the other treatments as well as the control, but also higher levels of: calcium, iron, manganese, zinc, sulfur, and cobalt. Further research is needed to substantiate the correlation between the increase of applied zinc and the increase in the other nutrients in the sap. It is interesting to note that no sulfur or silica was applied on the plots. Other nutrients that show significantly higher levels in the base plus zinc trial, such as iron, cobalt, and molybdenum, were applied at the same rates across the treatments. This points to the complex web of nutrient interactions within the soil and plants, many of which are not fully understood.

Berry Quality
Berry quality data was collected across all plots during the harvest of 2022. We performed an analysis of variants on the data. There were no significant differences in berry ripeness between treatment and control plots.
n=48 for each independent variable in each group.
Ripeness
|
Treatment |
Average |
Standard Deviation |
|
Ctl |
0.847 |
0.134 |
|
Base |
0.836 |
0.164 |
|
Mn |
0.844 |
0.160 |
|
Zn |
0.831 |
0.155 |
Tukey’s HSD Test
|
Treatment |
diff |
lwr |
upr |
p adj |
|
Ctl-Base |
0.011 |
-0.070 |
0.092 |
0.985 |
|
Mn-Bs |
0.008 |
-0.073 |
0.090 |
0.993 |
|
Zn-Base |
-0.005 |
-0.087 |
0.076 |
0.998 |
|
Mn-Ctl |
-0.003 |
-0.084 |
0.079 |
1.000 |
|
Zn-Ctl |
-0.017 |
-0.098 |
0.065 |
0.952 |
|
Zn-Mn |
-0.014 |
-0.095 |
0.067 |
0.971 |
For skin firmness, the treatment plots that were sprayed with base fertilizer plus manganese had the firmest skin with significant p-values when compared to the zinc and base trials but incidentally not to the control.
Firmness
10^5 Pa
|
Treatment |
Average |
Standard Deviation |
|
Ctl |
1.72 |
0.588 |
|
Base |
1.681 |
0.602 |
|
Mn |
2.01 |
0.798 |
|
Zn |
1.656 |
0.661 |
Tukey’s HSD Test
|
Treatment |
diff |
lwr |
upr |
p adj |
|
Ctl-Base |
0.050 |
-0.273 |
0.373 |
0.978 |
|
Mn-Bs |
0.345 |
0.022 |
0.668 |
0.031 |
|
Zn-Base |
-0.039 |
-0.361 |
0.284 |
0.990 |
|
Mn-Ctl |
0.295 |
-0.028 |
0.618 |
0.087 |
|
Zn-Ctl |
-0.089 |
-0.411 |
0.234 |
0.892 |
|
Zn-Mn |
-0.384 |
-0.706 |
-0.061 |
0.013 |
For berry weight, the berries that had just the base fertilizer were the largest but the p-values were not significant.
Berry Weight
g/100 berries
|
Treatment |
Average |
Standard Deviation |
|
Ctl |
31.093 |
3.374 |
|
Base |
31.158 |
3.946 |
|
Mn |
29.104 |
3.733 |
|
Zn |
29.117 |
4.148 |
Tukey's HSD test
Tukey multiple comparisons of means
95% family-wise confidence level
|
Treatment |
diff |
lwr |
upr |
p adj |
|
Ctl-Base |
-0.065 |
-2.081 |
1.952 |
1.000 |
|
Mn-Bs |
-2.054 |
-4.071 |
-0.038 |
0.044 |
|
Zn-Base |
-2.041 |
-4.058 |
-0.025 |
0.046 |
|
Mn-Ctl |
-1.990 |
-4.006 |
0.027 |
0.055 |
|
Zn-Ctl |
-1.976 |
-3.993 |
0.040 |
0.057 |
|
Zn-Mn |
0.013 |
-2.003 |
2.030 |
1.000 |
Berries from the treatment plots with base fertilizer plus zinc had the highest brix readings with significant p-values when compared to the control and the base plus manganese treatments.
Brix
|
Treatment |
Average |
Standard Deviation |
|
Ctl |
12.083 |
1.327 |
|
Base |
12.698 |
1.588 |
|
Mn |
11.885 |
1.421 |
|
Zn |
13.290 |
1.027 |
Tukey’s HSD Test
|
Treatment |
diff |
lwr |
upr |
p adj |
|
Ctl-Base |
-0.615 |
-1.332 |
0.103 |
0.122 |
|
Mn-Bs |
-0.812 |
-1.530 |
-0.095 |
0.019 |
|
Zn-Base |
0.592 |
-0.126 |
1.309 |
0.145 |
|
Mn-Ctl |
-0.198 |
-0.915 |
0.520 |
0.891 |
|
Zn-Ctl |
1.206 |
0.489 |
1.924 |
0.0001 |
|
Zn-Mn |
1.404 |
0.687 |
2.122 |
0.0000056 |
We were not able to perform statistical analysis on our yield data because our fourth field containing four of the additional plots was completely eaten by bears. Yield comparisons are also difficult to make in the study because of the varying rates of blueberry coverage in the different plots as well as varying amounts of bedrock in different parts of the field.
Yield
In pounds
|
Yield |
Saddle |
Monument |
North Home |
|
Ctl |
1033 |
1260 |
1162 |
|
Base |
1057 |
1565 |
1144 |
|
Mn |
1102 |
1202 |
1243 |
|
Zn |
925 |
1108 |
907 |
Based on the results from phase one and phase two we have generated a first attempt at an ideal plant sap analysis profile for lowbush blueberries. Please note that much more research is needed with many more sap collections (about 1000 according to Nova Crop Control Labs) taken before a reliable standard can be created.
|
Working Profile for an Ideal Sap Analysis for Lowbush Blueberries |
|
|
Potassium |
1800-2400 ppm |
|
Calcium |
2500 – 3500 ppm |
|
Magnesium |
1100-1400 ppm |
|
Sodium |
7 -15 ppm |
|
Nitrogen |
350 – 450 ppm |
|
Chloride |
Lower than total N |
|
Sulfur |
450-600 ppm |
|
Phosphorous |
350 – 500 ppm |
|
Silica |
30 – 60 ppm |
|
Iron |
3-7 ppm |
|
Manganese |
500 – 800 ppm |
|
Zinc |
12 – 15 ppm |
|
Boron |
20-30 ppm |
|
Copper |
0.5 – 1 ppm |
|
Molybdenum |
? |
This project sought to assess key macro and micronutrients involved with high and low levels of production, disease resistance, and fruit quality. While we were not able to assess differences in nutrients in the sap between plants with differing disease resistance, due to weather, we were able to identify large increases of plant uptake of calcium, nitrogen, manganese, silica, sulfur, phosphorous, zinc, and magnesium among plants with high yields and fruit quality.
Another goal was to determine the extent to which production, fruit quality, and disease resistance can be increased by applying foliar sprays. No significant differences in yield or disease resistance were found between treated and untreated plots. Statistically significant differences were found between plots treated with foliar sprays and the control plots for brix and skin firmness. However, no clear conclusions can be drawn and further research is needed.
We were not able to replicate the macronutrient levels found in the sap of the best plants in the fields by using foliar sprays but we were able to raise micronutrient levels by foliar spraying chelated micronutrients. The micronutrients were well-absorbed while the macronutrients did not seem to be.
By using the sap analysis data from both Phase One and Phase Two of the project we were able to take first steps at creating an ideal sap profile for lowbush blueberries. This initial profile needs to be refined by further research.
Education & outreach activities and participation summary
Participation summary:
Youtube video: https://youtu.be/D_v6TXFWHko posted on our website. We're reaching out to UMaine Extension and Dalhousie University to see if they would like to use the video as a resource for lowbush blueberry researchers and growers.
Due to a health challenges I have been experiencing, I was not able to finish this project in time for the 2023 Wild Blueberry Conference. I hope to present my findings at the conference in 2025.
Learning Outcomes
On the farm, The Benson Place, we now have a better understanding of lowbush blueberry nutrition, including key nutrients for lowbush blueberries, and of the benefits and drawbacks of plant sap analysis and foliar sprays.
Project Outcomes
As a result of this project, we now have a much better idea of target nutrient values to shoot for when creating our foliar spray program on the farm. We also learned a very important detail which is that the macronutrients that we had been applying through foliar sprays for years were not getting absorbed by the plant. We have thus cut out the macronutrient products from our spray program thereby saving thousands of dollars. We are now looking more at granular amendments to be used for macronutrient applications. Concurrently we will be trialing at a smaller scale, new macronutrient products as well as an adjuvant to see if they will succeed at delivery macronutrients to the blueberry plants. Another great outcome for us from this project is that we are now better equipped to advocate with our organic certifiers for adding more micronutrients to our plants than had previously been thought to be ideal.
This was my first time conducting on-farm research and I encountered many challenges and learned many things. First, there is an inherent tension between the large plot size required to collect enough leaves to perform sap analysis every two weeks without defoliating the plots and the smaller plot size desired for more accurate data. If we had used smaller plot sizes of 500 sq. ft. we could have reduced variabilities for weed pressure and plant coverage and reduced the amount of bedrock in the plot. Data collected on blossom density and fruit quality from smaller plots would also be more representative.
Also, sap analysis is expensive and for lowbush blueberries, time consuming. Each test costs over $100 and takes about 2 hrs to collect due to the plants’ small leaves. The amount of sap analyses that we were able to perform were limited due to budget constraints, therefore we were not able to collect enough sap analysis in phase one to perform statistical analysis on the results. If I were doing this project again I would have separated the project into two, starting with just phase one using the available SARE budget to perform many more sap analyses in phase one which could have then been statistically analyzed.
Next, one of our fields containing four plots became overgrown and the berries were eaten by bears. This meant that we didn’t have enough yield data to perform statistical analysis nor were we able to perform statistical analysis on post treatment sap data.
Finally, because all of the plots, including the control had been sprayed with foliar sprays in previous years, there was not a true control. The significance of this is not known, however, in 2023 we were able to perform sap analysis on a previously unsprayed field and compare it to sap analysis collected on the same day from one of our fields that had been sprayed for many years. Large differences existed between nutrient levels indicating that the benefits of foliar sprays may be accumulative.
At the conclusion of this study, there are some ideas that come to mind for further research. First, expanding the data set on sap analysis done on “best” and “worst” plants from fields across a wider geographic range such as in Maine and Canada, that are both fertilized and unfertilized, would provide a more robust picture of what an ideal sap analysis would be. Additionally, the picture could be further refined by looking at sap analysis across a wide range of fields for specific times of year.
Also, it would be very useful to be able to apply macronutrients to the blueberry plants through foliar sprays. Therefore, trialing other products, for example from AEA and Ferticell, to see if they can be better absorbed through the lowbush blueberry leaves, would be a further direction for investigation.
Additionally, using sap analysis on several farms over several years to better understand mummy berry susceptibility would be a worthwhile research project.