Final report for FNE22-004
Project Information
Two drainage water management systems were monitored throughout the study period. The manual water control structure was manually adjusted throughout the year , while the automated water control structure utilized sensors and an online system to manage the water table in real time. The latter provides an easier real-time control of the timing of water discharge from tile systems, does it remotely without the producer having to physically manage water control gates in the field, and provides for greater precision in the timing of management actions. Flow and nutrient concentration data was collected from each system for comparison.
Daily rainfall data were obtained from a publicly accessible online weather station located approximately five miles away. From March 2023 to October 2024, water levels at both the manual and automated water control structures were monitored using an In-Situ Inc. level logger and a builtin level reader, respectively. Additionally, weekly water samples were collected from each control structure between June 2023 and October 2024, and nutrient concentrations (nitrate and dissolved phosphorus) were analyzed using the NuLab wet chemistry analyzer at ShoreRivers’ facilities.
Overall, the automated had less nutrient inputs downstream due to more precise drainage water management during higher flow events. Nonetheless, any form of controlled drainage is an effective way to reduce the volume of water leaving the field and thereby decreasing the amount of nutrients.
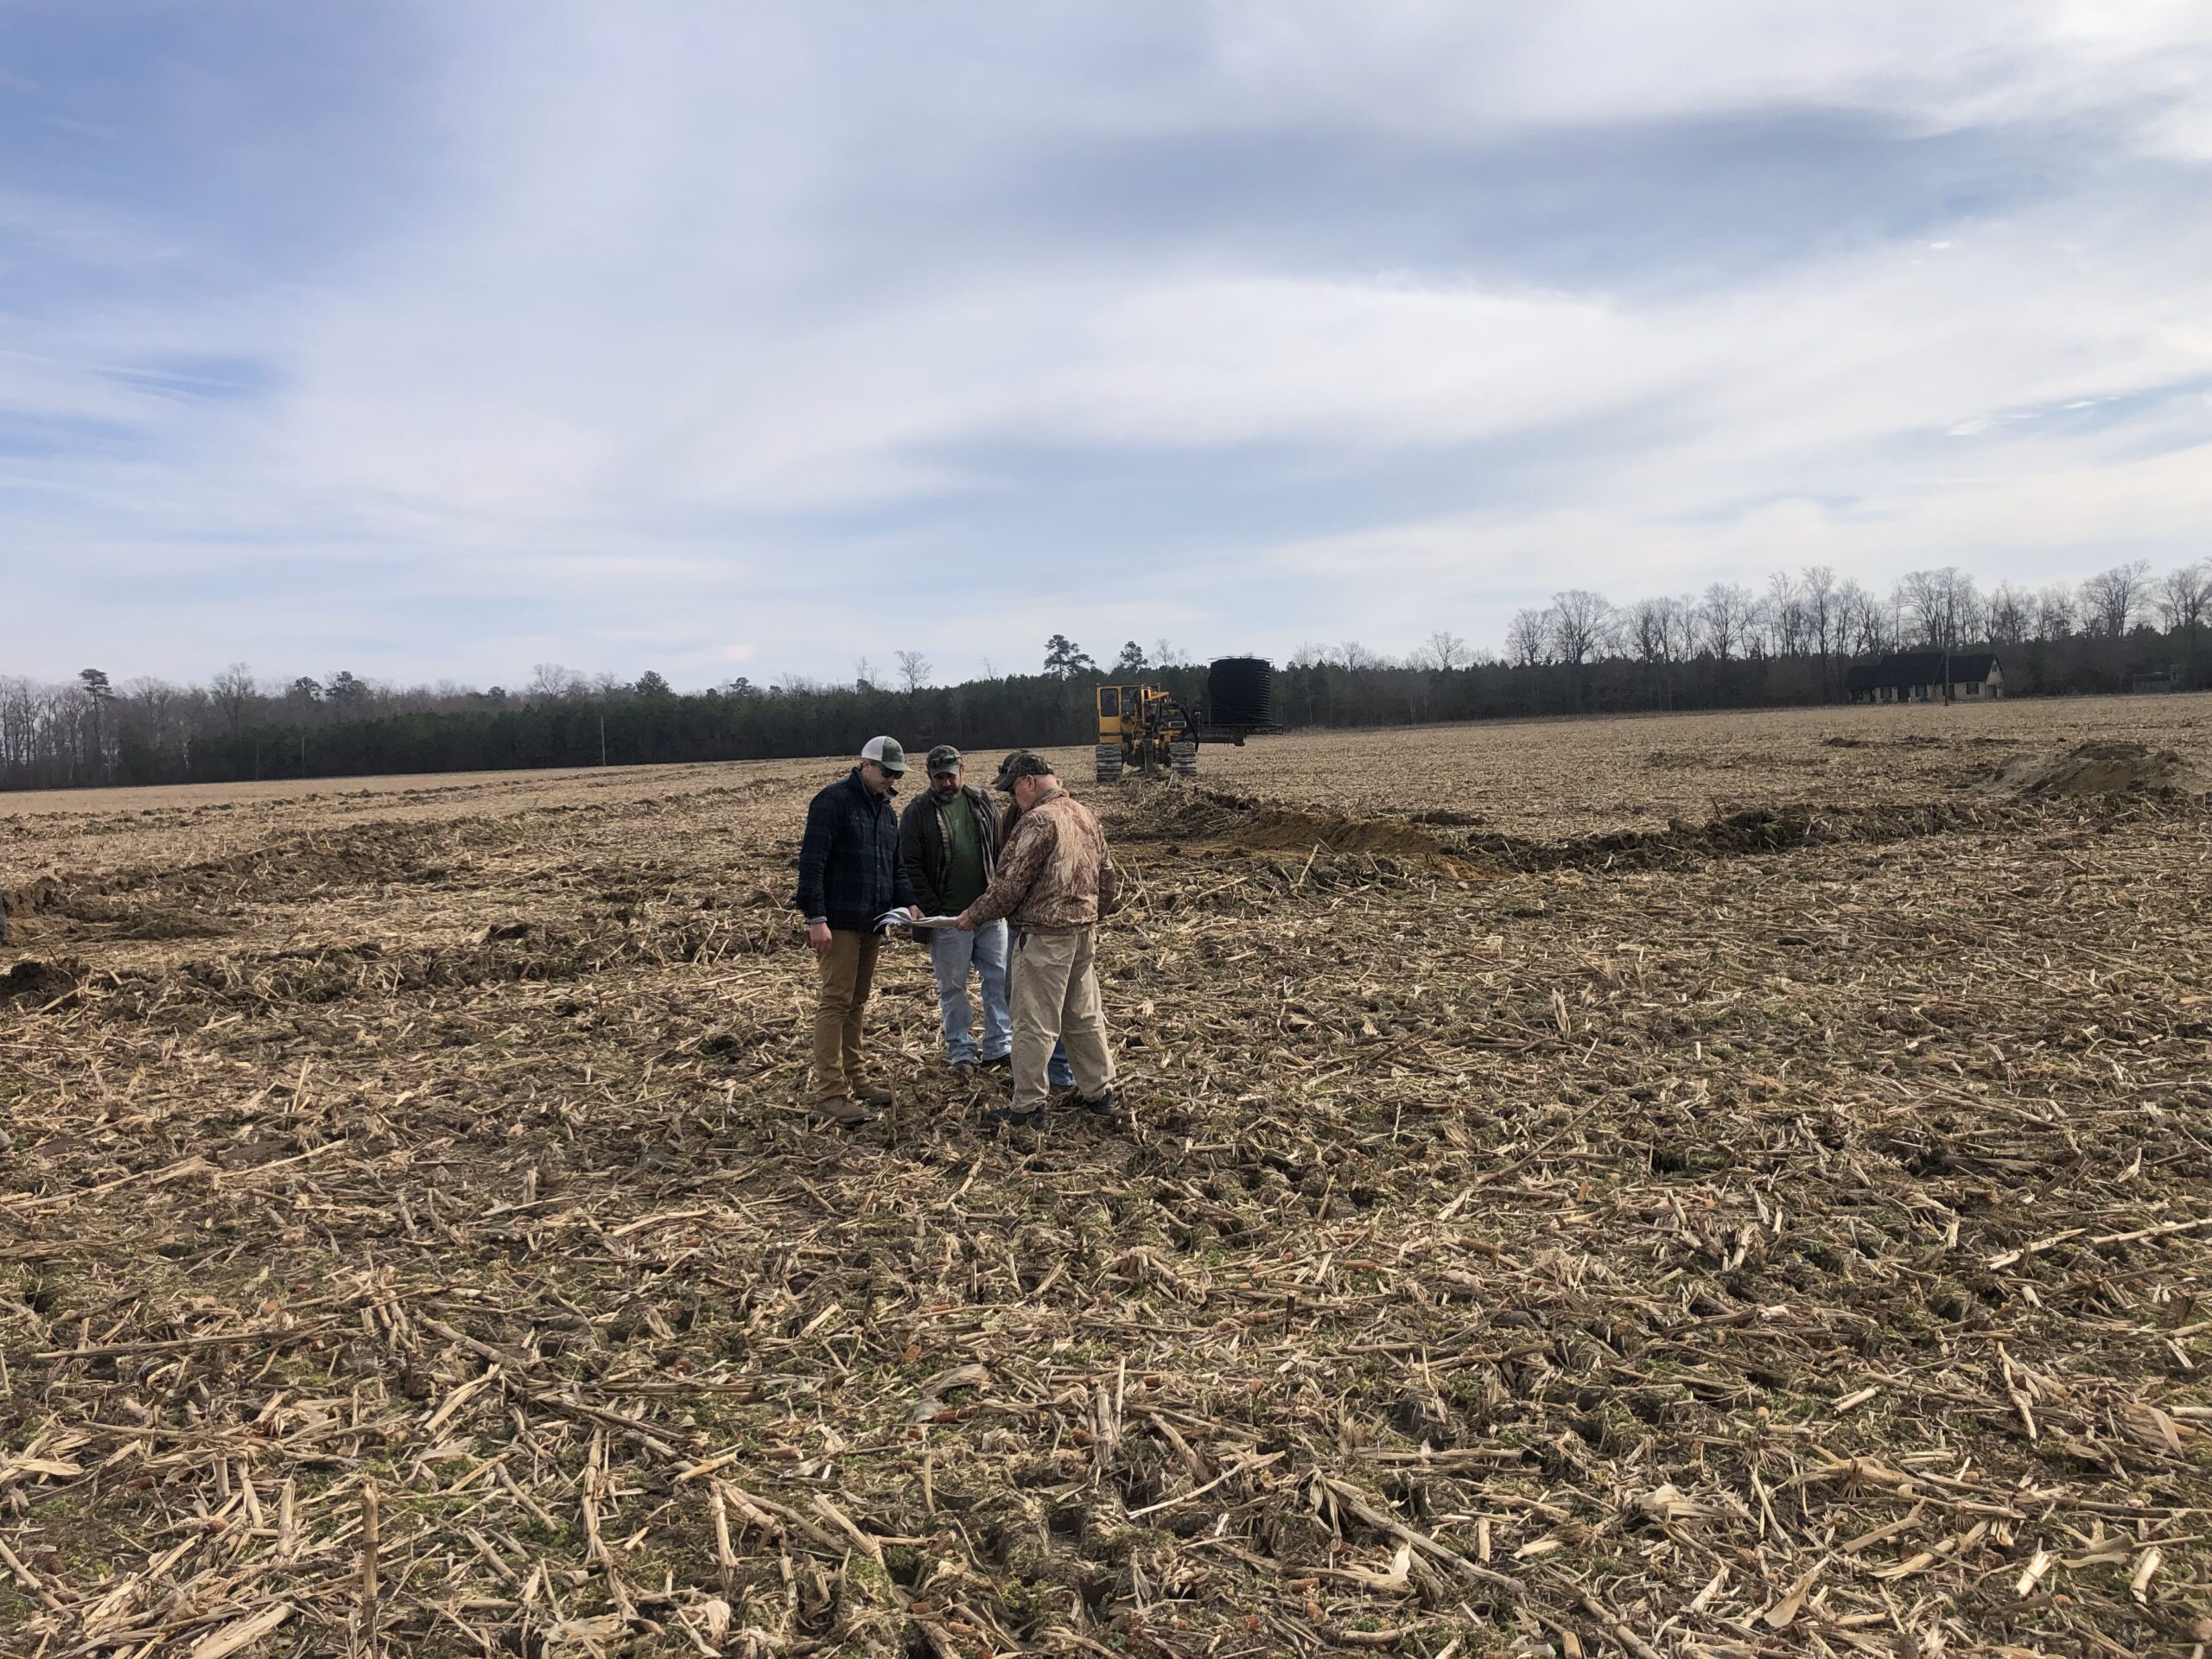
Project installation was completed on February 9, 2023. A pop-up field day was held on February 7, 2023 during the installation of the project. Approximately 30 producers, government officials and local soil conservation staff attended.
This project seeks to compare the effectiveness of the Automated Drainage Water Management system versus the Manual Drainage Water Management system. The project also seeks to measure the impact of the DWM on crop growth, aerated soil root zone, nitrogen load reduction and overall water quality impact.
The overarching goal/objective of the DWM projects are to help advance Delaware's WIP III implementation goals. DWM helps reduce total nitrogen (TN) and DWM projects are credited with 30% TN load reduction annually. The DWM project is located in both the Nanticoke River watershed and the Marshyhope sub watershed. This project will install subsurface drainage tile lines in agricultural fields following a certified DWM plan. The project within this proposal has drainage tile designs optimized for DWM> The Chesapeake Bay Program has approved DWM as a best management practice. Delaware has a 3,513,517 lbs. of nitrogen load reduction that must be achieved by 2025 and this project will help achieve a portion of that load reduction goal. It is estimated that the nitrogen load reduction from this project will be 507.33 lbs. /yr., DWM is credited annually, but has 10 year practice standard per United States Department of Agriculture-Natural Resource Conservation Service (USDA-NRCS) and the Chesapeake Bay Program, thus totaling 5073.3 lbs. over the 10-year project life. Agriculture is the largest source of nutrient and sediment pollution to the Chesapeake Bay, but the agricultural sector provides the most cost-effective options to reduce nutrient and sediment loss to improve water quality. Drainage water management controls the volume and timing of drainage to ensure there is sufficient drainage for agricultural production while reducing negative water quality impacts through reduced water loss (load reduction) and better nitrogen utilization by crops, and denitrification within the soil profile. DWM projects use structures for water control to manage subsurface drainage tile lines in agricultural fields following a certified DWM plan.
DWM systems within a conservation systems approach offers significant potential to improve water quality as well as enhance farm economic viability via increased crop yields. Appropriately engineered, installed and managed subsurface drainage also helps build long-term resilience to agricultural land by helping reduce the impacts of variable and intense precipitation events by reducing flood risk and protecting crops and soil from inundation that can kill crops and cause compaction and loss of soil health. Oversaturated soils during harvest was seen in 2019 and 2021 throughout the Delmarva peninsula causing delayed harvest, stuck equipment, compacted soils and crop loss. This system, managed properly should allow farmers like myself to manage sediment loads, nitrogen loads while harvesting on time, maintaining equipment properly, have less soil compaction and great crop yields.
Twin Cedar Ag is a Delaware Century Farm, the farm has been in my family since 1903. I take the responsibility of continuing my ancestor’s legacy seriously and wish to pass the love of the land and agriculture onto my two children. I first became hands-on involved in agriculture at 8 years old with my first 4-H project. I became the 4th generation producer on the family farm in 2003. The farm consists of 129 tillable acres and 100 wooded acres. The tillable acres are utilized for corn, soybean, and forage and pasture production. Our farm operation is a part-time occupation. I am employed as a Agricultural Equipment Salesman and my wife is an Agriscience Educator. My wife and I perform all farm duties including soil preparation, planting, pesticide application, harvesting and resource management.
Cooperators
- - Technical Advisor
Research
Methods as proposed:
This project will compare the yield impacts, water quality impacts (nitrate-nitrogen concentration and load), and water volumes managed using manual drainage water management (DWM) and automated drainage water management (ADWM).
This project will compare an automated drainage water management project that manages 39.2 acres of tile drainage and a manual drainage water management structure that manages 38.9 acres of tile drainage. The fields are adjacent to each other and follow the same cropping systems, have similar soils, and will follow nutrient management plans so exact nutrient applications will be known.
Water quality will be assessed using grab samples that are collected every week if there is water in the system. Weekly sampling should be able to provide estimated nitrate-nitrogen loads with a 90% probability that the calculated nitrate-nitrogen loads are within ±15% of the “true” nitrate-nitrogen load (Wang et al., 2003). Nitrate-nitrogen samples will be collected on site from the water controls structures near the outlets of the manual drainage water management project and the automated drainage water management project. Samples will be filtered on site and stored in 50 ml plastic bottles. Samples will be frozen and taken monthly to a local analytical lab (University of Maryland, University of Delaware, or AgroLab) to analyze nitrate-nitrogen concentration.
Water discharge volume will be calculated using water pressure transducers and calibrated v-notch weirs. The automated drainage water management structure has an installed water level logger so no additional equipment is needed. The manual drainage water management structure will have an In-Situ Level TROLL 400 water depth logger installed that will track water height (inches) on a 5 minute interval. Discharge volume will be calculated as water height over the v-notch following Christianson et al. 2019;
Q = 1.44H2.28, with Q in gallons per minute and H in inches
Nitrate-nitrogen load will be calculated from nitrate-nitrogen concentration multiplied by the discharge volume. Discharge volume managed within the field will be calculated as water elevation in the water control structures multiplied by the acres managed in the field.
Yield will be tracked by a harvest monitor that is part of the combine. Yield data will be mapped using geospatial software to compare between DWM and ADWM sites and years.
All comparisons will be made between the two treatments (DWM and ADWM) to describe differences in nitrate-nitrogen concentration and load, water volume that leaves the system, water volume managed within the field, and yield impacts.
References:
Rosen, Timothy, and Laura Christianson. 2017. "Performance of Denitrifying Bioreactors at Reducing Agricultural Nitrogen Pollution in a Humid Subtropical Coastal Plain Climate" Water 9, no. 2: 112. https://doi.org/10.3390/w9020112
Christianson, L.E, Christianson, R.D., Lipka, A.E., Bailey, S.B., Chandrasoma, J., McCoy, C., Preza Fontes, G, Roh, J., Sanchez Bustamante Bailon, A.P., Wickramarathne, N.M, and R.A Cooke. 2019. "Calibration of Stainless Steel-Edged V-Notch Weir Stop Logs for Water Level Control Structures" Applied Engineering in Agriculture, 35(5), 745-749. https://doi.org/10.13031/aea.13350
MANUAL SYSTEM
• Installation date: February 2023
• Acres managed: 37.7 acres
• Water control structure size: 12 inches
AUTOMATED SYSTEM
• Installation date: December 2021
• Acres managed: 38.8 acres
• Water control structure size: 12 inches
Two drainage water management systems were monitored throughout the study period. The manual water control structure was manually adjusted throughout the year , while the automated water control structure utilized sensors and an online system to manage the water table in real time. The latter provides an easier real-time control of the timing of water discharge from tile systems, does it remotely without the producer having to physically manage water control gates in the field, and provides for greater precision in the timing of management actions. Flow and nutrient concentration data was collected from each system for comparison.
Daily rainfall data were obtained from a publicly accessible online weather station located approximately five miles away. From March 2023 to October 2024, water levels at both the manual and automated water control structures were monitored using an In-Situ Inc. level logger and a built-in level reader, respectively. Additionally, weekly water samples were collected from each control structure between June 2023 and October 2024, and nutrient concentrations (nitrate and dissolved phosphorus) were analyzed using the NuLab wet chemistry analyzer at ShoreRivers’ facilities.
FLOW RATE DATA
The site received a total of 95.8 inches of precipitation during the study period, including a significant storm in mid-July that brought 7.51 inches of rain. In response, the automated structure was adjusted to lower the water level in the field. Meanwhile, the manual structure remained without boards to help manage in-field water, resulting in maximum recorded flow. Overall, the manual structure experienced higher flow due to less intensive board management, with an average flow rate of 95.2 gallons per minute (gpm), compared to 21.5 gpm for the automated structure.
The structures were monitored over a span of 505 days. During this period, the manual structure had flow for 202 days, while the automated structure had flow for only 80 days. The 2024 growing season was abnormally dry and therefore there was no flow from May to the end of the study period.
WATER QUALITY —NITROGEN
The nitrate (NO3) concentrations in the tile drainage water from both systems (~8 mg/L) fell within the typical range for agricultural fields (6–16 mg/L). Observed concentrations ranged from a minimum of 1 mg/L to a maximum of 27 mg/L. The flow-weighted NO3-N concentrations were 10.4 mg/L and 7.8 mg/L for the manual and automated structures, respectively.
Flow weighted mean concentrations represent the average concentration of a pollutant that has passed by a particular site during a monitoring
Loads (flow x nutrient concentrations) are important when discussing water quality. Unlike concentration (which provides a snapshot of nutrient levels at a specific location and time), loads provide a better understanding of the total input of nutrients from fields. The manual system had higher loads than the automated structure, especially during high rainfall events with high nitrate concentrations, this is due to the active management of the automated system through it’s real time data platform.
For the 2024 growing season, the total nitrate loss per acre was 17.6 lbs/acre for the manual system and 0.8 lbs/acre for the automated system. The fields had a soybean crop for this growing season with minimum rainfall, therefore less N loss was expected.
WATER QUALITY —PHOSPHORUS
The average flow-weighted dissolved phosphorus concentrations for the manual and automated systems were 0.005 and 0.05 mg PO4/L, respectively. Although slightly higher than the EPA dissolved phosphorus limit of 0.02 mg P/L to avoid eutrophication, these concentrations were lower than the average of 0.012-0.253 from other tile drainage studies across the US. The minimum concentrations were 0 mg/L, while the maximum concentrations were 2.4 mg/L.
The manual system exhibited higher dissolved phosphorus loads, especially during a significant rainfall event in mid-July 2023, as well as an isolated peak in March 2024. In contrast, the automated system experienced several non-flow days with concentrations of 1 .5 mg/L. However, since loads account for flow, ultimately, no nutrients were leaving the field from the tile system.
Overall, the automated had less nutrient inputs downstream due to more precise drainage water manage-ment during higher flow events. Nonetheless, any form of controlled drainage is an effective way to re-duce the volume of water leaving the field and thereby decreasing the amount of nutrients.
Education & outreach activities and participation summary
Participation summary:
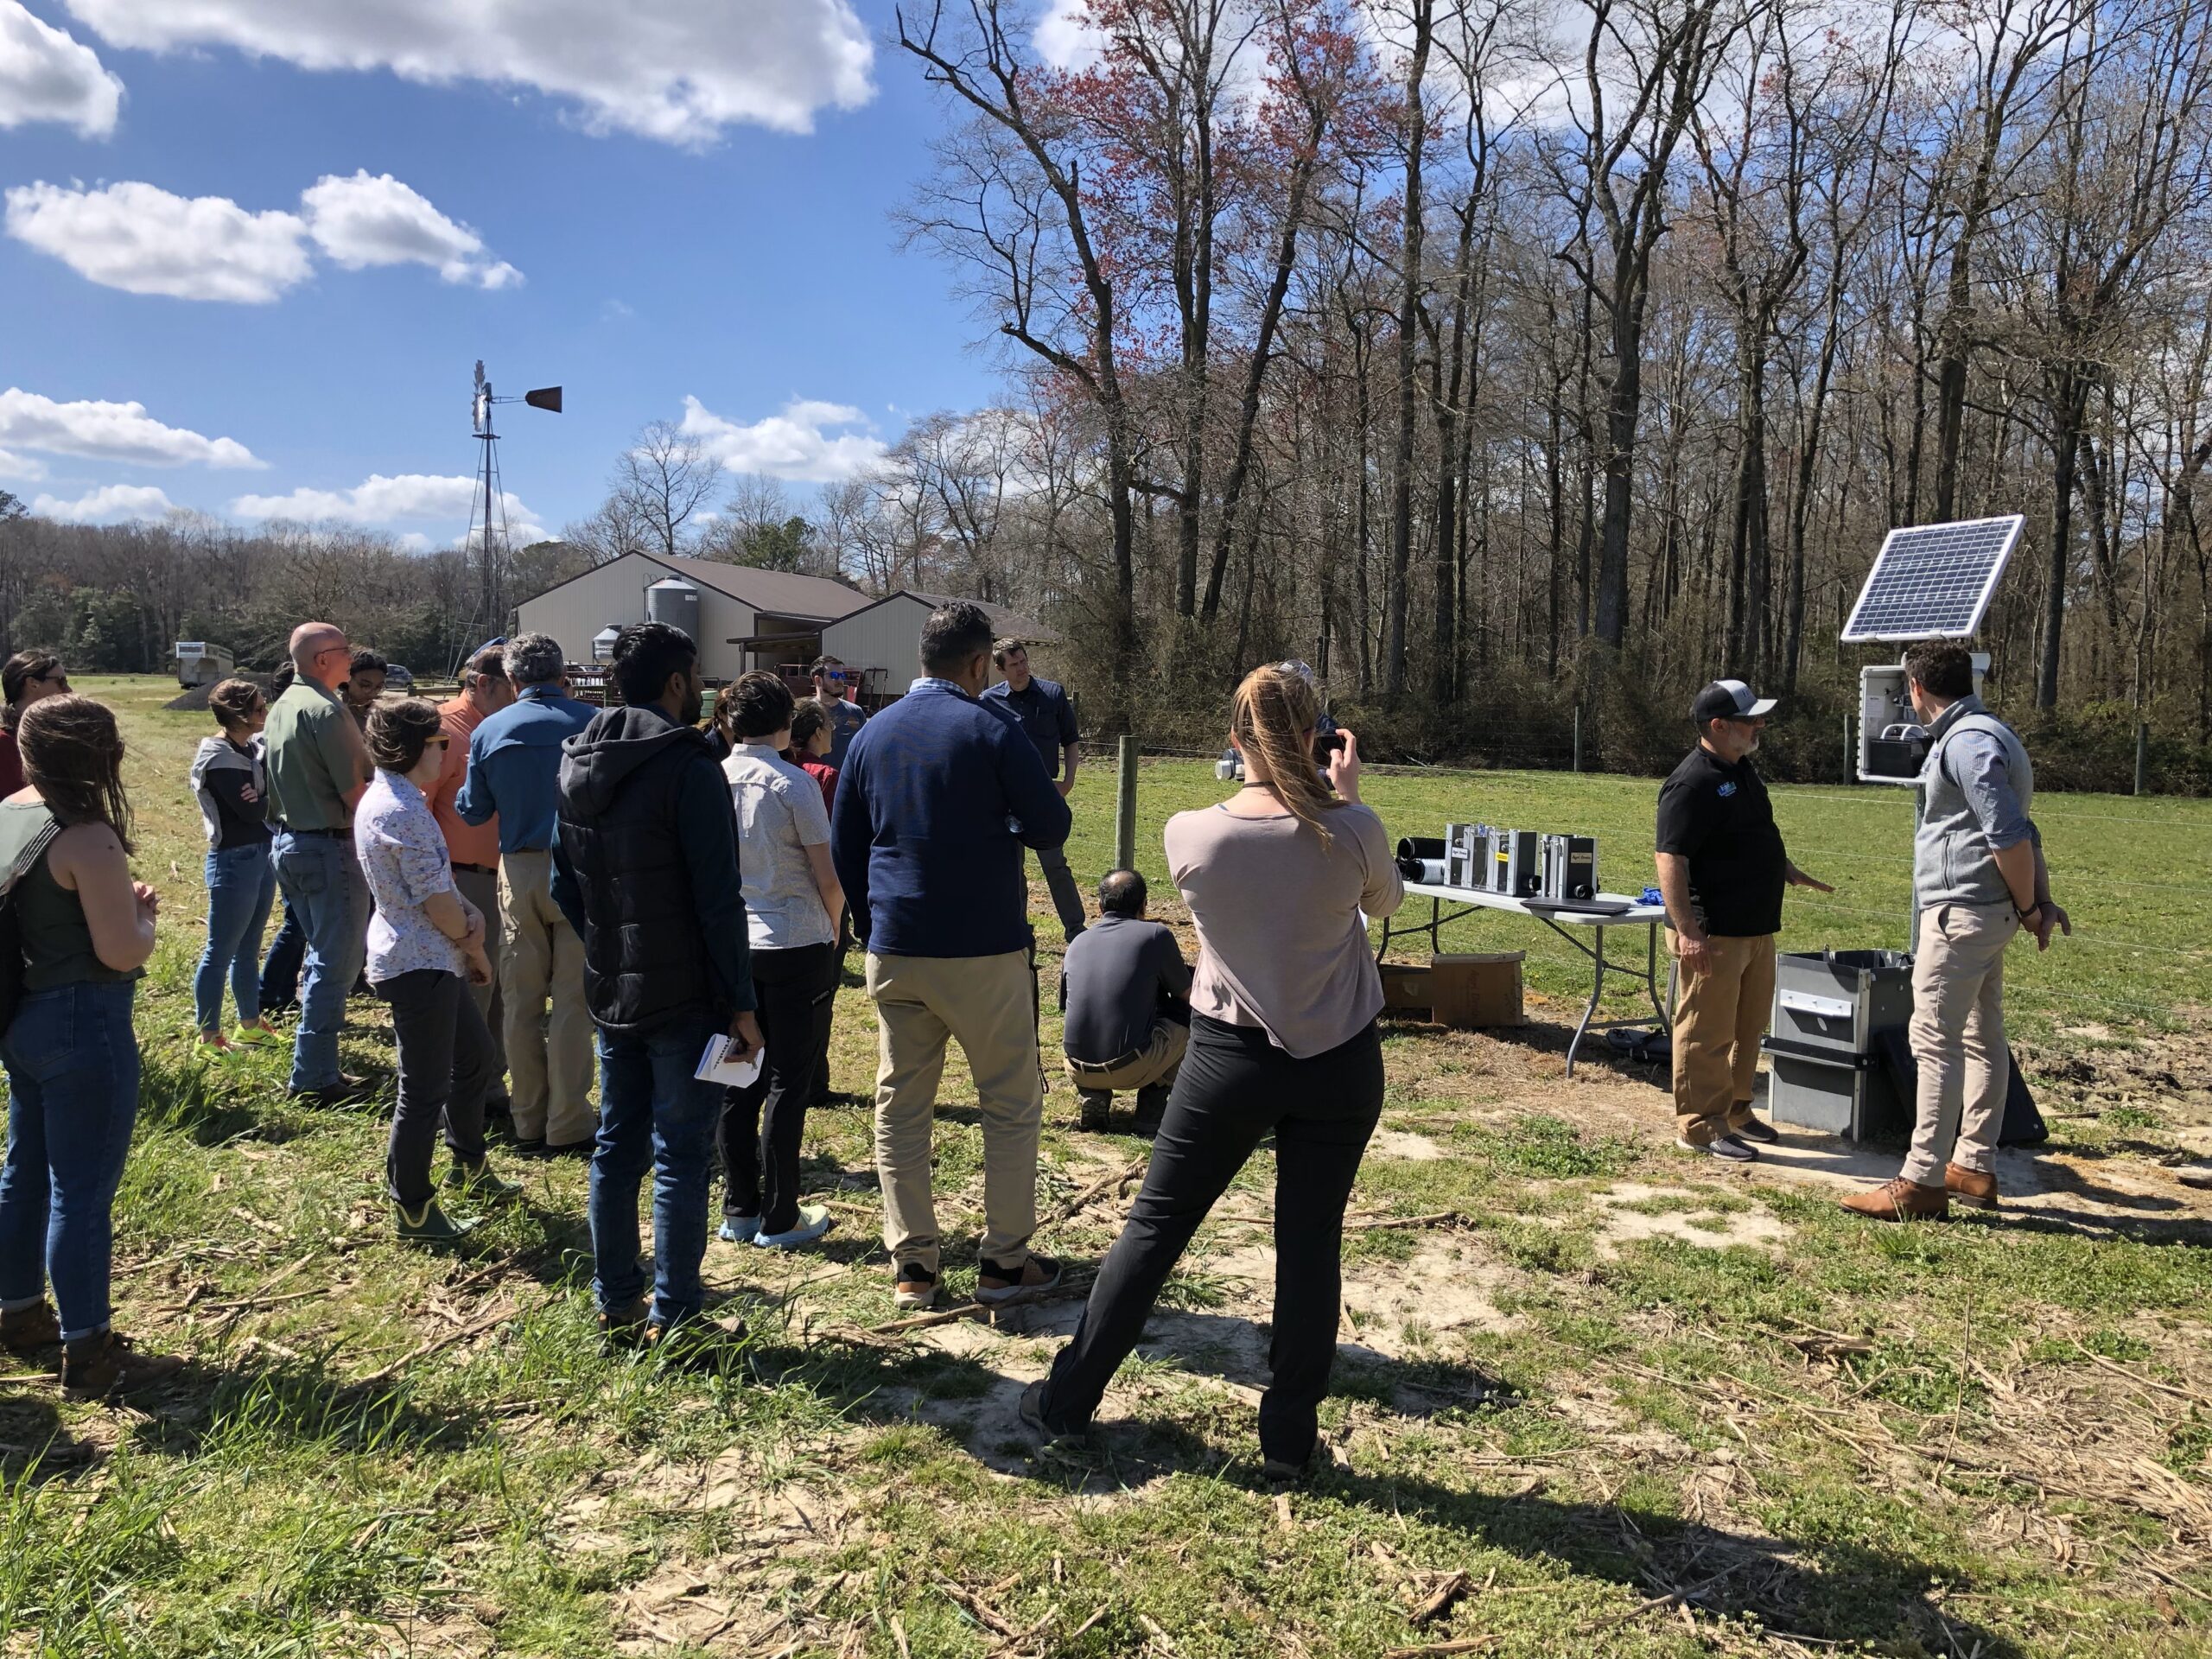
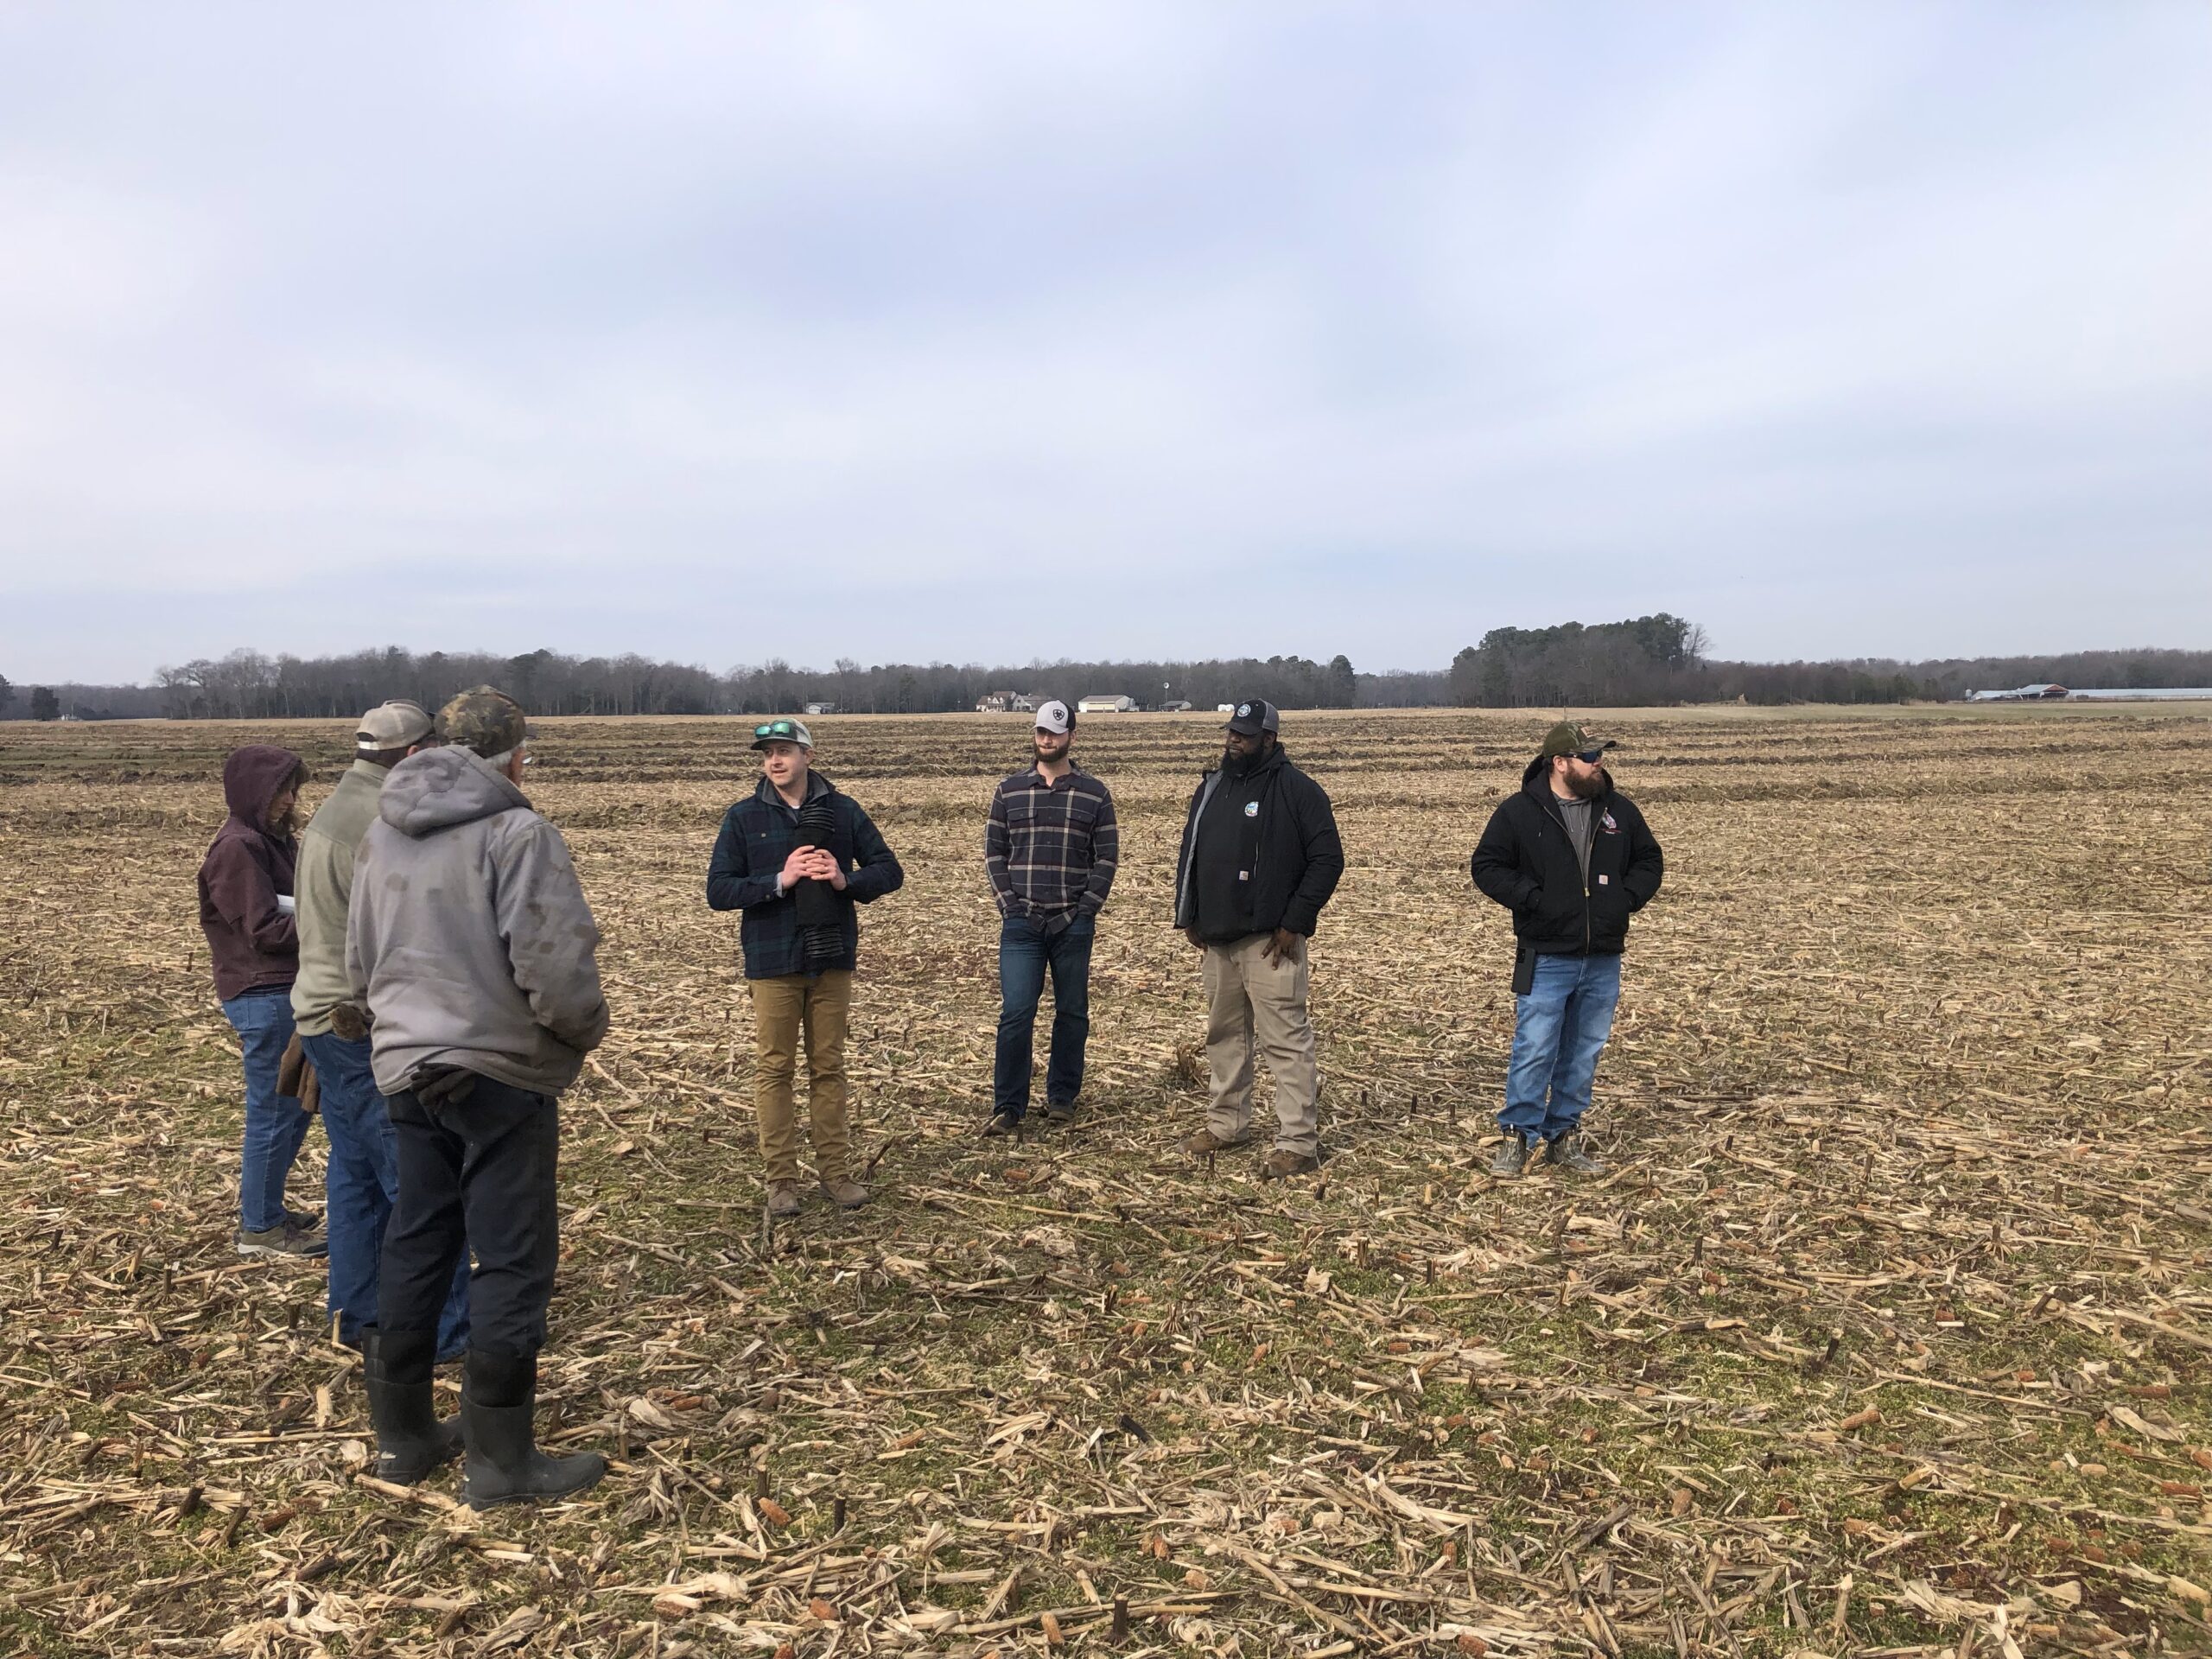
February 7, 2023- Pop-up Field Day for producers.
April 4, 2023- hosted the Conservation Drainage Network 2023 Annual Meeting
August 23, 2023- NRCS New Planner training
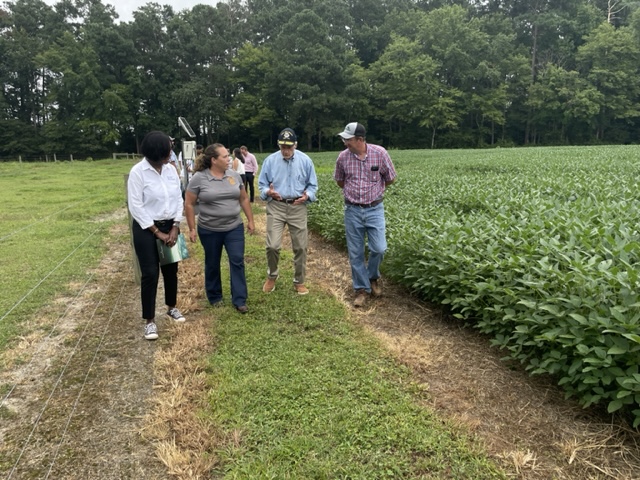
August 28, 2023- Senator Tom Carper and staff tour
Learning Outcomes
Project Outcomes
The number one challenge we faced was extreme swing in weather conditions. The key to the projects success was the partnership with Shore Rivers. The one revision I would make to the methodology would be to take more soil temperature readings to show if the nutrients are transported more in warmer soils. Yes, I answered the question we set out to study. The automated systems had less nutrient loads being discharged. We plan to use the practice we investigat3ed because it helps to save on nutrient costs. Additional work needs to be done on how overhead irrigation would impact nutrient load discharge on acreage with drainage tile. I feel Delmarva Peninsula grain producers would benefit from these findings.