Final report for FNE22-015
Project Information
The objective of this study was to determine if fish feed made from scratch, that substituted black soldier fly larvae (BSFL) meal for fish meal as the primary protein source, could grow trout comparably well at a comparable price point to commercial feed. To test this we developed four fish feed formulations using 100%, 80% and 50% substitutions of BSFL meal for fish meal. We also formulated a 100% fish meal feed that shared ingredients with the other formulations, fed a commercial (Control) feed and 50:50 mix of dried whole BSFL and Control feed. We used six aquaponics systems with volumes of 100 - 150 gal to grow cohorts of brown trout, one feed type per system, for 92 days. We found that the fish grew 24% larger on average and had a 23% lower feed conversion ratio (FCR) with the Control feed vs the next best experimental feed. The 20% Fish feed performed best of the experimental feeds in terms of fish growth and FCR. Vegetable production was highest for the 50% Fish feed, being 10x higher in kg produced than the Control feed system. Intestine and liver histology were least impacted for fish fed fish meal, either Control or 100% Fish feed. The 50% Fish and 20% Fish feeds were intermediate in qualitative assessment of intestinal irritation and not much worse than the Control and 100% Fish. The 0% Fish and 50:50 mix feeds resulted in widespread intestinal irritation. Both the 50:50 mix and 0% Fish feeds had high mortality by the end of the experiment, loosing upwards of 40% of the starting biomass; i.e., the mass of fish that died exceeded the growth of the surviving fish. Economically, making fish food with alternative protein ingredients is highly sensitive to the cost of those alternative protein ingredients. At current internet prices, that we found in 2023, BSFL meal based fish feed is 5x to 10x more expensive to make than it is to buy commercial feed, and 2x-3x more expensive to make than it is to make 100% Fish meal based feed. However, intangible costs, like knowing that one's fish feed is not contributing to global overfishing and Illegal, Undocumented, Unregulated fishing activity is difficult to put a price on when calculating the value of alternative protein feeds.
We addresed whether reduced fish protein feed can achieve similar growth, filet quality, and economics for brown trout as standard fish protein/ fish oil commercial feed. We used an all-alternative feed experimental diet (a), diet with 50% fish meal reduced (b), diet with 25% fish meal reduced (c), commercial fish meal diet (d) to assess differences in feed conversion ratio, digestibility, weight gain, filet quality and Poly-unsaturated fatty acid content (PUFA), as well as the cost in labor and materials to make fish food. We are interested in whether the cost to benefit ratio, including sustainability, of land-based aquaculture (LBA) can be improved by producing feed in-house with light-duty pellet pressing and extrusion machinery.
|
Inputs |
Activities |
Participants |
Knowledge Gained |
Action |
Condition |
|
USDA NESARE Funding |
Conduct feed experiment |
Canopy Farms |
Feasibility of in-house feed making |
Took steps towards more sustainable fish operation |
LBA industry is a more sustainable protein source for human consumption |
|
USM Interns |
Fish husbandry techniques |
Acquired knowledge and skills for employment |
|||
|
USM Faculty Advisor |
Efficacy of alternative protein sources |
Can recommend alternative protein sources to small producers |
|||
|
LBA community |
Analysis of sustainable in-house feed |
Made informed choice between feeds |
The documentary Seaspiracy has created a furor in the public in 2021, taking on overfishing, plastic pollution, and the treatment of marine animals. The film spent little time on aquaculture, firing broadsides into farming techniques and waste management, but saved its most pointed criticism for the feed industry. The Aquaculture Stewardship Council felt it necessary to respond, posting to their website that “35% of fish meal comes from fish by-products,” and 88% of global fish harvest is “utilized for direct human consumption” (ASC 2021). Capture fisheries have flat-lined at 90 million tons per year (Richie and Roser 2019). Still, 10.8 million tons of fish are not going to direct human consumption; with potentially as much as 7 million tons going directly to fish meal. Indeed, 15 million metric tons of fish were rendered in 2016 (Kok et al. 2020). Fishery regulations have reduced the tonnage of fish going directly to meal, even as aquaculture grows globally, and thus has put a premium price on fish meal and fish oil. No matter how you grind it, this represents a sustainability problem for aquaculture.
Feed is the largest expense for any aquaculture operation. Even small operations spend significant resources on feed. Ethical and appropriate waste disposal is a logical secondary problem. Third is perception: does the product grown in an enclosed system have sufficient quality and integrity to meet consumer perceptions? For small operations like Canopy Farms, making our own feed is a way to meet the triple-bottom-line of increasing net farm income, reducing environmental risks, and protecting natural resources. Invertebrate protein and oil sources have a track record of making acceptable ingredients. They can also reduce the farm waste stream by recycling waste into invertebrate mass. Feeding freshwater fish bugs makes intuitive sense to many people since that is what they eat in the wild. We believe that relatively simple feed formulations can provide good growth for small operations, reduce costs, strengthen financial and environmental sustainability, and improve public perception.
Market forces have forced feed suppliers to look at other ingredients, including plant-based, animal by-products and other novel ingredients to keep the price of feed competitive (Kok et al. 2020). However, not all protein substitutes work for all species. Soybean meal, a popular, inexpensive, and readily available ingredient, contains anti-nutritional factors (including antigen proteins, enzyme inhibitors and other sugars) that has limited its use as a feed ingredient (Li et al. 2020). Indeed, farmers who tried early versions of soybean supplemented feed have sworn them off after carnivorous fish developed intestinal diseases. Black soldier fly larvae, an insect based protein substitute, has shown mixed yet promising results as a supplement. Around the 30% replacement for fish meal, poly-unsatruated fatty acid (PUFA) content begins to drop off and fish fillet appearance begins to change (Bolten et al. 2021). Many of these anti-nutritional factors can be alleviated to some degree by using additional supplements, enzymes or post-harvest treatments of feed ingredients. These formulations assume that fish eat the same meal every day, all the time, whereas in the wild fish eat a varied diet, both seasonally and daily. A mixed ingredient diet, consisting of a variety of animal, plant, and insect based protein sources, along with digestibility aids and probiotics, may be the key to producing the most sustainable aquaculture fish.
The remaining question is whether producing fish feed can be done economically on-site by small to medium sized farms. The cost of shipping can easily add 50% or more to a feed order. If a producer is using dozens of pounds of feed a day, making one’s own fish feed can garner long-term savings and more comfort in where those ingredients are sourced.
Advancements in feed could have significant impact on the growing aquaculture and aquaponics industries. Aquaculture in the US is expanding as we seek to raise more sustainable protein sources for a growing global population. Commercial aquaponics farms have become more prevalent over the past decade; however, high costs and high risk (including supply chain risk) limit new entries to the field. Currently valued at $630 million worldwide, the aquaponics market is expected to grow approximately 15% annually over the next 5 years (Research and Markets, 2020). Reductions in feed cost and risk would increase the attractiveness of this efficient growing technology for new farmers. With a robust existing aquaculture industry including leading aquaponics farms, alongside a history of small-scale agriculture, the Northeast is poised to become a leader in small-scale aquaponics and LBA.
Now more than ever with inflation driving prices higher, costs to run land based aquaculture and farms is increasing. To stay afloat, we need to be innovative to reduce costs wherever we can to compensate for increased fixed costs of prices, such as materials from local hardware stores and increasing electric and utility rates.
Canopy Farms is a 3500 sq ft aquaponics greenhouse attached to an Asian market and café. We raise Trout in the basement of the facility, the Asian market, café, and commercial kitchen is on the main floor, and on the roof is an enclosed greenhouse, utilizing the fish water from downstairs to fertilize our wide variety of crops such as greens, tomatoes, strawberries, bok choy, and chard. It might be the only building of it's kind, with plans occurring right now to install small scale shrimp aquaculture in the basement as well. We started construction in 2018, but weren't operational in sales until 2020-21. Since then, we have set up sales channels through our own CSA, the Portland Food Co-op, Bath Natural Market, and the Portland Farmer's Market in addition to providing the restaurants with produce and fish. We grow enough to supply those channels year round on 0.04 acres, a great benefit of aquaponic farming. We produce over 1000 pounds of produce each year.
We have a Pentair pump and air blower as our two key pieces of equipment at the farm, as well as a UV drum filter and Ozone generator for water filtration. Funded by SARE, we now own two chillers to raise Trout fingerlings to continue experimenting on for further research into feed viability and diets.
Cooperators
- - Technical Advisor (Educator and Researcher)
Research
Materials:
CF used four 100 gal and two 150 gal RAS tanks, all of similar design at USM. CF contracted USM to use the feed pellet press (5mm die) and extruder, used in previous experiments, to make fish food. Both are inexpensive “made in China” units purchased on Amazon.com. Additional fabrication and equipment (120V-220V single phase step-down converter) was required to make the units usable with the US electrical grid.
The commercial feed used was Bio-Oregon. We followed the manufacturer’s recommended progression from crumble to full pellet.
Brown trout were acquired locally. There are two fingerling suppliers in Maine. Fish were acquired at 5 cm and grown to 10 cm on commercial fingerling feed. Once that size was reached 72 were moved to the USM facility to begin the experiment.
Table 1: Fish feed formulations on a 1kg basis.
|
0% Fish |
20% fish |
50% fish |
100% fish |
|
|
Fish meal |
0 |
75 |
200 |
370 |
|
Black Soldier Fly Meal |
380 |
285 |
200 |
0 |
|
Distillers Waste Grain |
80 |
80 |
80 |
80 |
|
Beer Waste Grain |
50 |
50 |
50 |
50 |
|
Soy Okara |
100 |
100 |
100 |
100 |
|
Kelp meal |
40 |
40 |
40 |
40 |
|
Soy protein isolate |
80 |
115 |
85 |
80 |
|
Oat Flour |
134 |
119 |
109 |
154 |
|
Casava Flour |
50 |
50 |
50 |
50 |
|
Vitamin premix |
1 |
1 |
1 |
1 |
|
Ascorbic Acid |
0.4 |
0.4 |
0.4 |
0.4 |
|
Amino Acid Mix |
1 |
1 |
1 |
1 |
|
Dicalcium phosphate |
5 |
5 |
5 |
5 |
|
Magnesium oxide |
0.5 |
0.5 |
0.5 |
0.5 |
|
Salt |
5 |
5 |
5 |
5 |
|
Guar gum |
3 |
3 |
3 |
3 |
|
Bamboo powder |
10 |
10 |
10 |
0 |
|
Taurine |
0.1 |
0.1 |
0.1 |
0.1 |
|
Salmon Oil |
20 |
20 |
20 |
20 |
|
Vegetable Oil |
40 |
40 |
40 |
40 |
Water quality parameters monitored included ammonia, nitrate, phosphate, temperature, dissolved oxygen, carbonate hardness, and conductivity. Fish were maintained at 15.8C – 18.3C with 80% oxygen saturation for the duration of the experiment.
Methods:
We chose black soldier fly meal as the alternate protein source to replace fish meal in our experimental diets. Invertebrate protein and oil have a track record of making acceptable ingredients in fish feed. Invertebrate protein and oil also reduce the waste stream by recycling food waste, feed waste and excrement into invertebrate mass. Feeding freshwater fish bugs makes intuitive sense to many people since that is what they eat in the wild. We believe that relatively simple feed formulations can provide good growth for small operations, reduce costs, strengthen financial and environmental sustainability, and improve public perception. The fish protein source used was menhaden fish meal. Menhaden is now a well-managed fishery, since catch caps were put in place in the early 2010s.
The Control feed used was Bio-Oregon BioTrout 4 mm. Bio-Oregon was the rearing food used prior to the experiment, following the manufacturer’s recommended progression from crumble to full pellet. Feed for the experiment was sampled from bags purchased for the concurrently grown cohort of trout at Canopy Farms. The feed was a slow sink extruded pellet.
In pursuit of a more sustainable food mix, we attempted to use as many waste ingredients from other industries as was beneficial and available (Table 1). Distiller’s waste grain is the left-over mash from making grain alcohol. Distillers waste grain has a relatively high protein content (Protein=23.9, Lipid=6.1, Ash=2.1, Fiber=5). Beer waste grain is widely available from the numerous breweries in southern Maine. Beer waste grain is a mid to low protein filler (Protein=18.6, Lipid=7.4, Ash=2.8, Fiber=3.8). Soy okara is the left-over meal from the tofu making process (Protein=29.7, Lipid=10.1, Ash=4.2, Fiber=11). These three ingredients were free and readily available from local producers.
Kelp meal added a natural thickening agent and a good source of calcium and potassium to the diets (Protein=15, Lipid=4, Ash=27, Fiber=5.3). We used soy protein isolate as a concentrated protein additive to bring the protein level of the formulas up to recommended levels for rainbow trout. Oat flour was used as a carbohydrate source and was a conscious attempt at staying away from corn and corn fillers as an ingredient. Casava flour was used as a carbohydrate and a natural binding agent to give the pellets more resistance to breaking down in water. A number of vitamin supplements were added to makes sure we had a balanced mix of amino acids and vitamins in the feed. Bamboo powder was added for fiber and guar gum as another binder. The grain free nature of the diet meant that taurine might be in low supply, so a taurine supplement was added. We varied the fish meal and insect meal. Soy protein isolate and oat flour were used to balance the formulations. Additional salmon oil was added as a coating before drying the diet mix.
Actions:
The feeding experiment consisted of four formulas, a control using Bio-Oregon Trout feed (here-to-for “Trout”) and a tank that received half of their daily ration as dried BSFL and half as Bio-Oregon Trout feed. The 100% Fish formula was included as a means to verify that our methods for making the feed were not biasing our results. IOW, if all formulas performed poorly, including the 100% Fish, which mimicked a commercial feed, that would be an indication that our feed making method was flawed, not necessarily because of including BSFL.
Fish were fed 0.8% of the mass of fish in each tank. The ration was increased by 0.1% daily. On day 32 the fish ration was reset to 1% of the fish mass on day 1 with a daily ration increase of 0.1%. The feed was a pressed sinking pellet, as opposed to the slow-sink extruded commercial pellet. Temperature was kept between 15.8°C and 18.3°C for the duration of the experiment.
Crude analysis of the treatment feeds compared to the commercial feed were similar but lower in protein (Table 2). The commercial feed had a protein of 47%, fat of 24%, moisture of 8.5%, fiber of 2%, ash of 12%. By dry matter percent protein levels were higher for the treatment feeds by about 2% (42.28, 41.01, 39.86, 36.94 for 100% fish, 50% fish, 20% fish, 0% fish, respectively). Essential Amino Acid content and non-essential AA were similar across the four experimental feeds. Conditional essential amino acids differed in Taurine mostly. The fish ingredient likely had a baseline Taurine content as the amount of Taurine decreased with lower fish content in the feed. We also saw this trend in fatty acid analysis, where lower % fish meal content resulted in lower Omega-3 fatty acid content.
Table 2: Analysis of fish feeds created for the feed experiment. EAA = essential amino acid.
|
100% Fish |
50% Fish |
20% Fish |
0% Fish |
|
|
Crude protein |
40.24 |
39.47 |
38.38 |
35.61 |
|
Moisture |
4.83 |
3.75 |
3.71 |
3.61 |
|
Crude Fat |
13.35 |
14.97 |
17.78 |
17.36 |
|
Crude Fiber |
4.20 |
5.16 |
5.86 |
6.49 |
|
Ash |
10.97 |
9.09 |
7.37 |
6.14 |
|
EAA |
||||
|
Histidine |
0.96 |
1.04 |
1.04 |
1.01 |
|
Isoleucine |
1.72 |
1.74 |
1.71 |
1.58 |
|
Leucine |
2.82 |
2.80 |
2.72 |
2.53 |
|
Lysine |
2.71 |
2.66 |
2.52 |
2.33 |
|
Methionine |
0.84 |
0.71 |
0.62 |
0.53 |
|
Phenylalanine |
1.73 |
1.77 |
1.76 |
1.65 |
|
Threonine |
1.48 |
1.46 |
1.40 |
1.33 |
|
Tryptophan |
0.58 |
0.64 |
0.62 |
0.58 |
|
Valine |
1.93 |
2.04 |
2.03 |
1.96 |
|
Conditional EAA |
|
|
|
|
|
Taurine |
0.48 |
0.32 |
0.24 |
0.17 |
|
Lanthionine |
0.08 |
0.00 |
0.00 |
0.00 |
|
Ornithine |
0.04 |
0.03 |
0.04 |
0.03 |
|
Non EAA |
||||
|
Aspartic Acid |
3.59 |
3.64 |
3.57 |
3.33 |
|
Hydroxyproline |
0.44 |
0.25 |
0.14 |
0.07 |
|
Serine |
1.45 |
1.43 |
1.41 |
1.34 |
|
Glutamic Acid |
5.74 |
5.51 |
5.43 |
4.83 |
|
Proline |
2.10 |
2.13 |
2.11 |
1.98 |
|
Glycine |
2.54 |
2.21 |
1.93 |
1.67 |
|
Alanine |
2.19 |
2.17 |
2.04 |
1.95 |
|
Cysteine |
0.46 |
0.44 |
0.44 |
0.42 |
|
Tyrosine |
1.27 |
1.58 |
1.70 |
1.78 |
|
Hydroxylysine |
0.06 |
0.03 |
0.00 |
0.00 |
|
Arginine |
2.48 |
2.34 |
2.25 |
2.03 |
|
Total |
37.69 |
36.94 |
35.72 |
33.10 |
|
Omega-3 FA |
|
|
|
|
|
EPA (20:5n3) |
4.72 |
3.03 |
2.20 |
1.62 |
|
DHA (22:6n3) |
5.39 |
3.31 |
2.21 |
1.48 |
|
Linolenic (18:3n3) |
4.49 |
4.01 |
3.78 |
3.53 |
|
Stearidonic (18:4n3) |
0.97 |
0.61 |
0.42 |
0.29 |
|
Homo-a-linolenic (20:3n3) |
0.15 |
0.11 |
0.08 |
0.07 |
|
3n-Arachidonic (20:4n3) |
0.00 |
0.00 |
0.00 |
0.00 |
|
Clupanodonic (22:5n3) |
0.73 |
0.47 |
0.34 |
0.26 |
Brown trout were stocked in six 120 gal systems at 1 – 1.2 kg per tank. The average starting length was 205.6mm (±16.8) and 92.6g (±27.4). At the experiment conclusion the 20% Fish and Control treatments showed a significant positive change (Bonferroni corrected one tail T-test < 0.008) in average fish weight compared to day 1 of the 90 day experiment (Fig. 1). Variability was high for the final average weight of all treatments. The Trout feed had the highest final average weight, followed by Trout+BSFW and 50% fish. Of the remaining treatments 0%, 20%, and 100% Fish were all very similar. The high variability of all treatments except 20% and Control may be an indicator of palatability issues.
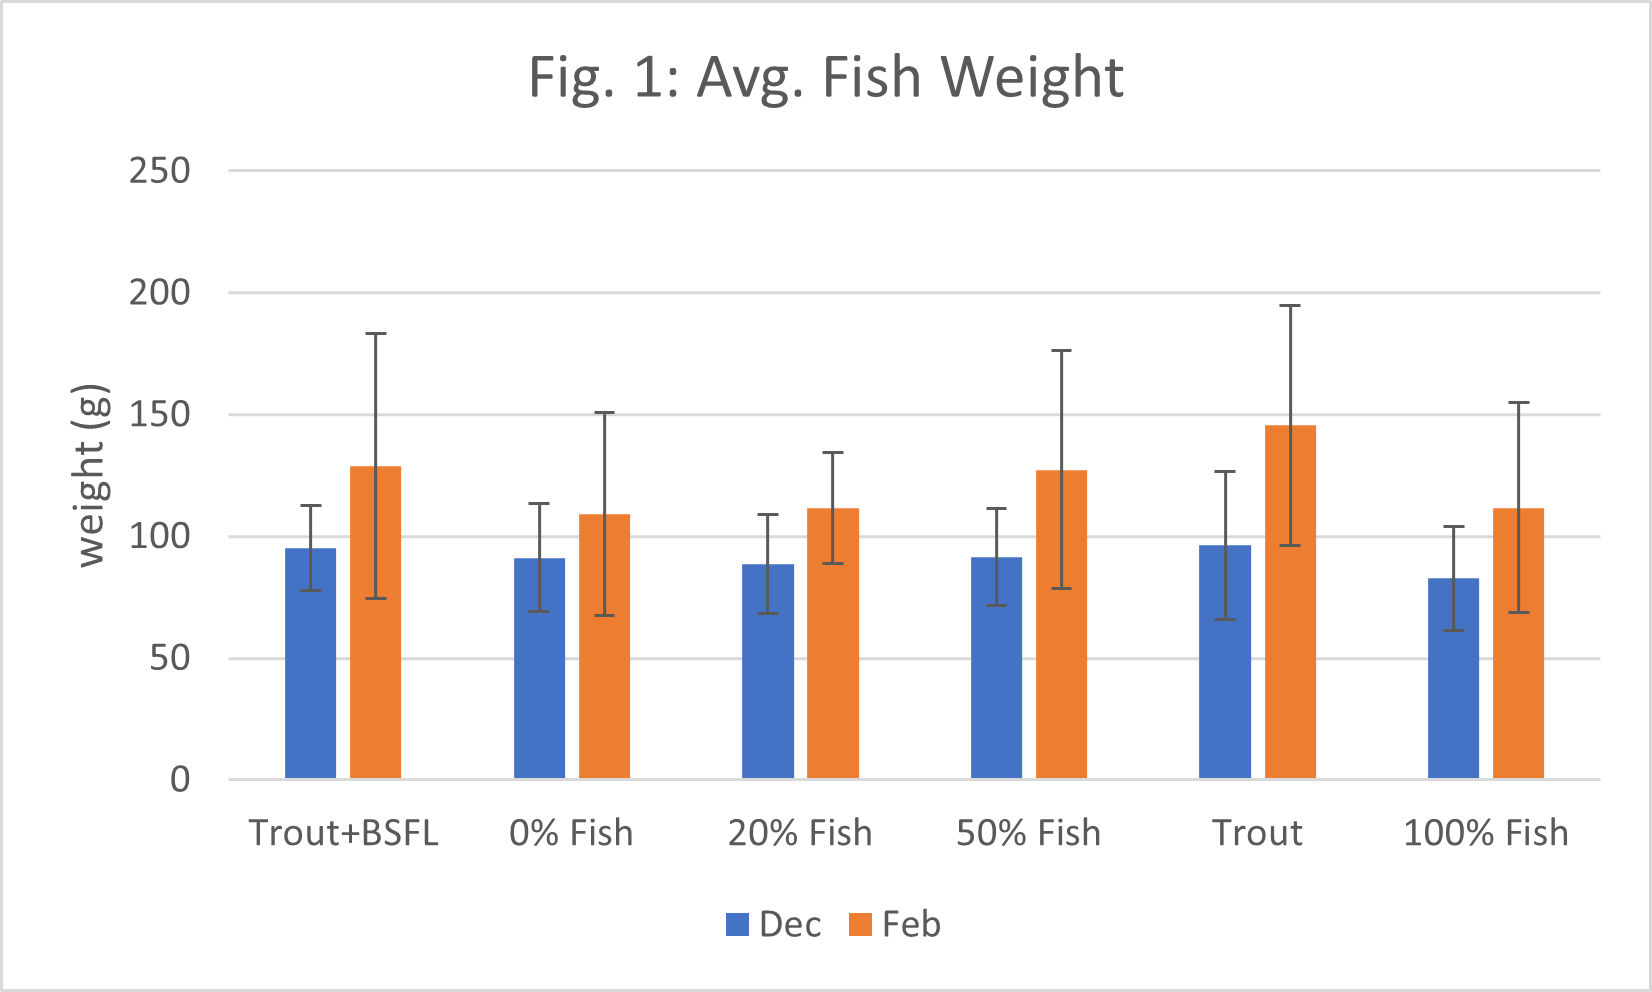
Figure 1: Average fish weight by treatment at the beginning and end of the experiment. Trout+BSFL treatment was stopped early due to a large number of mortalities. Difference in avg. start and end weights were significantly different only for the Trout (Control) and 20% Fish treatments.
Mortality was highest for the Trout+BSFL treatment. By the end of the experiment nearly half of the starting biomass (47%) had been removed as mortalities (Fig. 2). The mortalities were due to a mixture of bacterial infection and intraspecies aggression. It appeared that some fish found the food mixture palatable and others did not. Those that did grew faster and became more aggressive towards those fish that did not eat as well. Much of the BSFL feed was left uneaten as well. The Trout+BSFL treatment was removed from the experiment after 32 days as it did not appear that a solution for the poor performance was readily available. Incidentally, aggression associated with the uneven growth tracks persisted even after this tank was switched to all trout feed. Half of the number of fish that started the experiment had died after 90 days.
The 0% Fish treatment had the second highest mortality by weight. Six fish, or 468 g (43%) of the starting biomass was removed from the tank by end of the experiment. Most of the moralities happened early, possibly associated with a palatability problem with the feed as the fish that died did so within the first 30 days of the experiment and tended to be small (µ= 78g±20). Bacterial infection issues were found in this tank as well. Spontaneous mortalities declined after two sequential salt baths that occurred for all tanks around day 38 of the experiment.
Fish growth was highest for the 20% Fish treatment, after the Control. The 20% Fish treatment had zero mortalities a positive weight change of 277g of mass, followed by the 100% Fish treatment at 265g. The Control treatment added 362g of positive weight change in comparison, a 23% improvement over the next best treatment diet.
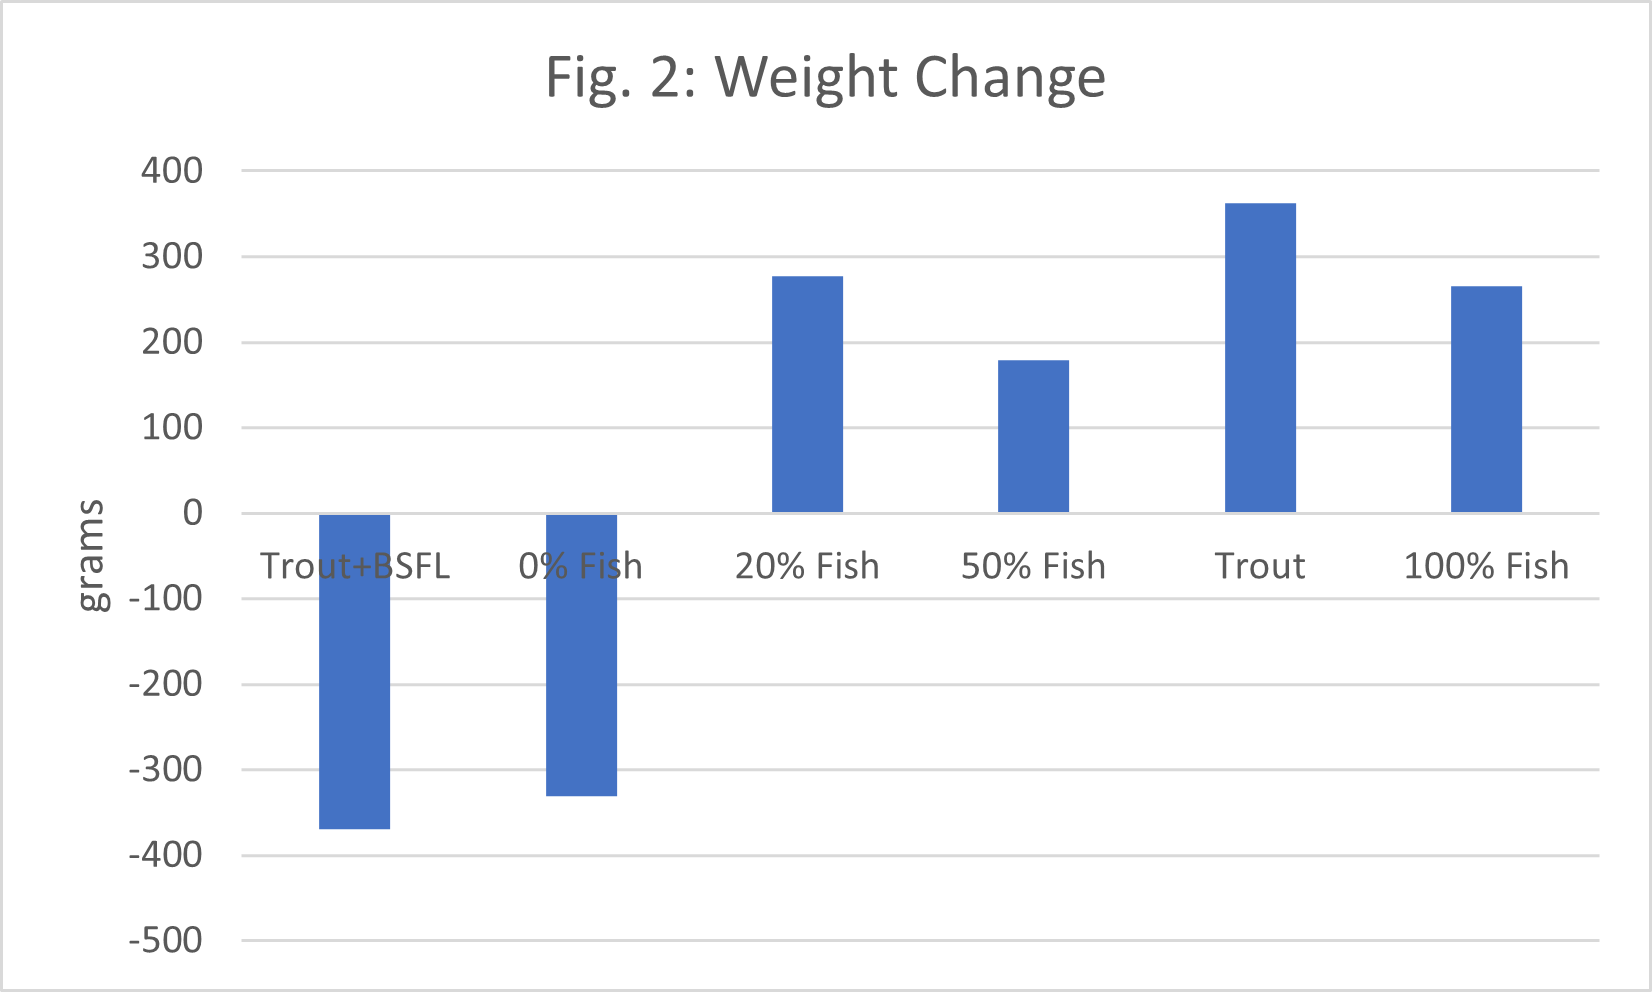
Figure 2: Change in fish weight over the course of the experiment. Weight change for Trout+BSFL and 0% Fish were negative on account of mortalities during the experiment. Other treatments showed positive growth, with 20% Fish highest, followed by 100% Fish.
The second best feed conversion ratio was for the 20% Fish diet (Fig. 3). The Trout (Control) diet had a FCR = 1.02 and was the lowest of the tanks that performed well. The 0% Fish diet was less than one (FCR = 0.66) but this was in part because of the high mortality in the 0% Fish treatment. The 20% Fish diet had an FCR = 1.33; the Trout (Control) diet was 23% more efficient at producing fish mass. The 100% Fish diet had an FCR = 1.5 and the 50% Fish diet had an FCR = 1.83.
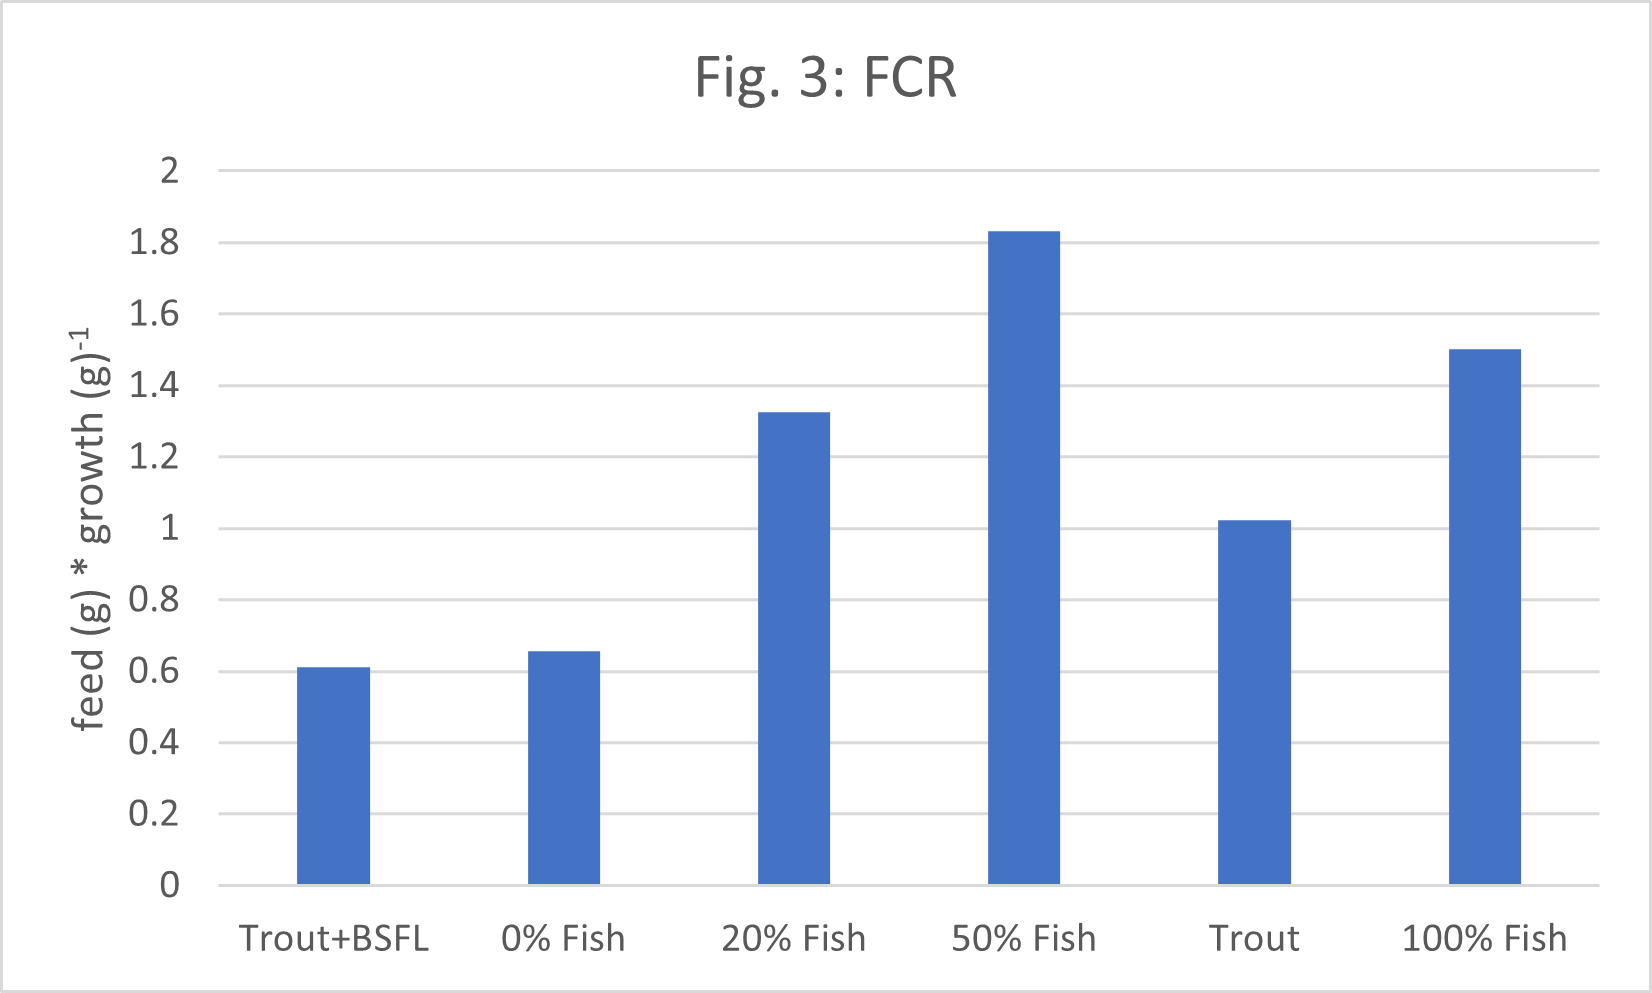
Figure 3: Feed conversion ratio for Trout+BSFL and 0% Fish were less than one owed to mortalities during the experiment. The 20% Fish diet was the next lowest FCR. The Trout (control) diet had the highest FCR.
Three sample fish from each tank were sent to Kennebec BioSciences and UNH New Hampshire Veterinary Diagnostic Laboratory for bacterial, liver and intestinal analysis. Sections of liver looked normal and were similar between groups. Bacterial kindney analysis results included one fish from the 100% Fish tank with a 5K count of Shewanella sp. Two fish from the 20% Fish tank had 12K count of Bacillus sp. Two fish from the 0% Fish tank had a 15K count of Shewanella sp. which was considered high. Shewanella is a ubiquitous genera of bacteria found in aquatic habitats. They are facultative anaerobes and are common component of the surface flora of fish. Bacillus is a large genus of endospore forming bacteria. They are resistant to most treatments (heat, antibiotics, desiccation, radiation and chemicals) in their endospore form. Both bacteria are suspected contributors to and accelerants of food spoilage.
Histopathology of the sample fish consisted of a qualitative assessment of gut health. Overall, there appeared to be an increasing degree of enteritis with decreasing amounts of fish meal in the diet (Table 3). Control fish had patchy to diffuse mucosal autolysis and sloughing in multiple sections of the intestine, which was described as moderate to marked where they occurred. Mucosal exocytosis by lymphocytes was described as moderate in the Control fish. Fish on the 100% Fish diet had the same patchy to diffuse autolysis and sloughing, described as moderate in severity. Mucosal exocytosis by lymphocytes was described as sparse to mild. Fish on the 50% Fish and 20% Fish diets had the same patchy to diffuse autolysis and sloughing, described as moderate to marked in severity. Mucosal exocytosis by lymphocytes was described as moderate and increased relative to the Control fish. Fish on the 0% Fish diet had widespread mild autolysis and sloughing, described as moderate to marked in severity. There were moderate to large numbers of lymphocytes present with moderate mucosal exocytosis.
Table 3: Diagnostic results of intestinal health inspection.
|
Treatment |
Mucosal autolysis distribution |
Mucosal autolysis severity |
Mucosal exocytosis severity |
|
Control |
Diffuse |
Moderate to marked |
Moderate |
|
100% Fish |
Diffuse |
Moderate |
Mild |
|
50% Fish |
Diffuse |
Moderate to marked |
Moderate to marked |
|
20% Fish |
Diffuse |
Moderate to marked |
Moderate to marked |
|
0% Fish |
Wide spread |
Moderate to marked |
Marked |
Fish food quality can have drastic effects on water quality in recirculating systems. Turbidity is a measure of water clarity, which largely affects the visual aspects of the growing area. Visitors cannot perceive pH or conductivity of the growing environment but they can readily tell if the water is stained. Feed that holds together better has a more positive visual effect on growing systems. We measured turbidity as three samples per tank at the end of the experiment (Fig. 4). The Trout+BSFL treatment had the lowest turbidity. The Control tank had the highest turbidity. In general, the less fish meal included in the diet the lower the turbidity, however, a statistical difference could not be detected between the 0%,20%, 50% and 100% treatments.
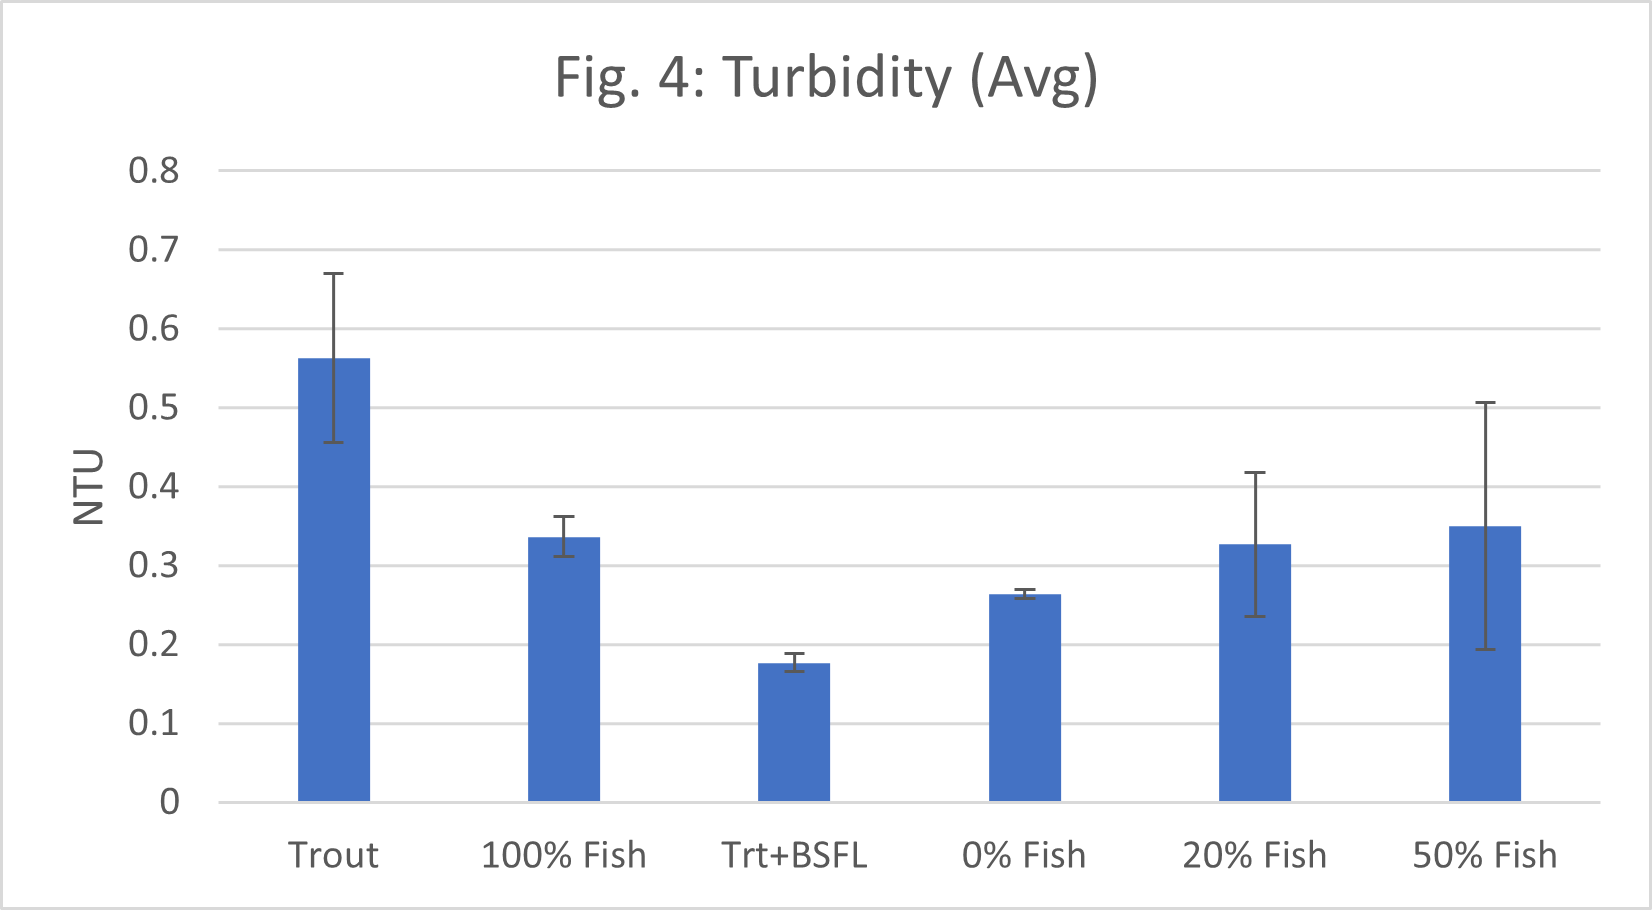
Figure 4: Turbidity comparison between treatments. There was a significant difference (Tukey Post hoc) between Trt+BSFL vs. 100% Fish, Trt+BSFL vs. Trout and Trt+BSFL vs. 0% Fish. There was a marginal difference between 0% Fish vs. 100% Fish and 0% Fish vs. Control.
pH is both a controlling and indicator variable for recirculating aquaculture systems. Bacteria that colonize the biofilter are highly reactive outside of their preferred pH range and may stop functioning. This in turn will cause the pH to decline even more. pH also affects the ability of plants in aquaponic systems to sequester nutrients. Prior experience with the aquaponics systems at USM, given the produce planted for the experiment, cucumbers and bell peppers, indicated that pH between 6.2 and 6.6 was optimal. The Trt+BSFL and 0% Fish tanks deviated outside of this range the most of the six treatments (Fig. 5). This could be a reflection of poor palatability leading to left over food, resulting in ammonia spikes that contribute to declining pH. Instances where pH>6.6 were a reaction to repeated buffer additions to the systems to bring the pH back into the optimal range.
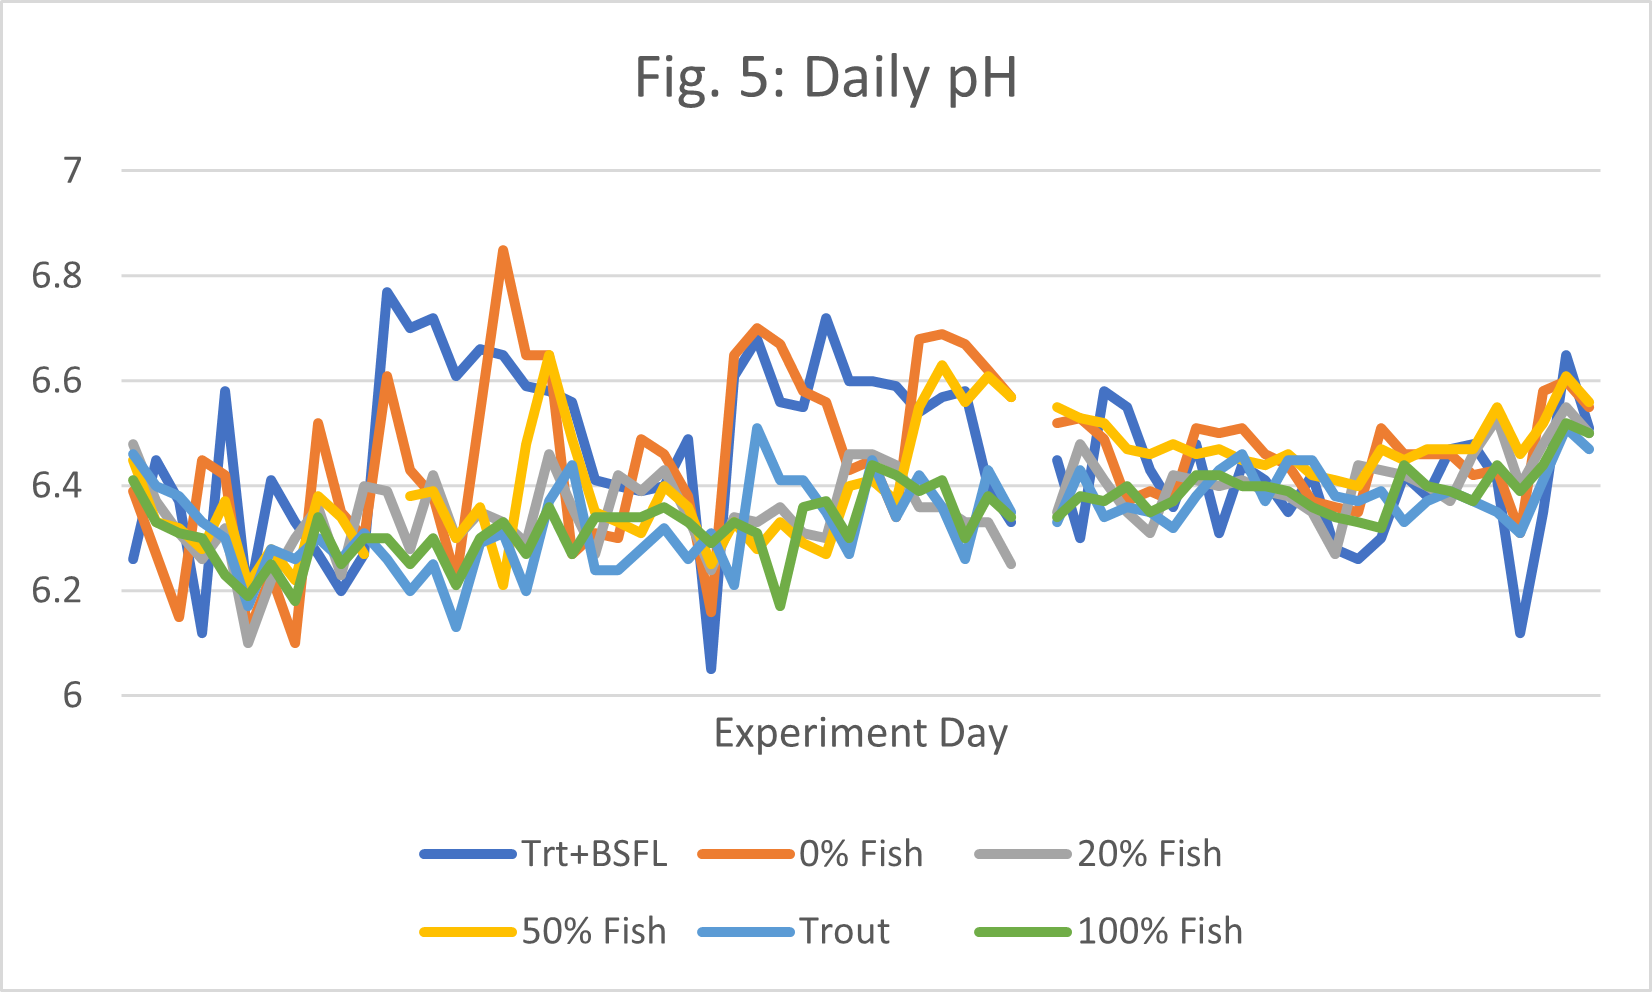
Figure 5: Fluctuations in pH of different treatments over the course of the experiment.
Of the six treatments, the Trt+BSFL and 0% Fish treatments had the highest average pH and were the least stable around that average (Fig. 6). Their average pH=6.45 but ranged as high as 6.8 and as low as 6.1. The 20%, 100% and Control treatments were very similar in average pH, 6.3±0.08.
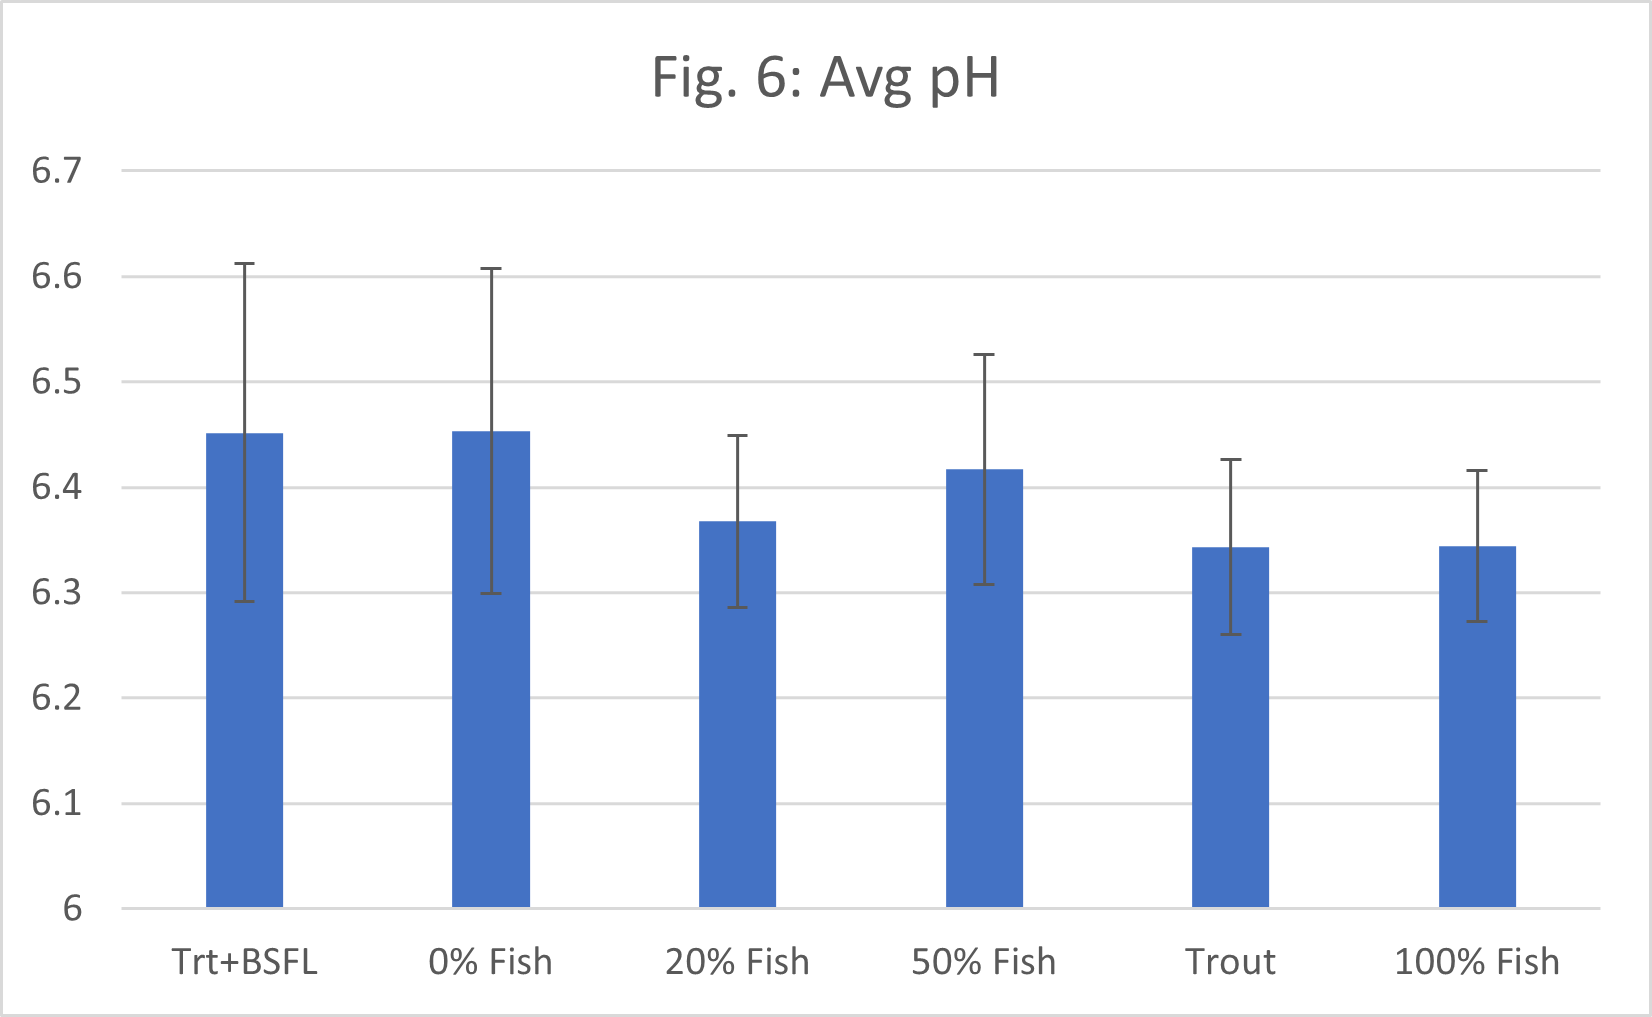
Figure 6: Average pH and standard deviation of treatment pH over the course of the experiment. There was no significant difference in pH between treatments. Treatments 1 and 2 showed the highest average pH as well as the highest variation, aka least stability in pH.
Conductivity is a general measure of ion concentration in water. Most freshwater fish are only affected by extremely low and extremely high conductivities, and often only when being moved between tanks or water sources where one is high and the other much lower. Plants are more directly affected by conductivity as ion concentration affects their ability to sequester nutrients from the liquid medium. High conductivity water has lots of nutrients but the plants may be saturated and unable to absorb the nutrients they actually need. Low conductivity water may not have enough nutrients overall. Cucumbers and bell peppers like conductivities between 800 and 1200 µS/cm, generally. The 20% fish treatment was near the top of this conductivity range (Fig. 7). The 50% fish treatment was near the bottom of this range. All other treatments were above (100% Fish and Control) or Below (0%Fish, Trt+BSFL) this range.
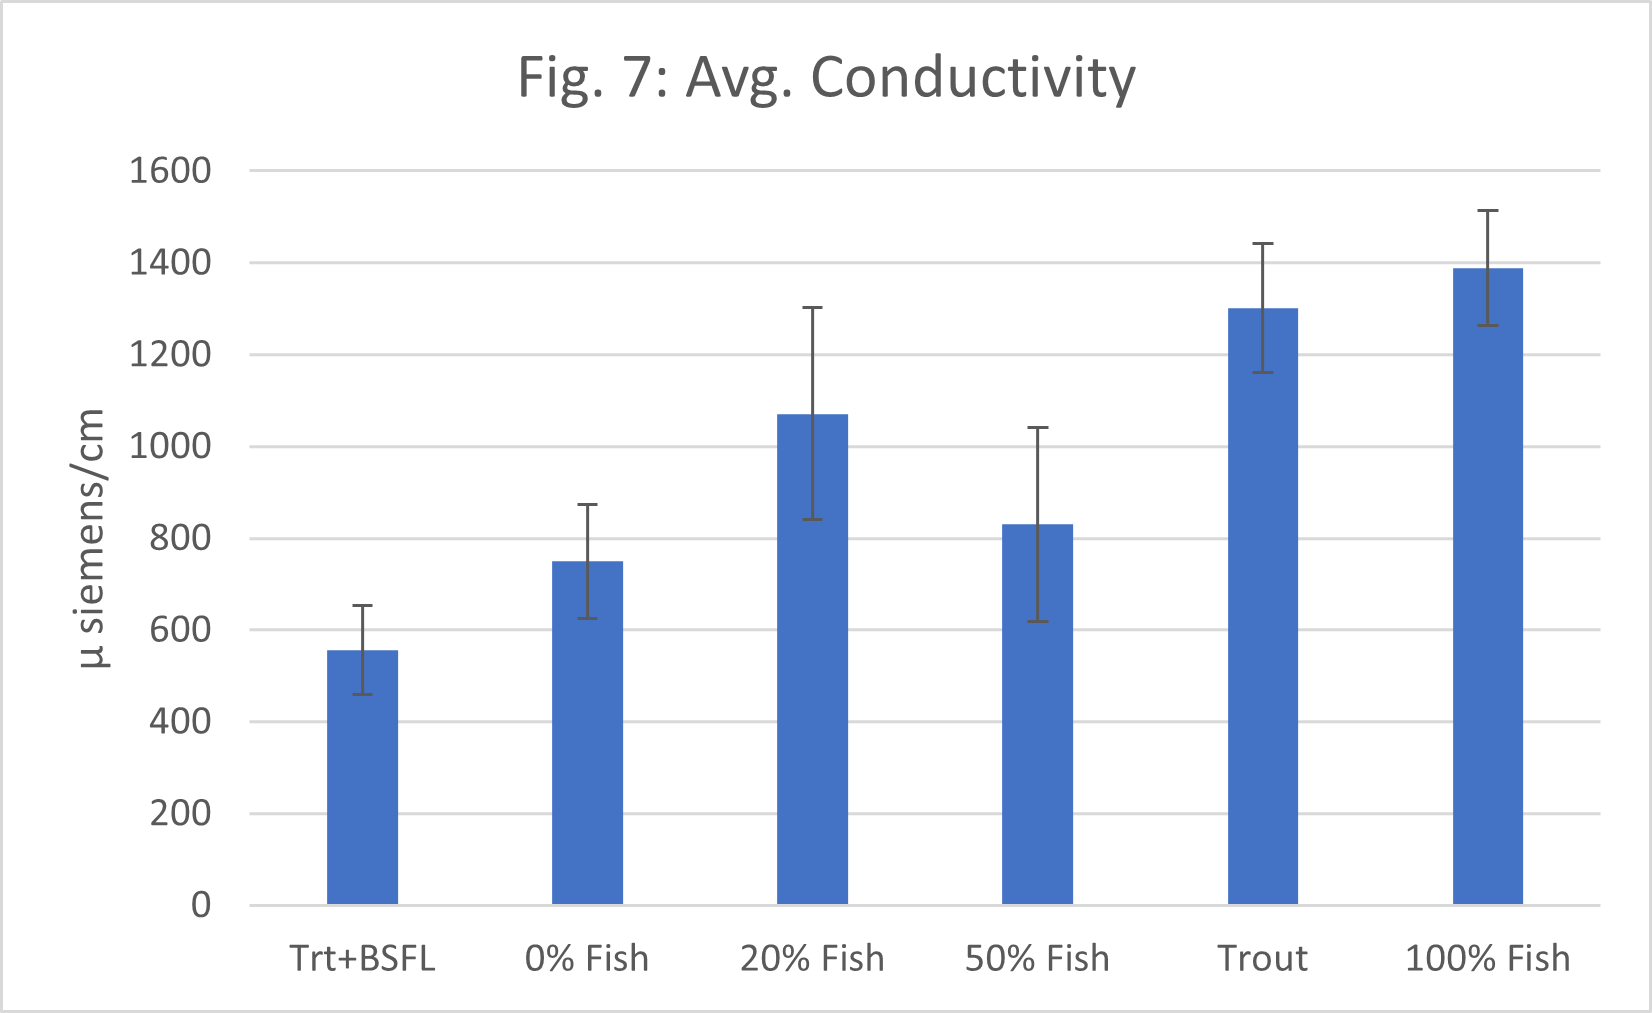
Figure 7: Average conductivity of treatments across experimental period. Conductivity is most relevant to plant growth. Cucumber and non-spicy peppers do well at conductivities between 1000 and 2000 micro siemens.
Canopy Farm, as an aquaponic grower, is as interested in vegetable produce production as it is in fish production. For aquaponic operations, produce makes up ½ - 2/3 of the revenue from the operation. In short, it takes 12-18 months to grow a fish to market size but it takes 12-18 weeks to grow a head of lettuce or a batch of cucumbers from seed. Cucumbers and bell peppers will fruit repeatedly over the life of a plant as well, resulting in a six week interval from crop to crop. Plants, especially leafy greens, also do not have the same density restrictions as fish so more mass can be produced per unit area.
The 50% Fish treatment produced the most vegetables of any system (Fig. 8). The 50% Fish treatment exceed the production of the best experimental diet, 20% Fish, by nearly a factor of 3. The Control and 100% Fish treatments production was exceeded by more than a factor of 5.
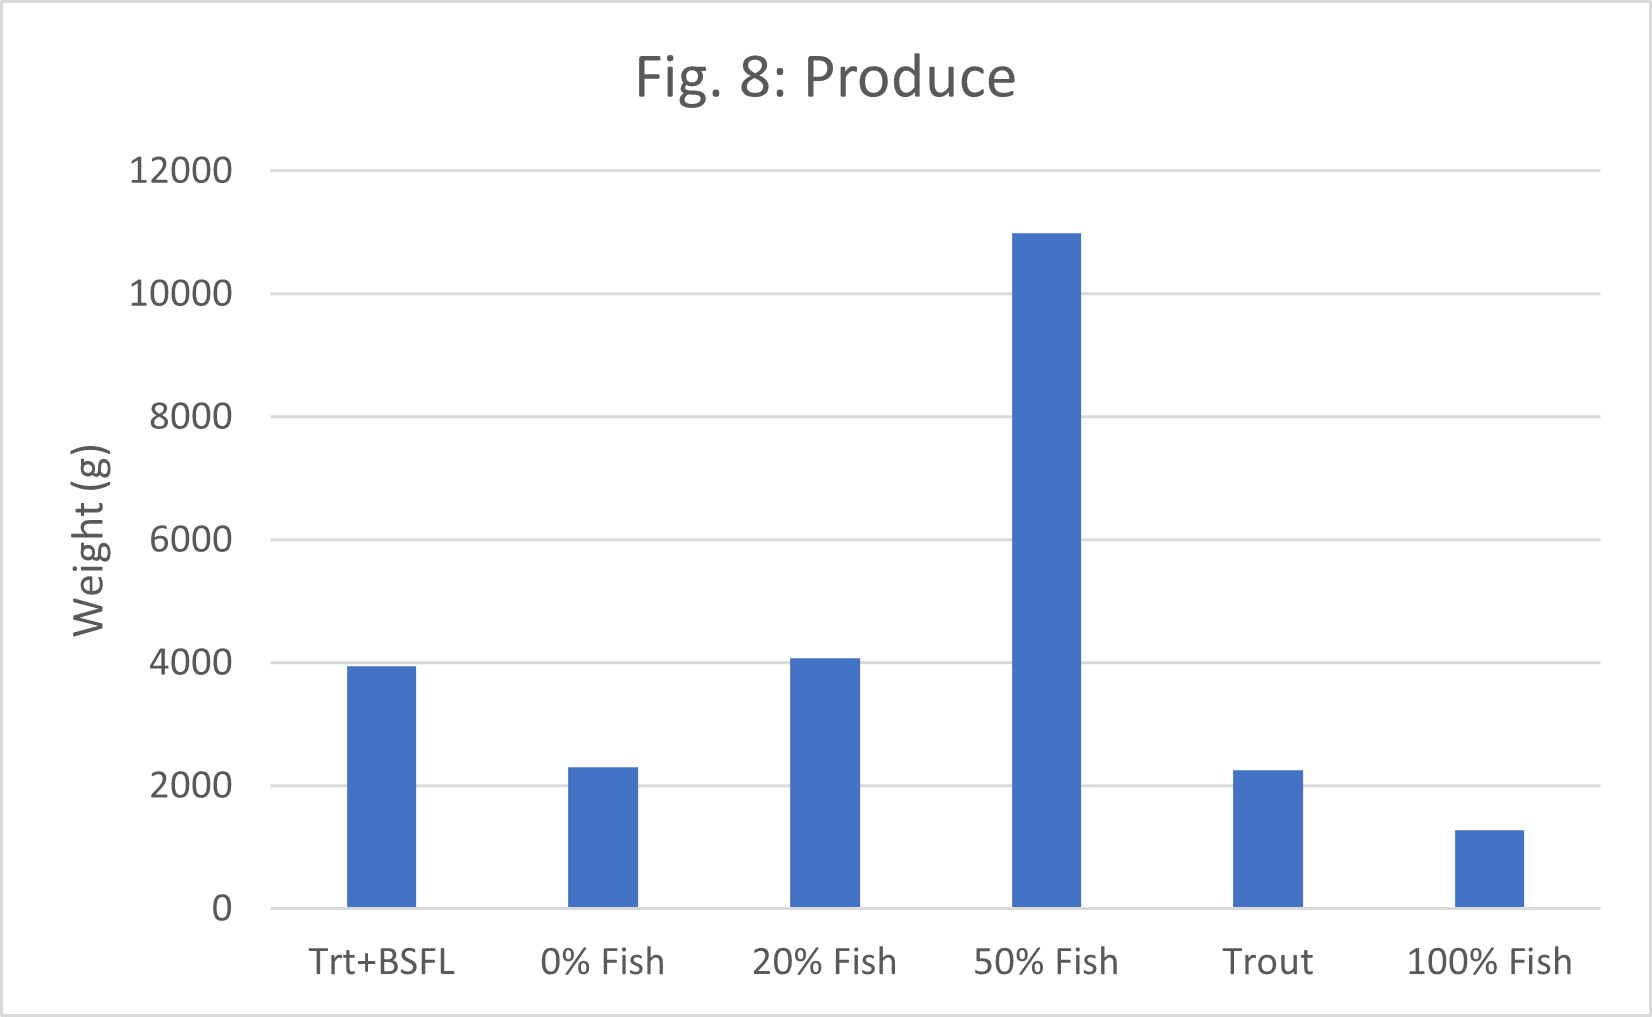
Figure 8: Produce production was clearly highest for the 50% Fish feed recipe. The 100% Fish feed recipe was associated with the least amount of produce grown.
We performed an economic analysis of the cost of making feed vs buying and shipping feed from an online retailer. The items were all ordered from the web at the best price available from reputable retailers that could be found within 5-10 minutes of searching. Shipping costs were included in the price of the item. Savings from bulk shipping of mulitple items from one retailer was not factored in, only the cost of shipping individual items. Locally available ingredients, Distillers Waste Grain, Beer Waste Grain and Soy Okara were considered free and had the effect of reducing feed costs by reducing the amount of fish meal and BSFL meal required. Feed ingredients were convered to $/g to calculate feed cost per 1000 lbs (453.6 kg), or 22 feed bags at 44 lbs each.
We considered the cost of our three mixes with BSFL, our 100% Fish mix and a readily available commercial feed (Control). Feed cost was sensitive to the cost of BSFL meal. The BSFL we used was donated by a manufacturer. At the start of the experiment no commercial sources of BSFL were available on the internet so we had to approach a manufacturer/ wholesaler directly. At the time of writing this report BSFL meal was available at a few internet retailers but most required contacting them to get a current price. The one location that simply listed a price, a feed ingredient site for pet reptiles, provided a price that worked out to $0.05 per gram. At the internet price our 0% Fish feed cost 10x as much as the commercial (Control) feed, before adding about $300 to cover personnel time to prepare, make and bag the homemade feed. Furthermore, the menhaden fish meal we used cost $0.003 per gram, over an order of magnitude less than the BSFL meal. Overall, the Control feed was the best buy at half the cost of even the 100% Fish feed we made from scratch. To be competitive with the 100% Fish feed made from scratch, BSFL meal would need to cost $0.005/g, similar to the cost of the menhaden fish meal (Entosystems estimates selling BSFL meal at $4/kg). At that price 50% Fish feed is the best value among the three BSFL meal feeds, though it would still cost about $372 more per 1000 lbs. Even then, the Control feed would still cost 41% less than the least expensive feed made from scratch. At a cost of $0.001/g BSFL meal is 36% more expensive than commercial (Control) feed and 6.6% less expensive than the 100% Fish feed made from scratch. At $0.005/g BSFL meal, soy protein isolate becomes the most expensive ingredient. A less expensive source of this protein content enhancer might bring the cost down sufficiently to make hand made feed competitive. At an estimated cost of $0.003/g for soy protein isolate, 100% Fish feed is only 10% more expensive than the commercial (Control) feed.
Table 4: Costs estimates for 1000 lbs (453.6 kg) of feed at different black soldier fly larvae meal (BSFL) costs. Prices are expressed on per gram basis. The $0.05 line represents a real price per gram found at an internet retailer (accessed 6/11/2023). Other costs lines are estimates to explore scenarios that would make reduced fish meal feed more economical. All non-control feeds would have $272-$300 added to the production costs to account for labor of two people to prepare the feed.
|
BSFL Cost |
0% Fish |
20% Fish |
50% Fish |
100% Fish |
Control |
|
$0.05 |
$10,698.12 |
$9,333.60 |
$7,286.99 |
$3,166.15 |
$1,865.29 |
|
$0.005 |
$3,576.18 |
$3,992.14 |
$3,538.60 |
$3,166.15 |
$1,865.29 |
|
$0.001 |
$2,956.99 |
$3,527.75 |
$3,212.71 |
$3,166.15 |
$1,865.29 |
None of the fish feed formulations exceeded the performance of the Trout (Control) diet. This is not surprising given the science and R&D that goes into making fish feed. However, we are impressed that the 20% Fish feed achieved 75% of the growth performance and FCR of the Control. Water quality parameters were equal to the Control and in some cases, like turbidity, better than the Control. This is particularly relevant for recirculating systems where color and particulates can concentrate over time and affect chemical, mechanical and biological performance.
One real surprise was how much better the experimental fish feed formulations did in vegetable production. The performance of plants in the 50% Fish treatment was led by impressive cucumber production over the course of the experiment. Because of how important vegetable production is to the bottom line of aquaponic operations, this finding is worth continued investigation. Why fish production was lack luster in comparison is a good question as well. BSFL are high in calcium, which is a requirement for cucumber plants. However, one would have expected the 0% Fish treatment to do well in cucumber production in that case, or the 20% Fish treatment. Still, the 20% Fish treatment did nearly double vegetable production over the Control and 100% Fish treatments.
Economically, it does not make sense for an aquaculture operation to make their own feed. Twenty-two 44 lb bags of a commercial feed cost significantly less than making the same amount of fish feed from scratch. Commercial feed sellers have economy of scale on their side when making fish feed, as in ordering thousands of pounds of ingredients vs. tens of pounds for producing feed on a quarterly basis. Even with shipping charges that add half again the feed price to the cost, buying the ingredients individually was far more expensive. In this experiment cost was sensitive to the price of BSFL meal. If BSFL meal can be scaled up to sell at $0.005/g ($2.26/lb) then it may be cost competitive with fish meal based commercial feed.
There is a non-tangible attraction to using BSFL as a protein source in aquaculture feed, despite the higher cost. For aquaculture producers focused on producing a sustainable product, feed using 100% fish meal as a protein source is hard to justify because of problems in the global fish meal supply chain. The fishing industry has created a dubious reputation for itself as a supplier of protein sources. Fish meal has documented negative impacts on global fisheries and local economies of developing nations. Illegal Unreported Unregulated fishing practices (IUU) are widespread globally and difficult to monitor, though numerous certification services exist and companies actively seek certifications to ensure the legality and sustainability of their fish meal. Unfortunately, the value and volume of fish meal used globally, in all manner of products, makes cheating an attractive and lucrative option (Check out the "Outlaw Ocean" podcast for more information). BSFL are a viable alternative without the anti-nutritionals contained in plant based protein alternatives.
The best of our experimental diets performed at 77% of the commercial trout (Control) diet. However, this was our first time making a trout diet and only the second iteration of the alternate fish feed experiment. This experiment provided a range, 50% - 80%, for which black soldier fly meal can be substituted in trout feed and provide good fish and vegetable growth. We also have certified results for the crude analysis and AA levels for the feeds which can be checked against published literature for fine tuning. The next step is a replicated experiment with Control feed vs. a BSFL meal feed in the 50% - 80% fish meal replacement range.
Education & outreach activities and participation summary
Participation summary:
This year, we gave over 25 tours of our facility and reached over 300 people with information about aquaponics, greenhouse growing, aquaculture, and local opportunities at our facility. In 2023, we already have school tours with surrounding middle and high school students scheduled, as well as a partnership between Mt Ararat High School students to assist in building an aquaponics system in their classroom. (CF Class Visit Template 2022)
We also are a host site for the University of Southern Maine MEDF intern to develop the aquaculture/agricultural workforce by giving an opportunity for students to gain first hand experience working on a farm, aspects of running a business, and aquaculture practices. We hope to continue this work of education into 2023 and expand our programs by adding a summer intern and getting connected with more schools in our area.
Learning Outcomes
This year was the first year that the participating farmers at Canopy Farms raised trout fingerlings, so after this year we have increased our awareness of the water quality parameters, best practices in temperature management, and timeline management of when to receive fingerlings, when to transfer, and how much to feed/stock in density. This will inform our second phase of the experiment with a greater survival rate of fingerlings.
For education to the community, we have learned and would recommend (for Maine) running interpretive programs for indoor sustainable agriculture in the winter, where there are less activities for the public to attend, therefore boosting attendance at local "science cafe" nights we hosted at the farm. We found people interested to come to our event, and depending on funding would like to run this program again and invite other local farms in our area to discuss sustainable agriculture with the public.
Project Outcomes
We have found that brown trout fed a diet with mixed black soldier fly larvae meal (BSFLM) and fish meal perform nearly as well as fish fed commercial fish feed. Brown trout fed a homemade fish feed performed as well as fish fed a commercial feed. We have had zero mortality and good growth from our 100% menhaden homemade fish feed. Our homemade pellets are pressed, not extruded. Despite this we are seeing good growth from the fish and palatability of the feed. Our mixes with 50% BSFLM and 80% BSFLM have also performed well, showing good palatability of the food.
We have had five undergraduates work with USM as part of the experiment team. We also established a working relationship with a feed researchers at the University of Maine. Eleven undergraduates were introduced to the study through an aquaculture course taught at USM that also used the experimental space.
One farmer, outside of Canopy Farm and Koskolos Sea Vegetables was introduced to the experiment. He is a trout farmer in the area interested in feeding BSLF to his trout. We advised against feeding raw larvae based on the results of this study.
Thus far our experiment has addressed the issue we set out to study. We developed, collected the ingredients for and made four experimental fish feeds in house that adjust the amount of fish meal. Unfortunately, it does not look like completely removing fish from the feed for brown trout is an option. At least not with BSFLM as the primary ingredient.
Our experiment was plagued by challenges from the absurd to the sublime, some of which were avoidable. Our previous experience was with tilapia and rainbow trout in large systems. Brown trout are more aggressive, more inclined to jumping and escape attempts and more likely to overeat than either of those other species. In preparing, our primary concern was meeting the temperature requirements of the species so some of these other problems caught us off guard, like how short the season to order fingerling trout is. Collecting ingredients during a global pandemic is more difficult than one might think, etc. Some of these observations come only from experience with a new species and new process. We will certainly be better prepared for the acclimation and acquisition processes in the next iteration of the study.
The feed formulation ended up being more complicated than we originally thought. Researching the final feed formula pointed out a number of anti-nutritional concerns that we had not considered when first proposing the experiment. In this first iteration we went all out to find means in the literature to remove these anti-nutritionals. Acquiring and treating ingredients extended the prep time to starting the actual experiment. We're curious if these steps were really necessary. In other words, if we run pressed food with anti-nutritional elements treated against feed without anti-nutritionals untreated is there a growth or survival difference? Extruders are the standard in making fish feed. Are the anti-nutritional treatments still necessary given the heat and pressure that are part of making extruded fish feed? Will fish grow better on the extruded feed than the mill pressed feed?