Final report for FNE22-025
Project Information
This project looked at mulch production from different sources at different times of year over two seasons. The mulch was used in a cut-and-carry system to mulch cucumber crops, and the nitrogen release from the soil and soil health indicators were both tracked after the mulch application.
Cut-and-carry, or transferred, mulch systems can be an effective method for weed control in an organic no-tll system. One of the limiting factors is the quantity of mulch that can be produced at the early part of the season when vegetable planting needs to occur. We measured production of mulch from a few different sources and found that sufficient mulch could be produced for the planting windows that we tried. Our results could be used by producers who want to use a similar system to get an estimate of how much land they need to set aside for mulch production in order to make the system work.
We also measured soil health characteristics and nitrogen dynamics. The experiment was not done over a long enough time period for definitive results on the soil health characteristics. We did find that nitrogen could be limiting in these systems; producers should either add nitrogen before applying mulch, or plan to take PSNT tests and to add supplemental nitrogen in a very soluble form in the case of nitrogen deficiencies.
The results were shared in this report and in a field day at the farm.
Objective 1—Measure contents of mulch material
Producing enough mulch in the spring, and estimating the mulch available to cut in a given site are key challenges. We will measure total production of dry matter and nitrogen of multiple mulch-producing areas and at multiple harvest dates.
Objective 2—Track nitrogen dynamics
We suspect we experienced nitrogen deficiency in some mulched areas in 2021. We will track nitrogen availability in the soil at planting and throughout the season with PSNT sampling in three mulched cucumber plots with different planting dates mulch materials.
Objective 3—Measure changes in soil health indicators over time
We have experienced some compaction issues in our first two years of transition to no-till, and want to document the improvements in soil health over time as we transition. We will assess the soil health annually in both the three crop sites and three areas where mulch is harvested. We will sample these same 6 sites all three years of the study; the soil health changes will not necessarily be correlated with the data gathered in Objectives 1 and 2, but will help us to measure changes over time as we implement the new system.
Soil health has always been a driving force at our farm. We decided to commit to sharply reducing our tillage after the extreme wet weather that we experienced in the late summer and fall of 2018. At that time, crop productivity ground to a halt due to waterlogged soils even at our excessively well-drained farm, and we experienced erosion in places. Climate projections point to greater overall rainfall in the Northeast, but also with increasingly irregular patterns characterized by periods of both drought and extreme wetness. This pattern expressed itself again in 2021, with the wettest July on record following dry conditions through the 2020 season and into the spring of 2021. We are hopeful that reducing tillage will increase our resilience to increasing climate disruption, as organic matter can act as a sponge to absorb moisture in wet conditions and retain it in drier times. Reduced tillage systems conserve soil, improve water quality, increase soil quality, and can reduce both environmental and economic risk. We also hope that we can act as an example to other farmers looking to reduce or eliminate tillage.
Our reduced-tillage system consists of two basic systems: an intensive compost-mulch system using tarps for weed control, and an extensive transferred-mulch system started in 2021, that is the subject of this project.
In our transferred mulch system, cover crop or pasture is mowed with a collection flail mower which collects the material and then can dump into a manure spreader which then spreads that mulch onto the field to be planted. This added mulch is in addition to whatever mulch was grown in situ, and the combined total needs to be a large enough quantity to suppress weeds. After mowing the in situ mulch and then applying additional mulch, we use a waterwheel transplanter which we modified based on Tony End’s work in SARE Project FNC 12-857. While we were generally happy with this system after the first season, we have many questions about optimizing the system. We experienced the following challenges:
- Matching the timing of mowing cover crops to the timing of planting crops. Our most intensive planting period is in late-April through early June. Winter annual cover crops are at the correct stage to be mow-killed in late May to early June; some of our in situ cover crop mixtures were mowed too early and regrew, competing with the crops that were planted into the mulch. We are dealing with this problem by planting more oat/pea sections for the earliest plantings where possible, and plan to kill rye with tarps for mid-spring plantings. We have also planted several different winter cereal crops (wheat, barley, triticale, and rye, in mixture with peas and/or vetch,) in the hopes that there will be a range of maturity dates among those different grains.
- We found that we needed to add more mulch for effective weed control. Our only measurement of how much mulch we apply is in cubic yards calculated by manure-spreader-loads. Since the mulches we are applying very greatly in moisture and nutrient content, and each mulch material changes rapidly as it grows in the spring, we want to develop better estimates of dry matter and nitrogen applied per bed, along with estimates of how much nitrogen may be available to harvest for mulch.
- We experienced some problems with transplants growing slowly after planting, possibly due to nitrogen tie-up. In some of the plantings that got “stuck,” we had a good response to fertigation with Chilean nitrate. Since both the in situ and transferred mulches vary greatly in growth stage and nutrient content at different planting dates, we plan to measure the nitrogen conditions across the whole growing season. This can be correlated with the nitrogen content and C:N ratio that we are measuring in the applied mulch. We know we are applying significant quantities of nitrogen in the form of mulch, but we would like to better be able to predict how much will be available.
- We had problems with compaction in our soils, leading to poor transplant establishment. The transition to no-till systems can sometimes be associated with short-term compaction issues that resolve themselves as soil health improves (Caro Rozell, personal communication, based on conversation with several organic farmers who have transitioned to reduced-tillage systems.) We plan to measure compaction and soil health indicators over time as we transition into the no-till system, and document any improvements that occur.
Simple Gifts Farm was established in 1999. The farm operation produces 12 acres of organic vegetables and small fruits on a total footprint of 50 acres that includes extensive pasture for 15-20 beef cattle and 200-300 laying hens. Farm products are sold direct to consumers through an on-site farm store and Community-Supported Agriculture program. Farm operations ceased in March of 2024.
Cooperators
- - Technical Advisor (Educator)
Research
Methods as proposed:
Objective 1—Measure dry matter production, percent nitrogen, and regrowth potential for multiple spring mulching materials and dates
We will be transplanting vegetable starts into mulched plots every week from late May through early June. In each case, the source of the mulch will include the mulch grown in situ, and additional mulch that will be mowed and transferred from another field. The actual mulch that we use on a given date will be dependent on the cover crop size, maturity, and distance to the area to be planted. It would be helpful if we could look at a stand of cover crop and estimate how many tons of dry matter are there so that we can estimate how many blocks of cover crop must be cut and transferred to mulch the crop blocks that are on the schedule for a given week; this objective will give us more information on which to base those estimates. We will take weekly samples of transferred mulch from 4 sites of the mulch that is mowed that week. The cover crops that we have planted for the 2022 season include rye, barley, wheat, and triticale, in some cases mixed with legumes; we will document the flowering stage of the winter cereals at time of mowing.
Measurements of dry matter and yield of these transferred mulches will help us estimate how many blocks of cover crop must be cut and transferred to mulch the crop blocks for a given week. The transferred mulch is mowed directly into the hopper of our collection mower and then dumped into a manure spreader for application to the field to be planted. Before mowing, we will measure the height of the mulch crop, and note its species composition, maturity level and overall condition. Then we will mow the mulch, dump it into the manure spreader, and take a subsample of the material in the manure spreader, using a box of standardized volume. This information can be used to calculate a total weight of mulch produced per acre from the cubic yards per acre that can be measured by counting spreader-loads per acre. Dry matter, total carbon and total nitrogen content will be determined for that material by sending a sample to Dairy One Forage Laboratory. From that information, we can calculate a total dry weight produced per acre, along with total carbon, nitrogen, and carbon to nitrogen ratio. For each of four different blocks mowed for mulch on a given week, representing 4 different cover crop or pasture mixtures, we will sample 3 manure spreader loads in order to standardize for the material in the field.
For the cucumber blocks that are planted and PSNT-sampled in Objective 2 below, we will sample the in situ mulch in (3) 0.1 square meter sections of the in situ mulch after mowing, and measure the total weight and volume of mulch produced, and send the material for the same forage testing. In the weeks that we sample the in situ mulch, we will sample one less block of mowed mulch, for a total of 4 sites sampled in that week. This will allow us to calculate the total dry matter, carbon, and nitrogen per acre for the in situ mulch. This number will be added to the mulch that is cut and transferred to the site to get totals for the field.
These samples will be repeated every season for the three seasons of the project.
Objective 2—Track nitrogen dynamics in mulched soil
Three plots will be selected where we will plant an early-, mid- and late-planted mulched cucumber crop. The in situ mulch for the early field (approximately May 1st,) will be winter-killed oats and peas; the middle date (approximately May 21st) will be overwintered cereal/legume mixture that is mowed approximately 2 weeks before the scheduled planting date and tarped, and the late planting (approximately June 15th) will be an overwintered cereal/legume cover crop that is killed by mowing. All three plantings will have additional mulch applied with a composition based on what is available to mow at that time of the season, and documented in Objective 1 above. Each of these 3 blocks will be divided into three sub-blocks.
At the time of planting, and every two weeks after that until approximately September 15th, a soil sample will be collected from each of the nine sub-blocks and a PSNT test will be submitted to University of Connecticut soil testing laboratory. Penetrometer readings will also be recorded at that time.
The crop plots will move over the course of the 3 seasons, and samples will be taken from the areas where cucumbers are grown every season.
Objective 3—Measure changes in soil health indicators over time
We will take annual soil health assessments based on the NRCS Cropland soil health assessment protocol (https://directives.sc.egov.usda.gov/OpenNonWebContent.aspx?content=44419.wba), We will also send samples of soil to the Cornell Soil Health Laboratory for Cornell Assessment of Soil Health (CASH) tests. These samples will be taken from the 3 mulched cucumber blocks in the first year, and 3 blocks that are used to produce mulch in the first year. We will return to the same 6 sites in each of the 2 subsequent seasons to document any changes in soil health that occur over time as we transition into a reduced-tillage system. These soil health changes won’t be directly correlated to the mulch treatments in Objectives 1 and 2, but will help us to assess the extent to which our overall transition to a reduced-tillage system accomplishes the goal of dramatically improving our soil health.
Annual Report 2022 (Year one of three)
Objective 1—Measure dry matter production, percent nitrogen, and regrowth potential for multiple spring mulching materials and dates
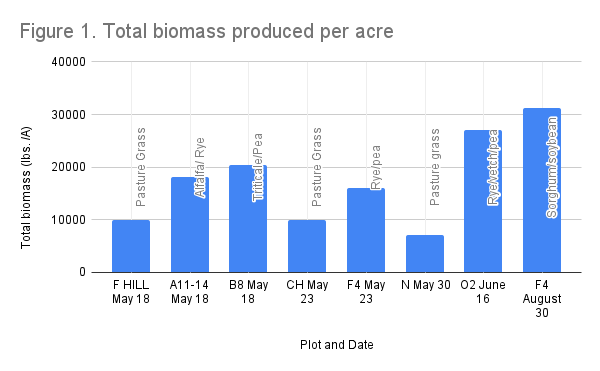
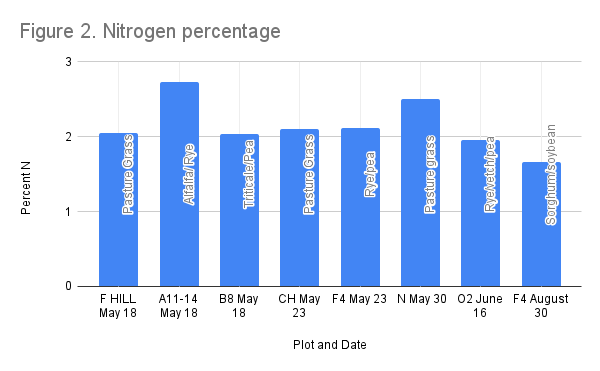
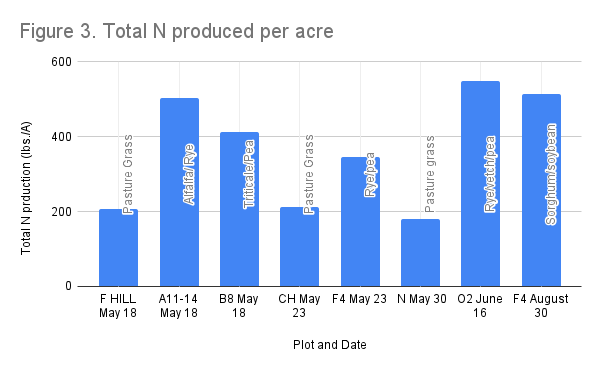
Samples of mulch were taken from 8 different locations and sampling dates. Three samples were taken from each site, and sent to Cumberland Valley Agricultural Services for analysis of dry weight and nitrogen content. These numbers were converted to a per-acre basis and are summarized in figures 1, 2, and 3. In general, annual cover crop plantings produced much higher biomass yields per acre than pasture, and the over-wintered cover crops produced more biomass at later harvest dates. The samples from F hill and N were both a second cut for the season, so the overall biomass produced per season for the pasture sections is more competitive than with the cover crop sections than it would appear from these numbers. Pasture definitely has a role to play in a cut-and-carry system since it tends to grow faster in the early spring and thus have more material available for the first vegetable successions. The CH pasture is a low-quality stand of pasture, so the production there is also not indicative of the general value of pasture as a mulch-producing unit. The nitrogen content was higher in some, but not all, of the pasture plots. The higher biomass production in the cover crop plants meant that total nitrogen production was much higher in the cover crop plots.
Objective 2—Track nitrogen dynamics in mulched soil
Three separate planting areas were established that represented 3 different planting dates; the plantings were all mulched and planted with cucumbers. Each planting area was separated into 3 subplots, and biweekly PSNT and Penetrometer readings were taken during the growing season. The planting dates, existing cover crop, preparation techniques, and added mulch are listed in Figure 4.
Table 1. Cucumber Site information
|
Plot ID |
Planting Date |
Added N Fertilizer |
In Situ Mulch |
Preparation |
Added Mulch |
Mulch Source |
|
C1 |
May 19 |
333 lbs./ A Nature’s Safe 13-0-0, applied 5/12 |
Barley, Pea, Vetch, Daikon |
Tarped |
Alfalfa/rye 172 yd/A |
A11-14 |
|
D8 |
June 3 |
333 lbs./ A Nature’s Safe 13-0-0, applied 5/4 |
Wheat, Oat, Crim. Clov., Daikon |
Tarped |
Rye/Pea 172 yd/A |
F4 |
|
D6 |
June 21 |
None |
Rye/vetch |
Rolled, then mowed |
Rye, Vetch, Pea 90 yards/A |
O2 |
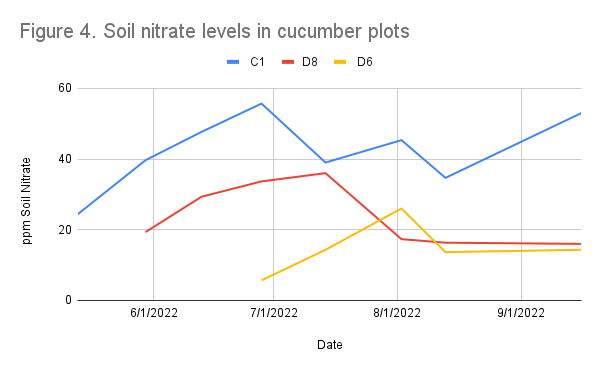
The PSNT samples followed a similar pattern in all three planting sites, with relatively low soil nitrates, followed by a rise, and a gradual decline. This pattern was expected based on the gradual release of N into the soil as the organic material in the mulch and soil was mineralized. C1 and D8 both exhibited soil nitrate levels in a range high enough to support crop growth, with C1 being higher than D8 on all dates. D6 had a very low nitrate level at first sampling, and didn’t go above 20ppm until August. The lower nitrate levels were expected in the latest planting, and consistent with our observations of crop growth/health in both 2021 and 2022. We had suspected that the full growth of rye cover crop would scavenge much of the nitrogen from the soil, and these results confirm that impression, even where legumes were present with the rye. The lack of N fertilizer in D6 probably exacerbated this situation. We plan to add N fertilizer after mowing full-grown rye in the future, and will assess whether fertilization overcomes this deficiency. The higher nitrate levels in C1 may be due to past crop history; C1 was cover-cropped with sorghum-sudangrass, millet, soybean and sunn hemp in summer 2021, and it could be that there was sufficient nitrogen from those previous cover crops.
Objective 3—Measure changes in soil health indicators over time
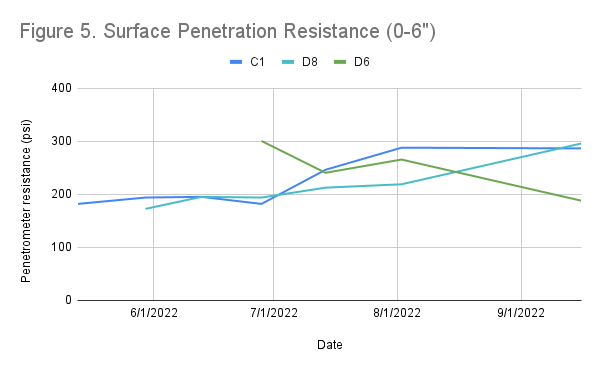
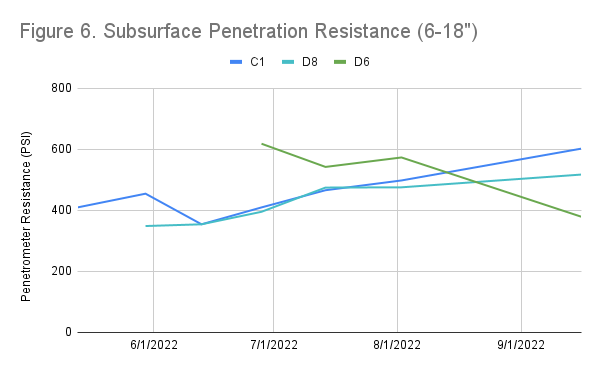
Biweekly penetrometer readings were taken with a digital penetrometer in the mulched cucumber plots at the same times as the PSNT sampling. Contrary to expectations, penetration resistance in C1 and D8 increased over the course of the season. Hardness values were taken in the row in line with the plants, not the pathway, to minimize the impact of foot traffic on readings. However, increasing penetration resistance in these fields is likely due to two factors: drought and weediness. Penetrometer readings are moisture sensitive and drought would tend to increase hardness results. Root structures, especially the robust and fibrous root systems of grass type weeds, also present friction which can increased penetration resistance. Both the moisture sensitivity and root influence on PSI readings are known limitations of penetrometers as a tool for accurately evaluating soil hardness in the context of living plants.
While C1 and D8 penetration resistance increased over the course of the season, penetration resistance in D6 declined. This may be due to root friction related to cover crop maturity and weed pressure; C1 and D8 started out with low weed pressure in the first month after planting, and then developed substantially higher weed pressure than D6. The weed suppression in D6 was in part attributable to the greater maturity of the cover crop at the time of mowing, which provided longer spring and summer weed suppression. However, the rye in the mix, having more time to develop robust root systems, is likely the reason for higher penetration resistance than other plots from the first readings, as the more mature roots would create greater penetrometer friction than fields in which roots were less mature at the time of termination. It would also explain the significantly lower penetration resistance recorded later in the season, as the longer growing time would provide greater soil loosening effect and structure improvement; as those roots decayed, the resulting PSI was significantly lower than in the other two plots where cover crops were terminated at a stage in which root systems were less mature. Since the weed suppression was much better in D6, there was also less penetration resistance impact from weed roots at the end of the season, compared to D8 and C1.
If our interpretation of these results is correct, this represents an interesting trade-off in the timing of cover crop termination and mulch application in transferred mulch systems; more mature cover crops translate into greater N lockup, but potentially better soil health outcomes in terms of compaction mitigation, infiltration, and related benefits. The timing of cover crop termination is driven more by the crop planting schedule than the soil benefits, but factors such as N tie up are important to consider for crop management goals including N fertilization.
In order to tease these impacts out, it will be helpful to continue these observations in the coming years as weed pressure dynamics and soil moisture dynamics change from season to season.
Soil Health Assessment and Comprehensive Assessment of Soil Health Test Results
Soil health assessment using NRCS In Field Soil Health Assessment (IFSHA) protocol revealed very similar soil health outcomes across sites, with the exception of soil structure, which was less platy in D8 than in C1 and D6. Aggregate stability was not assessed in the field; Cornell Soil Health lab provides a lab-based test and we considered this to be a more accurate test. Aggregate stability, as assessed by Cornell’s lab results, and soil compaction, as indicated by high penetration resistance and the presence of platy soil in two of the fields, were the primary resource concerns identified.
Table 2: Soil Health In Field Assessment Results. Green cells indicate that the field met assessment criteria, red cells did not.
|
Indicator |
C1 |
D8 |
D6 |
|
Soil Cover |
|
|
|
|
Residue Breakdown |
|
|
|
|
Surface crusts |
|
|
|
|
Ponding / Infiltration |
|
|
|
|
Penetration resistance |
|
|
|
|
Water stable aggregates * |
|
|
|
|
Soil structure |
|
|
|
|
Soil color |
|
|
|
|
Plant roots |
|
|
|
|
Biological diversity |
|
|
|
|
Biopores |
|
|
|
Table 3. Selected Cornell Soil Health Test Results
|
Sand % |
Silt % |
Clay % |
Total C |
Total N |
Active Carbon |
Respiration |
Aggregate stability |
Organic Matter |
CASH score |
|
|
C1 |
52 |
38 |
10 |
2.77 |
0.185 |
710 |
0.47 |
26 |
3.58 |
61 |
|
D8 |
47 |
43 |
10 |
3.029 |
0.192 |
706 |
0.46 |
26 |
3.87 |
68 |
|
D6 |
43 |
42 |
15 |
4.077 |
0.257 |
953 |
0.63 |
29 |
5.15 |
76 |
According to Cornell’s Comprehensive Assessment of Soil Health (CASH) results, D6 showed overall the highest soil health indicators. Table 3 above provides selected results from the CASH test results. All soil health indicators were higher for D6, including total N, which we found interesting given that D6 had the lowest PSNT results throughout the season, indicating that the greater maturity of that cover crop may cause significant N tie up.
D6 also has the greatest percentage of clay, which may account for all of the increased soil health outcomes, given clay’s known properties of holding nutrients, water, and organic matter. We can’t know whether the greater cover crop maturity and longer days in living cover contributed to these higher soil health test results outcomes.
Penetration Resistance
The location of the 2023 trial and the growing season of 2023 presented significant challenges for collecting penetrometer readings. The location of the 2023 mulch trial plots happened to be placed in a far more rocky and gravelly portion of the field than the 2022 trial, with the exception of a leaf-mulched plot (B2) that we also tracked in 2023, which was not very rocky. As a result, it was far more challenging to collect accurate data in B12 1-3. Standard practice was to stop at 12 points in a zig zag fashion across each trial strip, and attempt 5 times at each of the 12 points to collect both a surface and subsurface penetration resistance reading that was unimpeded by stones. After attempting 5 times and repeatedly hitting stones, we record “TR” for “too rocky” and move on to the next point. If we are able to collect a value for surface penetration but not for subsurface penetration resistance (6-18”) It is typically possible to detect larger stones interfering with the penetrometer and reset the instrument, but for very small stones it is not always possible for the operator to detect them. When there is a high prevalence of small stones, it can be very difficult to collect penetrometer readings that reflect soil hardness rather than gravelly areas of the soil.
In many cases, our penetrometer records for 2023 include gaps in our data in which the operator was unable to collect data for any of the 12 points, because of the thickness of stones that blocked the penetrometer at all 48 attempts. This was far more common in the 6-18” depth range (subsurface). Additionally, heavy rains in July made it difficult to find a date to collect penetration resistance data in optimal field conditions (field moist soil).
Ultimately, average plot penetration resistance fluctuated across the season in 2023 in plot B12 1-3, with no discernable trajectory. The variability of the readings is most likely attributable to the difficulty of collecting accurate readings with so many fine to medium stones. By contrast, B2, a far less stony field that was covered in leaf mulch that we tracked in 2023, appeared to gradually decrease and then increase in surface penetration resistance over the course of the growing season with a roughly opposite trend in subsurface resistance. This is an interesting and unexpected result.
Annual Report 2024:
We ceased farm operations in March of 2024, so the experiment was not conducted for the intended third year.
Cut-and-carry, or transferred, mulch systems can be an effective method for weed control in an organic no-tll system. One of the limiting factors is the quantity of mulch that can be produced at the early part of the season when vegetable planting needs to occur. We measured production of mulch from a few different sources and found that sufficient mulch could be produced for the planting windows that we tried. Our results could be used by producers who want to use a similar system to get an estimate of how much land they need to set aside for mulch production in order to make the system work.
We also measured soil health characteristics and nitrogen dynamics. The experiment was not done over a long enough time period for definitive results on the soil health characteristics. We did find that nitrogen could be limiting in these systems; producers should either add nitrogen before applying mulch, or plan to take PSNT tests and to add supplemental nitrogen in a very soluble form in the case of nitrogen deficiencies.
Education & outreach activities and participation summary
Participation summary:
November 6, 2022 MOFGA Farmer to Farmer Conference, Organic No-Till Farming:
A Response to Climate Disruption
January 14, 2023, NOFA Winter Conference, Organic No-Till Farming:
A Response to Climate Disruption
Learning Outcomes
The results of this project were presented in two presentations and at a field day. Participants reported that their knowledge of organic no-till systems in general and of cut-and-carry mulch systems in particular were increased by this project.
Project Outcomes
We demonstrated that cut-and-carry mulch systems can be an effective way to control weeds in an organic no-till system. Measurements of mulch production from various sources at various times of year was measured, and could be used to help other producers with decisions about how much mulch they might be able to produce from cover crops or from pasture. The results were shared at two presentations and one field day. The third season of trials did not take place due to a closing of the Simple Gifts Farm operation.
We were able to establish some baseline information on mulch production from several different cover crops and pasture sources. We also were able to establish more definitively that nitrogen can be a problem in transferred mulch systems. Further work on production from different mulch sources would be helpful for further developing the system.
Two of our bigger challenges with the transferred mulch system were not addressed by this project. The first is developing technology that can cut through the thick mulch so that transplanting can occur. We managed to plant crops, such as cucumbers and tomatoes, into the mulch, because the increased per-plant time to plant through the mulch wasn't consequential compared to the benefits in terms of reduced weeding labor and better moisture management. A better transplanting system would be helpful for transplanted crops that require a higher density. A second challenge is stockpiling mulch that is produced in the summer to use for the following season. We could have reduced the amount of land that was needed for mulch production if we had done this, but this technique was not addressed in this project.
We have shut down our farm operations and so we are not still using this transferred mulch system. But we would still be using the transferred mulch system if we had continued to operate our farm.
Annual Report 2023
Objective 1—Measure dry matter production, percent nitrogen, and regrowth potential for multiple spring mulching materials and dates
Samples of mulch were taken from 3 different locations at each of 2 sampling dates (6 samples total,) and sent to Cumberland Valley Agricultural Services for analysis of dry weight and nitrogen content. Half of each of the two plots (A15-17 and C1) which contained an overwintered small grain cover crop was harvested on the first sampling date, and the remaining portion of the plot was sampled on the second sampling date. This allowed us to assess how much additional growth occurred in that 3 weeks of growth. The pasture plot (A13) was all cut on the first date, then allowed to regrow, and cut and sampled again on the second date. The different management strategies reflect realistic options for managing mulch harvested from cover crops vs. pasture; the pasture is likely to yield less biomass on the first cut, but to allow for some regrowth to occur. A13 was a well-established stand of mostly alfalfa that had rye seeded into it in fall 2022, and yielded more biomass than either of the small grain plots on the first cut, and then still yielded well on the second cut; the total biomass harvested on the two dates was much higher than the best yield of the small grain plots.
We did obtain measure carbon content of the mulch material in 2023, which allowed us to assess carbon:nitrogen ratios. The mulch material ranged from 20 to 30 C:N, which would indicate that it should decompose effectively and with little tie-up of nitrogen.
Table 1. Biomass and Characteristics of Mulch Harvested in 2023
Plot/date
Species
Biomass per acre (lbs. DW)
Total lbs. N per acre
C:N ratio
Ratio area cut: area mulched
A12 5/18
Pasture/rye
4192
111
C1 5/18
Wheat/Vetch
3736
77
23
4.4
A15 5/18
Barley/Vetch/Rye
4074
77
20
6.0
A12 6/5
Pasture/rye (regrowth)
5426
85
30
6.0
C1 6/5
Wheat/Vetch
6325
129
30
A15 6/5
Barley/Vetch/Rye
7893
118
23
Objective 2—Track nitrogen dynamics in mulched soil
Cucumbers were planted on three different dates in plots directly next to each other, with a field preparation and mulching regime as noted in Table 2 below. A fourth plot was also sampled that was mulched with leaves collected from landscapers the previous fall. This plot was planted to brassica crops and onions. Samples were taken from the plots at 8 dates during the season, and a Pre-Sidedress Nitrate Test was performed on the samples. In addition to the 3 cucumber plots, we also tracked nitrate levels in a plot that was mulched with leaves and planted to brassica and onion crops.
The PSNT results are summarized in Figure 1. The release of nitrogen generally followed a similar pattern as the pattern observed in 2023, with an early flush of nitrogen availability followed by a tapering off over the course of the season. The 2023 results showed a much lower overall nitrogen level, with only one sample out of 23 reaching 30 ppm, and most of the results below 20ppm (additional N fertilization is generally not recommended for cucumbers at PSNT results above 25-30 ppm). It is likely that the yield of cucumbers was affected by lack of N, though no signs of N deficiency were observed in the field during the season. This lower N level could have been due to leaching due to a much wetter 2023 season. It could also be that the baseline soil conditions were better in the 2022 fields. Total organic matter and total soil N contents were both higher across the board for the 2022 fields than the 2023 fields. The difficulty of side-dressing N during the season to address deficiencies is one drawback to the mulch system. It may be that adjusting initial fertilization based on organic matter would be a good idea. Feeding N through either drip-injection or through foliar feeding also may be a way to provide a nitrogen boost during the season.
Table 2. Cucumber Site information
Plot ID
Planting Date
Added N Fertilizer
In Situ Mulch
Pre-mulch Preparation
Added Mulch
Mulch Source
B2
May 1
400 lbs./ A Nature’s Safe
13-0-0
Oat/Pea
Winter-killed
Leaves
B12-1
May 17
400 lbs./ A Nature’s Safe
13-0-0
Wheat/vetch
Tarped 4/20
Alfalfa/ pasture grass/rye 192 yds/A
A11-14
B12-2
June 7
400 lbs./ A Nature’s Safe
13-0-0
Wheat/vetch
Mowed and Tarped 5/16
Barley/ Vetch/Rye
192 yds/A
A15-17
B12-3
July 5
None
Wheat/vetch
Mowed 7/2
Data lost
Objective 3—Measure changes in soil health indicators over time
Soil Health Assessment and Comprehensive Assessment of Soil Health Test Results
Table 3: Soil Health In Field Assessment Results. Green cells indicate that the field met assessment criteria, red cells did not.
The mulched plots all had the same soil health outcomes, other than slightly better soil structure in the leaf mulched plots which was likely more attributable to a different management history of this block than to the different mulch materials. The history of B2 is that it had been managed with a heavy compost mulch and intensive no-till production since 2021.
Indicator
B2
B12-1
B12-2
B12-3
Soil Cover
Residue Breakdown
Surface crusts
Ponding / Infiltration
Penetration resistance
Water stable aggregates *
Soil structure
Soil color
Plant roots
Biological diversity
Biopores
Table 4. Selected Cornell Soil Health Test Results
Sand %
Silt %
Clay %
Total C
Total N
Active Carbon
Respiration
Aggregate stability
Organic Matter
CASH score
B2
56
33
10
2.11
0.16
692
0.4
26.8
3.4
68
B12-1
59
30
9
2.57
0.19
573
0.4
31.5
3.55
68
B12-2
58
29
11
2.13
0.14
535
0.4
31.9
3.1
63
B12-3
62
27
9
2.12
.15
578
0.4
31.0
3.4
66