Final report for FNE23-034
Project Information
Low Power Wide Area Networks (LPWANs), and LoRaWAN in particular, offer promising opportunities for cost-effective digital agriculture, yet real-world deployments in commercial orchard systems remain under-documented. This research presents lessons learned from the design, deployment, and operation of a privately managed LoRaWAN network server supporting multiple on-farm applications in a commercial apple orchard in the northeastern United States. The system was developed to integrate soil moisture sensing, irrigation automation, weather monitoring, asset tracking, fuel tank monitoring, and unified dashboard visualization leveraging open-source tools.
A private LoRaWAN architecture was selected to maintain control over data ownership, payload parsing, system integration, and long-term operational flexibility. Key lessons emerged around gateway placement and resiliency, including serviceability, the impacts of vegetative barriers on signal quality, and the added benefits of multi-gateway redundancy. Sensor selection and deployment highlighted tradeoffs between low-cost devices and data reliability, support availability, and lifecycle durability, particularly for soil moisture sensing and irrigation automation. Challenges related to supply chains, firmware management, data workflows, and in-field sensor placement proved to be significant factors influencing system stability and scalability.
Operational experience demonstrated that while private LoRaWAN infrastructure enables deep customization and tighter integration with farm workflows, it also introduces additional technical complexity, cybersecurity considerations, and maintenance overhead compared to fully managed solutions. Ultimately, this work emphasizes that successful adoption depends not only on technology choice, but also on local support ecosystems, iterative testing, and realistic expectations of system maturity. These findings provide support for growers, researchers, and ag-technology developers considering private LoRaWAN deployments in commercial farming applications. The greatest overall success was with facility monitoring sensor systems which will continue to be used on the farm and expanded to further facilities and storages.
Extensive outreach was conducted throughout the course of this project. Audiences reached include university researchers (international and domestic), NY and Midwestern extension agents, producers of NY commodities, agribusinesses in NY, the Midwest, and throughout the U.S., advocacy organizations, college students & FFA chapters, middle and high school students, media groups, local business professionals and government officials, and local farmers in Wayne County.
At the time of submission, my master’s thesis, half of which was based on this work, has also been viewed 1,218 times, downloaded 1,136 times, and cited in a journal article by Nkwocha et al. (2025) titled A Comprehensive Review of Sensing, Control, and Networking in Agricultural Robots: From Perception to Coordination.
References
Nkwocha, C. L., Adewumi, A., Folorunsho, S. O., Eze, C., Jjagwe, P., Kemeshi, J., & Wang, N. (2025). A comprehensive review of sensing, control, and networking in agricultural robots: From perception to coordination. Robotics, 14, 159. https://hdl.handle.net/10919/139778
This project seeks to address the need for cost-effective digital agriculture solutions that make it easier for farmers to manage their daily operations/inputs efficiently.
1. LoRaWAN Gateway Deployment – assess optimal implementation of an on-farm LoRaWAN network to interface with all sensor nodes in a commercial orchard in the Northeast
2. Irrigation Management – determine optimal way to sense drip irrigation needs/success and deploy LoRaWAN sensors in irrigation zones/orchard blocks based on soil maps, elevation, and apple variety
3. Irrigation Automation – implement LoRaWAN valves for irrigation zones and determine best setup of valve transmitter/cable and irrigation box
4. Weather Data Collection – establish a LoRaWAN weather station and collaborate with 2-3 other farms in the area with already-established weather stations to compare weather patterns near and away from Lake Ontario
5. Asset Tracking – assess LoRaWAN asset tracking capabilities and attach nodes to specific pieces of equipment to track live location/historical paths taken
6. Fuel Tank Monitoring – apply LoRaWAN tank monitors to 2 diesel tanks to view levels at any time for refill planning
7. Dashboard Integration – integrating all data to one open-source dashboard for live and aggregated data visualization, and potentially providing updated imagery with drones
The following are numbered in accordance to the Methods section of this application to explain their importance.
1. LoRaWAN Gateway Deployment
The basis for our IoT infrastructure will be a LoRaWAN network (specification: Low Power, Wide Area; LPWA), which overcomes another historical barrier to IoT adoption in commercial agriculture: the difficulty of covering vast amounts of land and connecting the number of devices necessary to acquire big picture data. Many commercial IoT solutions rely on full-farm Wi-Fi, cellular, or Bluetooth coverage, which establishing in and of themselves can increase costs. Plus, some devices need to be constantly maintained since battery life of in-field devices can be an issue. LoRaWAN on the other hand offers an extremely affordable option for wide area coverage that allows end devices to save battery power (5–10-year battery lives) and can scale to support thousands of sensors.
2. Irrigation Management
Since our main farm (where the experiment is) is 100% drip irrigated and relies entirely on municipal water, water as an input cost can be quite high in dry years. Therefore, being able to manage the amount of water applied to each of our 30+ irrigation zones is critical but is very difficult to do just on qualitative observations of individual rows. Therefore, we plan on deploying soil moisture sensor systems to give indications of the level of water trees are exposed to from rain and irrigation and also serve to monitor if the irrigation zones are functioning properly. Our initial determination was a deployment of 1-2 sensors per irrigation zone could provide the necessary data at a reasonable cost/sensor.
3. Irrigation Automation
Our 30+ irrigation zones are set up to have submain control boxes where water valves are turned on/off by hand, which takes a lot of time in going around to each box. Therefore, we plan to automate the on/off process so that it can be done remotely from anywhere, using our soil moisture sensors to aid in making the decision on when to do so.
4. Weather Data Collection
Our farm extends about 1.5-2 miles right up to Lake Ontario, which provides an overall optimal climate for apple production. However, there are some notable differences in temperature and humidity that would be helpful to quantify in making spray and irrigation decisions for our orchard blocks near the lake vs. further away. Therefore, we plan on working with 2-3 other farms in the area with already established weather stations in the NEWA system to better understand local weather patterns and draw correlations for reference in decision making.
5. Asset Tracking
Farms, especially highly managed specialty crop farms, constantly deal with moving equipment and people on a daily basis that can be hard to keep track of and manage. To help with this, we will experiment with LoRaWAN GPS trackers to track equipment live to view progress with various tasks and also over time so that a farmer can see at the end of the day/month/year(s) where each piece of equipment has been.
6. Fuel Tank Monitoring
Our farm has two diesel tanks for our equipment, and knowing when they need to be refilled requires taking the time to manually check gauges at the tank and requesting more. By using LoRaWAN tank monitors, this process will be simplified to be able to monitor levels from anywhere.
7. Dashboard Integration
Software development can be a source of high costs for commercial IoT solutions and a reason for high prices to farmers. By utilizing open source tools, we hope to deliver a comprehensive method for farmers to visualize the data they collect in a simplified way anywhere with internet or cellular connection at an affordable cost. Depending on additional resources from this grant, we can also look into the viability of using drone imagery or purchasable satellite imagery to create up-to-date mapping for asset tracking. Free satellite imagery (i.e., Google Earth) is typically out of date, so changes made on the farm aren’t visible and it’s difficult to get an accurate depiction of where everything is if entire planting systems have been altered.
KC Bailey Orchards, Inc. is a first-generation apple farm founded in 1984 and transitioning to the second generation in the town of Williamson, Wayne County, NY. The farm grows over 200,000 bushels of apples and has additional on‑farm cold storage capacity as well as off‑farm CA storage.
Cooperators
- - Technical Advisor
- - Technical Advisor
Research
1. LoRaWAN Gateway Deployment
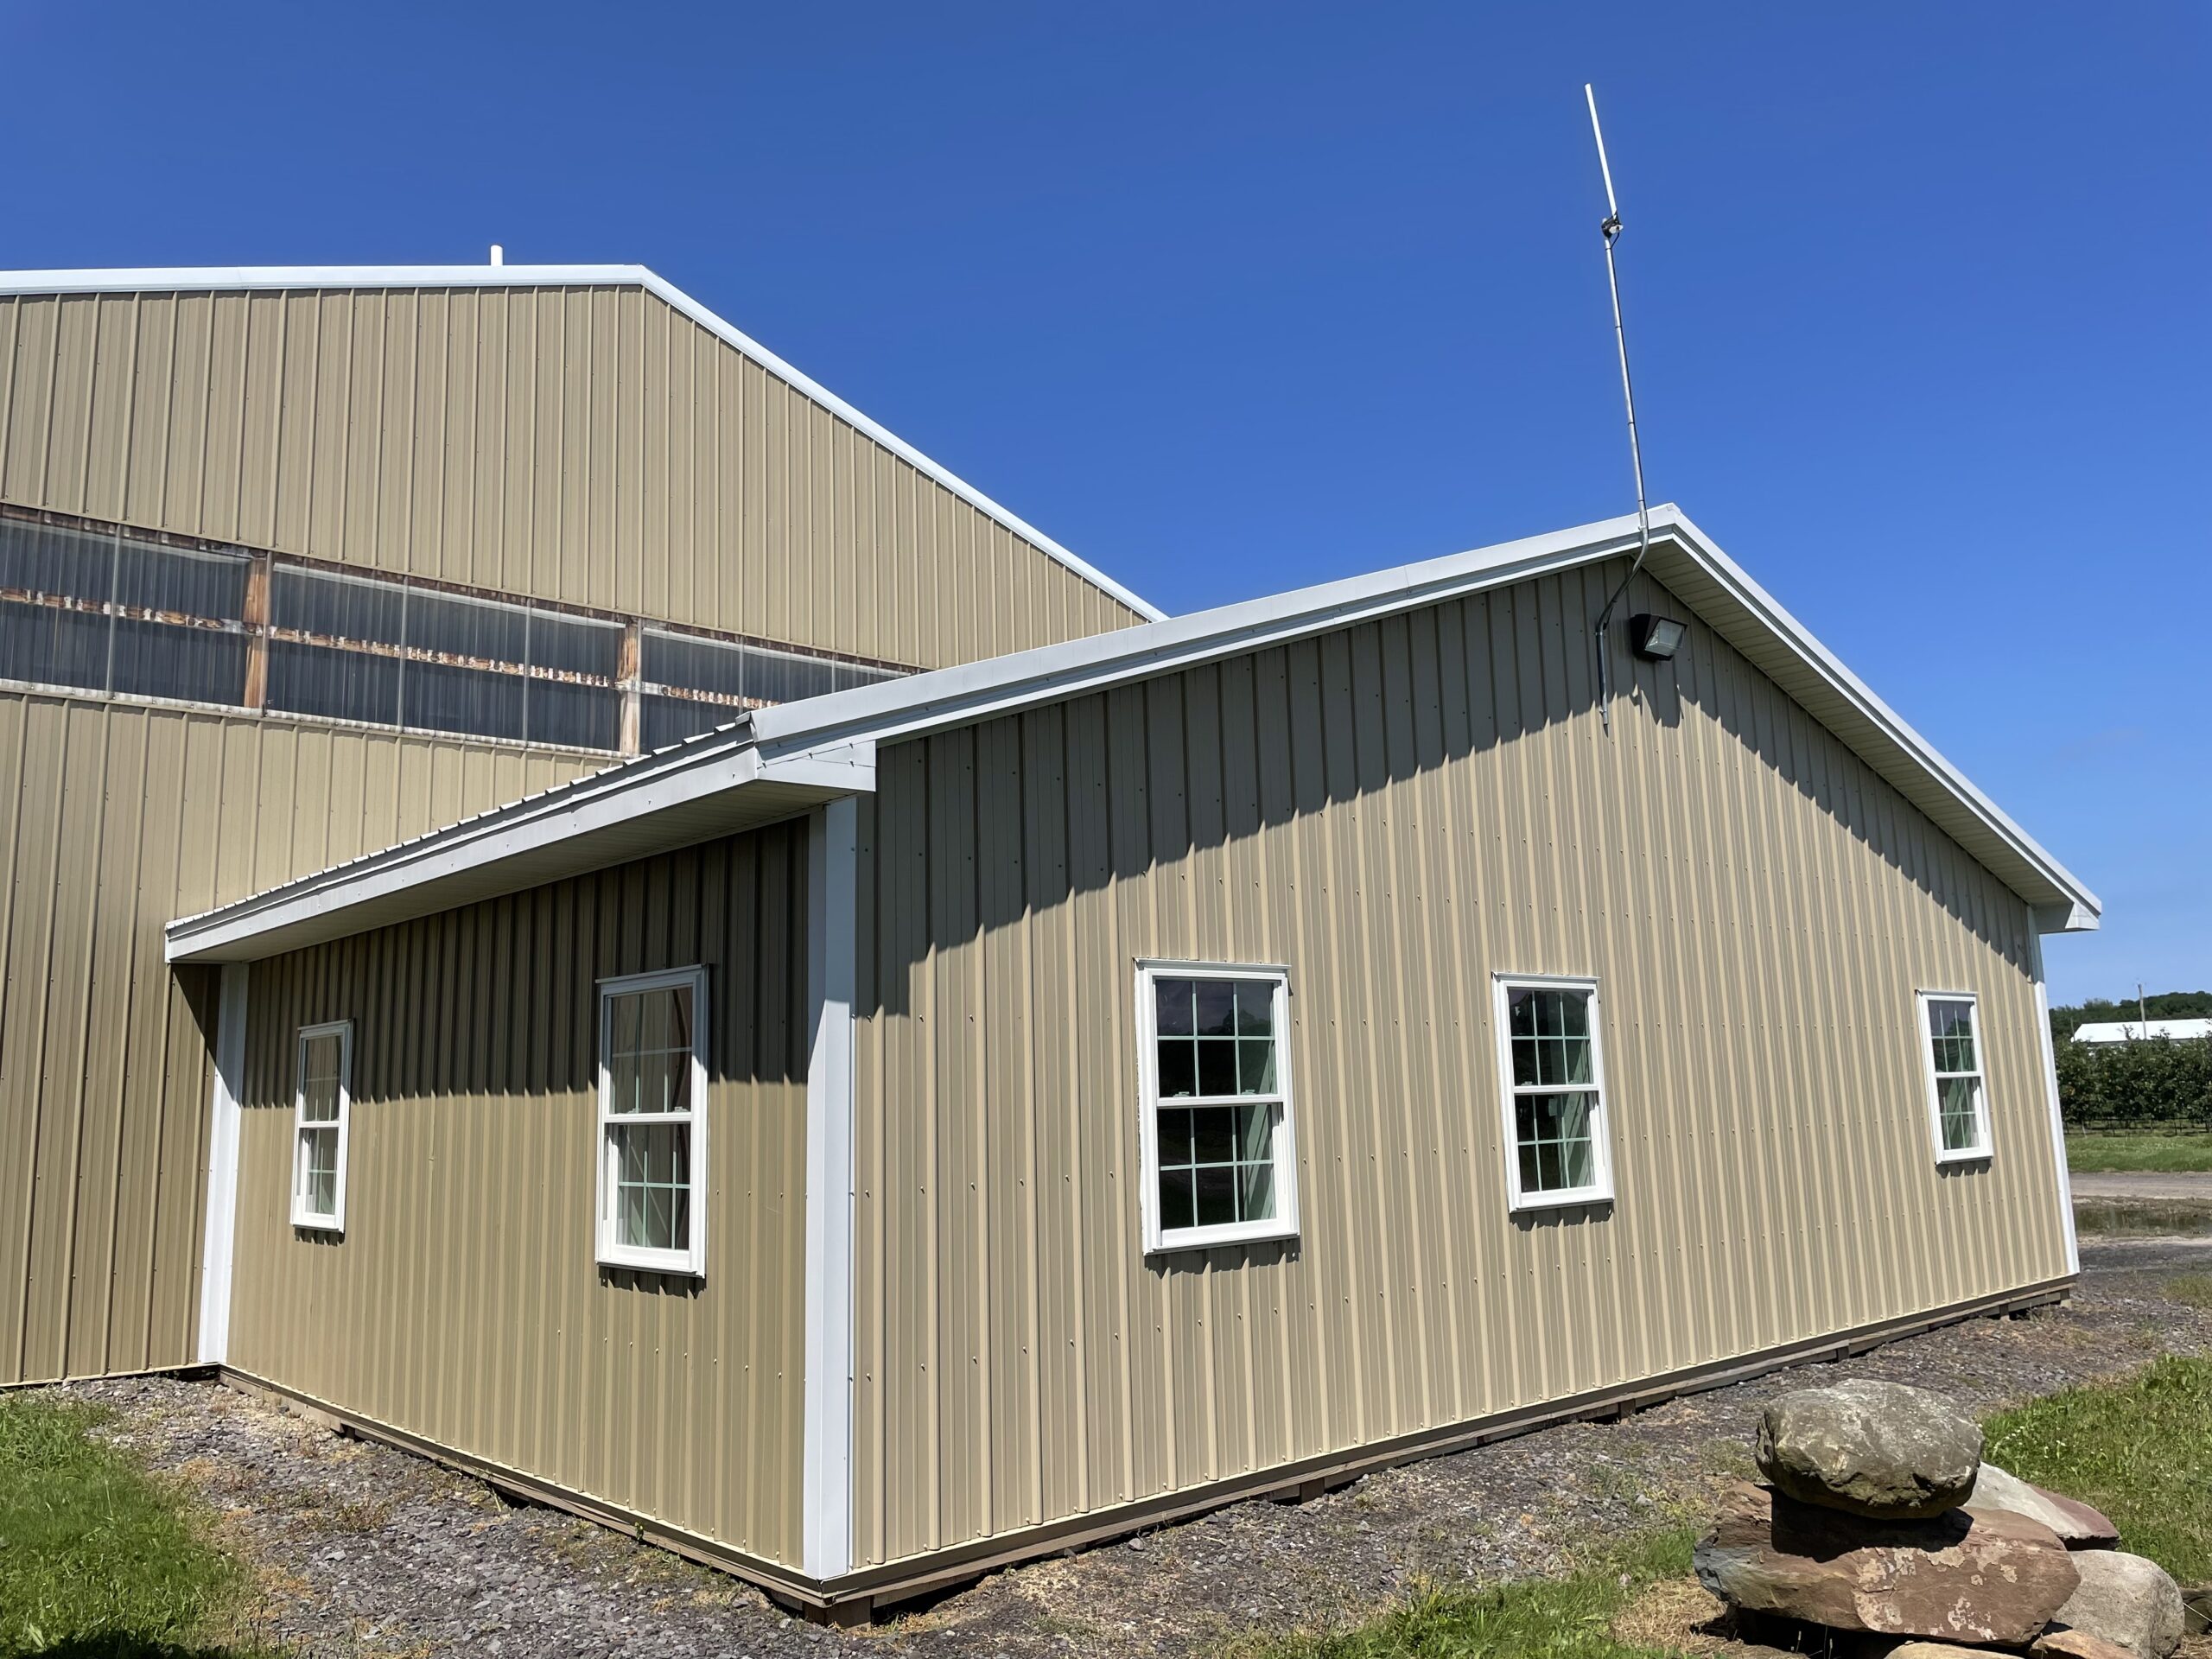
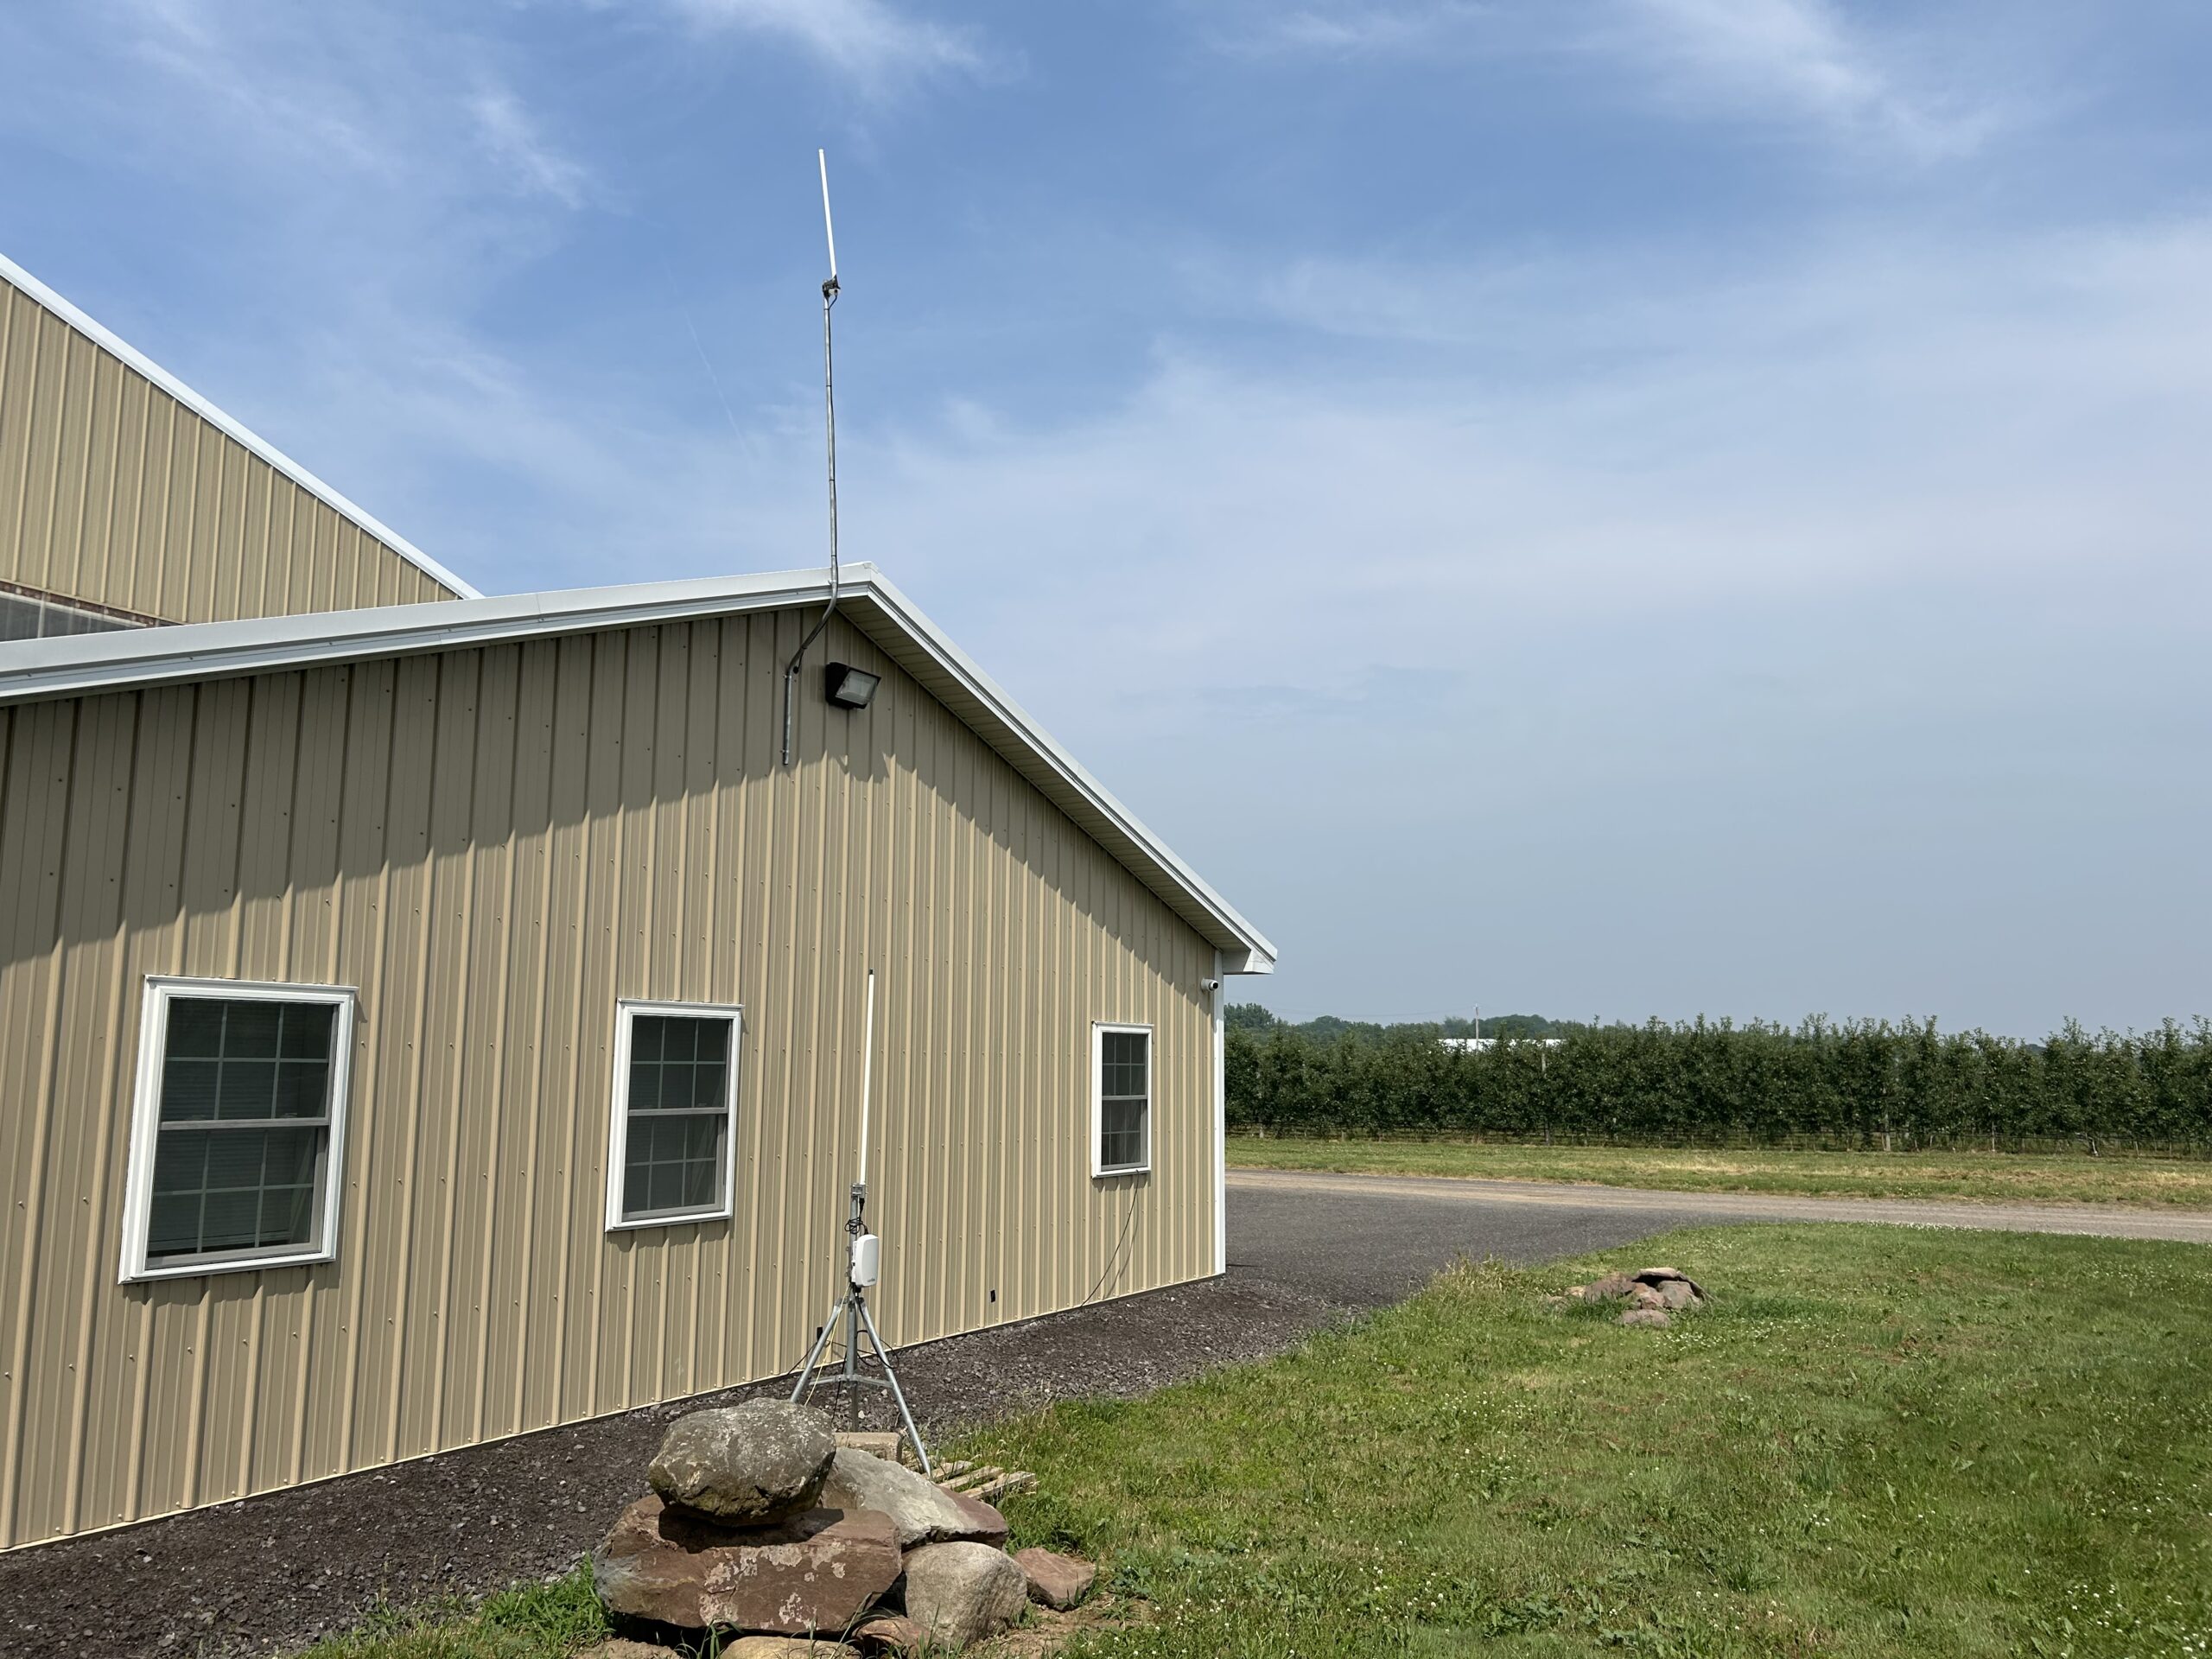
To determine the optimal implementation of a LoRaWAN gateway (or multiple) in a commercial orchard setting, our initial assumption was to continue with our approach from the summer of 2022 where we set up a WisGate Edge Pro gateway on a tripod next to our shop, and simply move the entire unit on top of our roof to ensure greater farm-wide coverage. However, we had issues scheduling anyone who would be able to (safely) get on the 30' high roof to fasten the tripod down and we quickly realized if there was ever a need to provide maintenance to the gateway, it would be virtually impossible. We then began to reevaluate the overall agrosecurity of the system, and started by addressing questions such as "If something were to happen to a gateway, how easy would it be to replace that gateway, continue sensor data collection, and get everything back up and running?" Our new shop office was recently completed in the summer of 2024 and in the process, we installed a WisGate Edge Pro (V2) to the inside of the attic and routed a 12’ cable to an 8 dBi antenna mounted on the roof, with the base of the antenna 6’ (2 times the length of the antenna) above the top of the metal roof. The gateway inside has an Ethernet cable routed through the celling to an office room to a PoE injector to provide power, and another Ethernet cable runs from the injector to a Wi-Fi router.
We began range testing by connecting four soil moisture sensors to ChirpStack and moved them incrementally further from the gateway location, collecting data on the SNR (Signal Noise Ratio), RSSI (Received Signal Strength Indication), and time intervals of sensor communication. The gateway was able to cover the entire farm, however there was significant signal loss beyond a locust grove that divides a section of our farm. The sensor (2) just in front of the locust grove recorded an average RSSI of -110.915 dBm and average SNR of -2.795 dB for the month of July while the sensor (3) just beyond the locust grove recorded an average RSSI of -113.07 dBm and average SNR of -12.649 dB, showing a notable degradation.

This suggests that deploying an additional cellular-connected LoRaWAN gateway on a tripod beyond the locust grove may be necessary to strengthen reliable coverage, and can bolster resiliency of the system through working in a cluster. In the event one gateway is knocked out, sensor signals can still be picked up by other gateways within the network, allowing for data collection to continue even in worse-case scenarios. In addition, this means the second gateway on a tripod can be taken in during winter months when data collection isn't as necessary as during the growing season. For the server to manage the data pipeline, we've switched from a Raspberry Pi-based physical computer to cloud-based computing (virtual machine) via a managed service provider. This concept came from the question "How could a farm respond to cybersecurity threats and ensure operations can continue to run smoothly especially if automated devices are in use?" Using cloud computing instead of physical computing will mean maintenance of a separate computer is not necessary and farms will not be responsible for establishing intense cybersecurity measures on their own (the Raspberry Pi could be hacked if left unmaintained). If cybersecurity issues do occur, the managed service provider will act as a deterrent and work on the farm's behalf. The open source components of the IoT data pipeline, namely ChirpStack (the web-interface to manage the gateway and all devices connected to it), will reside in the cloud computing space for an affordable cost.
2. Irrigation Management
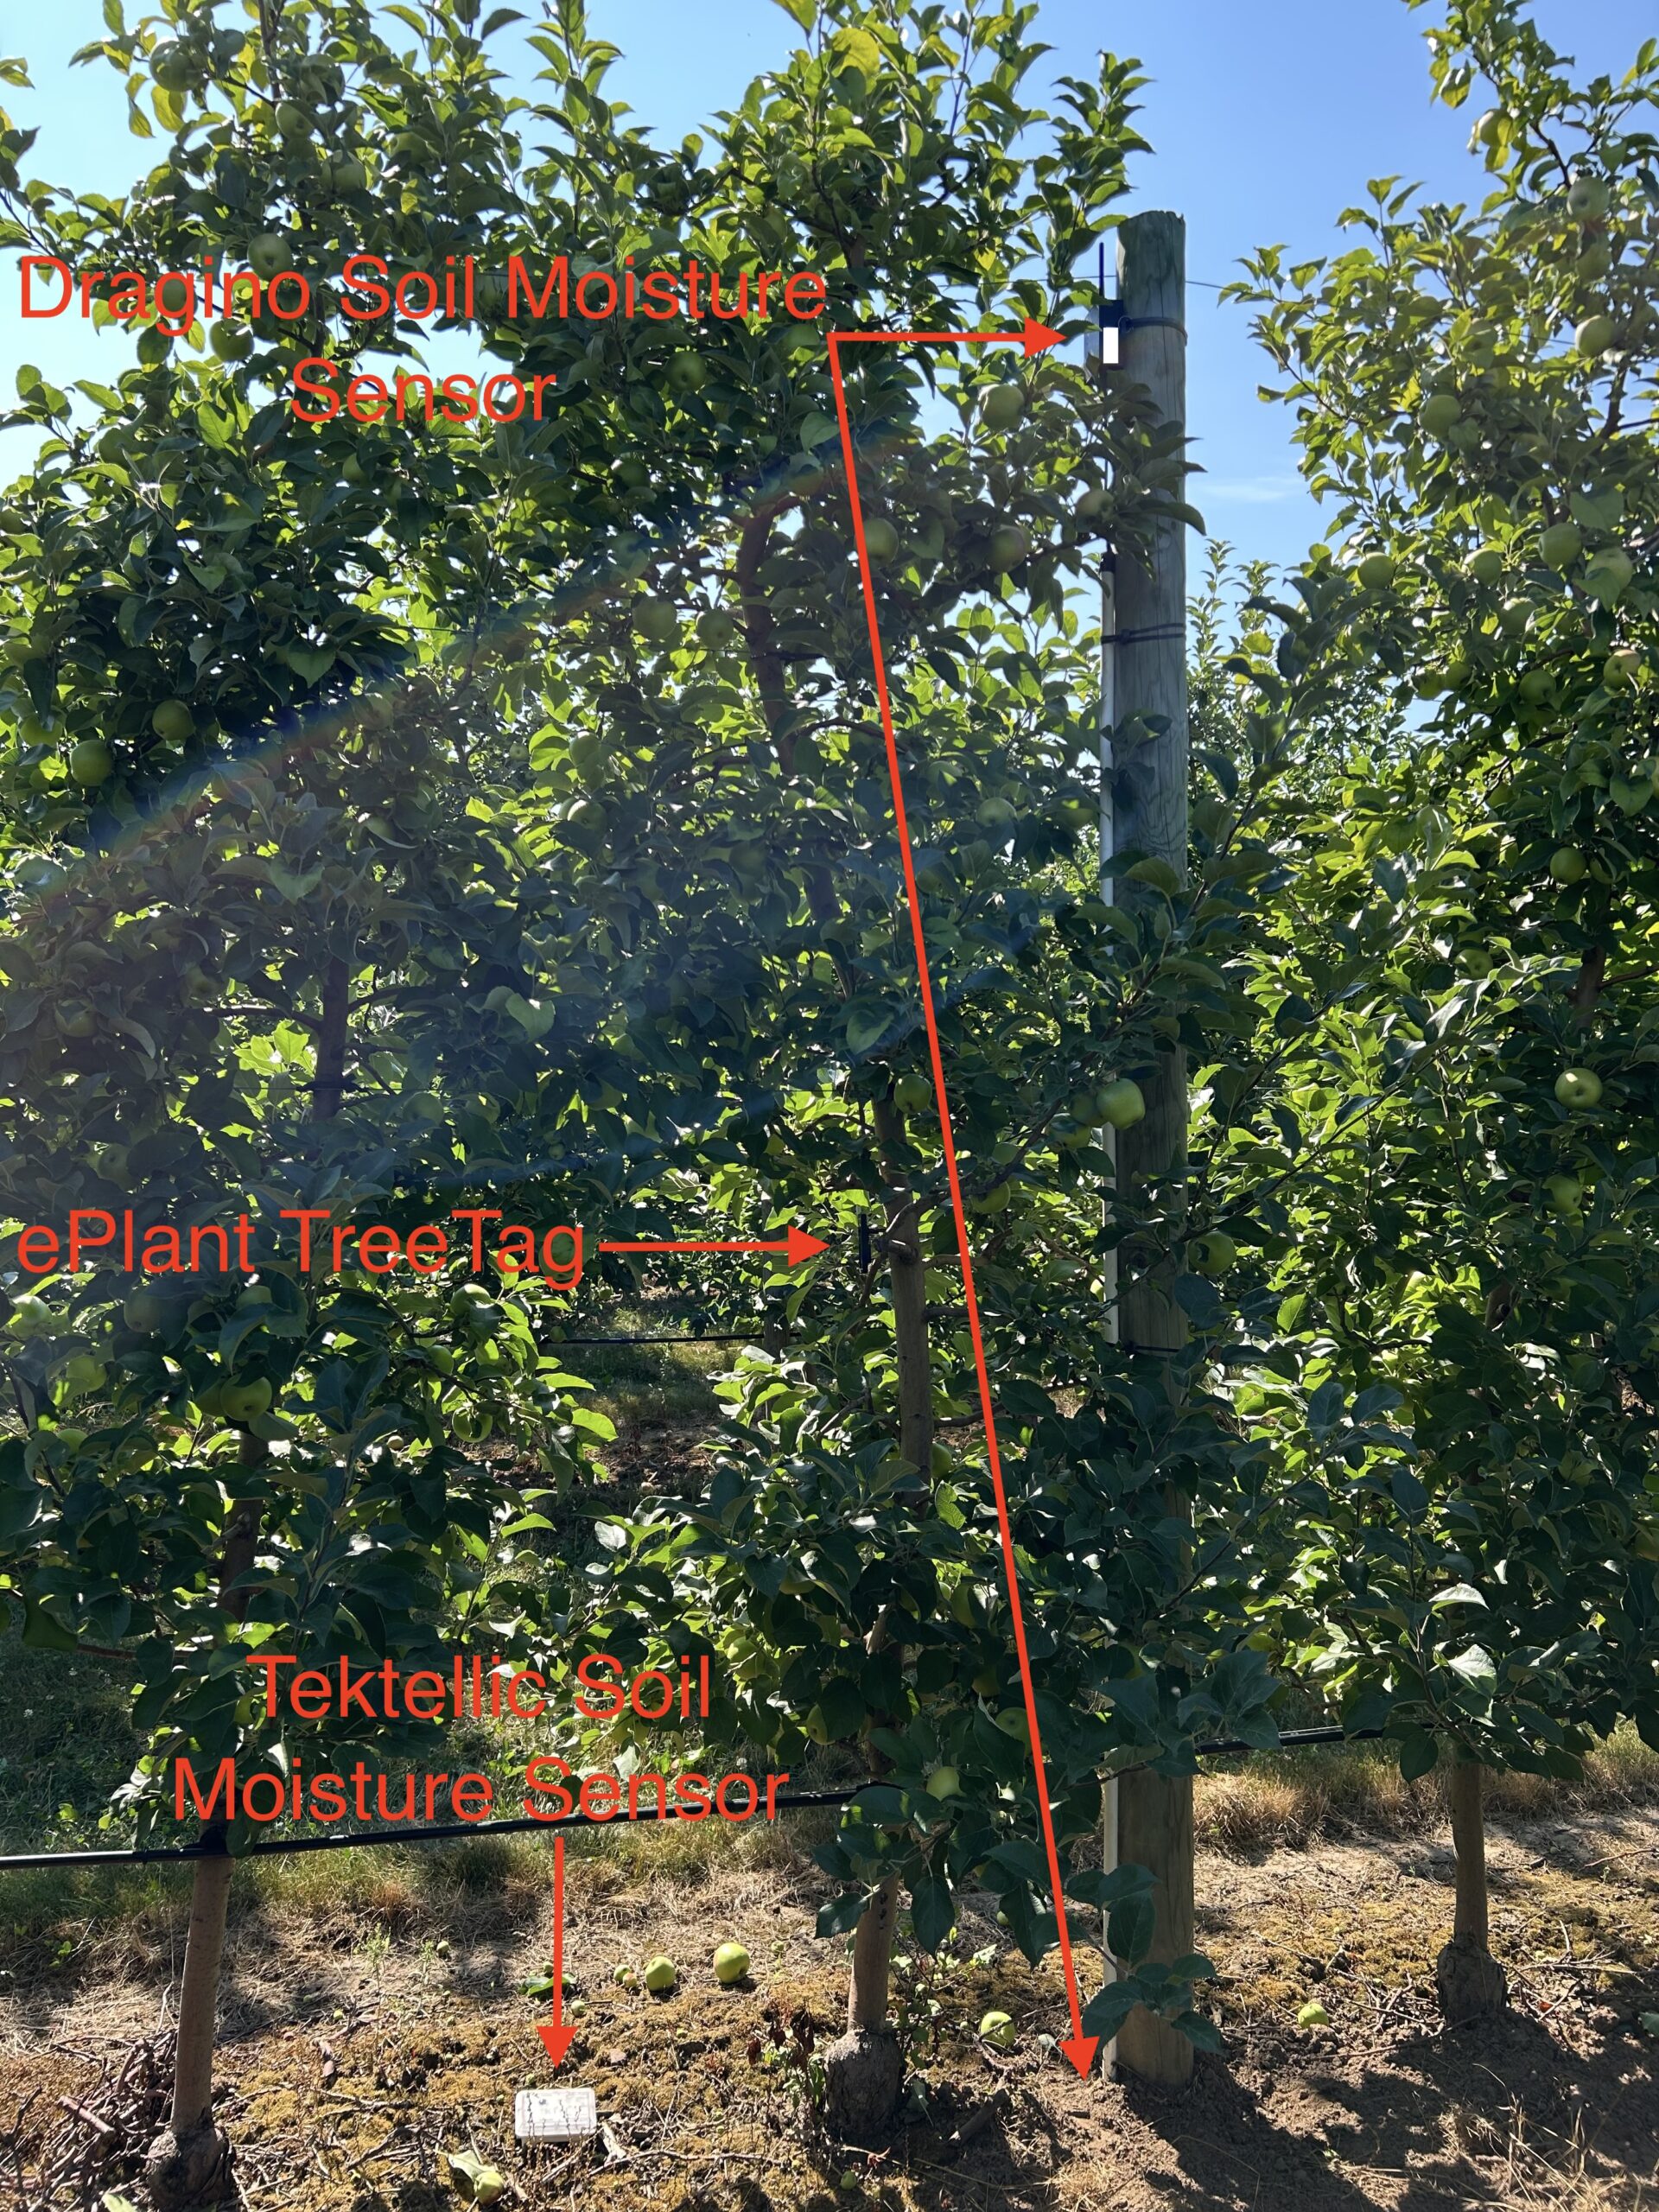
Three “Drop Count” sensor systems were constructed during the summer of 2023 and the design involved a Watermark Soil Moisture Sensor (acting as a soil potential sensor) with a 15’ cable, Watermark Soil Moisture Sensor Voltage Adapter in a plastic utility box, Vegetronix Soil Moisture Sensor with a 2-meter cable, Watermark Soil Temperature Sensor with a 15’ cable, Dragino Waterproof Long Range Wireless LoRa Sensor Node, and a wooden stake to prop the system vertically. The systems were successfully assembled but proved to be tedious to assemble and far too bulky, especially since a 2x4 was needed to hold everything upright. In the winter of 2024, we initially considered a leaner design that included a Tektellic KIWI Agriculture Sensor, 2 Watermark Soil Moisture Sensors, and 2 soil temperature sensors. One pair of soil moisture sensors and soil temperature sensors would have been placed about 6" deep and the second pair about 18"-24" deep, the latter of which was suggested by a Cornell Cooperative Extension agent. The idea was to not only monitor surface level soil moisture but also soil moisture at the depth of roots as well. However, this system still would’ve required a degree of custom work and the use of 2 schedule 13.5 PVC pipes to ensure cables aren't exposed and mice can't chew on them, which might be more difficult to deploy. We also found out the Watermark Soil Moisture Sensors have a lifespan of only 2 years, and we’d prefer a lifespan of around 5. We originally hoped to stick with Tektellic Clover Agricultural Sensors given their simplicity in deployment, collecting 6” soil moisture, 6” soil temperature, ambient humidity, and ambient temperature or light intensity with battery lifespans of 5-10 years at low cost.
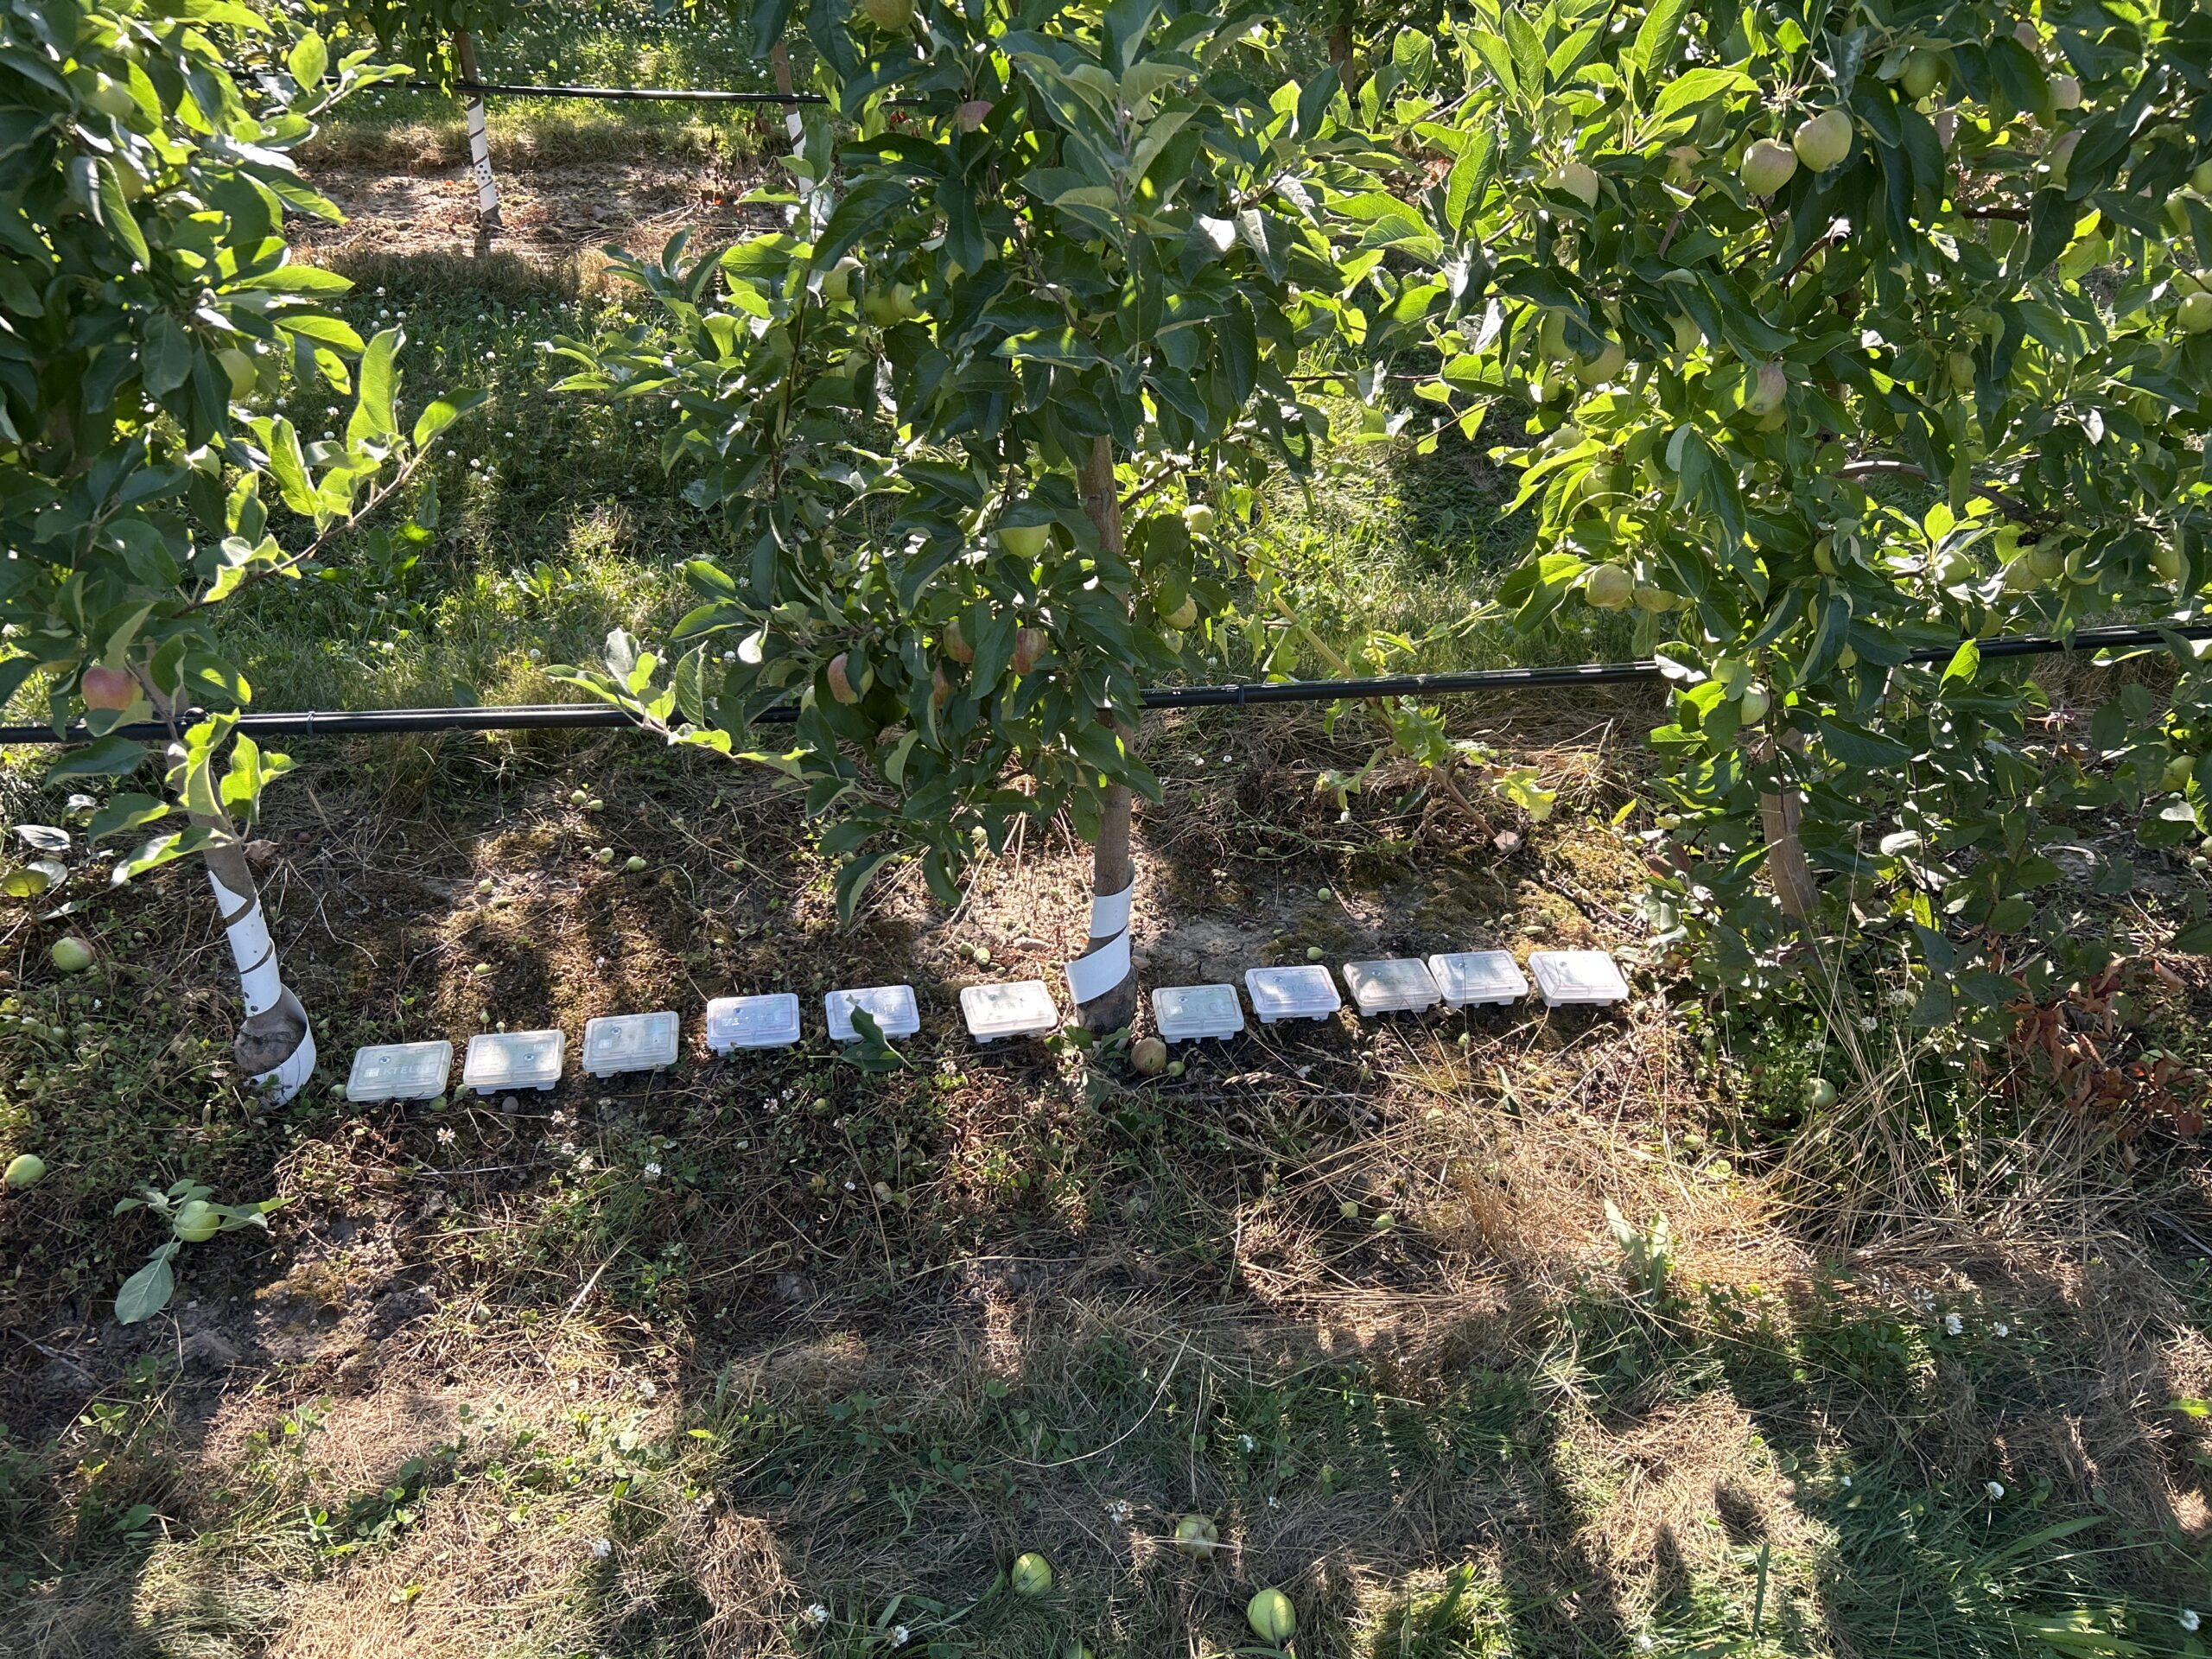
Unfortunately, the readings proved to be too unreliable for use, and we had to turn to the only other soil moisture sensor we knew of at a similar cost point: the Dragino SE01-LS LoRaWAN Soil Moisture & EC Sensor. Although these sensors are from China, the U.S. distributor based in California, Choovio, was very easy to work with and helpful over phone calls and emails. Because the Dragino sensors have separate sensor and radio components, we used some schedule 40 PVC pipes to encase the cords connecting them to protect against environmental and animal damage. The cords were longer than 3m, so we used 10’ of PVC pipe, cut it at 9’, and then used a 90-degree elbow to connect the 1’ piece and the 9’ piece together. The idea was to mount the radio component higher against a trellis post for more stability while receiving more sunlight as the LS version of the sensor comes with a solar panel embedded in the radio, while at the same time following recommendations from Cornell researchers to position the sensor units 1’ deep in the ground, 1’ away from our drip lines. To site the locations of where to place the 8 soil moisture sensors (1 per zone), we worked with researchers from the Purdue OATS Center with experience in Geographic Information Systems (GIS). Utilizing QGIS, an open source geospatial analytics software, we imported U.S. Geological Survey (USGS) Digital Elevation Models (DEM) data for our area, and segmented it based on our farm boundaries. For this project’s location, we then used a Topographic Wetness Index model and classified the output into 5 classes, keeping the middle one as an average representation of the orchard block. We then added visual boundaries of where each irrigation subzone started and stopped. Locations for placing 1 sensor per subzone were then visually determined, aiming to place them in the relative centers of the subzones in representative TWI zones based on the middle class. We synced this data into QField as a mobile platform of our QGIS project and then using a smart phone to track our location relative to the soil sensor destinations to deploy them. On site, after ensuring the areas weren’t too rocky, holes were dug 1’ deep 1’ away from the irrigation drip lines near trellis posts. There was some difficulty sticking the sensors horizontally in the soil, especially as there were dry conditions at that point in the season (late July), but was manageable. We then monitored the data collected in Grafana over the course of 2 weeks at the end of irrigation season. Data proved to be inconsistent across the zones, making us question how we placed the sensors, the methods we used to determine the sites, and if prior calibration had been required. For the 2/8 sensors that did seem to provide relevant information, we were able to see how well the soil was holding water and how long it took for the VWC (volumetric water content) to settle back down after irrigation events, leading us to decide on switching from a 2 subzone per day cycle to a 3 subzone per day cycle given the weather patterns we were experiencing.
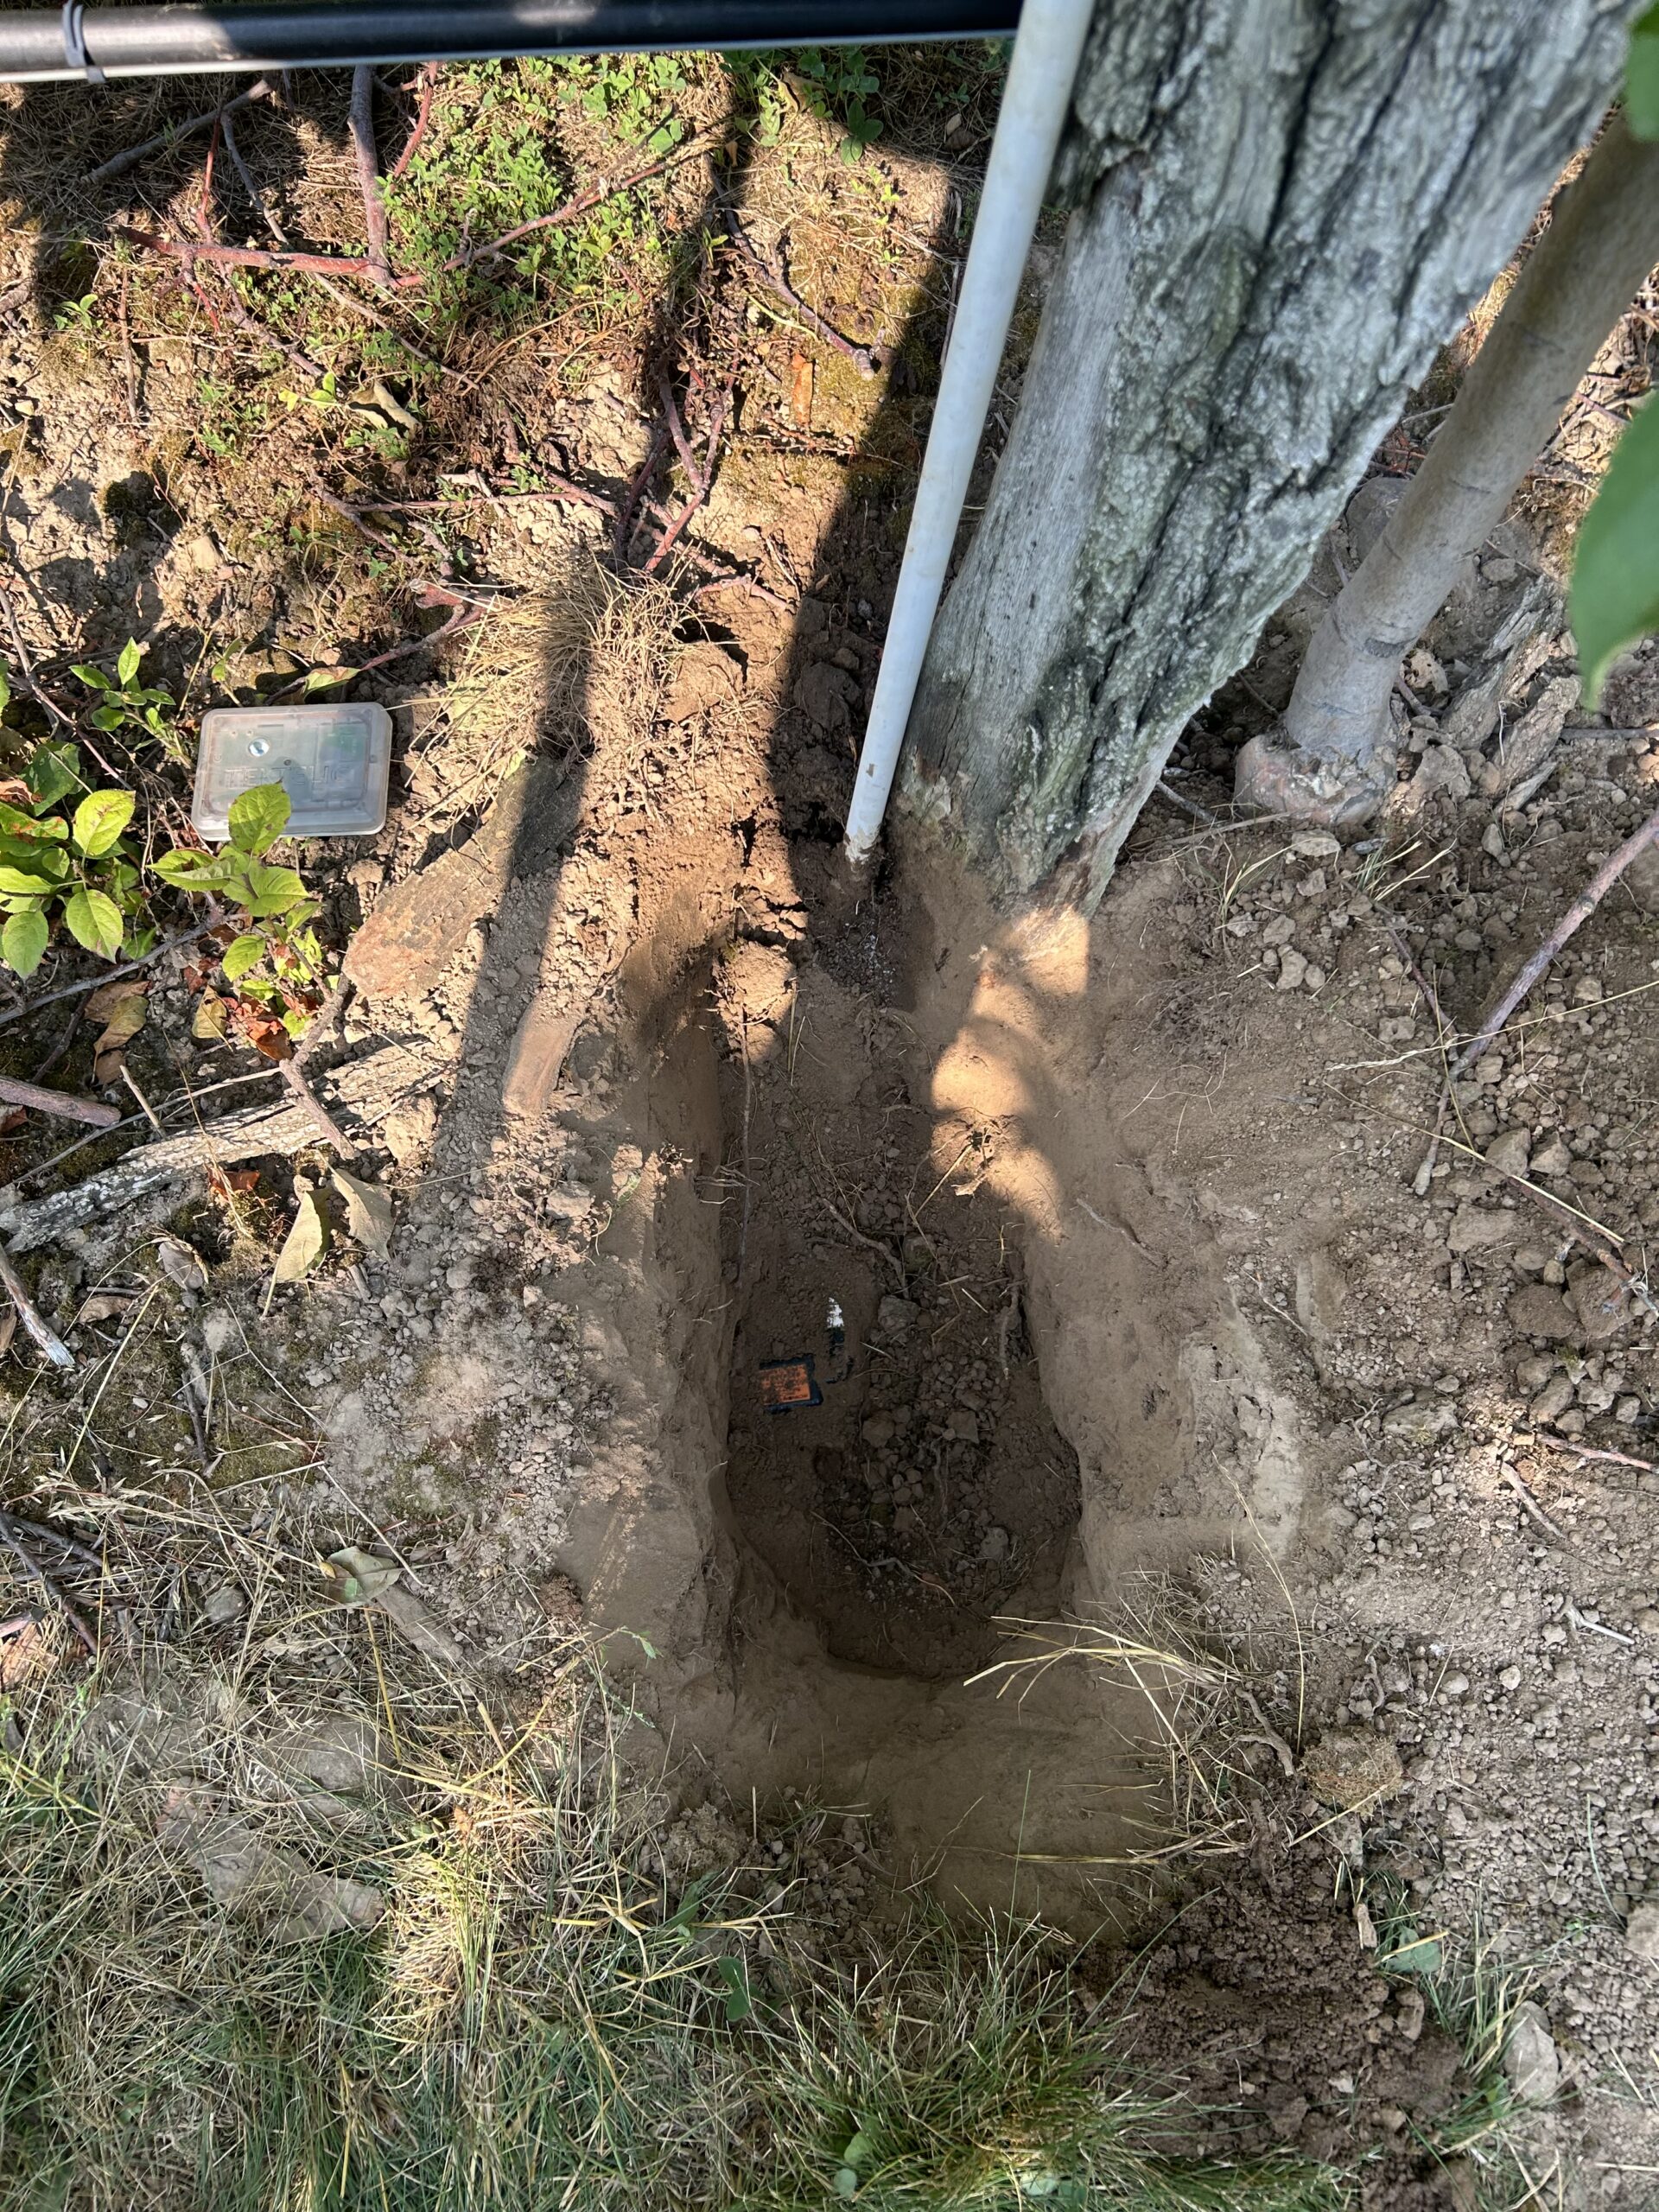
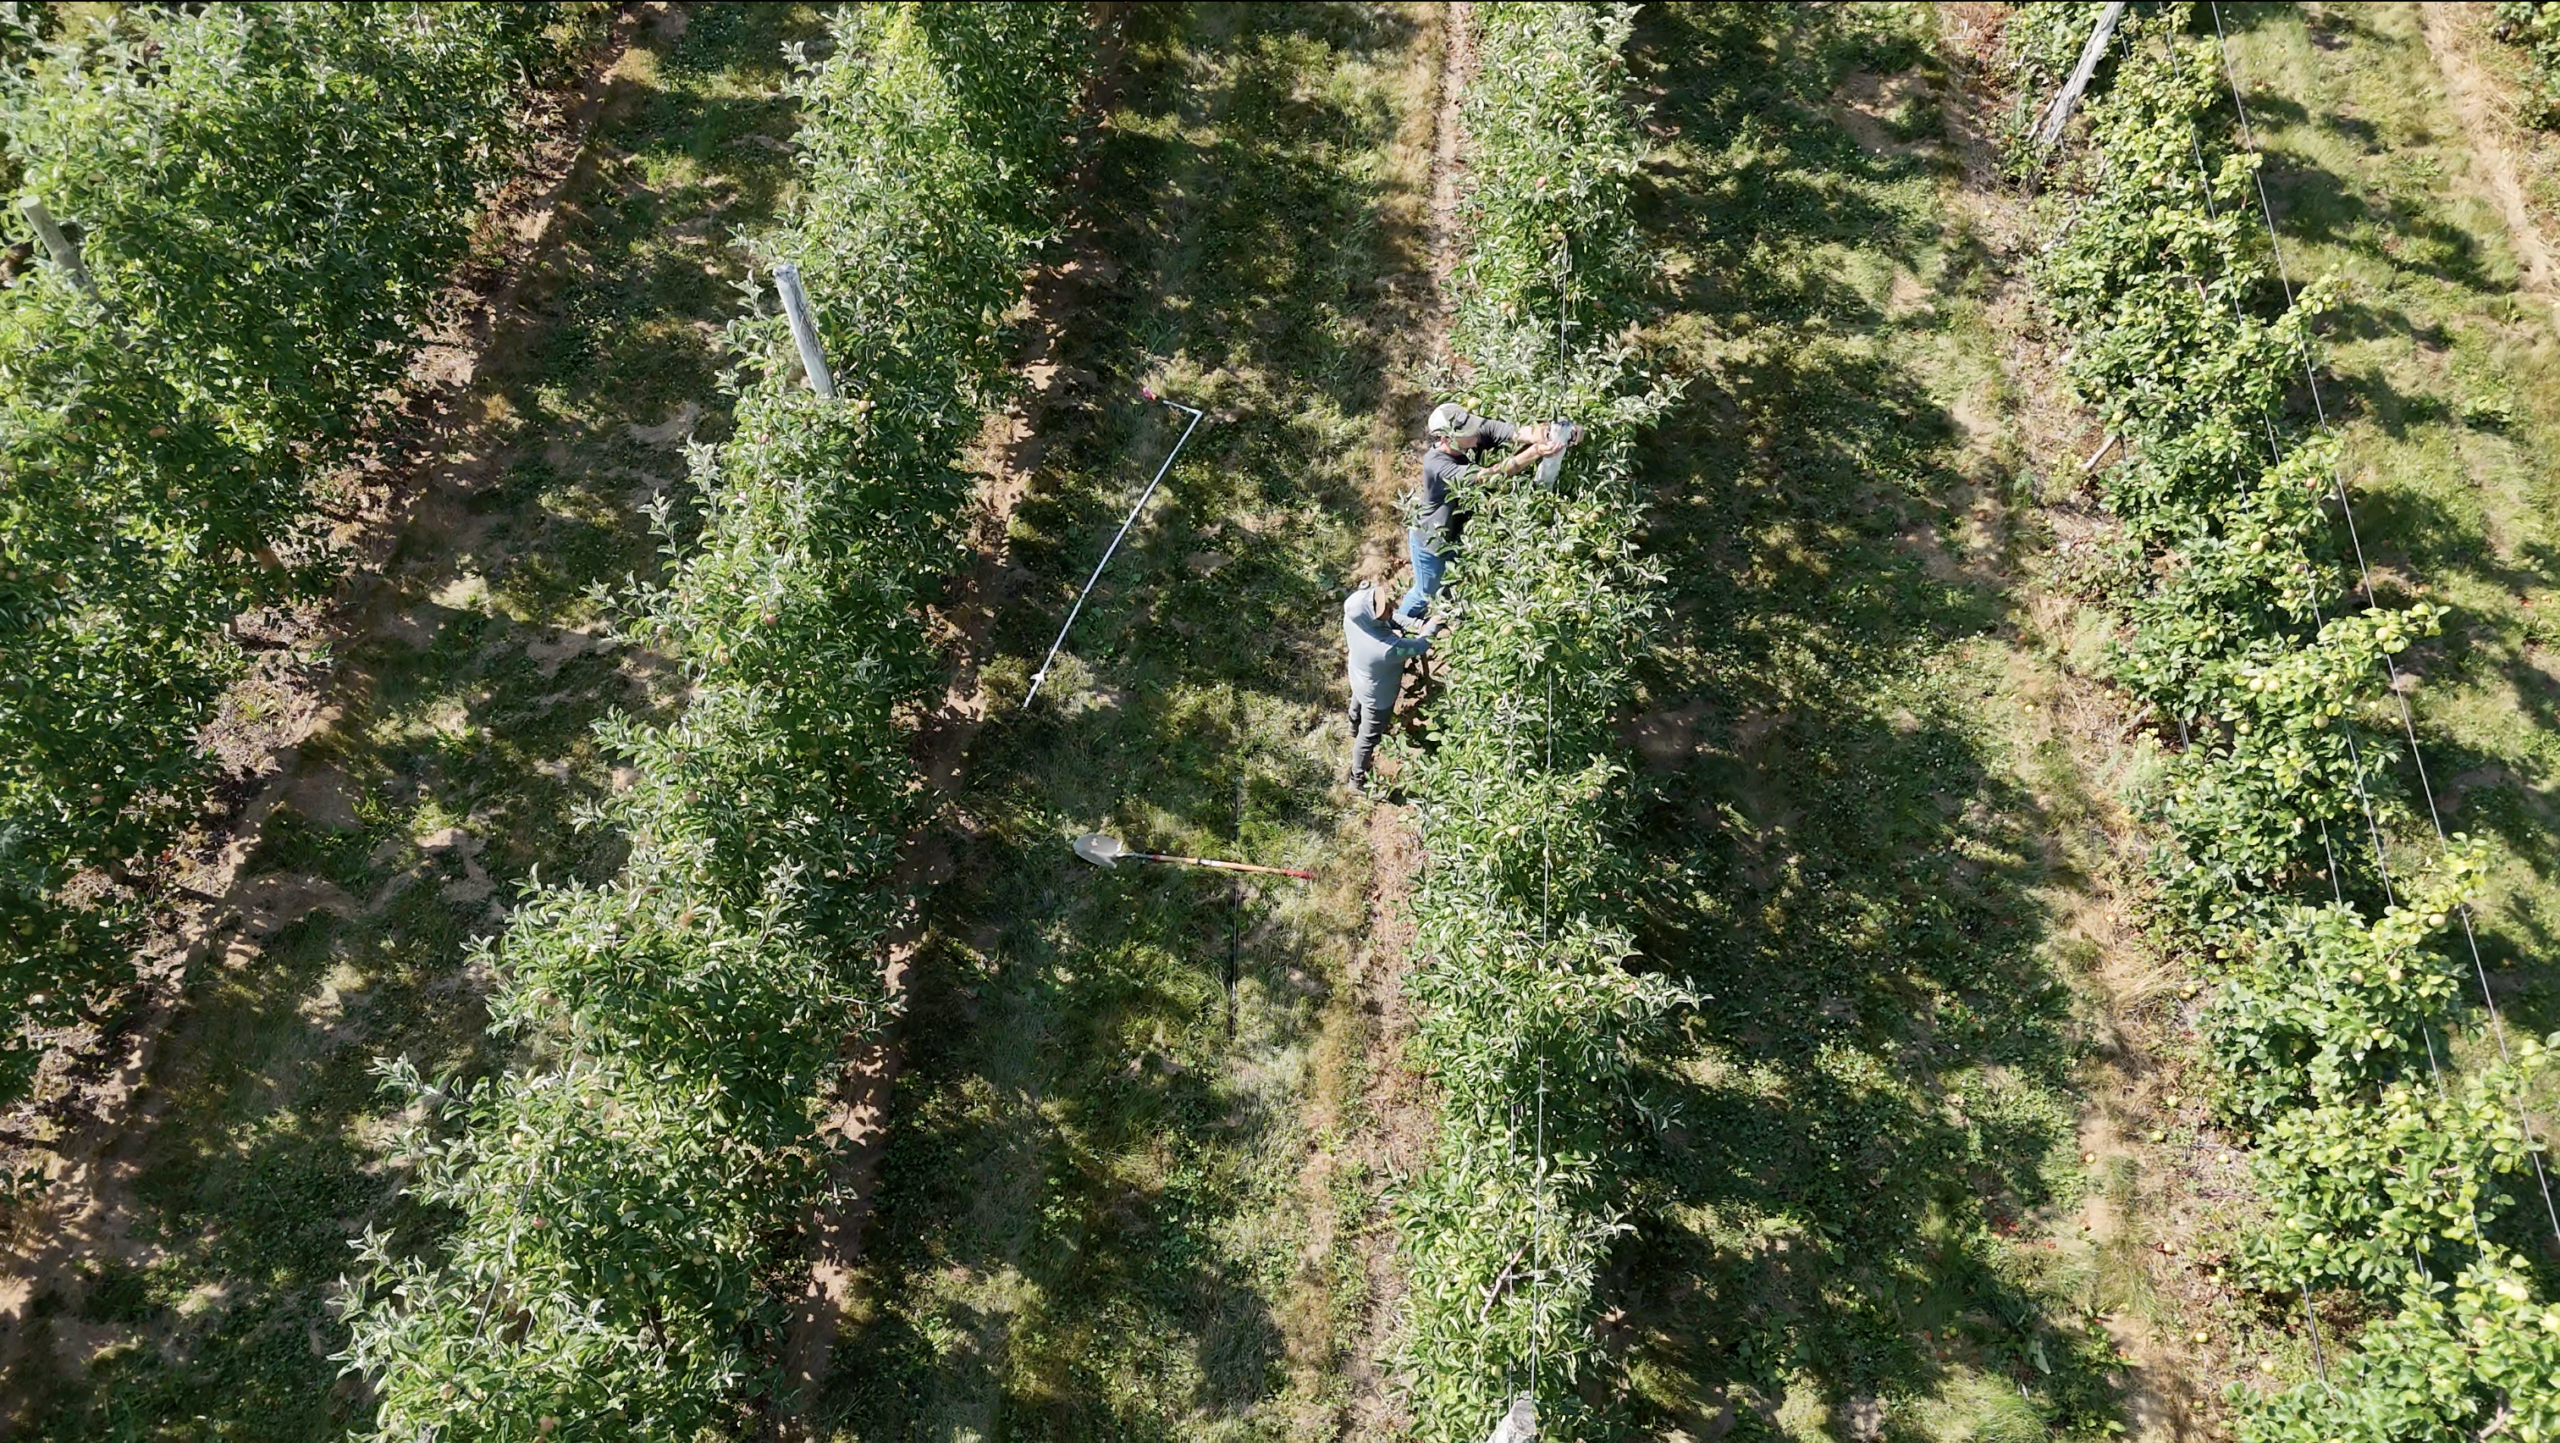
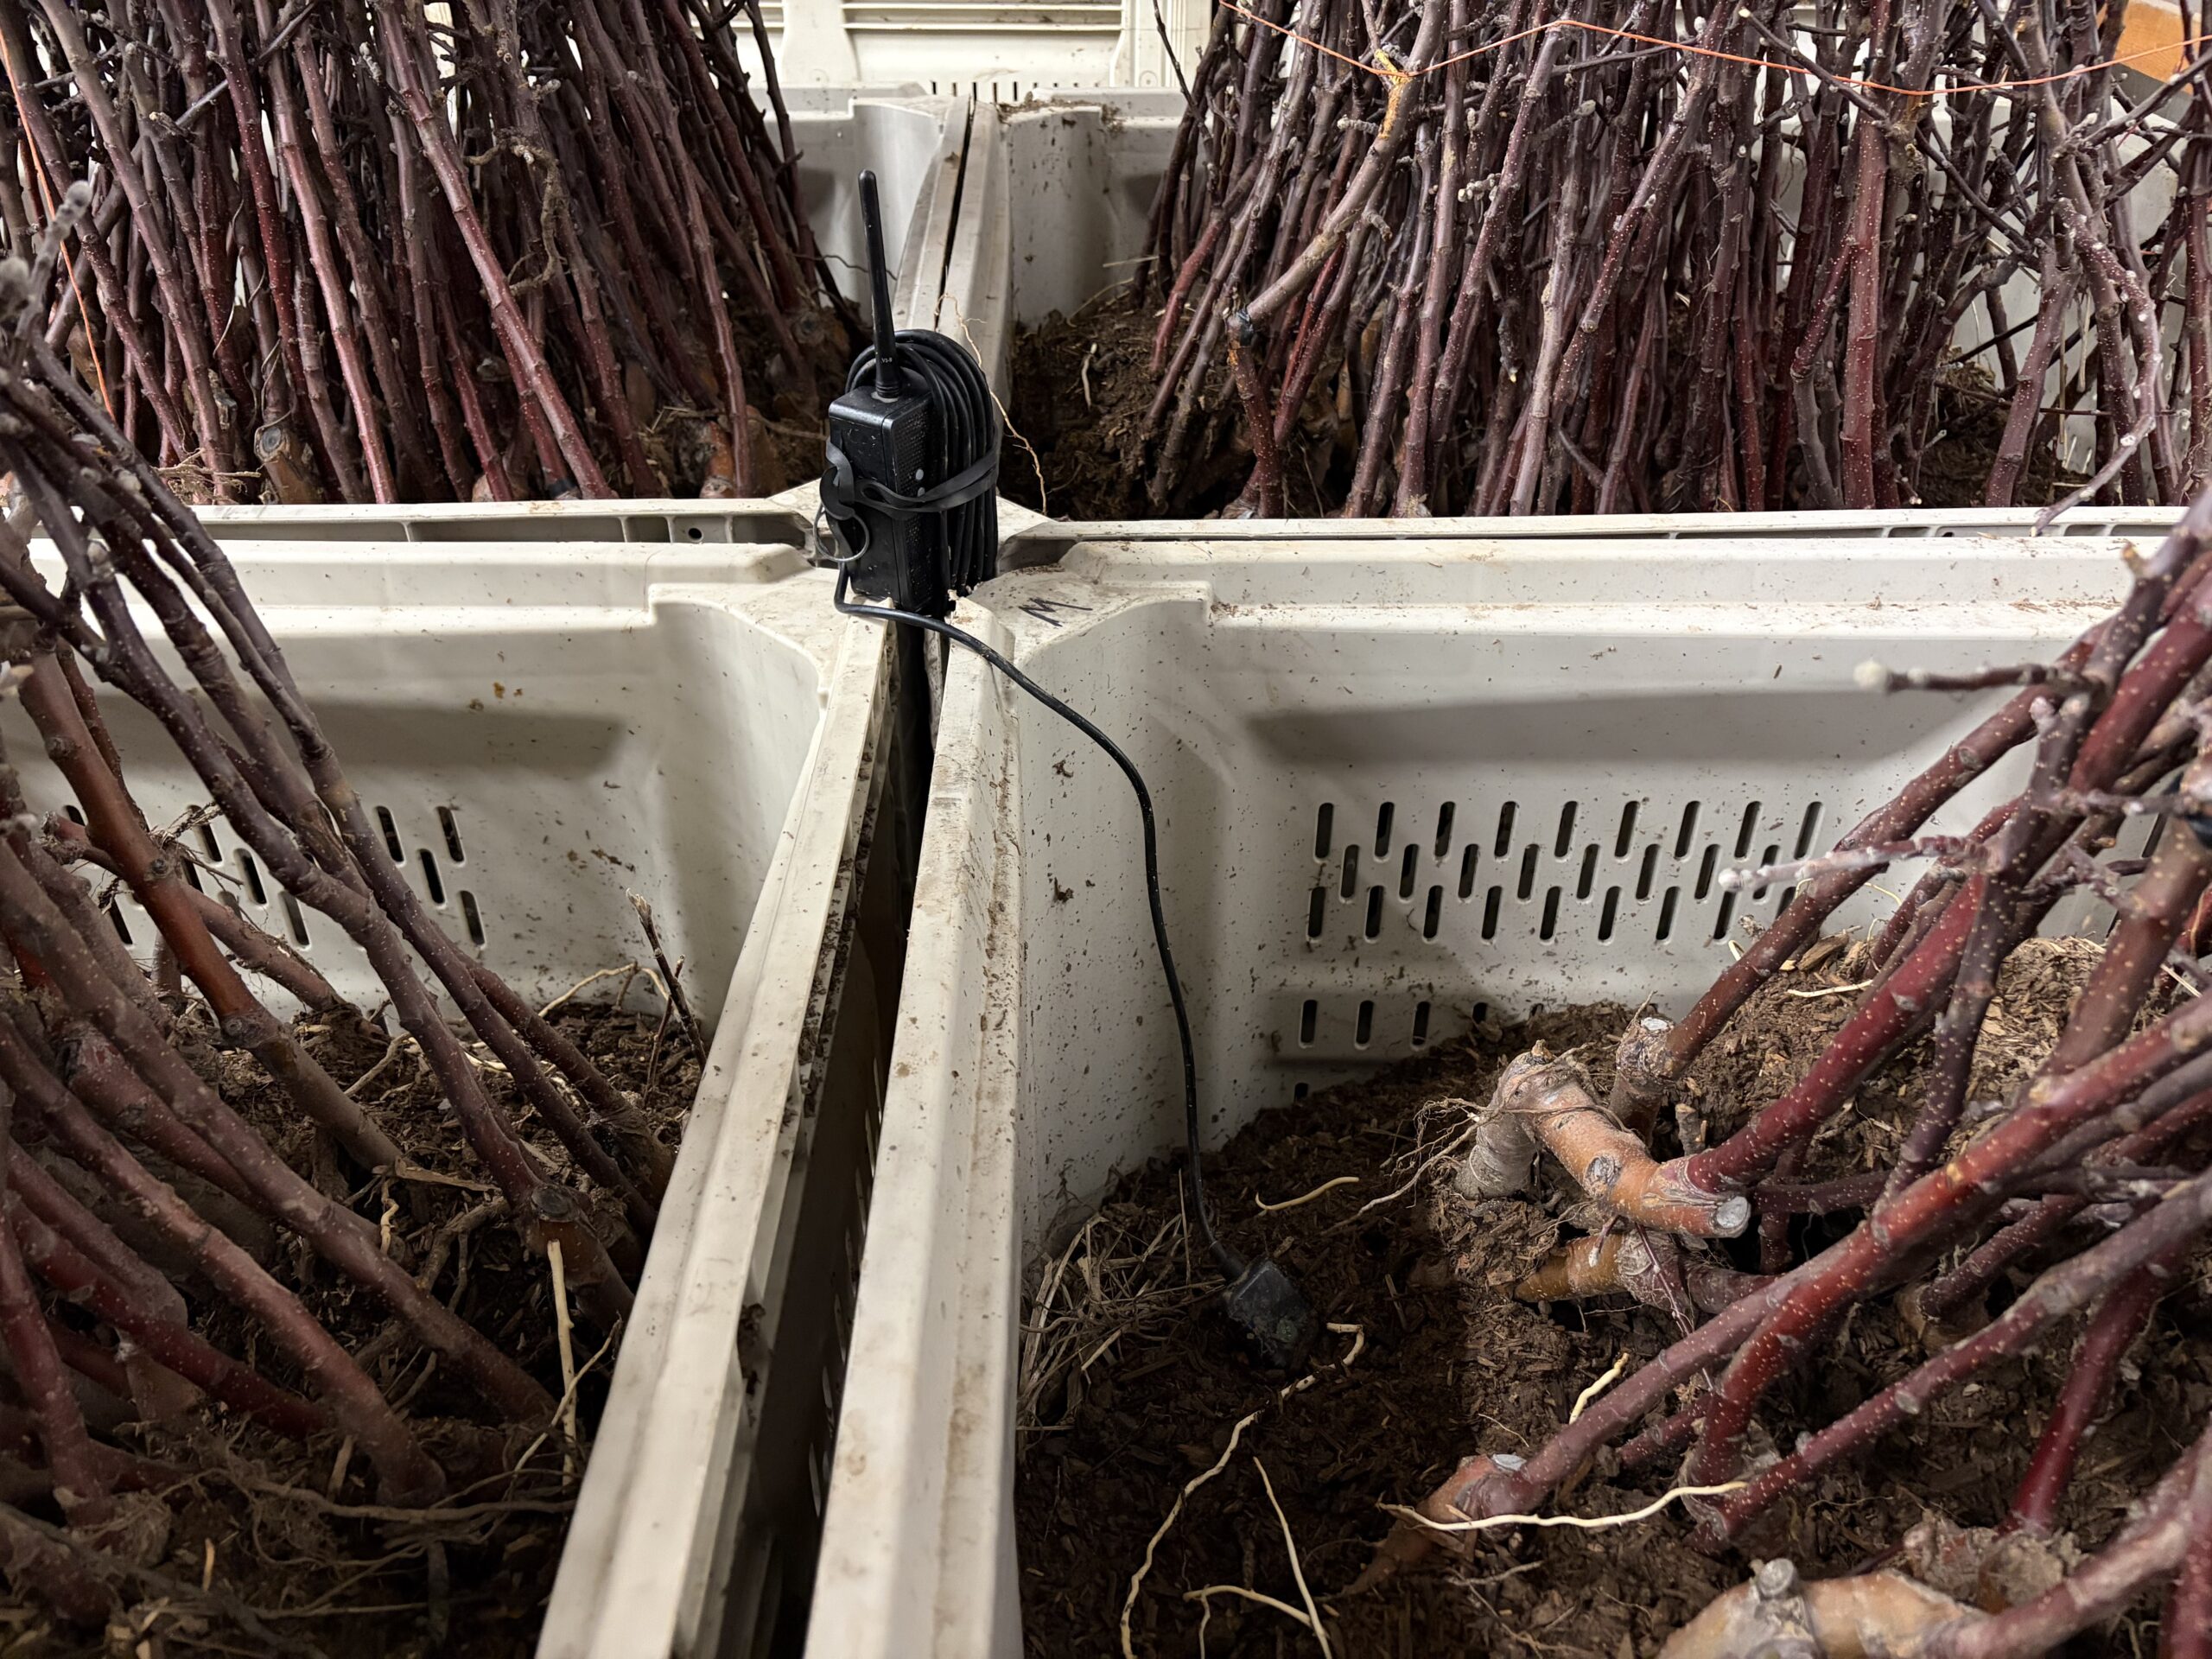
The sensors were dug up after harvest in November, and they proved much easier to remove when the ground was wetter at the time. In the spring of 2026, we found an off-season use for the sensors by placing them in bins of nursery trees that were going to be replanted. The data collected help us make sure the material the roots were stored in stayed at moist levels throughout the intermediate period.
A major focus of this grant was to use cost-effective sensors at scale for big picture data. However at this point, we think it’s better to invest a bit more in higher quality sensors that are reliable and have support in the U.S. At Purdue, we’ve also used GroPoint Profile sensors, which collect soil moisture and soil temperature data at multiple depths. We’ve connected Dragino SDI-12 to LoRaWAN nodes to their tops to report data and deployed the units with stakes. Sensors such as these might not be feasible to be deployed in every irrigation subzone, but could be used more to ground truth other irrigation scheduling models at a broader scale.
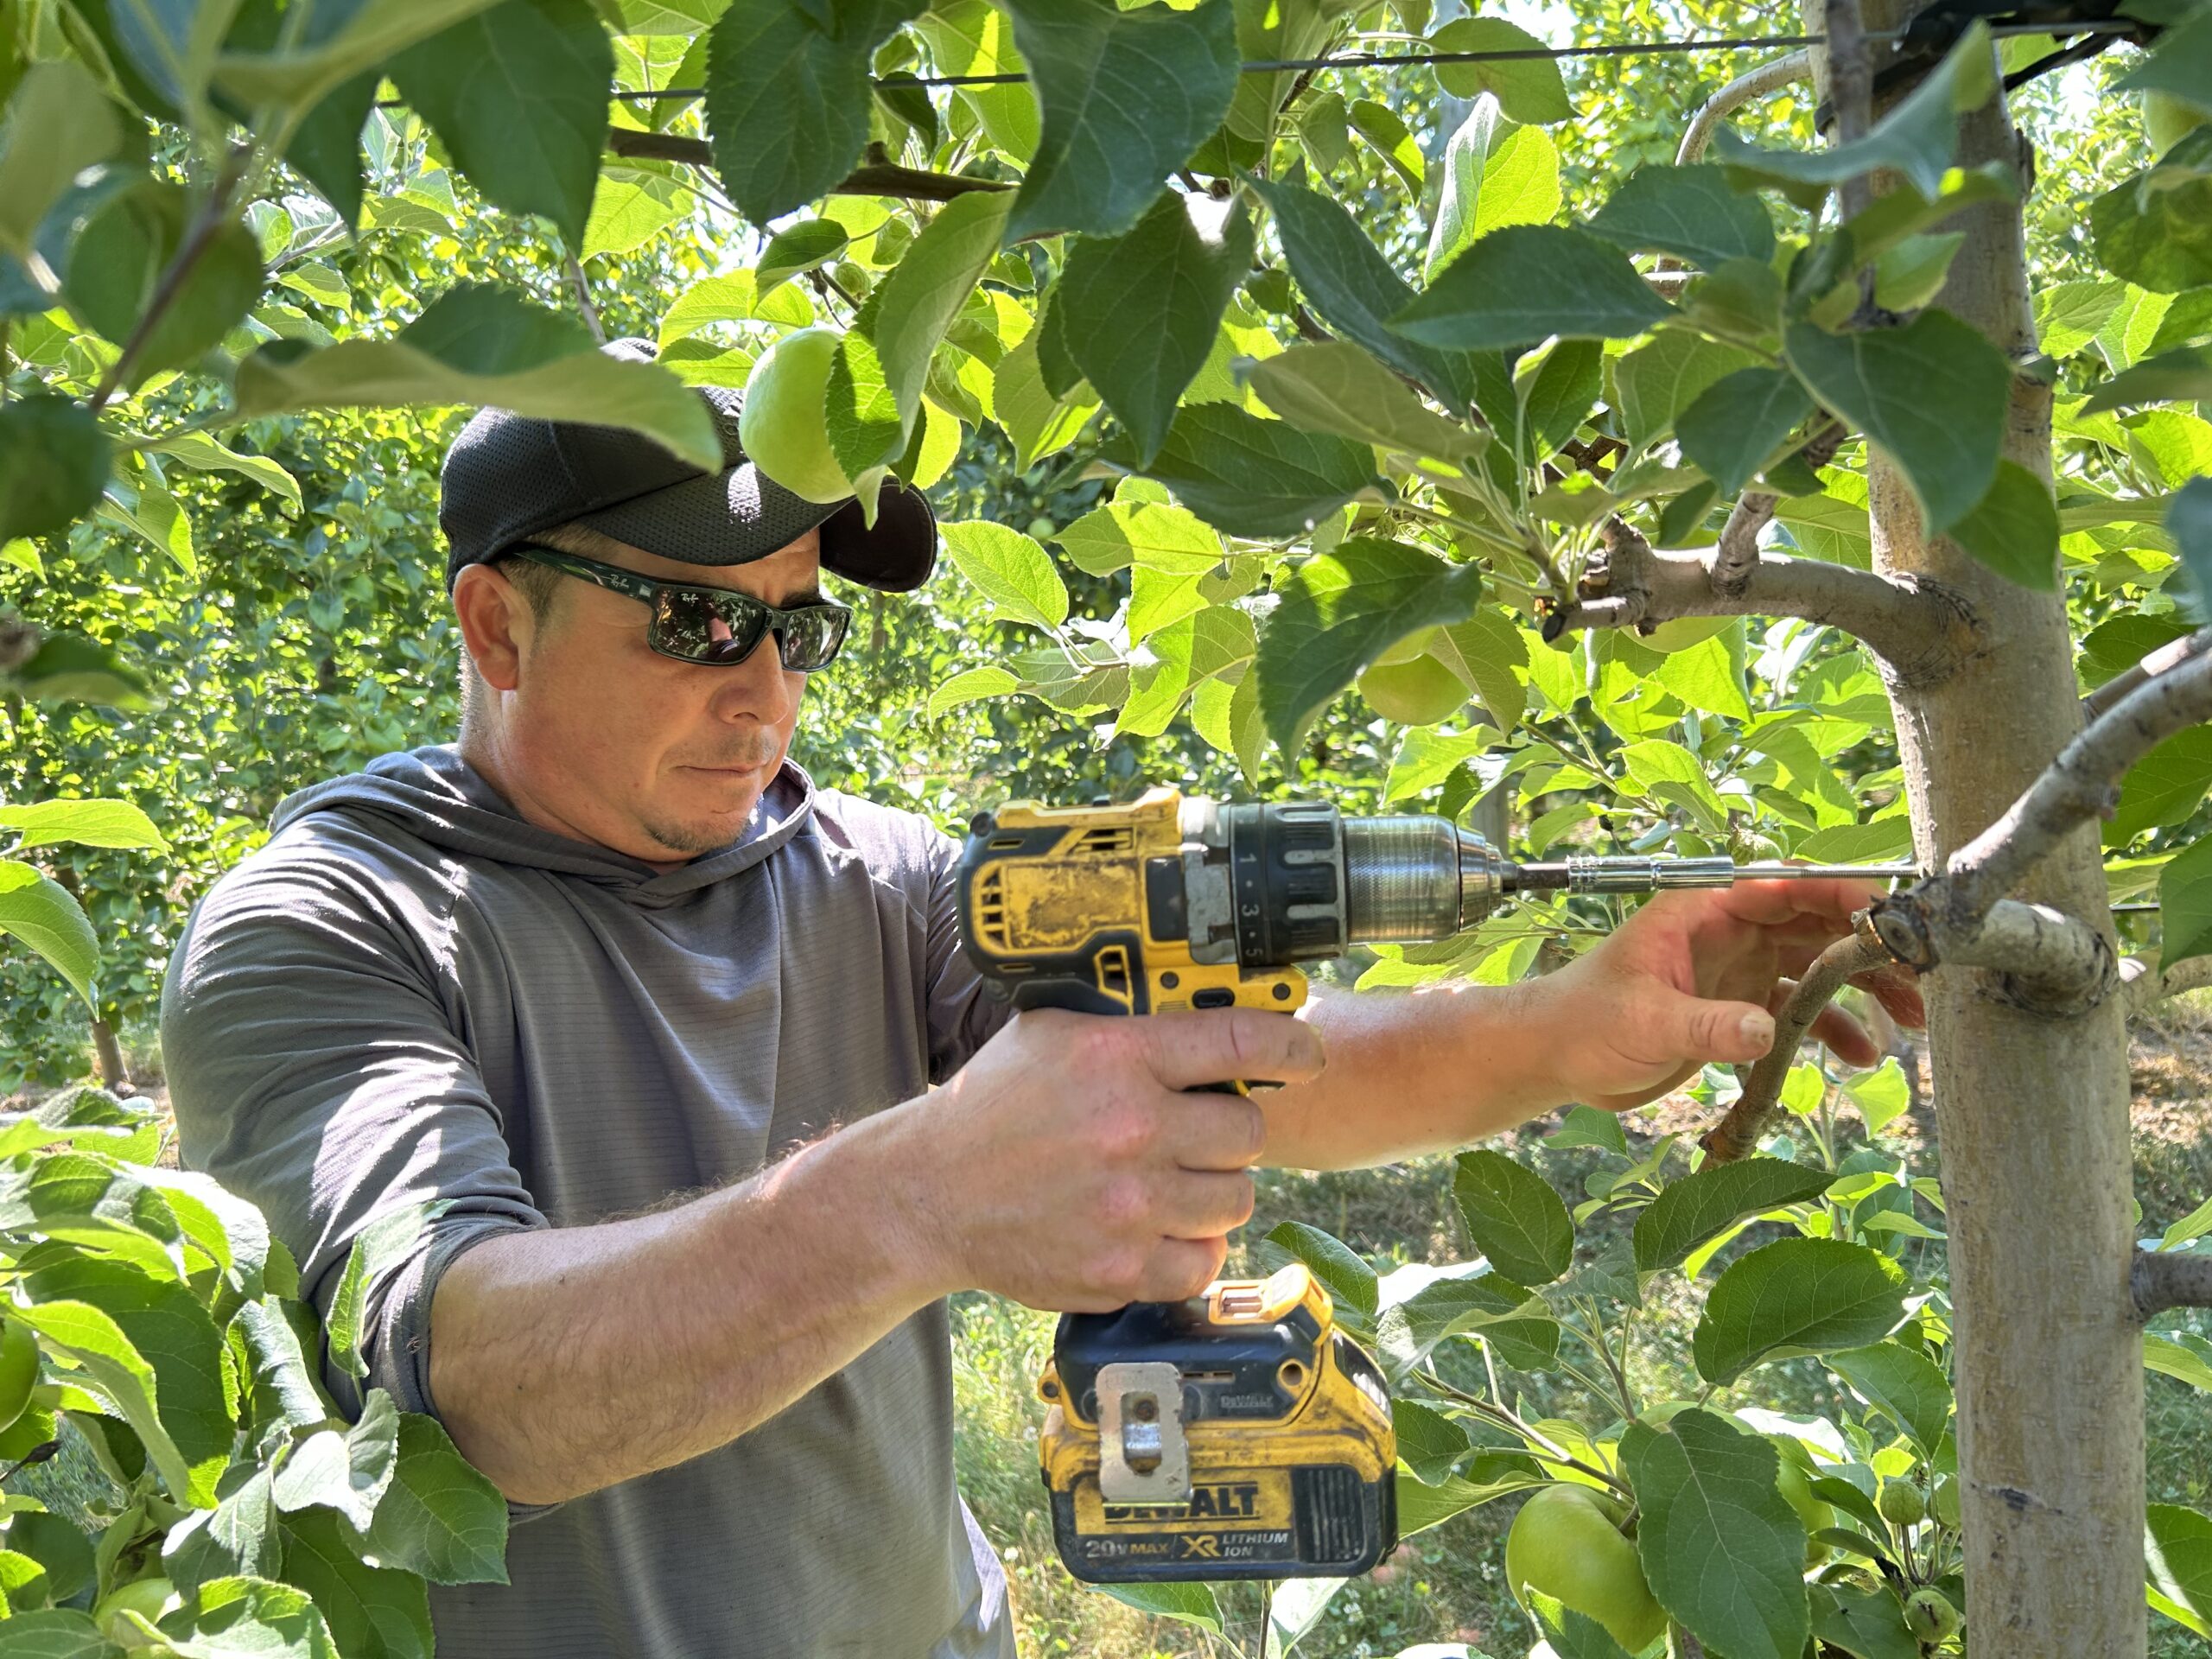
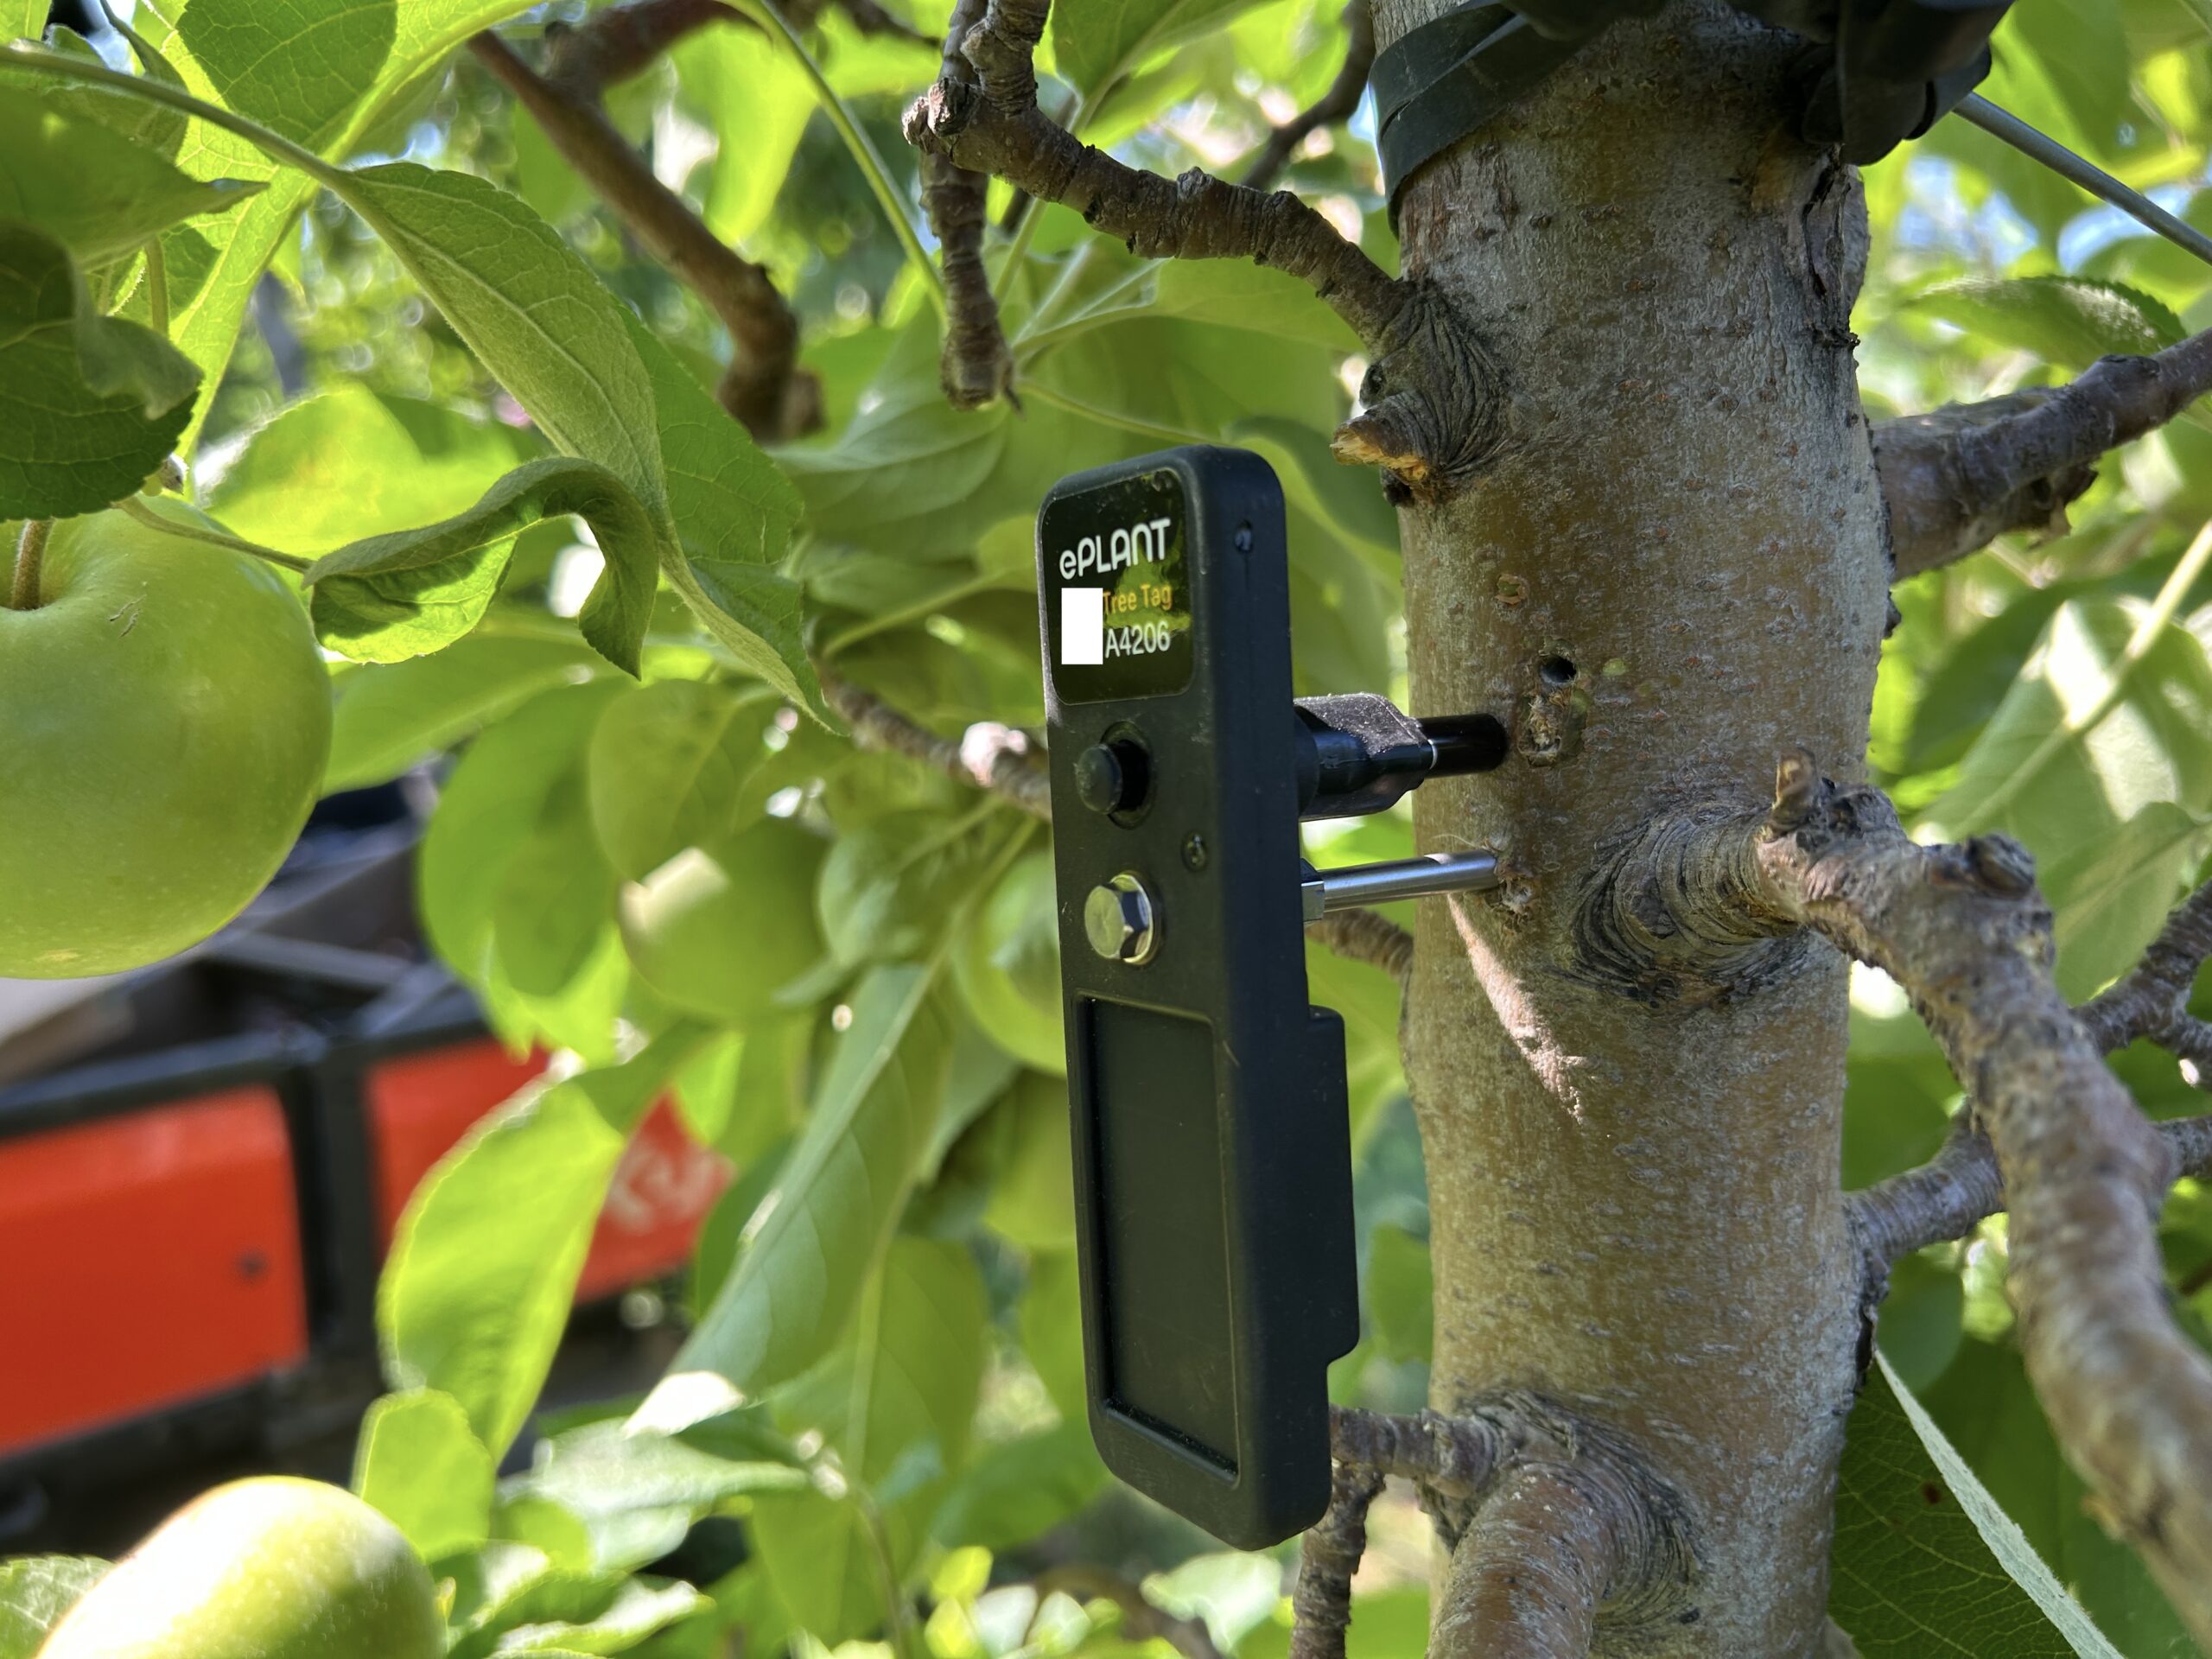
In addition to soil moisture sensing, a representative from the Wabash Heartland Innovation Network (WHIN) in Indiana informed of us of a LoRaWAN tree dendrometer from a company called ePlant out of California that collects data on tree growth in microns and other tree characteristics, as well as environmental temperature and humidity. We decided to get 4 of their Tree Tags and deployed them in the first 4/8 irrigation subzones next to the soil moisture sensors in those locations. One downside for us was we had to use the company’s LoRaWAN gateway to start, so we set it up on a tripod outside our shop building and had everything running, but faced several issues connecting the Tree Tags until confirming there was an issue stemming from the gateway company ePlant was working with. After fixing that, we were able to collect some data, but it wasn’t until after the irrigation season. We were still able to see the natural expansion and contraction of the tree trunks between night and day which was interesting, but would like to have another chance to evaluate them during rain and irrigation events. We’ve since been able to integrate the devices with our own gateway.
3. Irrigation Automation
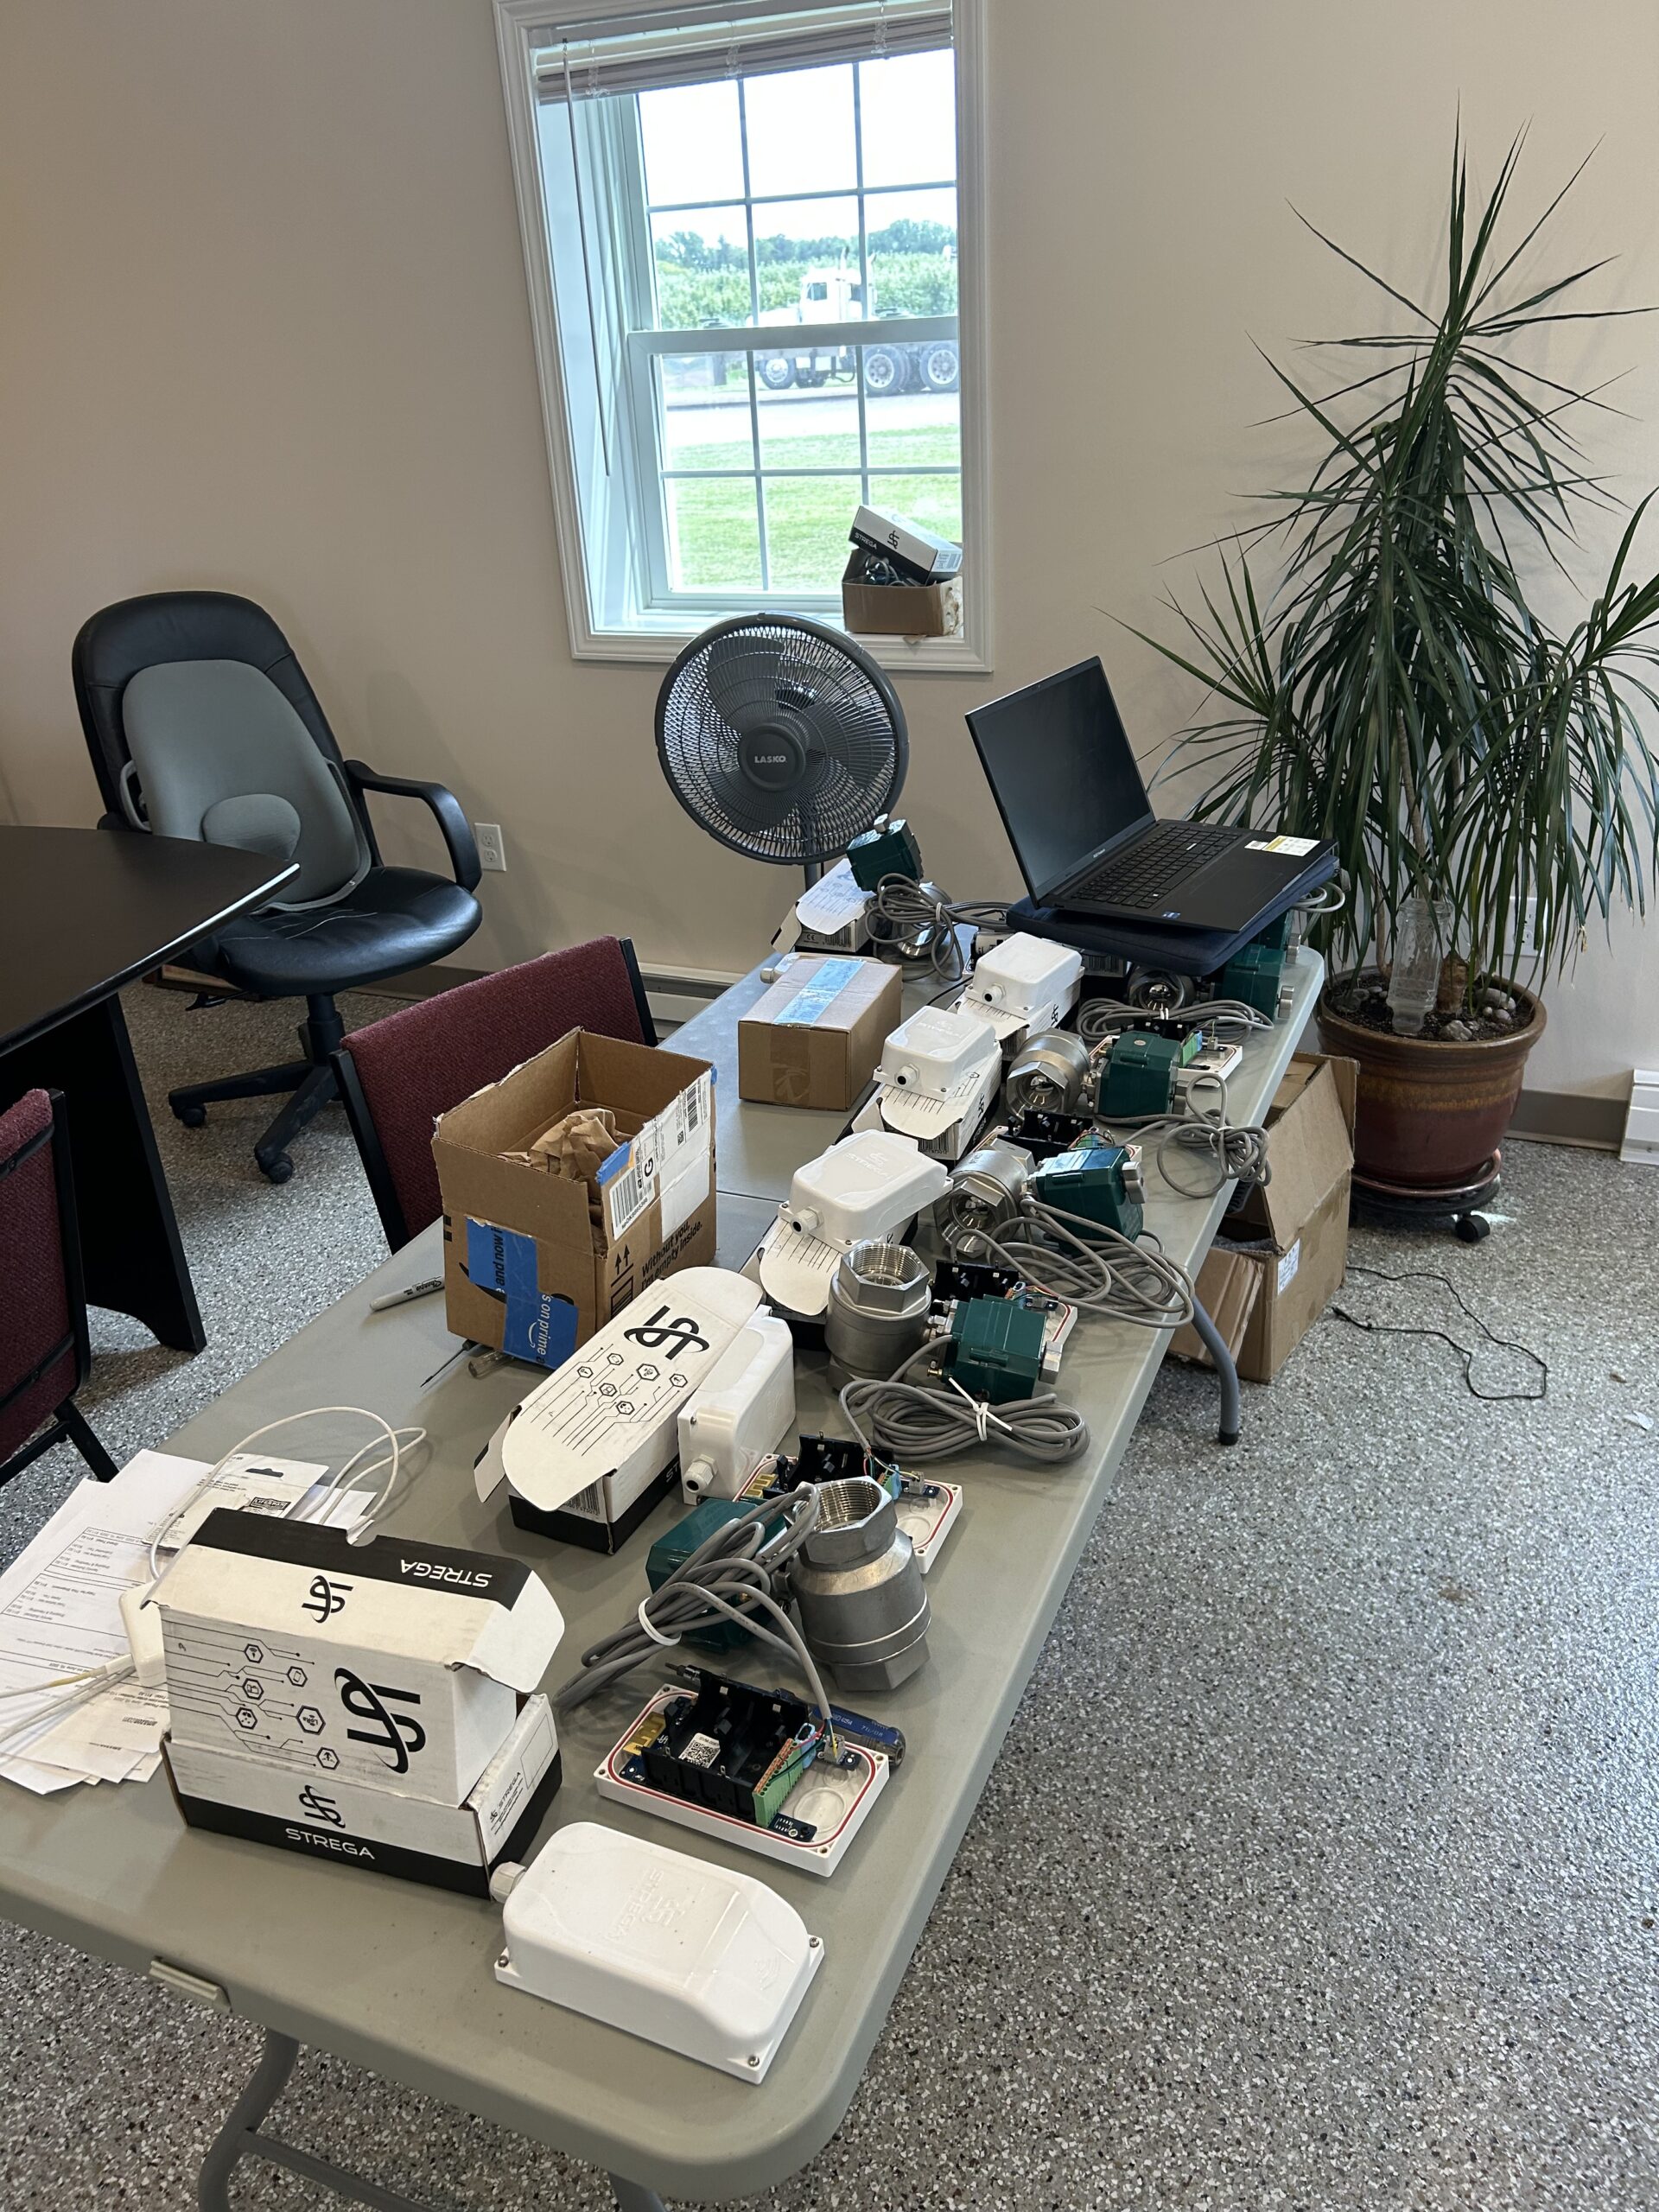
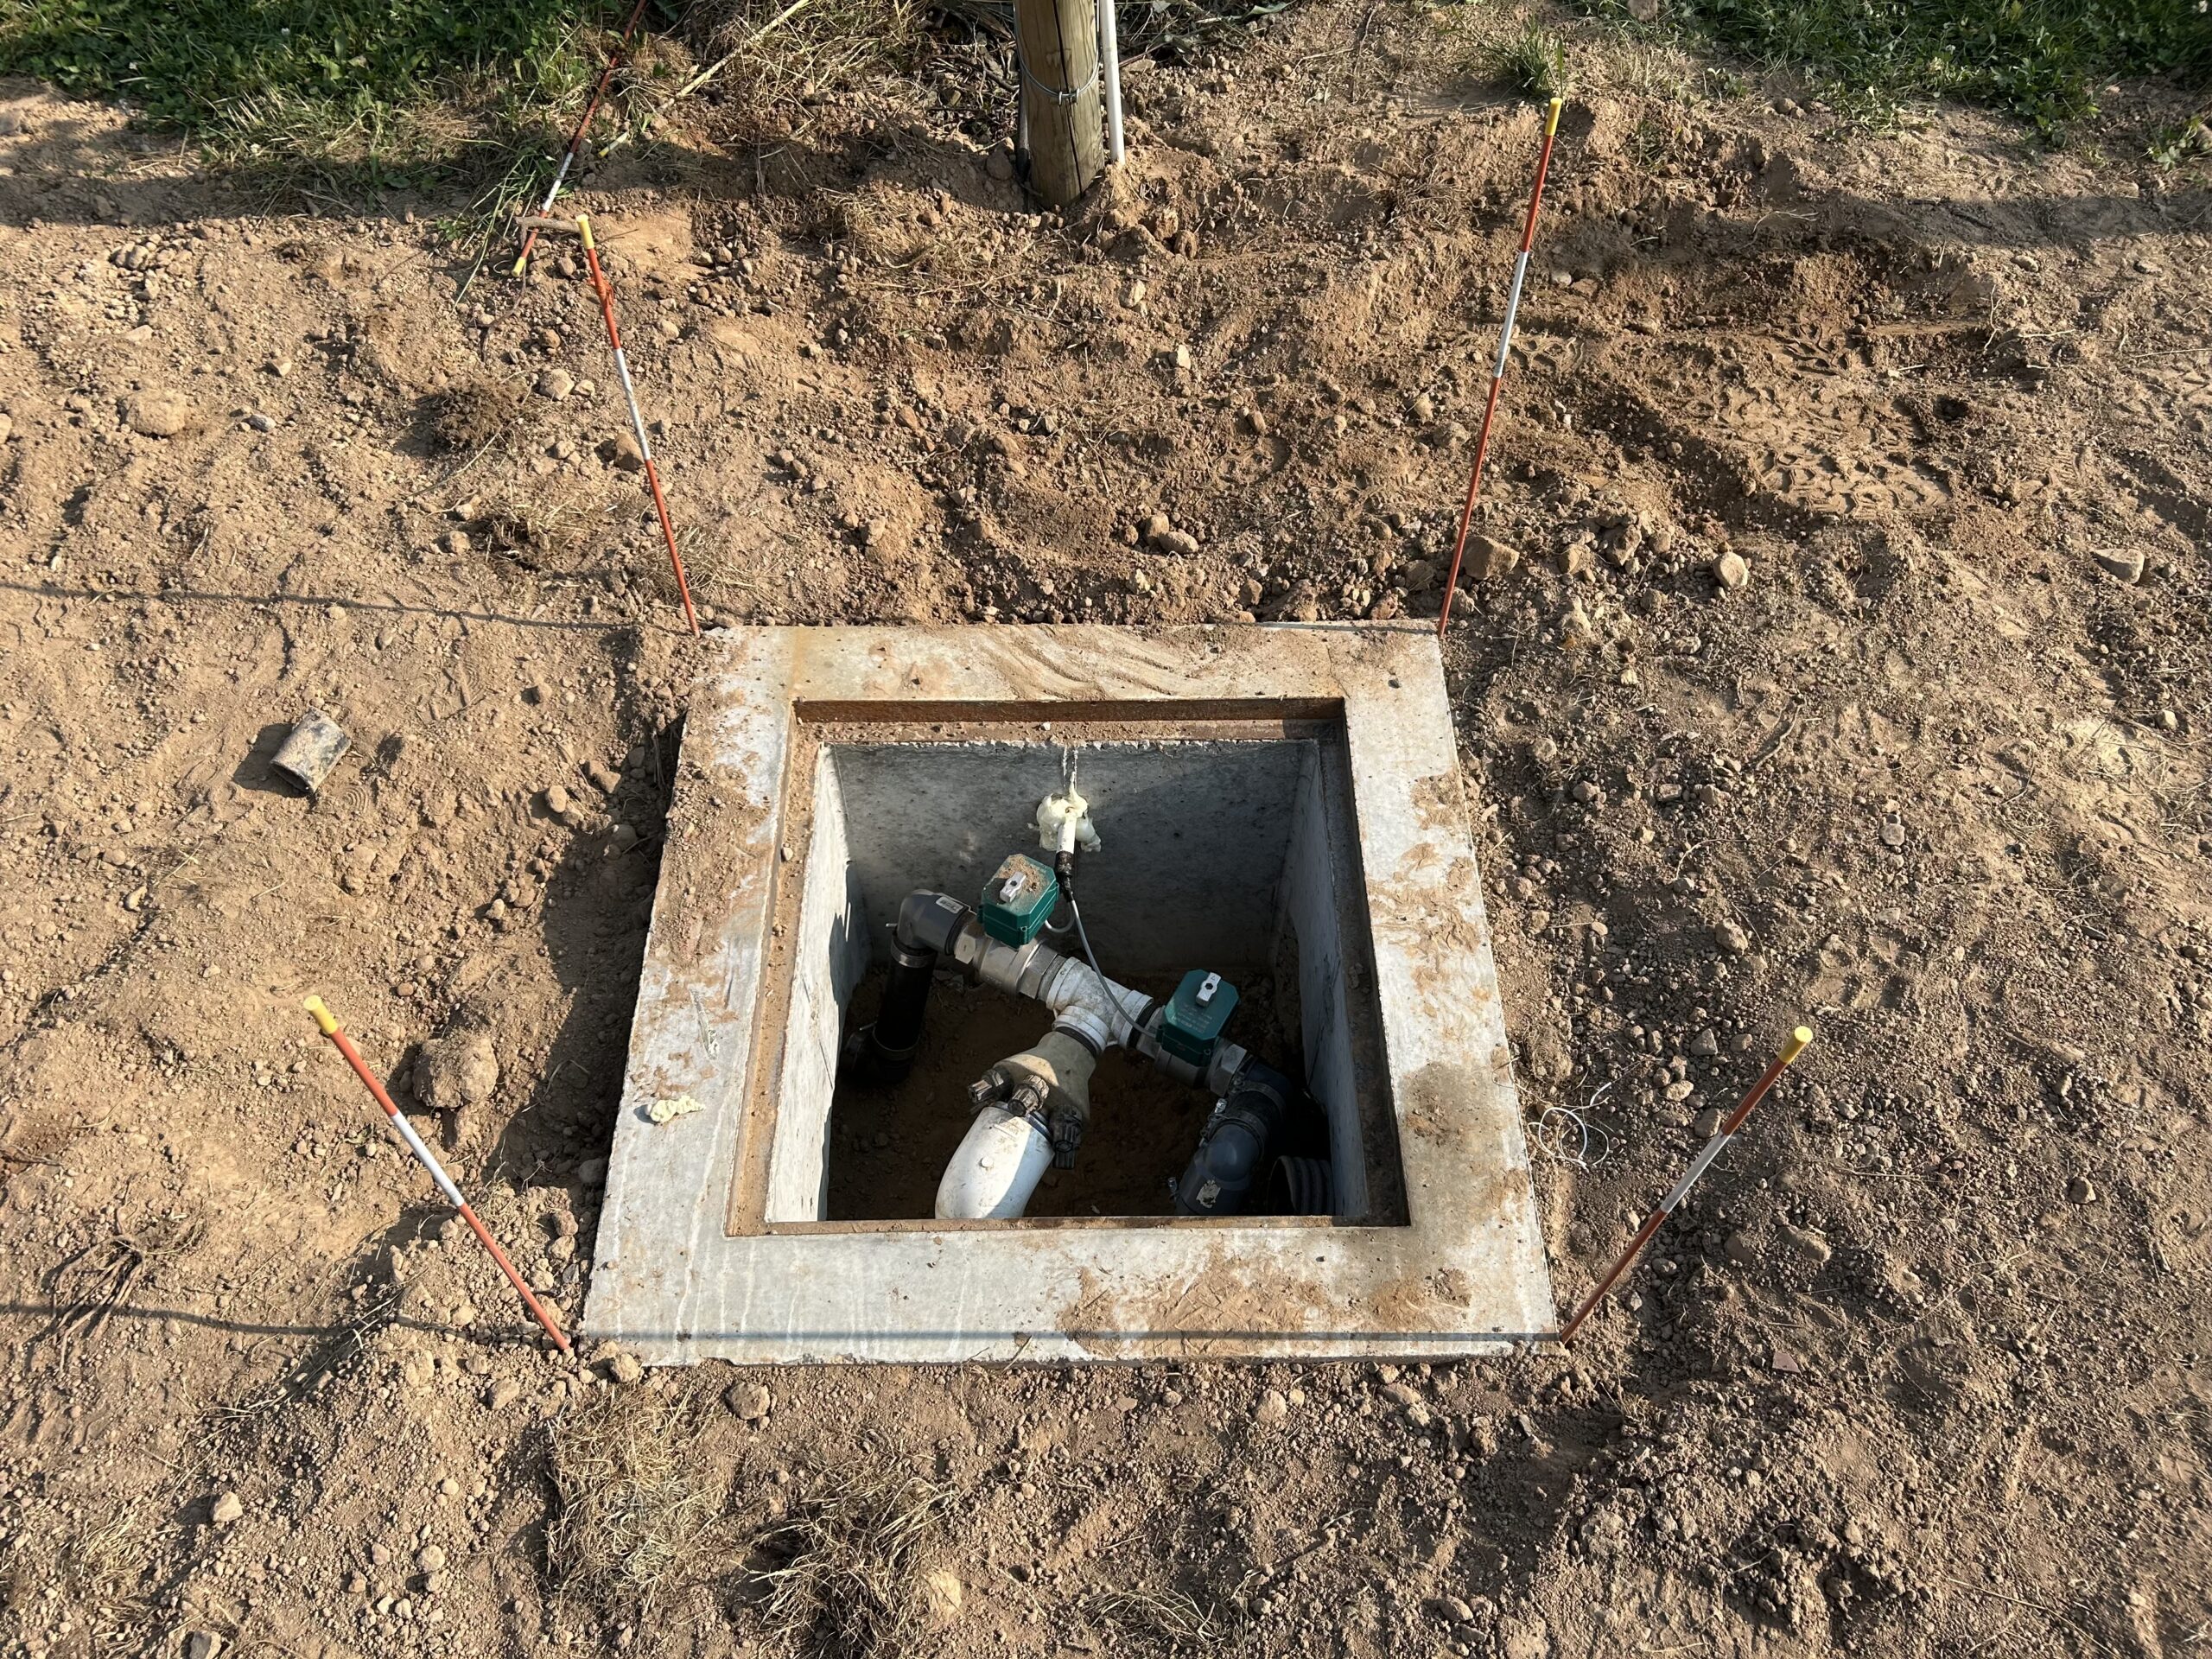
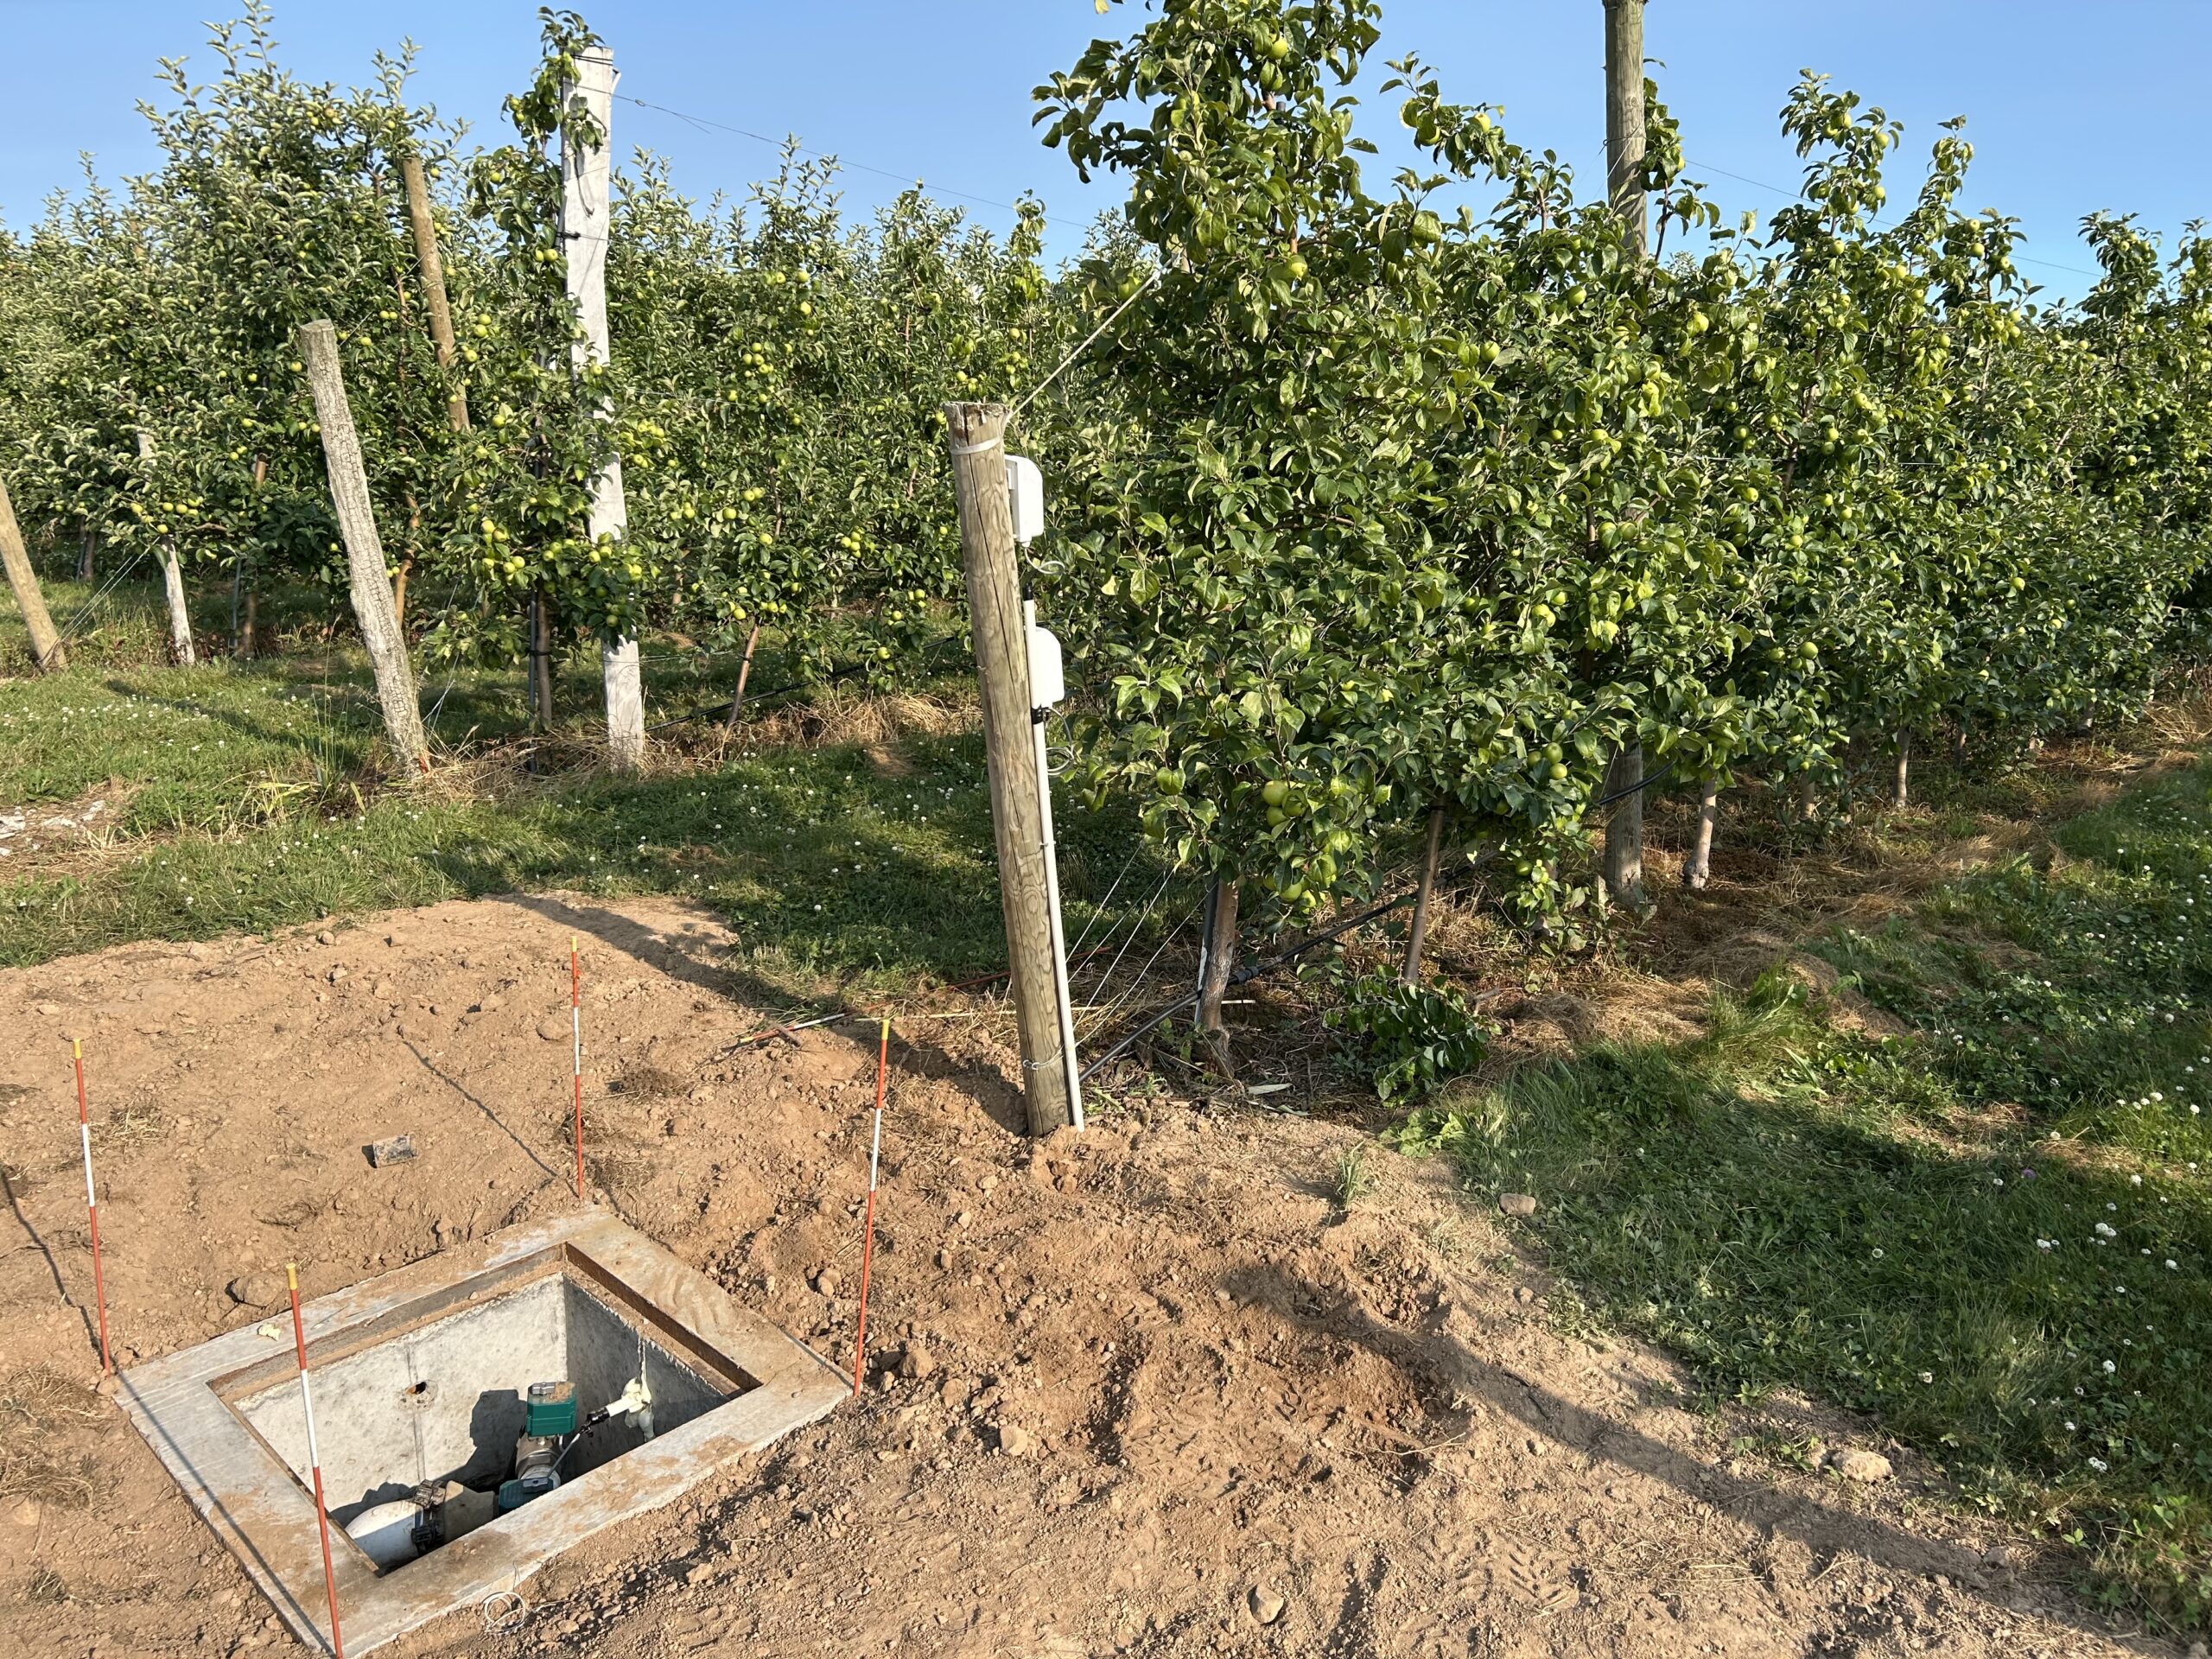
To automate turning irrigation zones on/off, our plan was to install Strega LoRaWAN Smart Valves with 10' cables for each submain to control them remotely from anywhere. We successfully acquired 10 smart valves in the summer of 2023 but faced great difficulty in doing so. Because 10 smart valves was a small order for Strega, they had us order the valves through their Chinese partner and the LoRaWAN transmitters through them. There were no issues when paying the Chinese company for the valves, but currency conversion issues came up when making bank transactions to Strega, a Belgian-based company. Then, the smart valves were packaged and shipped in a single box to us, but got stuck in customs in Memphis and an additional payment was required to finally get the package to us in NY. After receiving the smart valves, we were notified we'd need to make a firmware upgrade. Fortunately, the added wait gave us time to think more about the configuration of our submain boxes, which have been wooden to date and starting to fall apart. As part of an expansion project on another section of our farm, concrete submain boxes are being implemented as a more structurally sound alternative, and now we're planning on replacing our existing submain boxes with the same material. This will also allow for a more stable smart valve deployment and mitigate against flooding and damage concerns. When implementing, the valve portion of the smart valve replaced the previous manual valve at a pipe diameter size of DN50 or 2” and is high pressure rated at PN20. The wire to the actuator (the control and transmission portion) is run in 10’ schedule 40 PVC pipe up the nearest row post and secured with the end of the pipe to the post. This ensures data transmission/communication between the gateway and smart valve can be kept above ground and interference won’t occur with the zone box lid. In the summer of 2024, we successfully installed a new concrete zone box and smart valve in the irrigation zone closest to our gateway. A slight modification was made for the setup where an additional row post was added and the transmitter was fastened to the post facing inside the row to mitigate the risk of a tractor accidentally hitting it. The smart valve was turned on/off during our irrigation season through the use of a TagoIO dashboard for simplicity in testing since TagoIO (an IoT dashboard company) had an existing integration with Strega smart valves. Once the free data limit was reached, the smart valve’s physical backup mechanism was tested successfully for the tail end of the irrigation season to continue watering the zone.
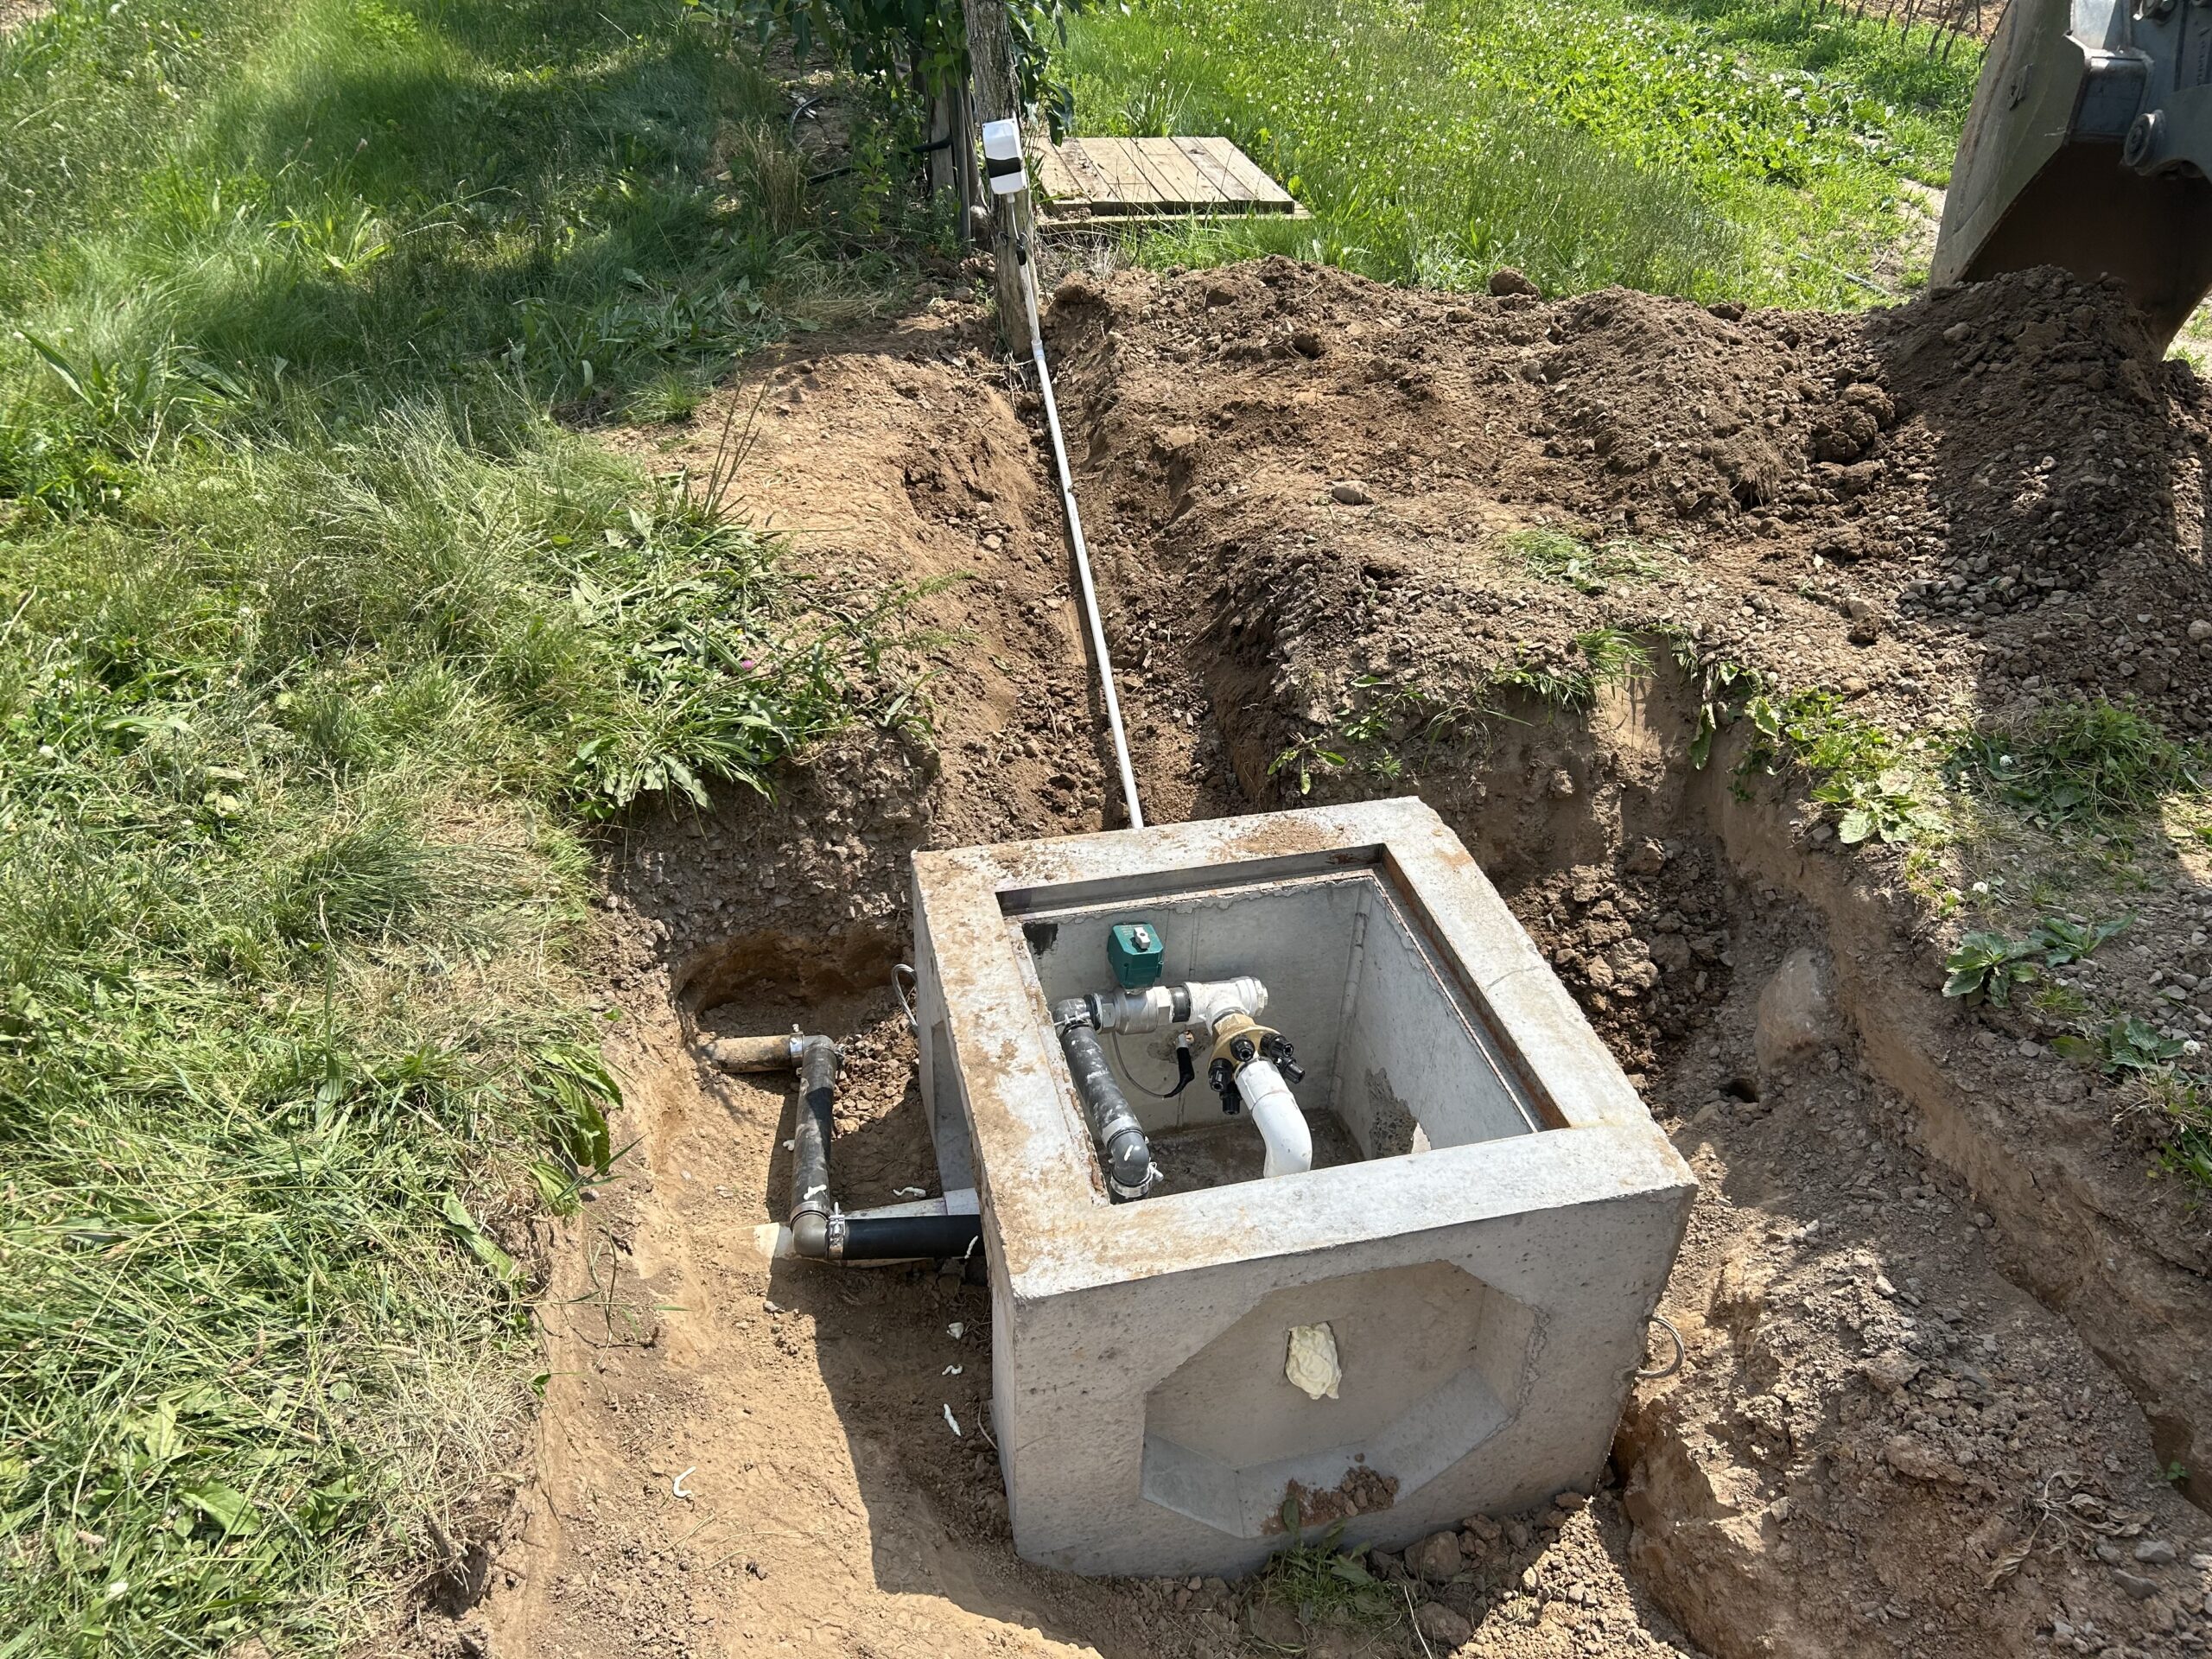
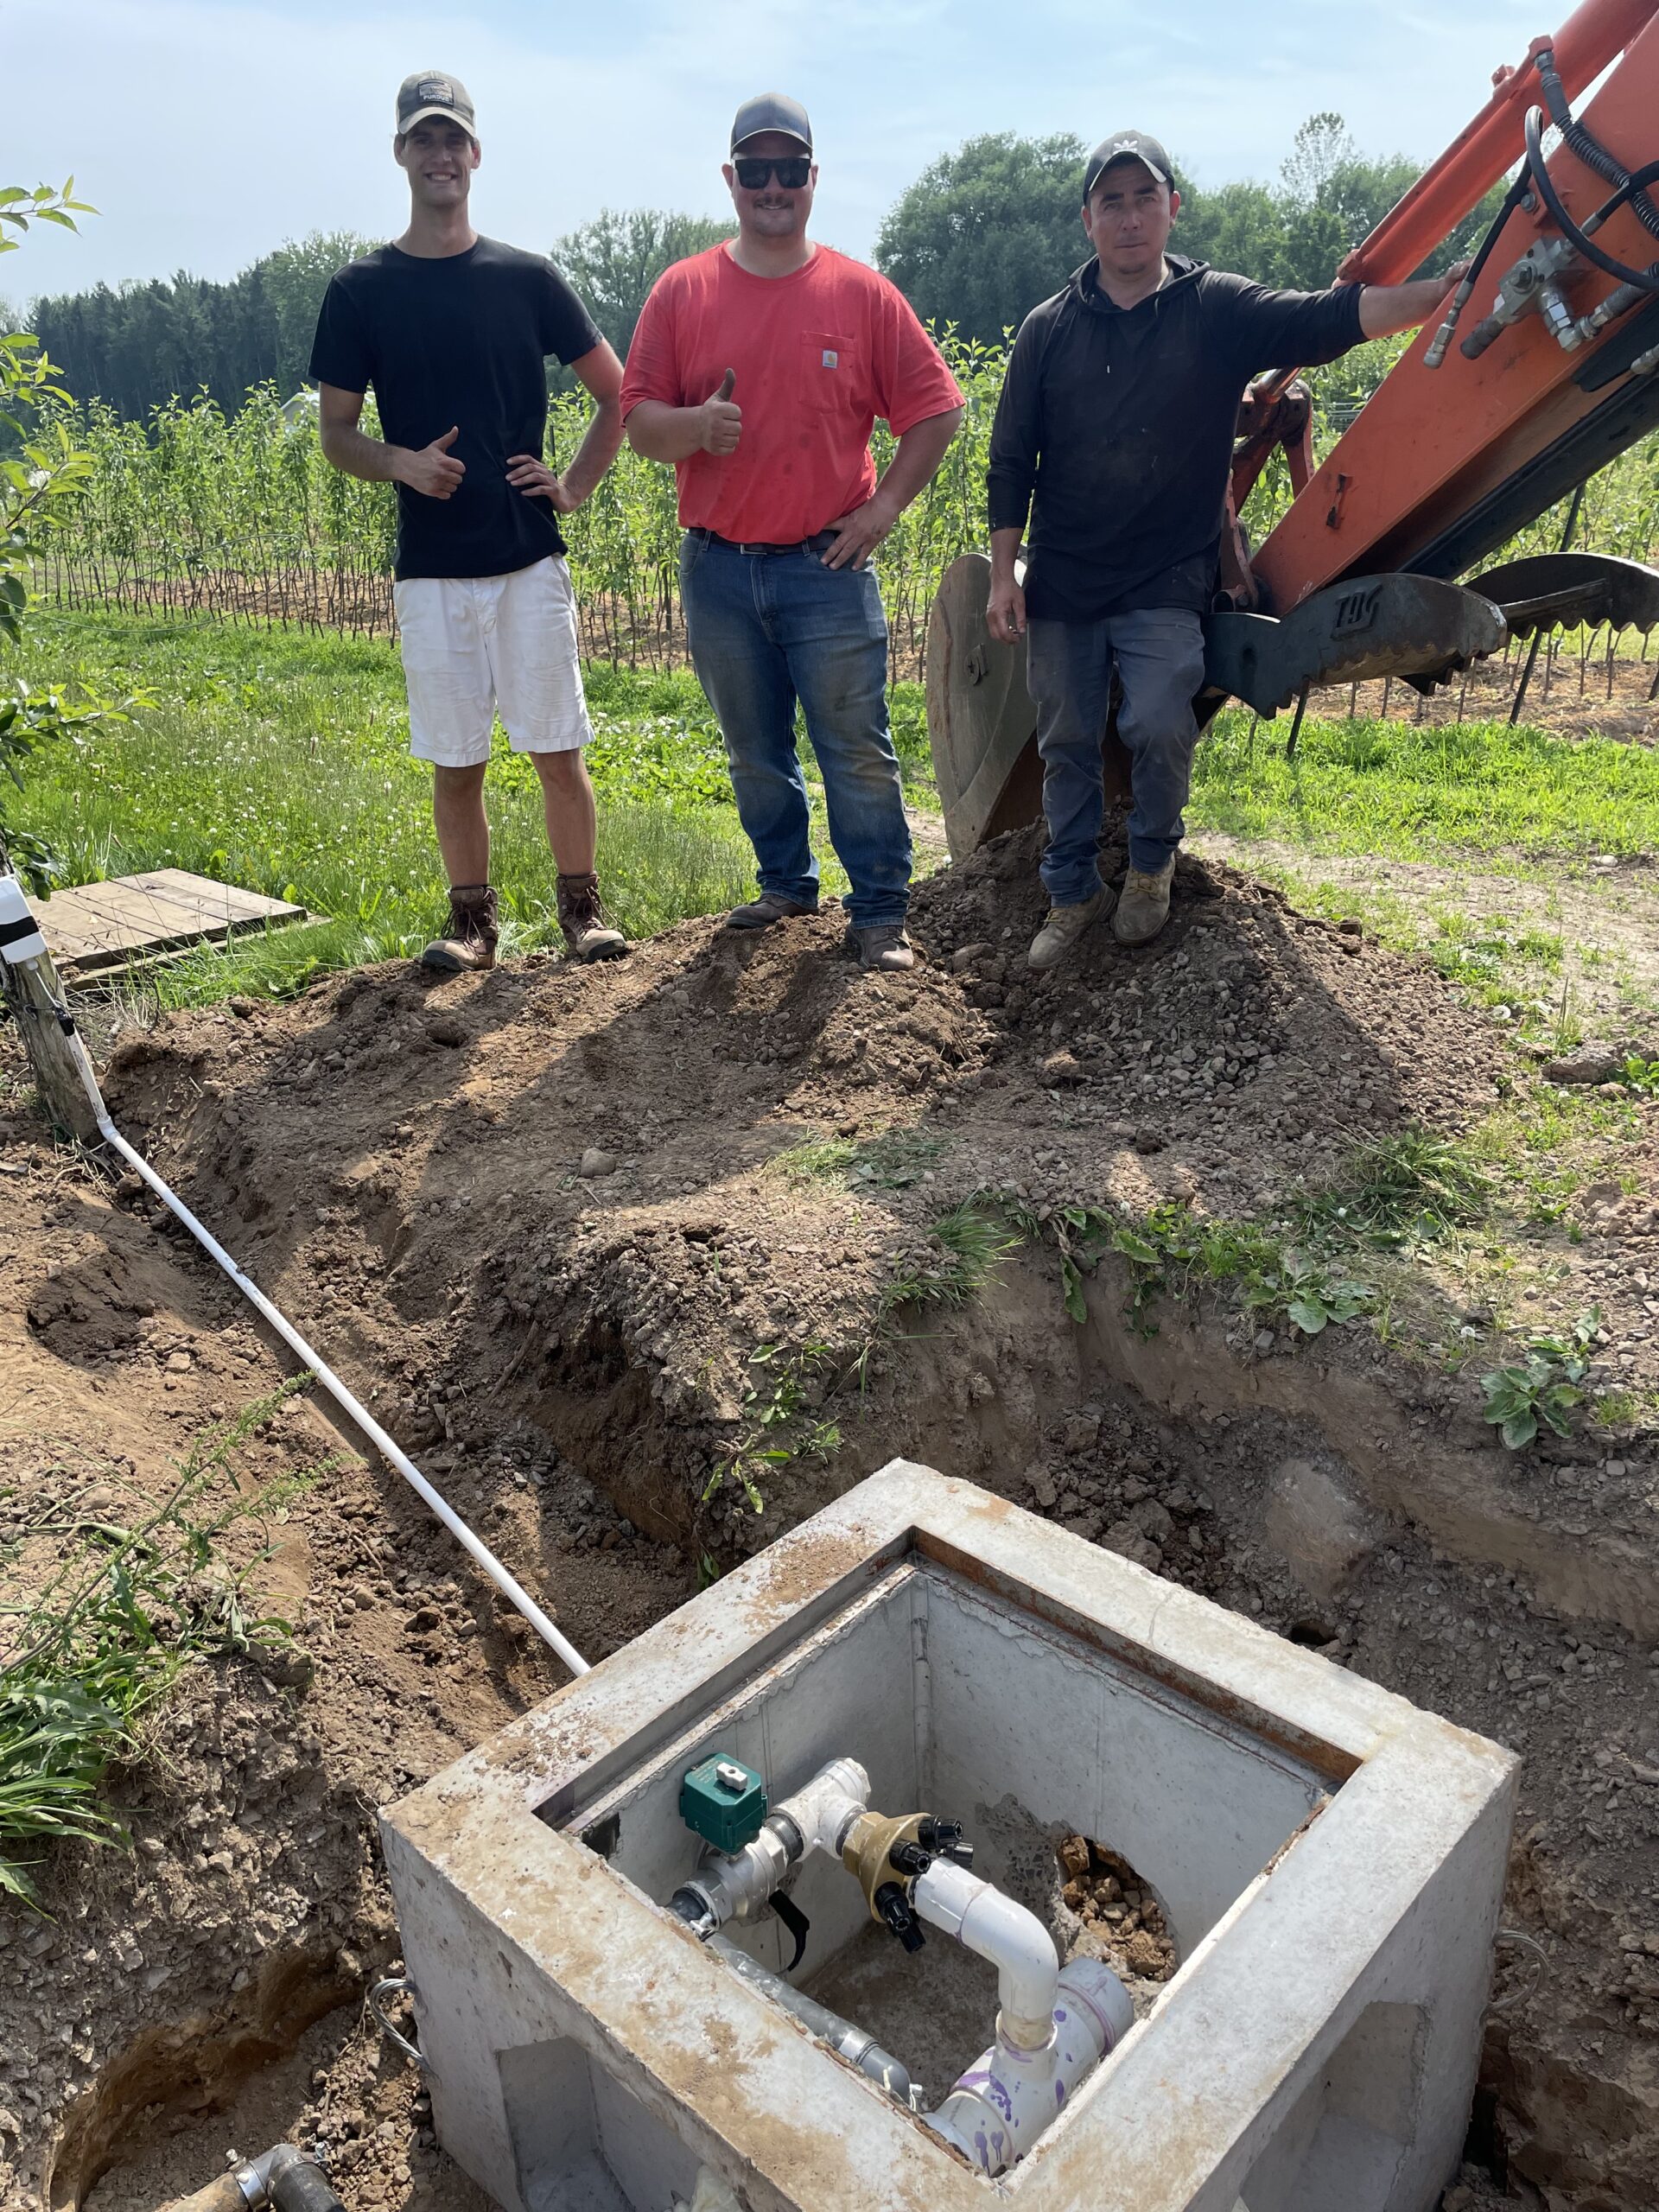
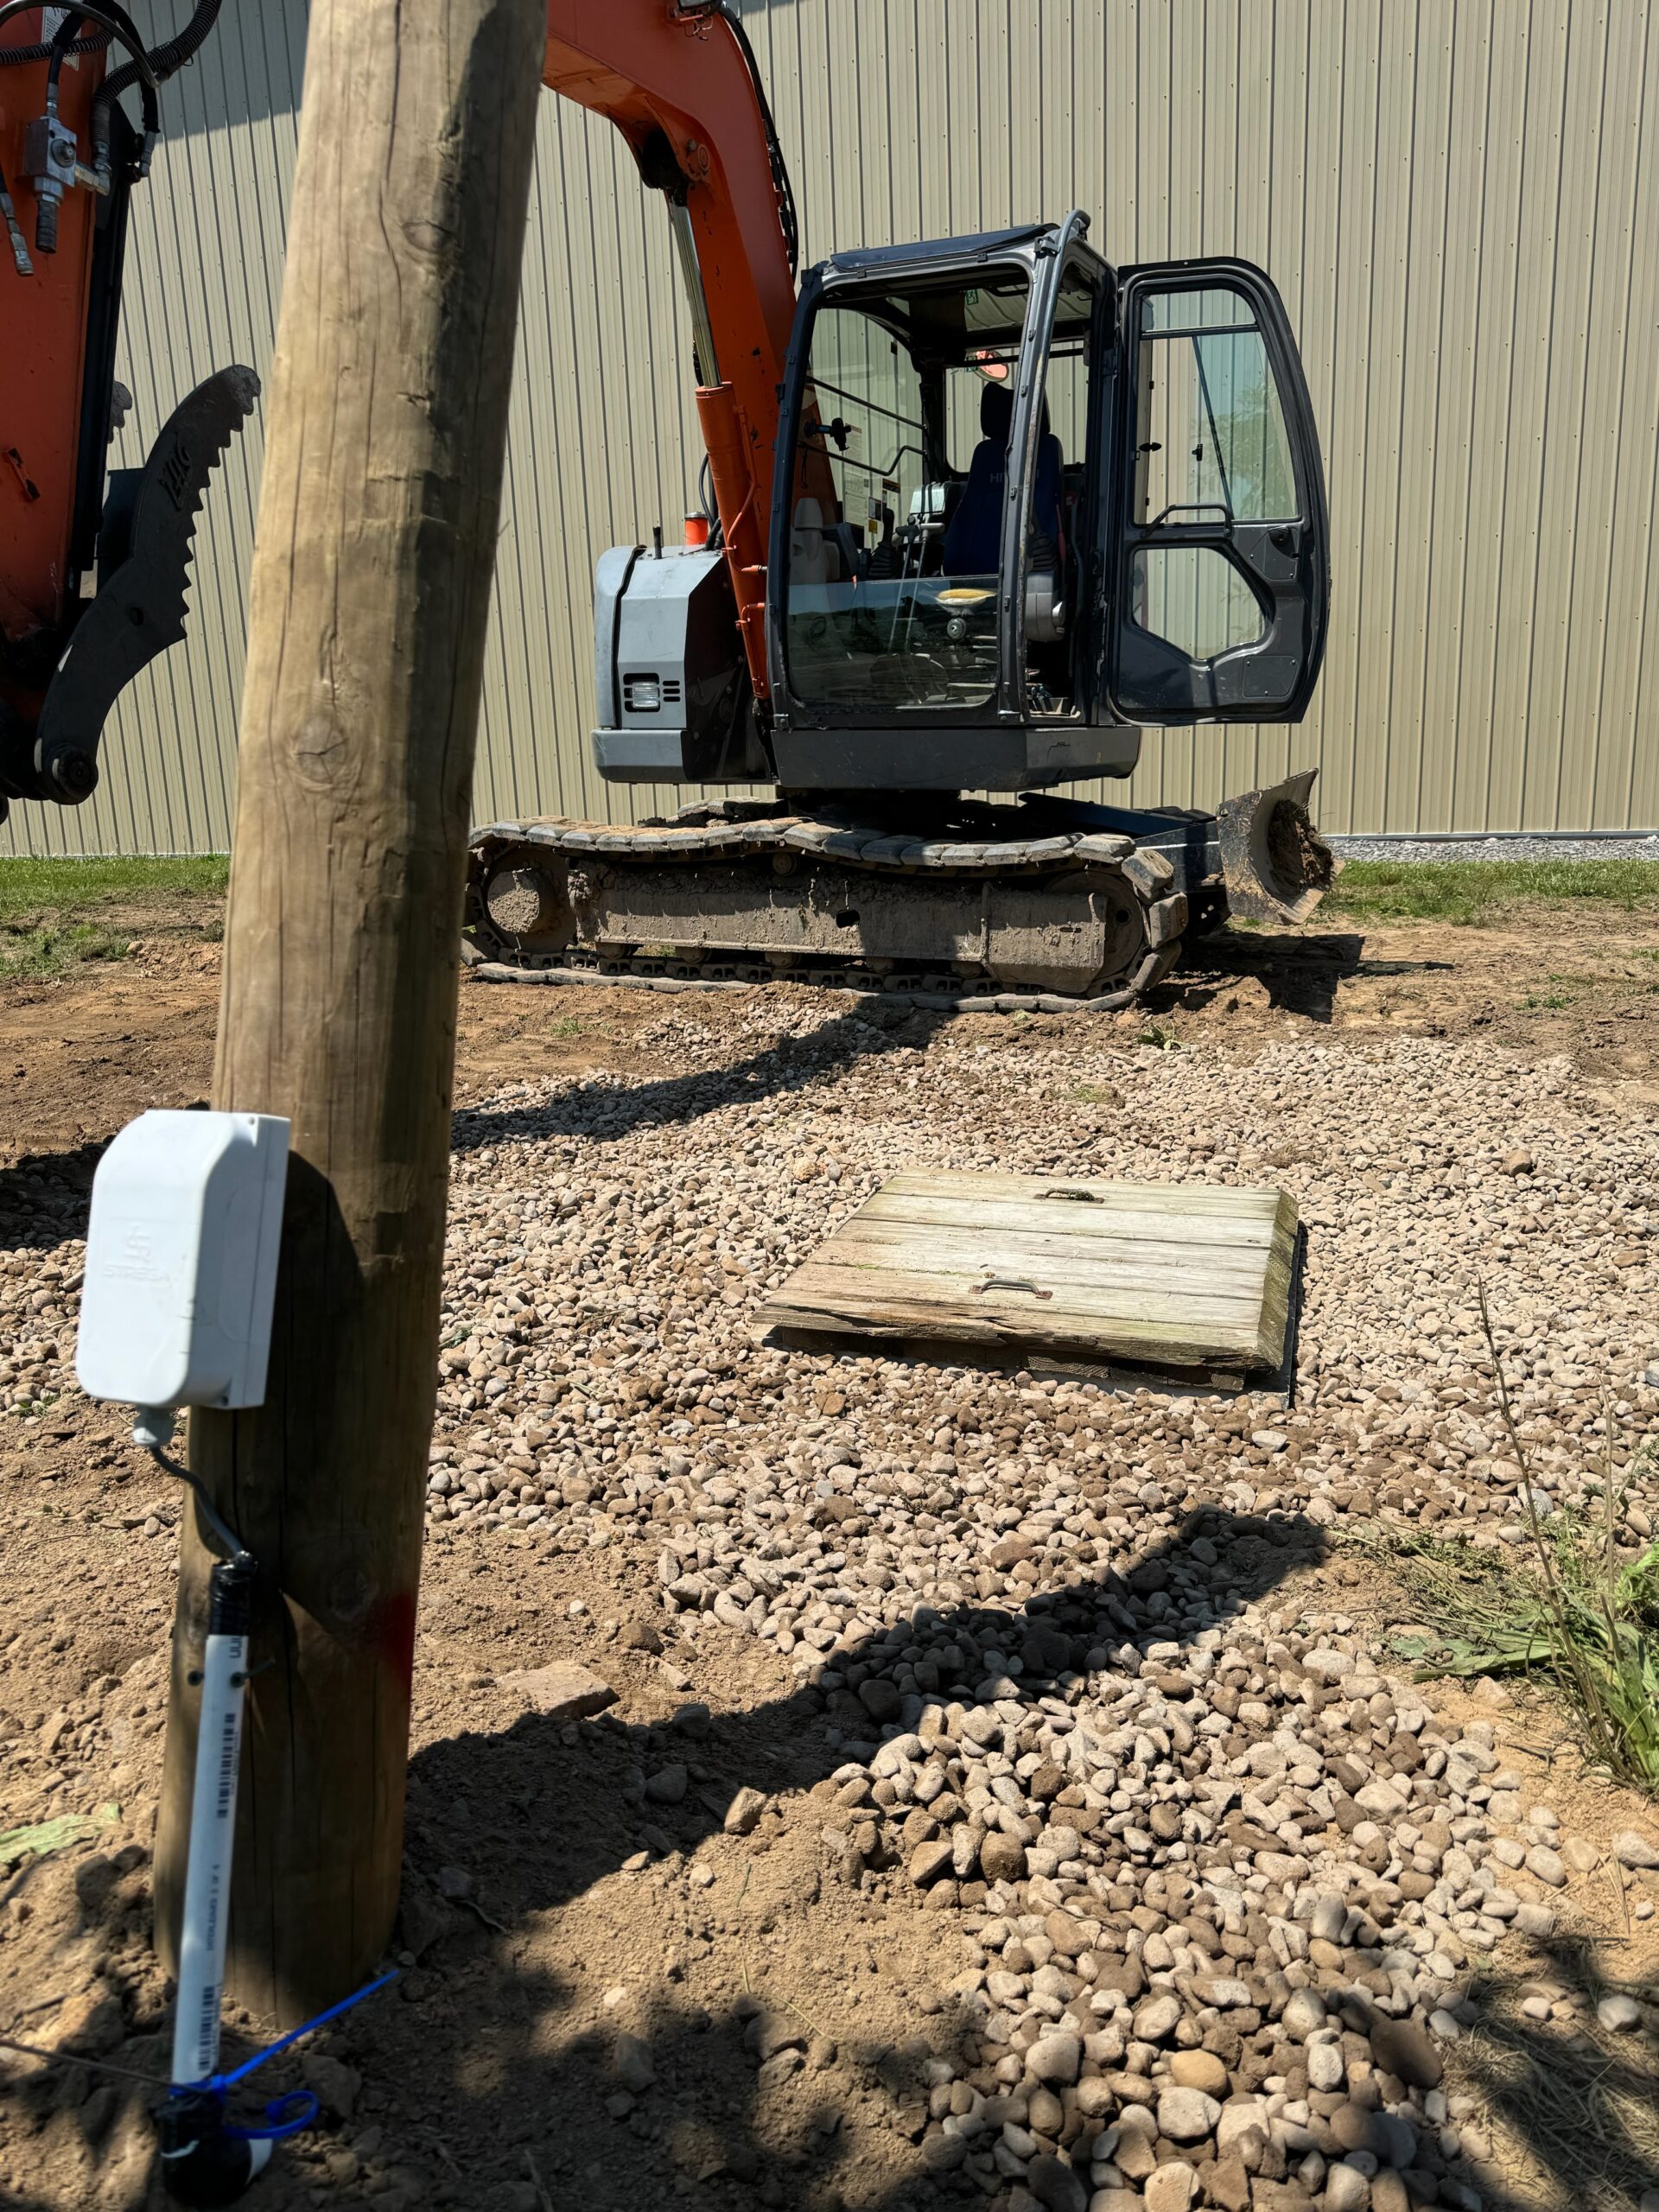
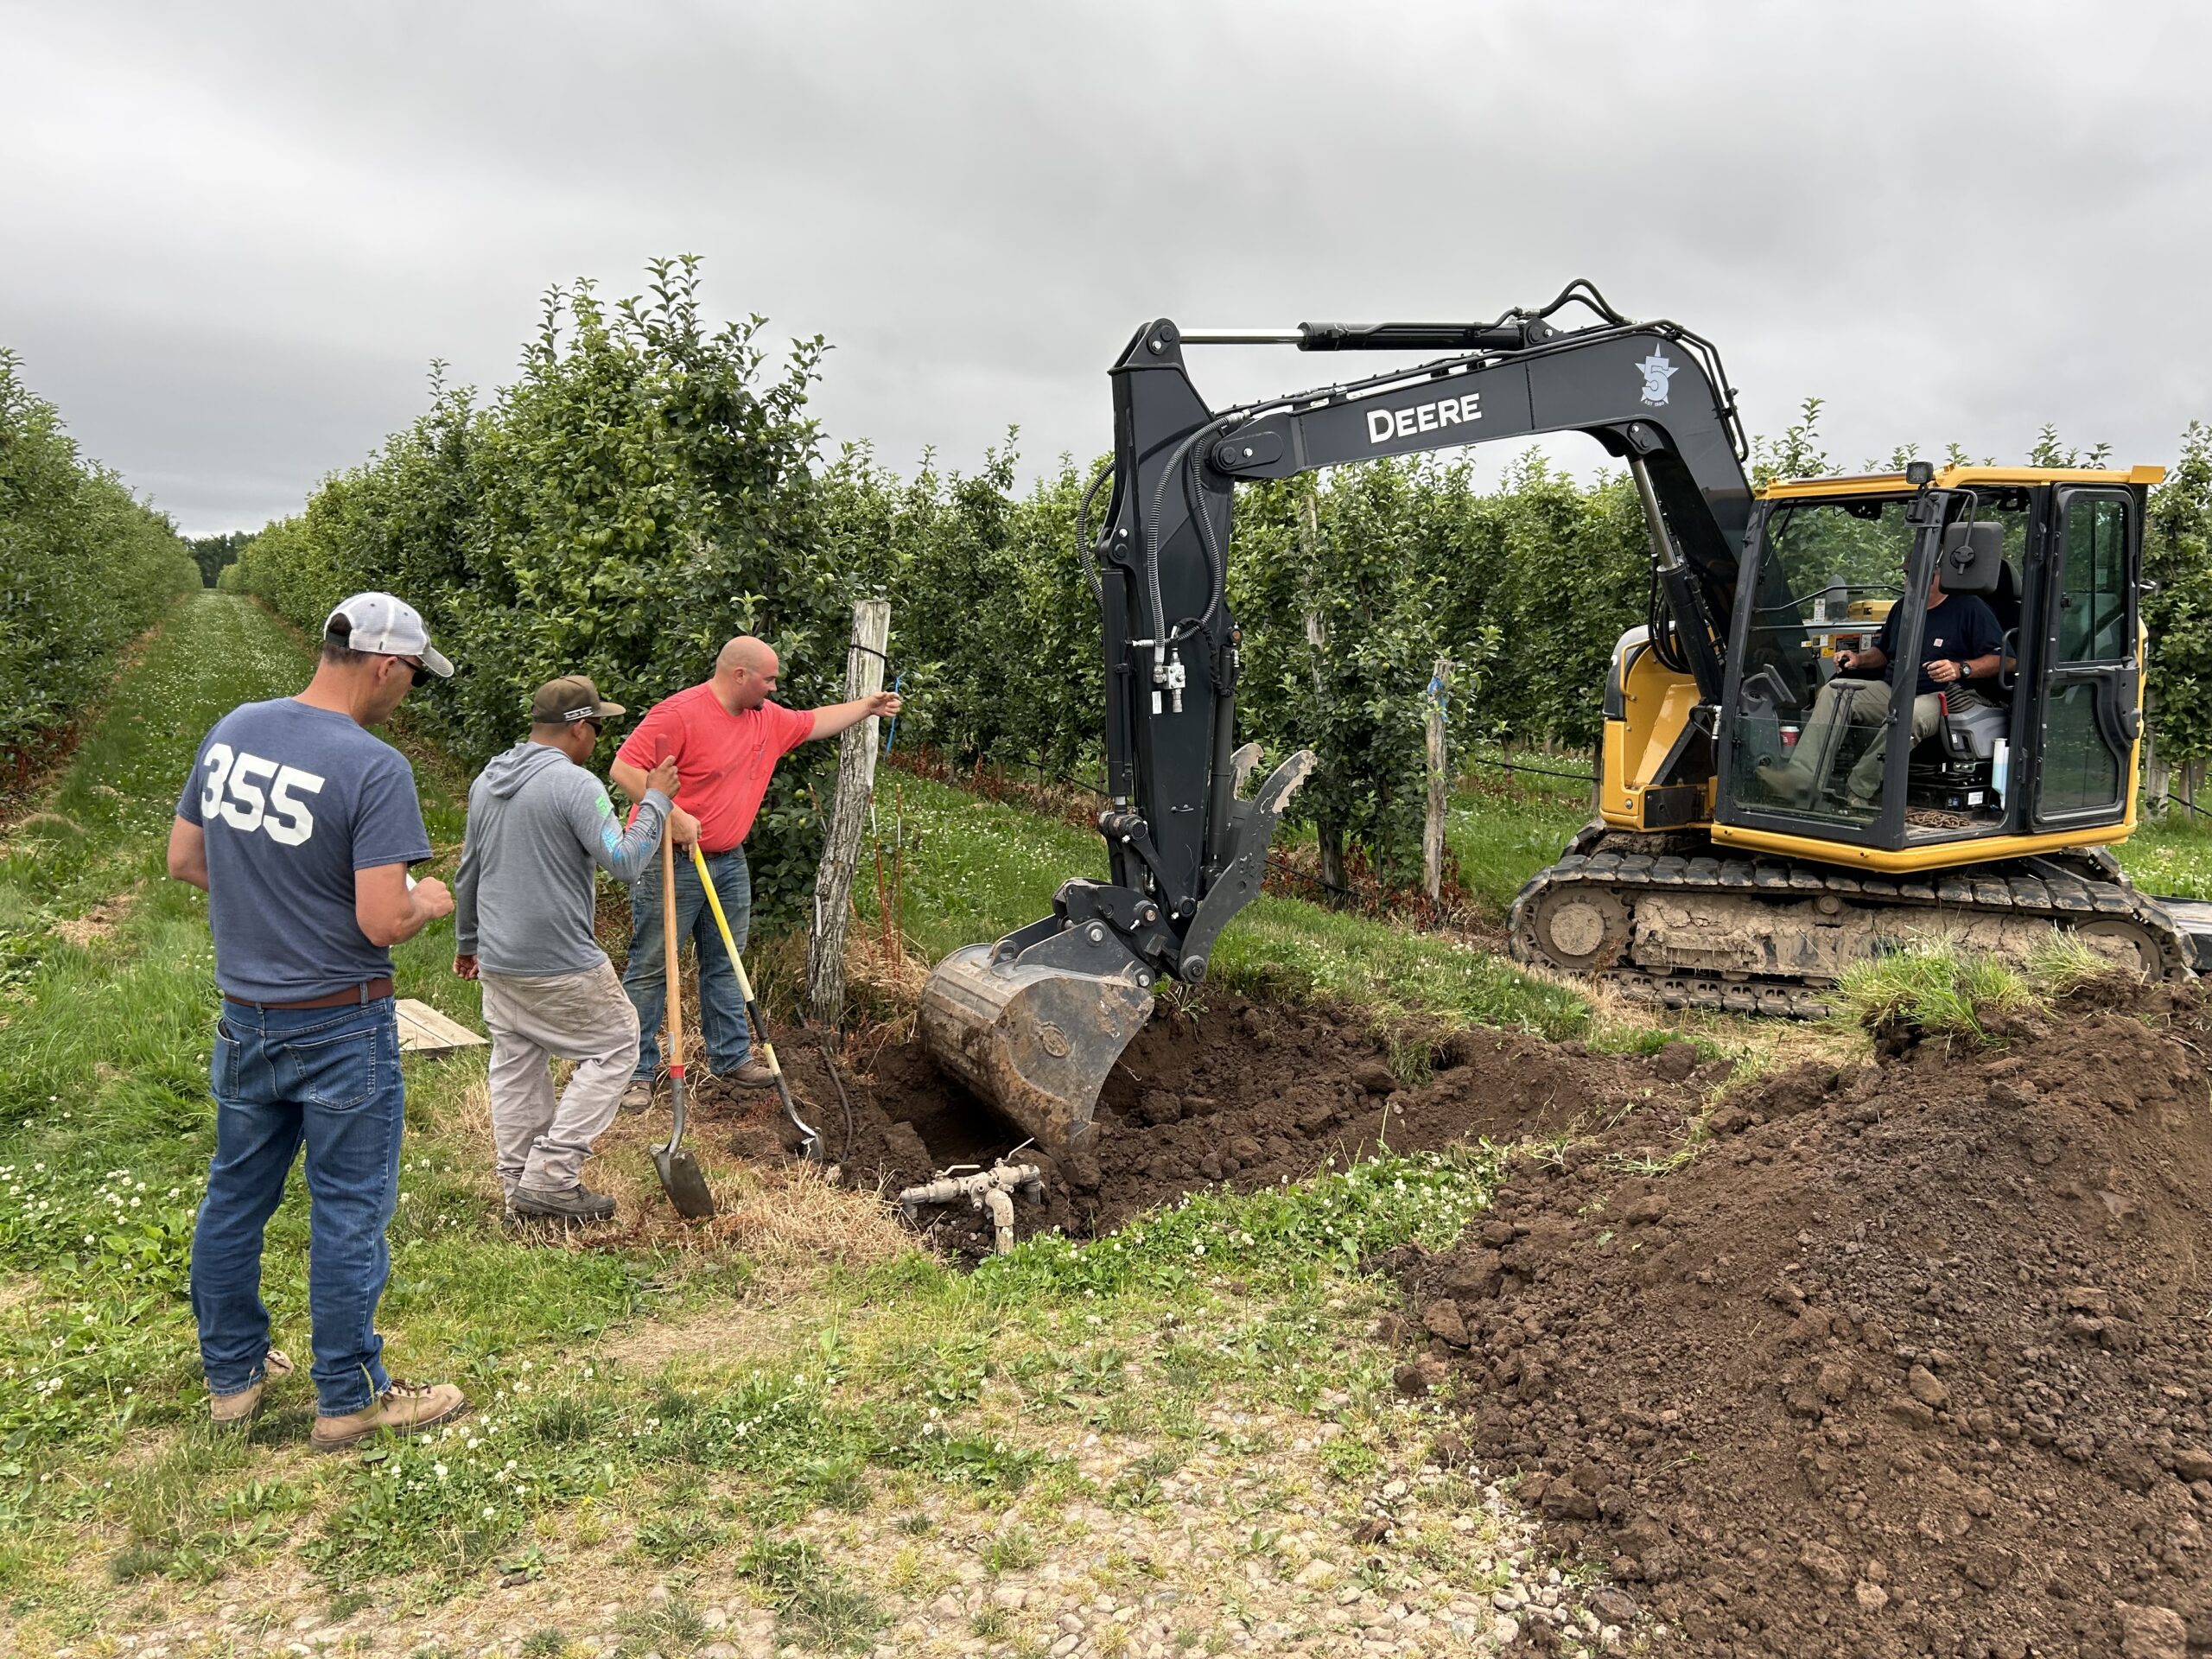
In the summer of 2025, we configured 7 more smart valves and installed them as we replaced old wooden submain boxes with concrete boxes.
Significant verification was practiced to ensure everything was working, and the first few times we switched zones on/off from the app, we would manually check to make sure it had occurred. For the first week or so, things worked well and we were able to remotely change zones from anywhere, including 2 hours away in one instance, as long as our smart phones had internet connection. One issue we did face was we consistently exceeded the data limits for our TagoIO plan, even when we moved to a paid plan, due to the fact that we weren’t parsing payloads to remove unnecessary variables from being processed and stored. We also didn’t have time at that point in the season to deal with this, so we frequently had to keep bumping the limits up and paying a bit extra. Towards the end of the irrigation season, we found more issues with the valves themselves which were supplied by Strega’s valve manufacturing partner in China, including inconsistent/unreliable openings where valves didn’t always open/close fully, times where the valves’ motors would continue working after already being fully opened/closed, and times where they simply wouldn’t do anything even though downlink commands were properly sent and verified. After harvest and when all valves were opened for winterization, 4/8 of the valves didn’t respond to downlink commands, and they had only been in the ground for 6 months. Based on these results, we’ve decided if we were to continue with a LoRaWAN smart valve setup, we would use the Strega electronic boxes but an American company’s solenoid valves for more reliability and support if something went wrong.
4. Weather Data Collection
Concerns earlier in the summer of 2023 arose when it appeared Davis weather stations didn't have a supportive LoRaWAN integration, and individual components for the only LoRaWAN-specific option we could find were ordered from a company based in China. However, once we acquired everything, we found out that we had to source the tripod mounting brackets ourselves, as the company in China only worked with local distributors for those parts and there weren’t any distributors in the US or anywhere else as far as we could tell. We considered the Davis Vantage Pro2 Weather Station as well since it’s widely used in the agricultural industry, however we felt that the weather stations that are part of the NEWA IPM program could provide us and other northeastern farms with an additional added value through being able to connect the weather stations to the NEWA website and run pest, disease, and crop models based on the local weather data collected, leading us to favor weather stations compatible with this integration. Therefore, to study weather differences near and away from Lake Ontario, in 2025 we were planning on doing a weather data study with a KestrelMet 6000 Weather Station. From talks with fellow growers, this weather station was recommended to us as the best option compatible with the NEWA system. The KestrelMet 6000 can be purchased either to upload data via Wi-Fi or cellular connection, and we’d hoped to use Wi-Fi to avoid the monthly cellular costs. However, we found out our Wi-Fi router could not be dual band in order to be compatible, which ours unfortunately are. Therefore, the company recommended the AgroMET & IP-100 Package, which comes with a unit that can be plugged into a Wi-Fi router and connects to the weather station up to 100 ft away. We set up the weather station with a mount post on our deer fence surrounding the orchard block associated with this grant with the solar panel facing south. We were able to collect data on an AmbientWeatherNet portal, but we noticed that no precipitation data was showing up, even after heavy rain events. We ended up working with the company over the course of several weeks to troubleshoot and swap various parts out to no avail. We decided to ship the unit back so it could be tested and received the unit from the company after verification that everything should be in order a couple weeks later. We have since worked with the company to redeploy the weather station and confirmed the new location has appropriate signal strength for precipitation readings. Proximity to a metal barn could’ve played a role in affecting the weather station’s ability to pick up precipitation before. In our original grant submission, we’d hoped to work with 2-3 other farms with already-established weather stations in the NEWA system to compare weather patterns over a period of time, but unfortunately the main weather station we’d hoped to get data from has since been retired.
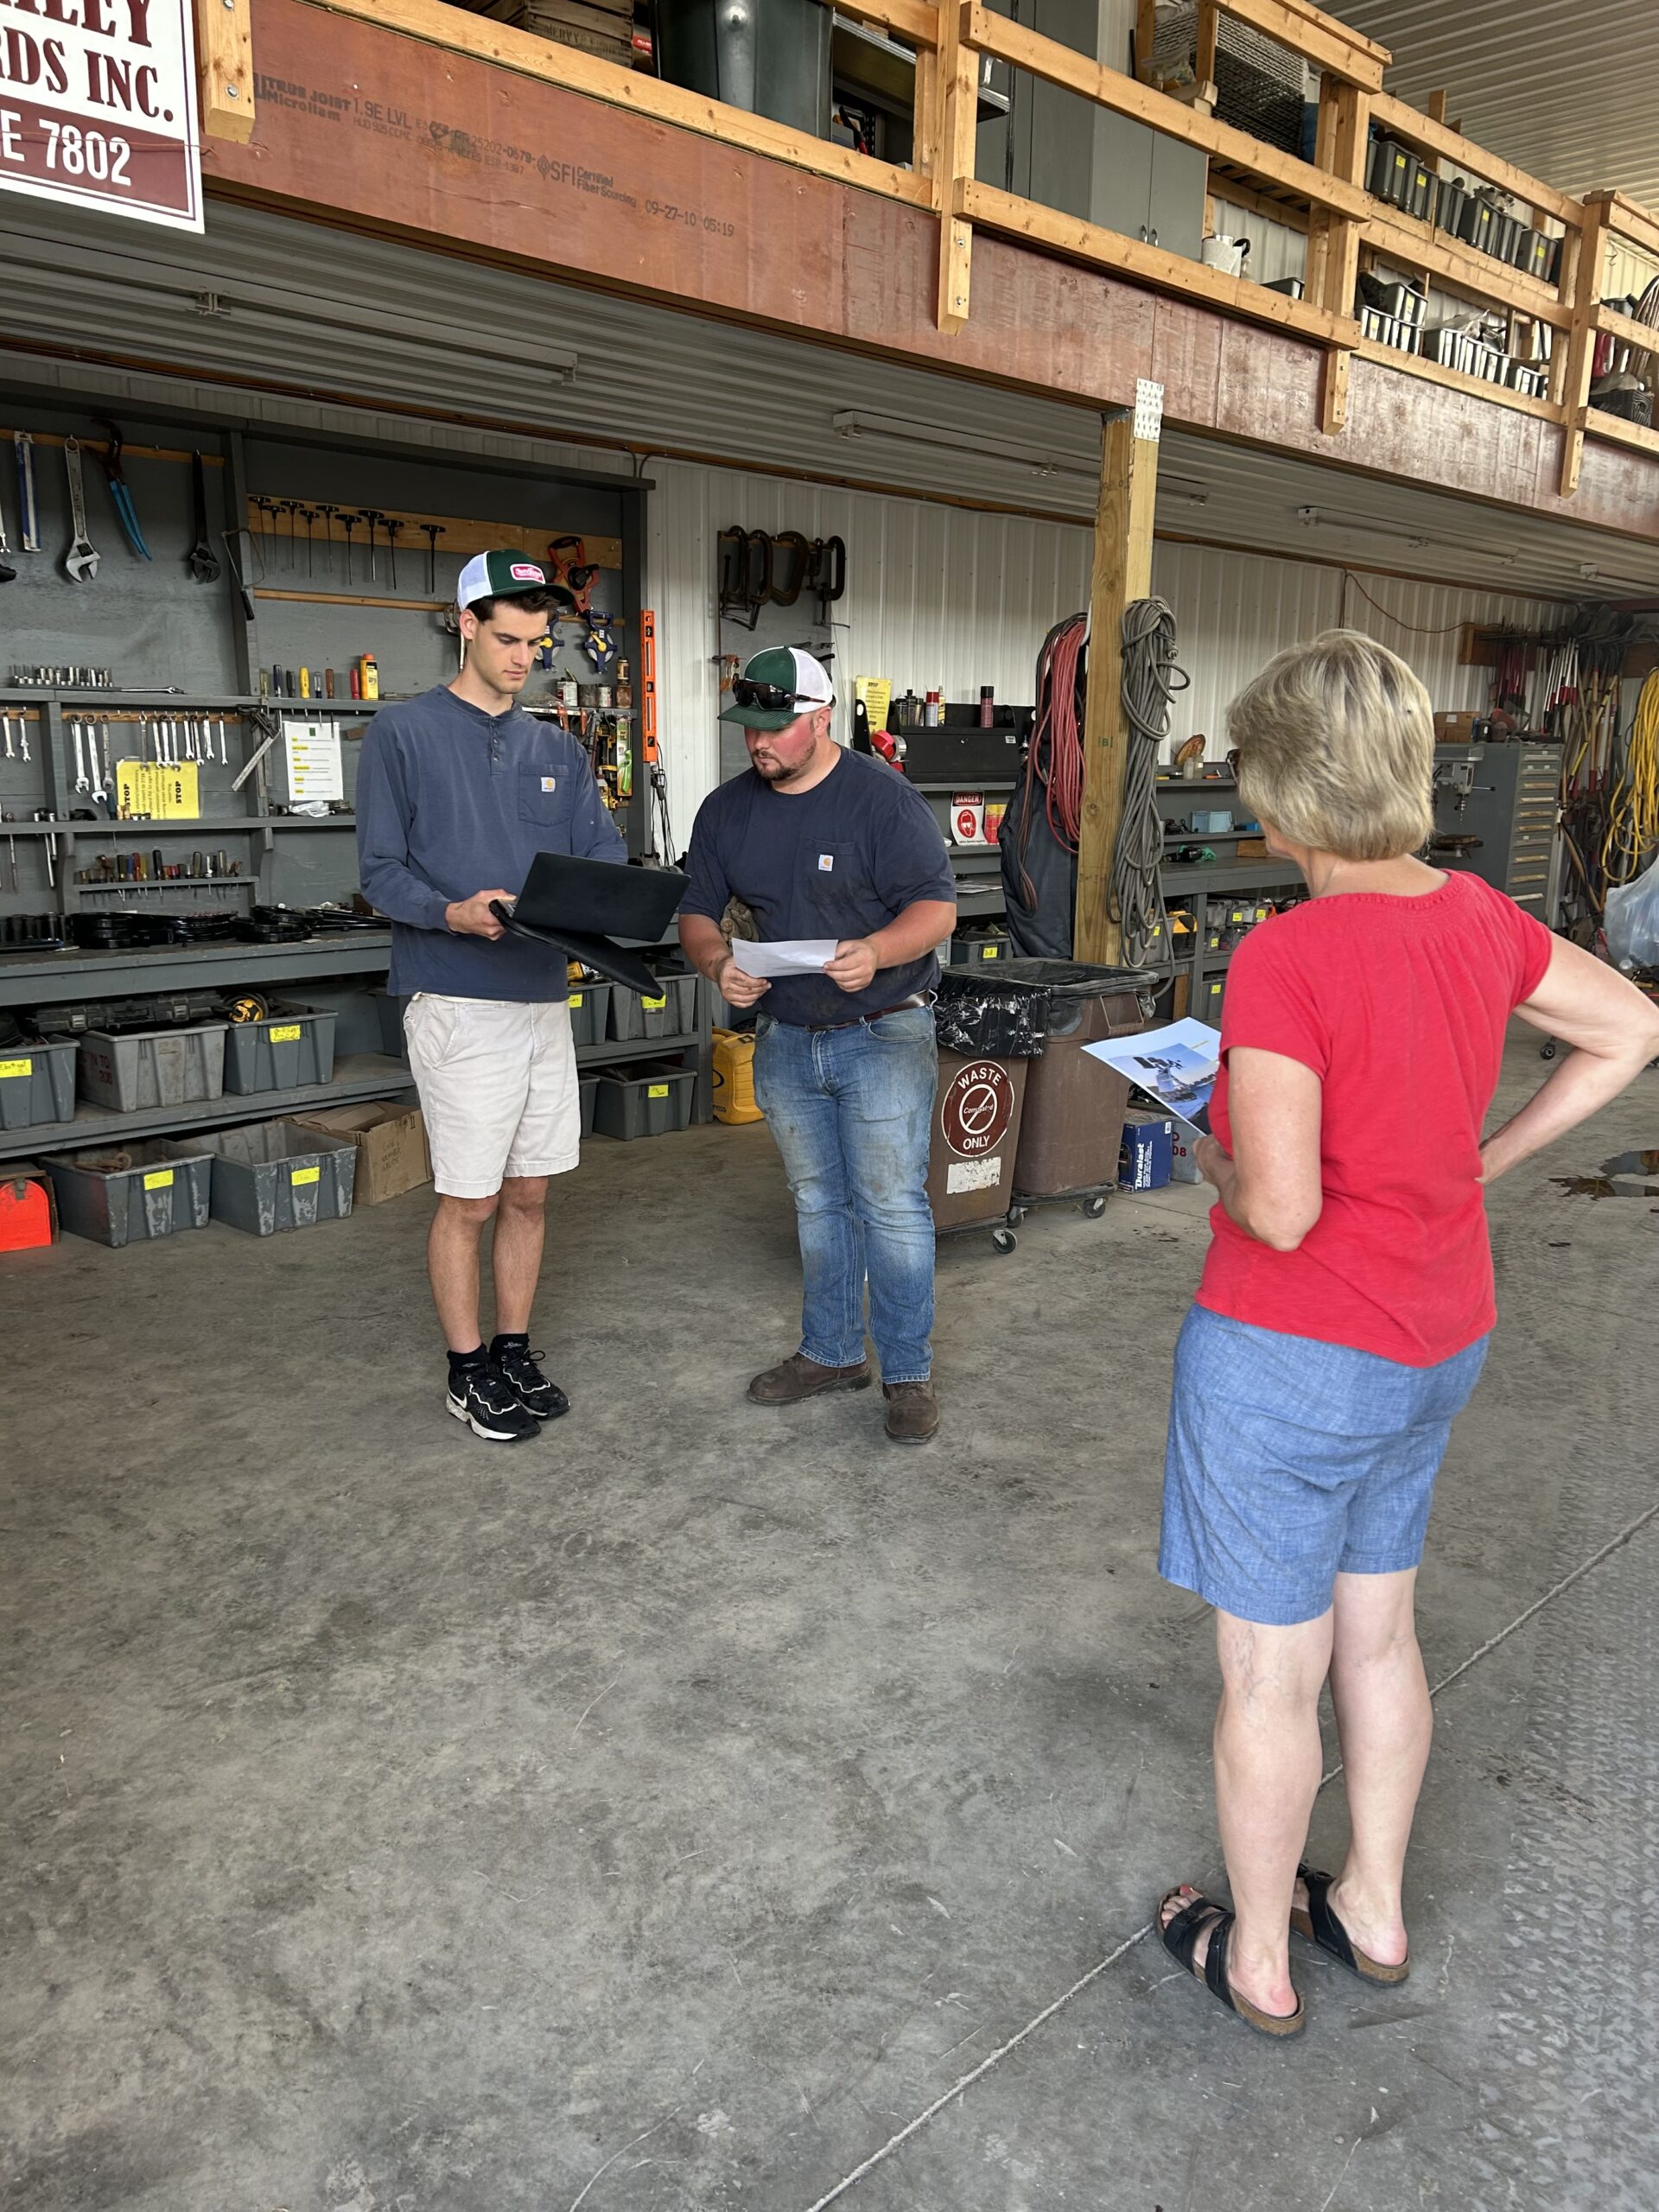
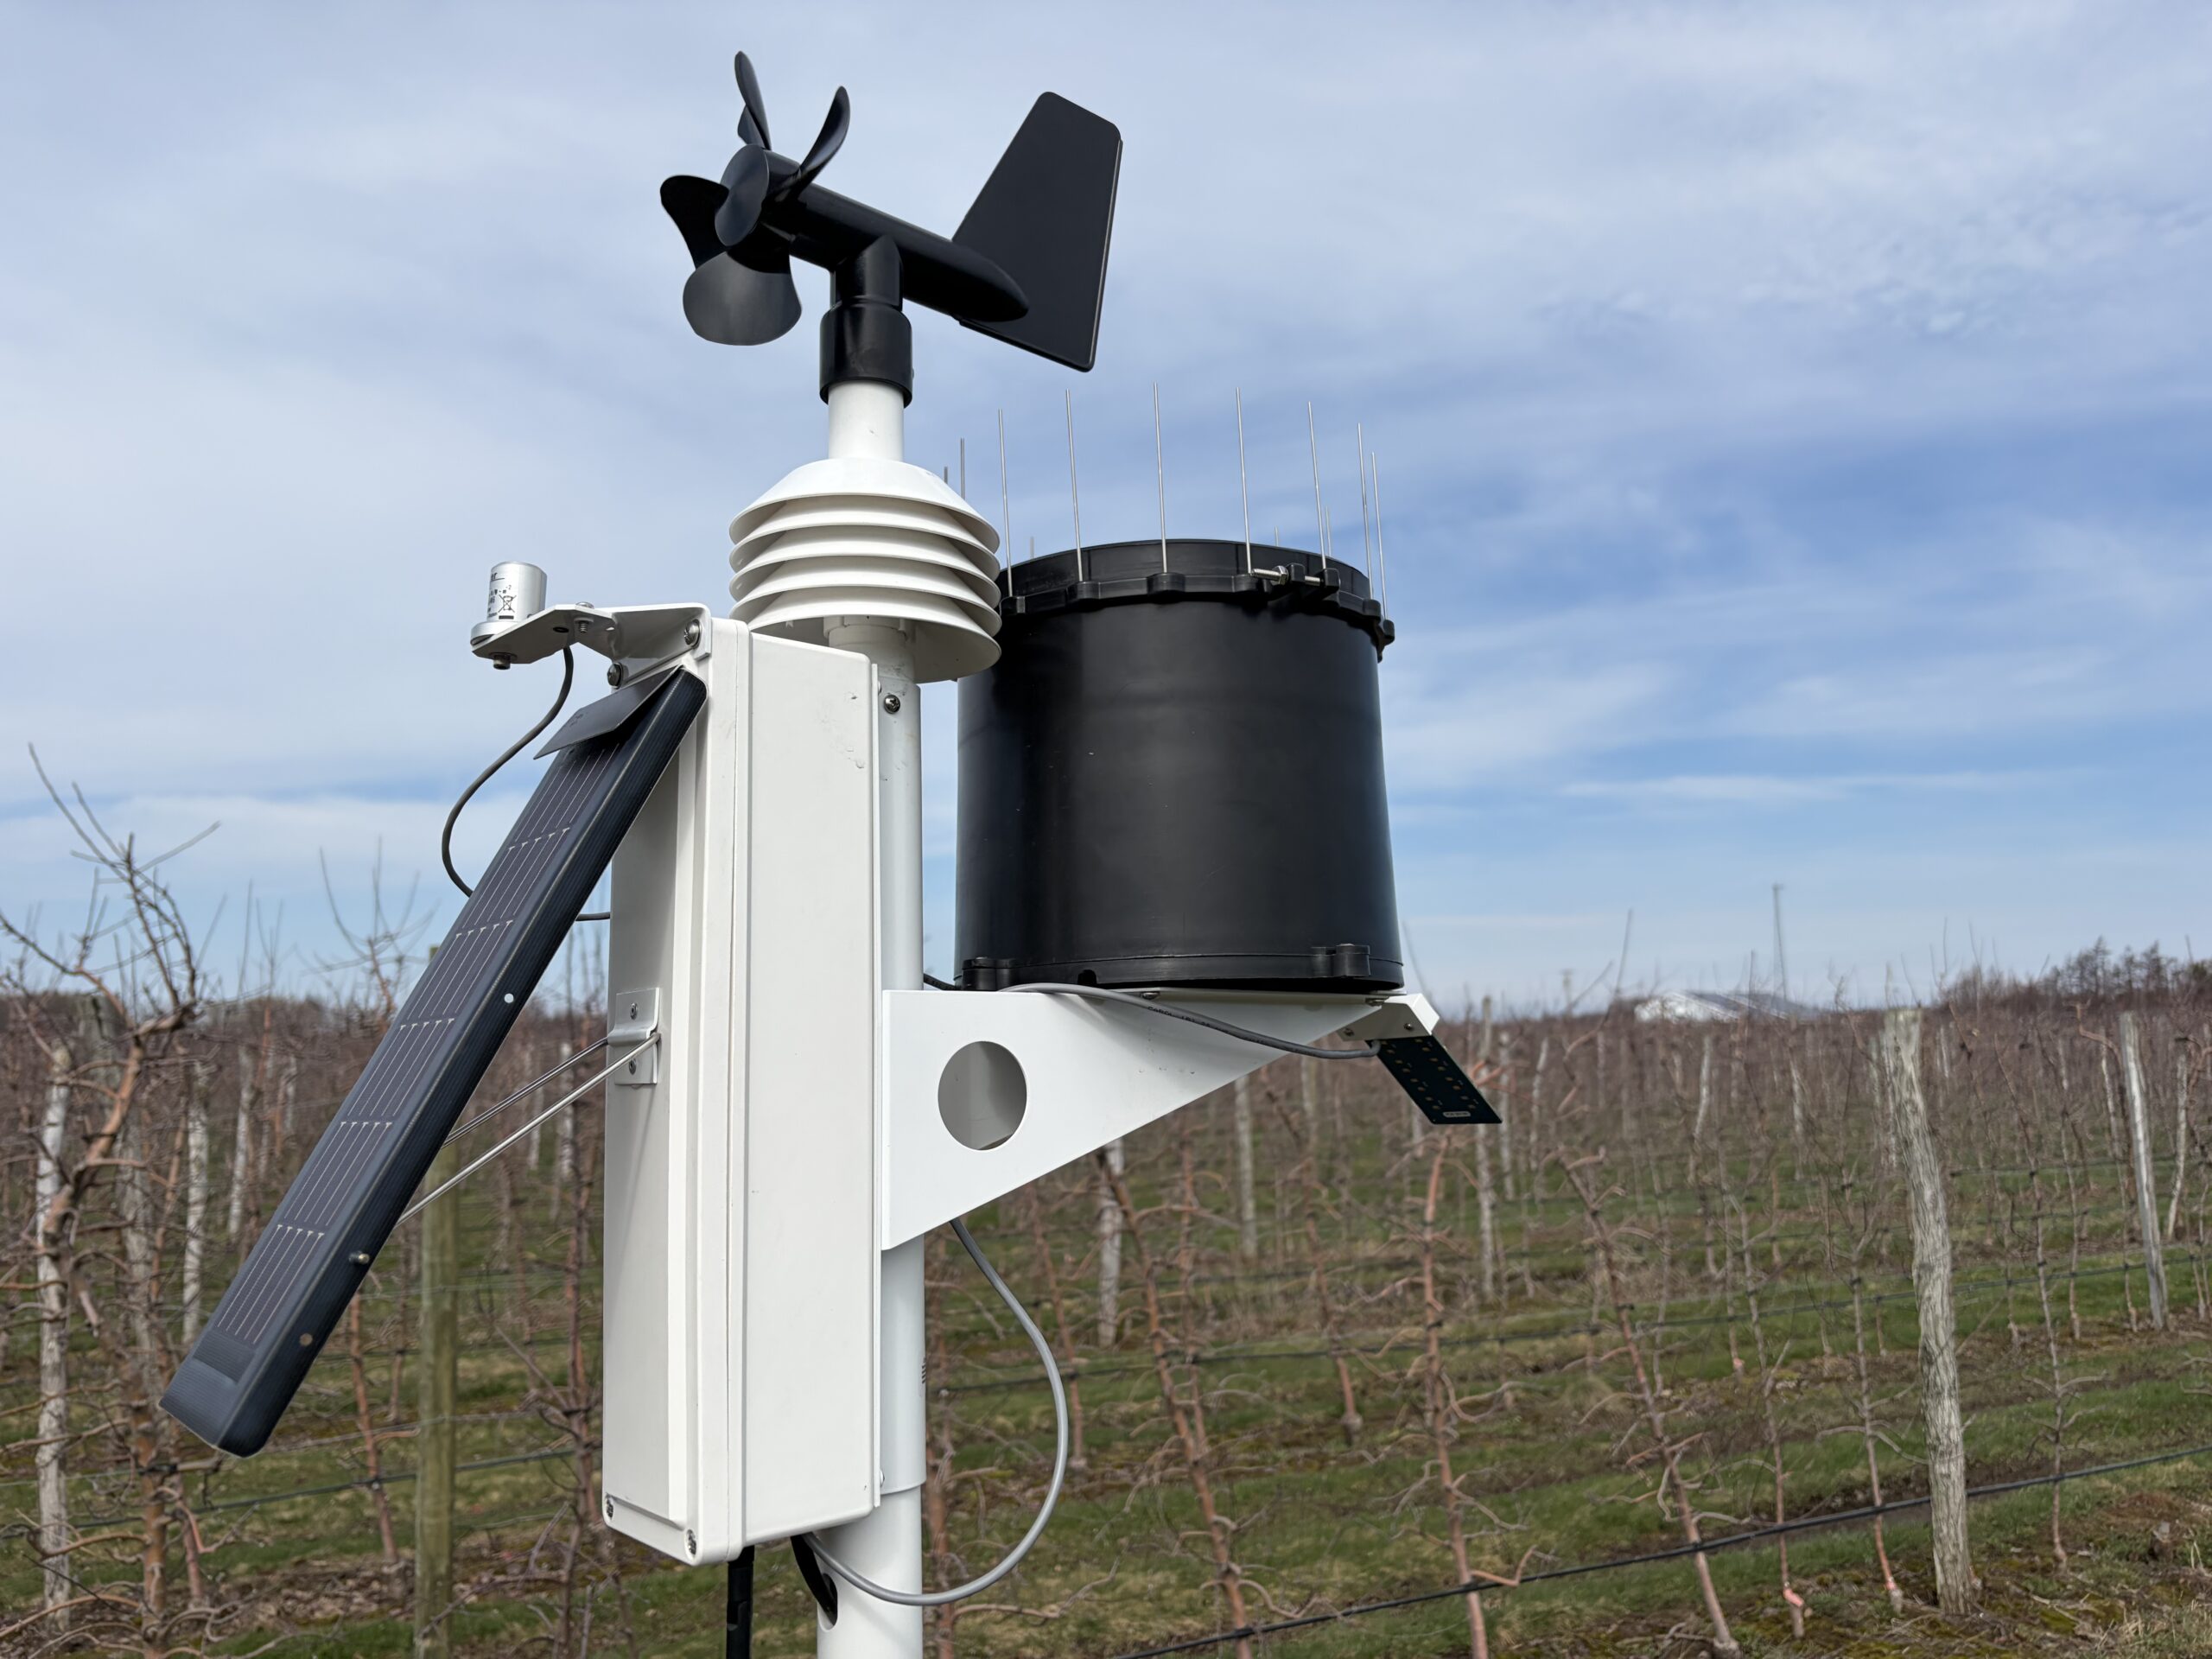
A viable LoRaWAN weather station alternative that researchers from Purdue have come up with in the past year is using a METER Group Atmos 41 Gen 2 weather station connected to a Dragino SDI-12 to LoRaWAN node. This results in a simple, minimalistic design with all weather features necessary.
5. Asset Tracking
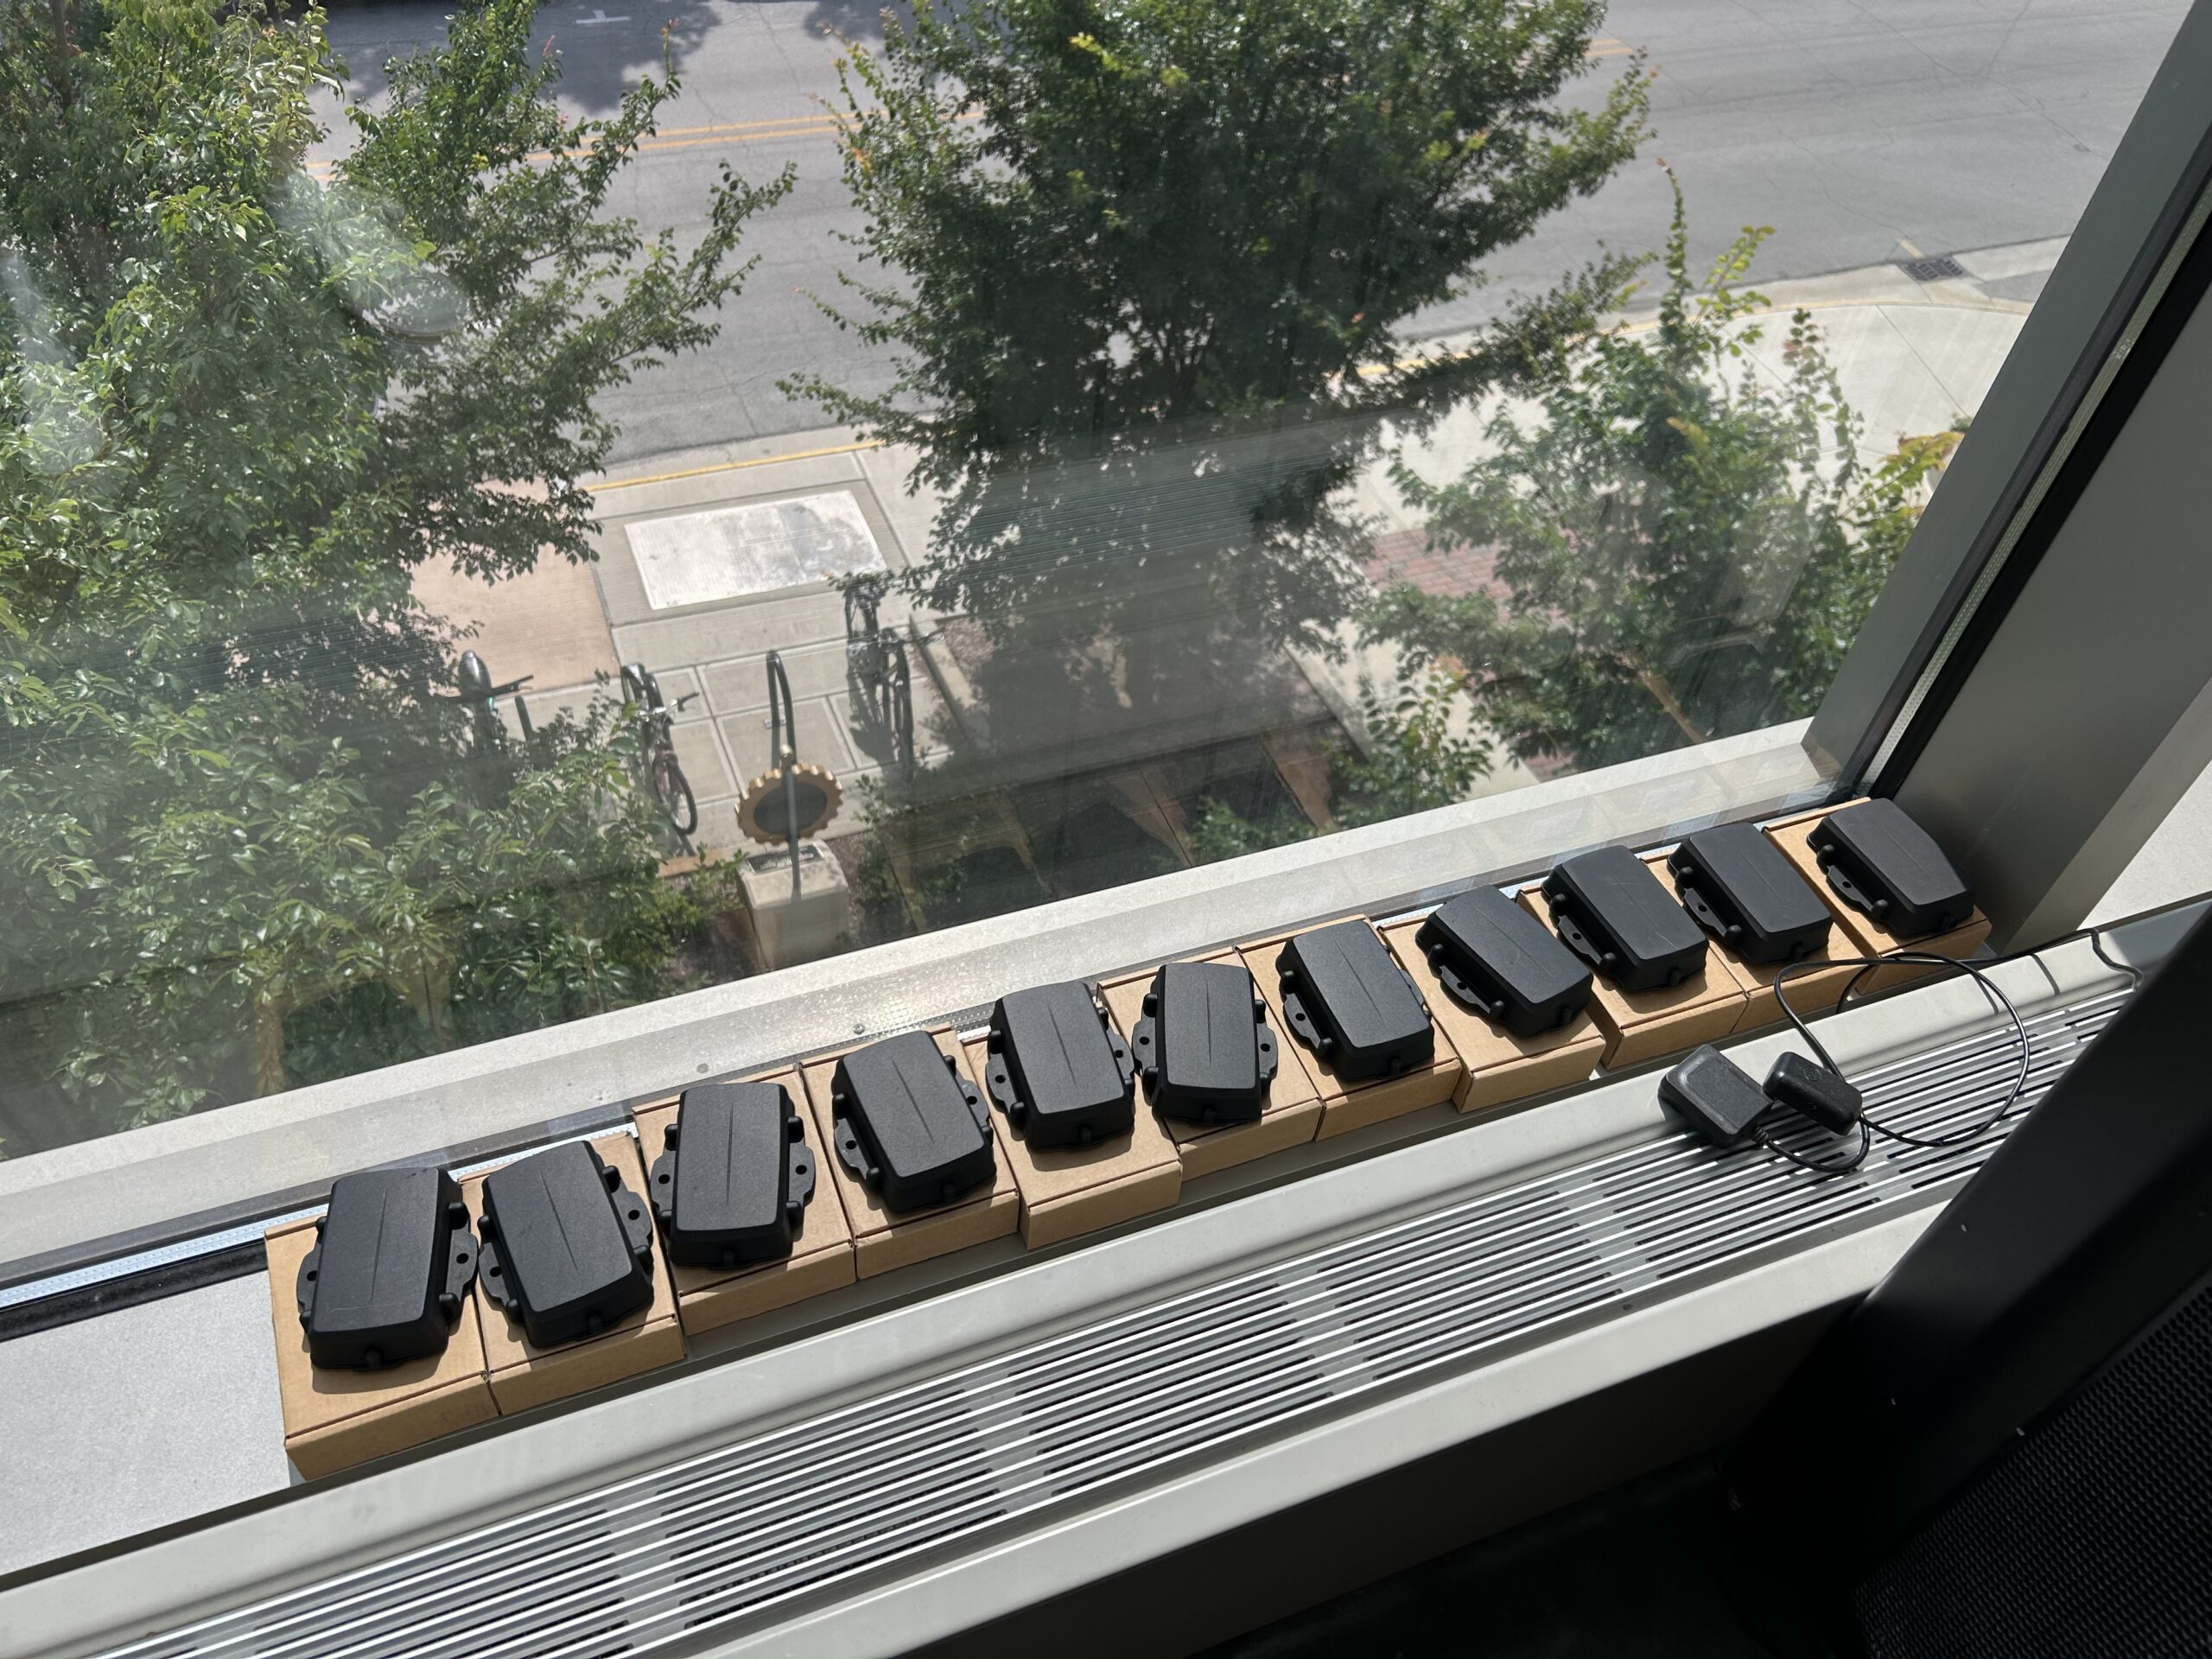
Starting at Purdue University in the summer of 2025, we tested 11 Digital Matter Oyster LoRaWAN GPS Trackers by connecting them to a gateway in a lab and walking outside the academic buildings to ensure data was being reported.
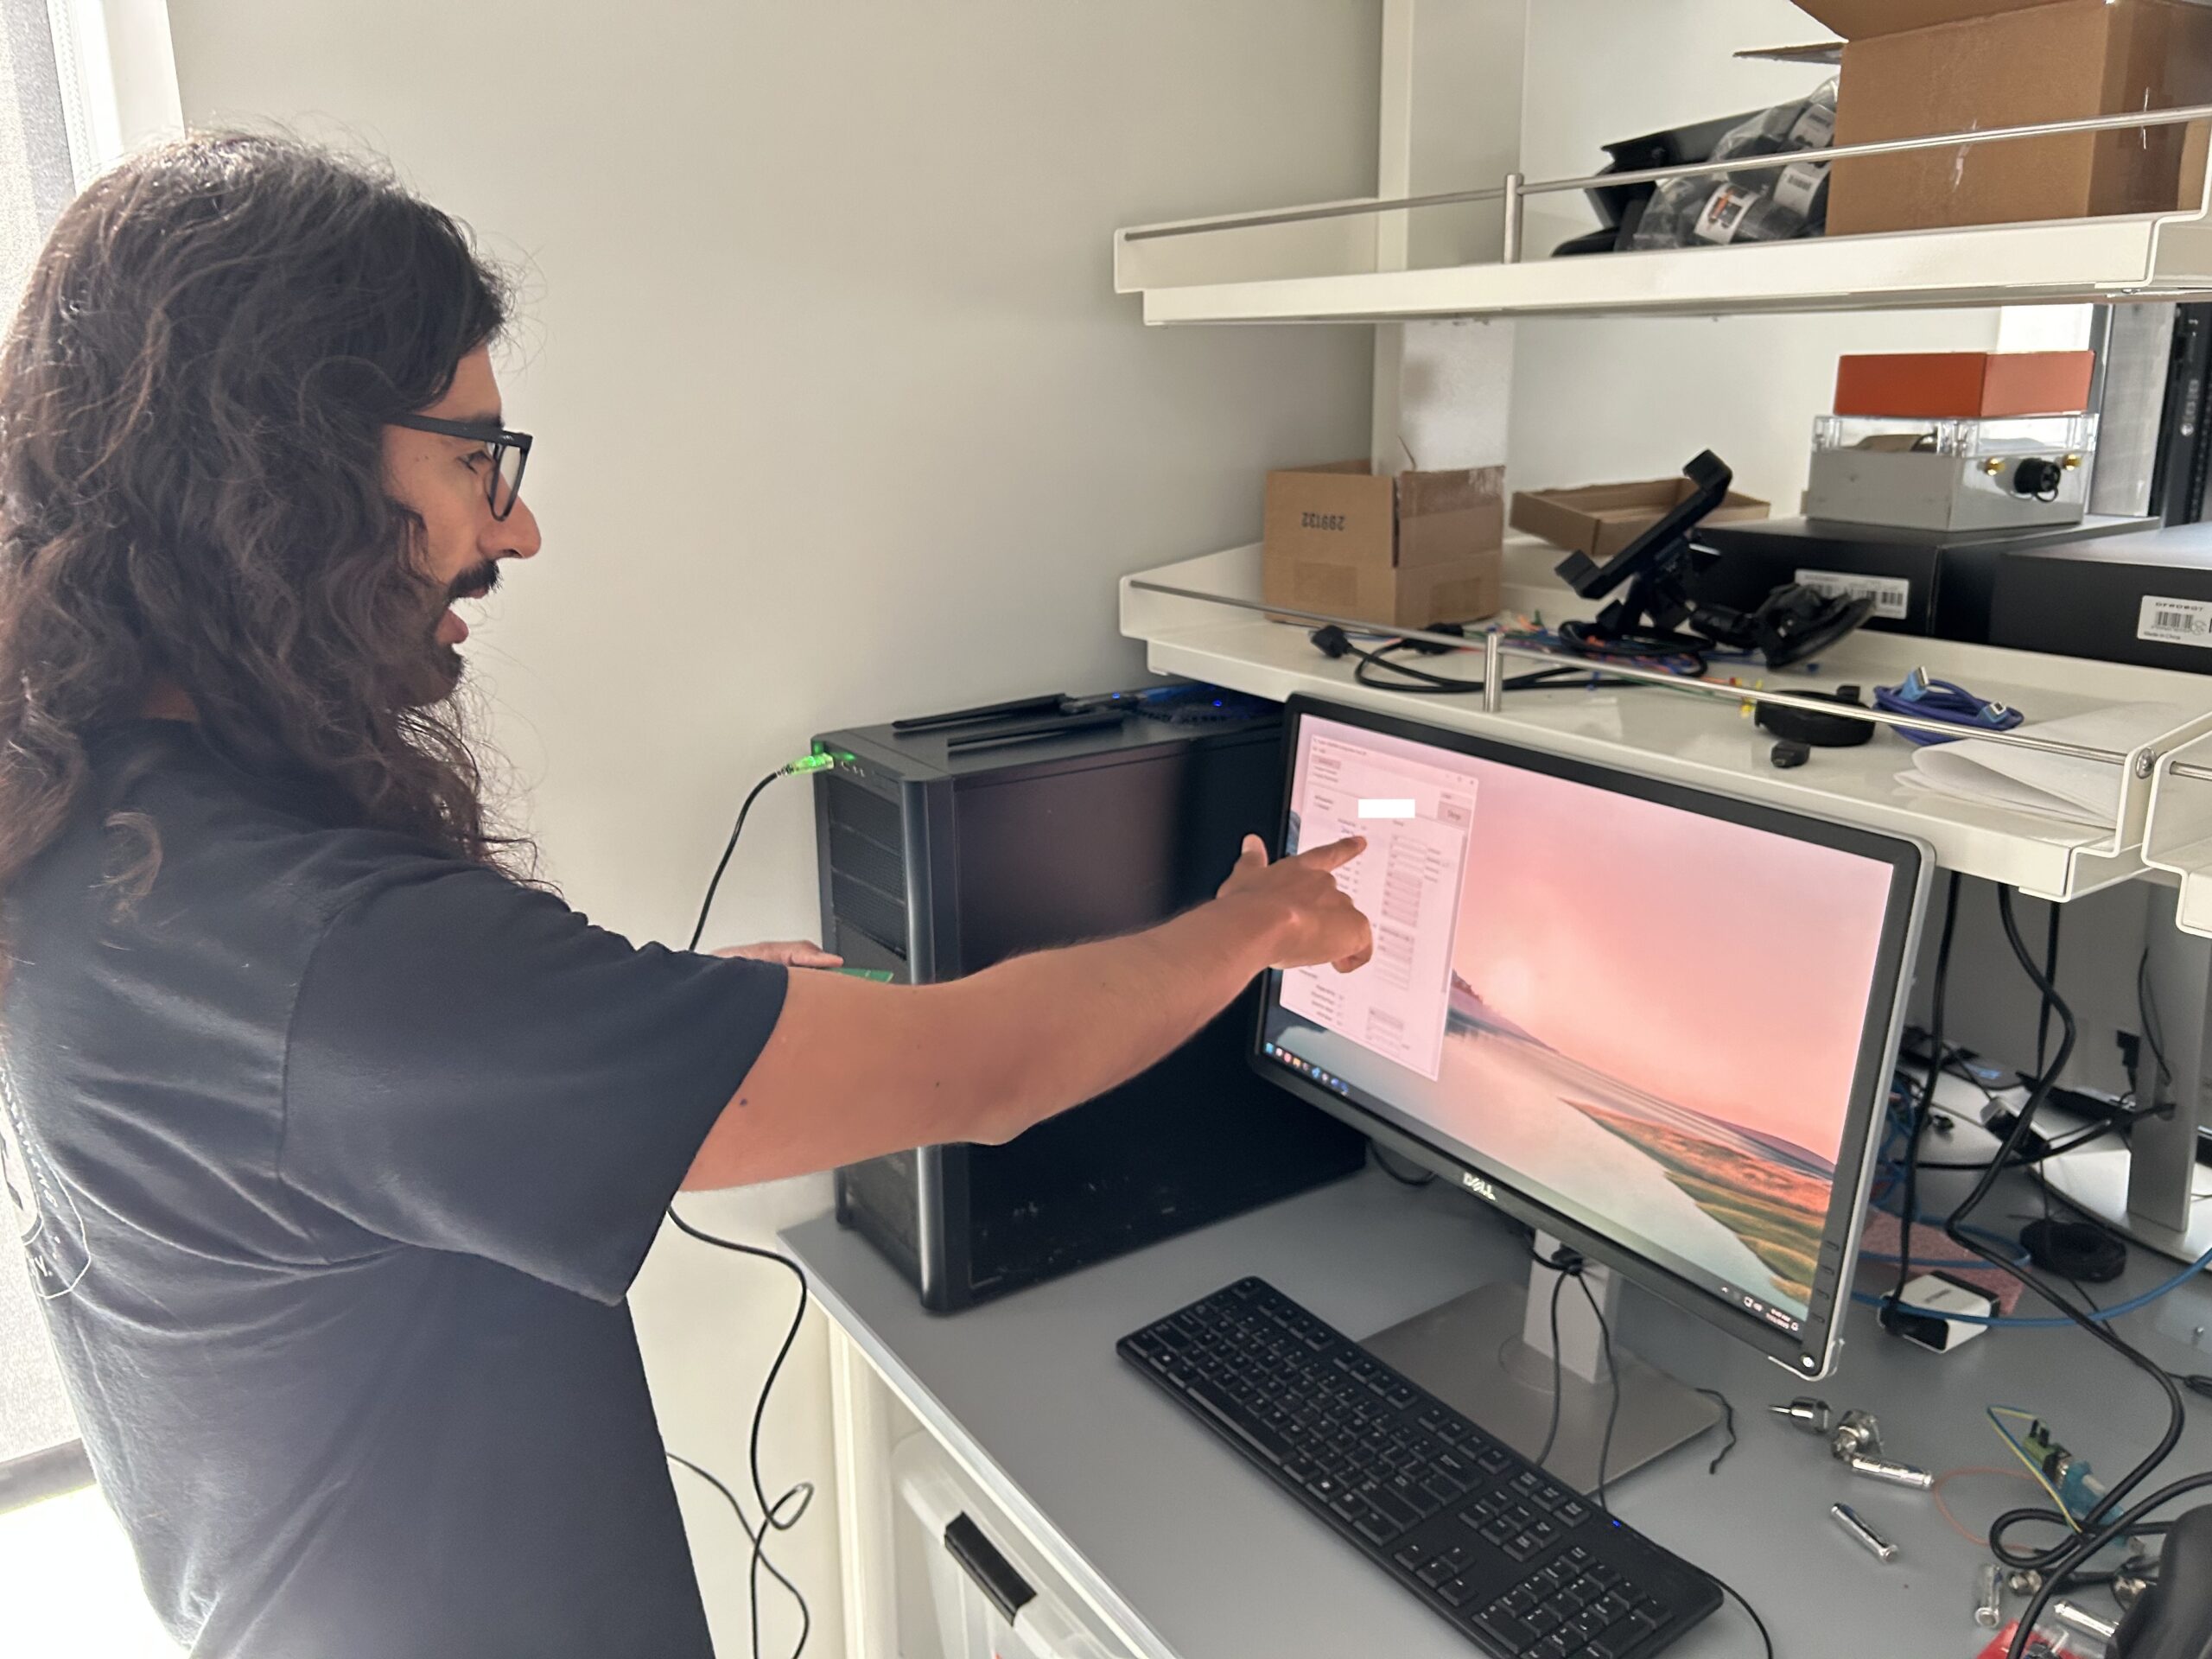
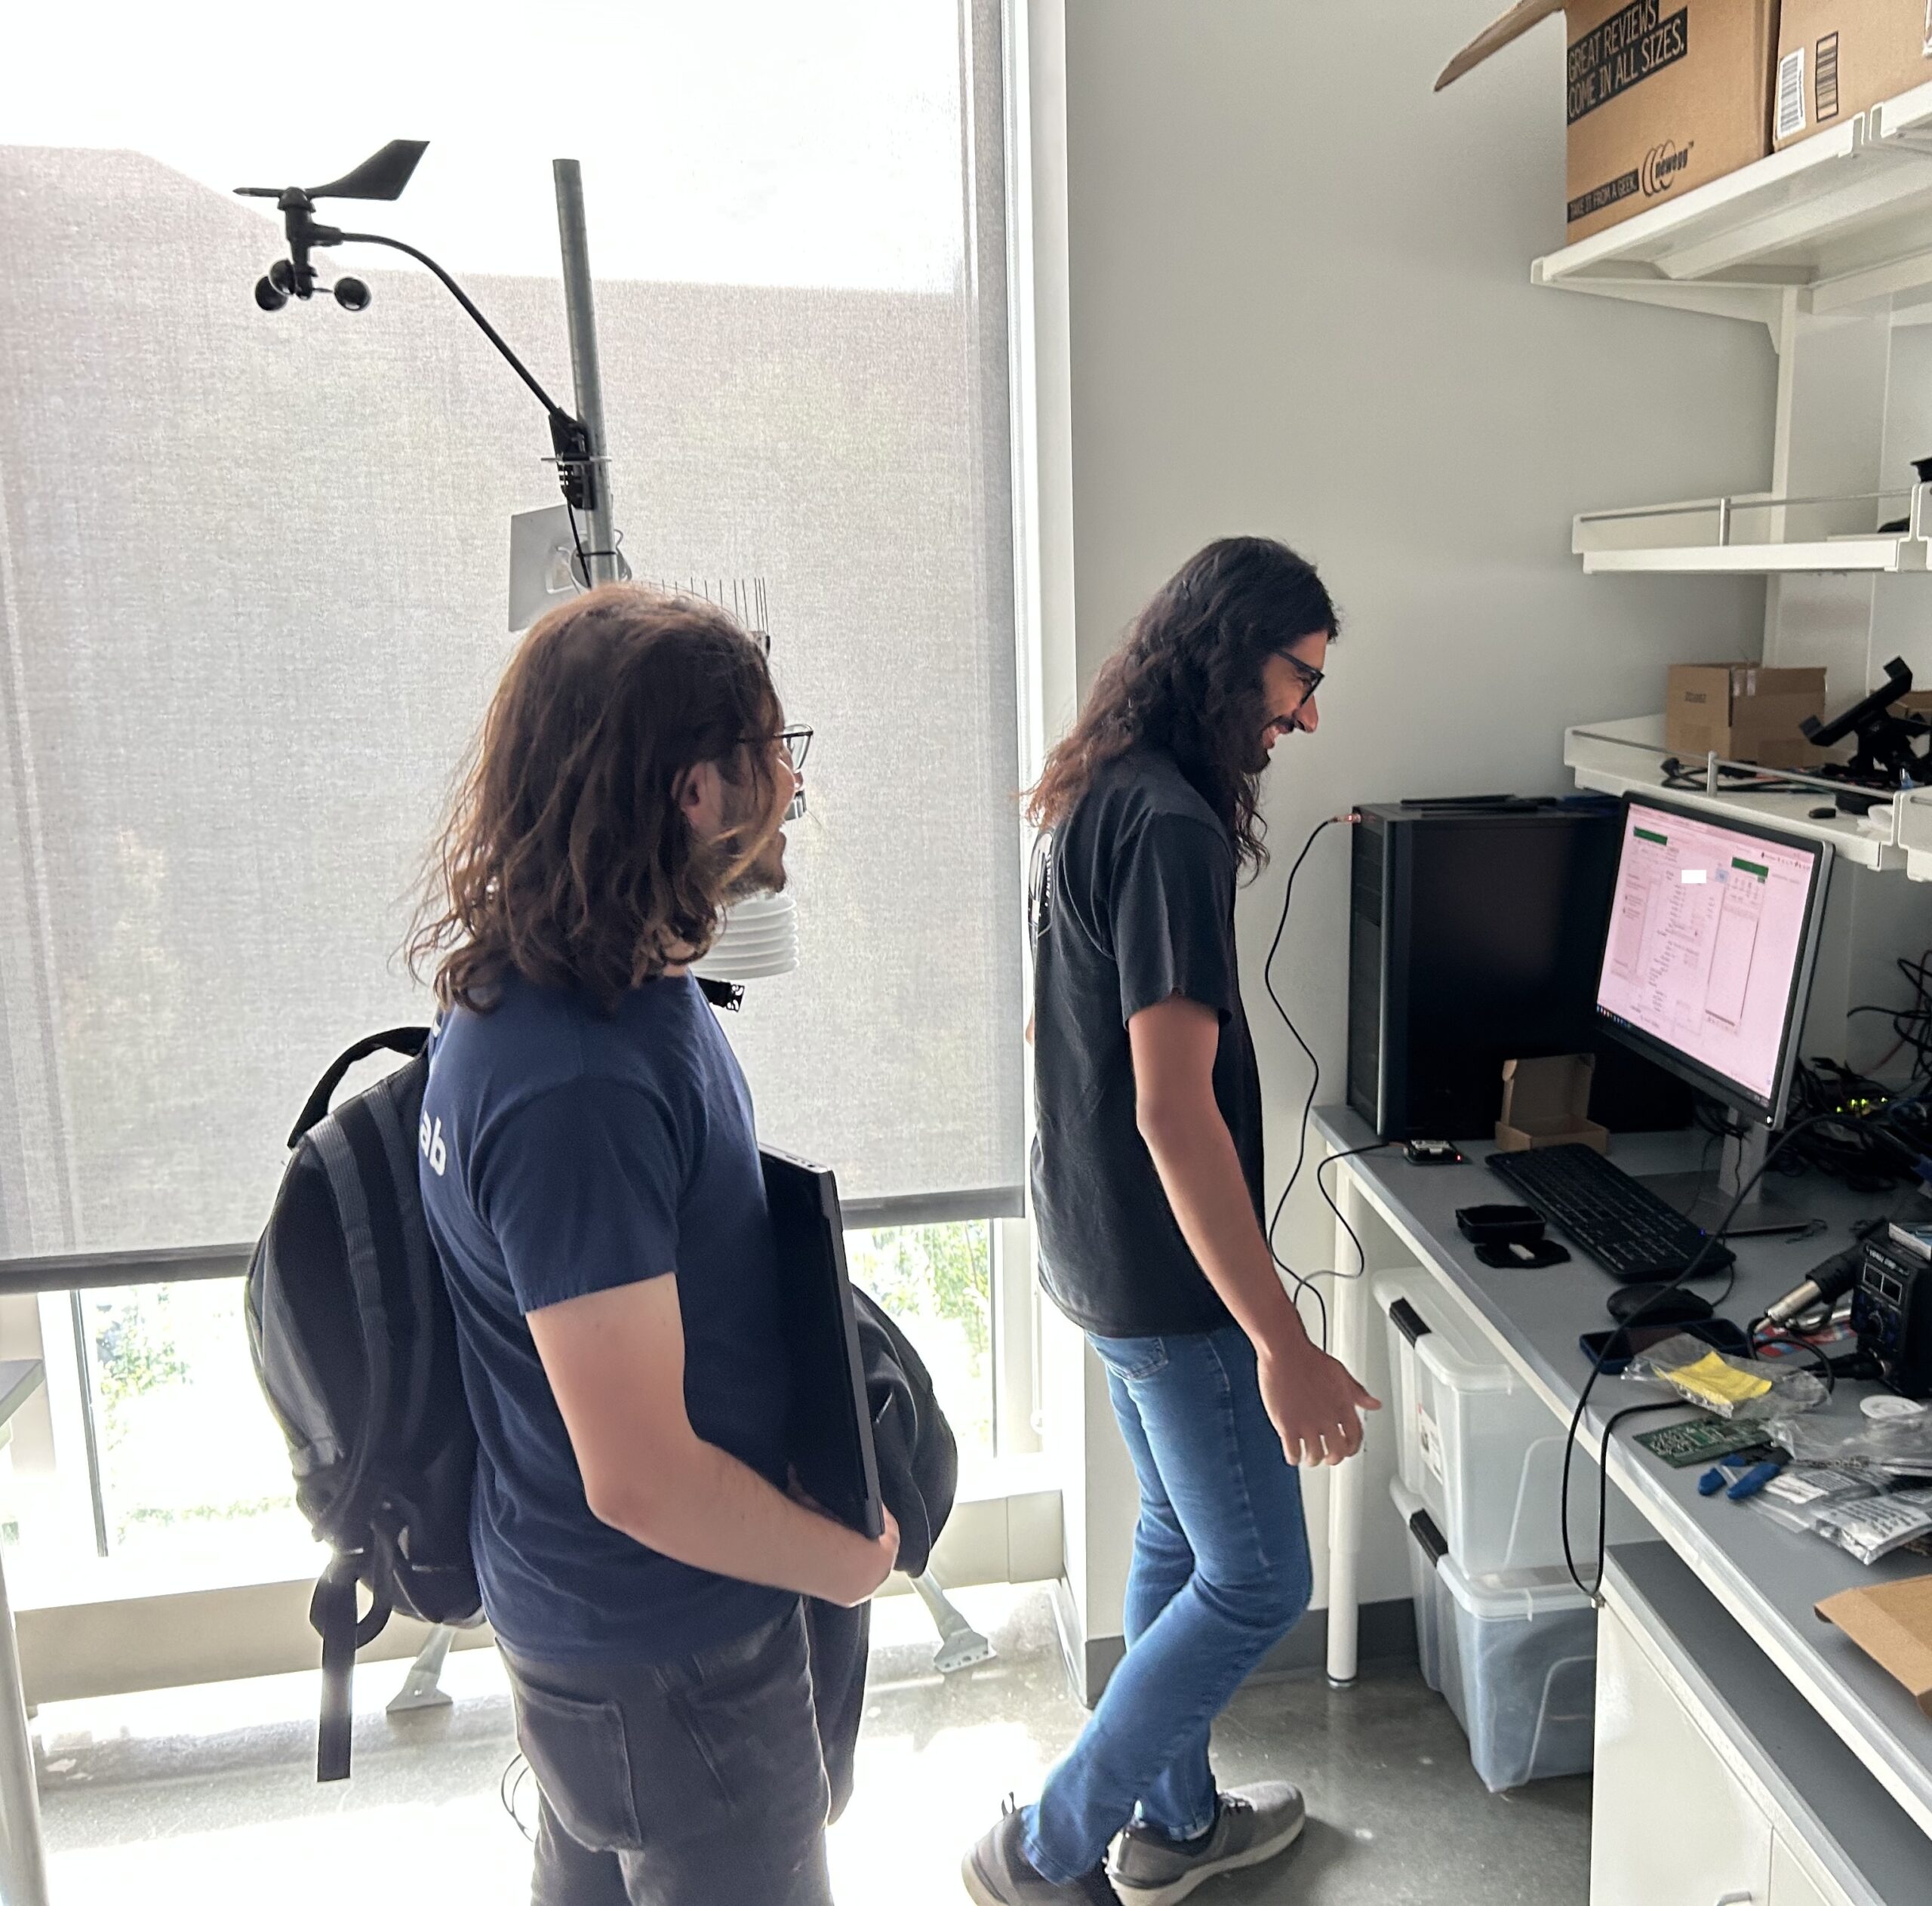
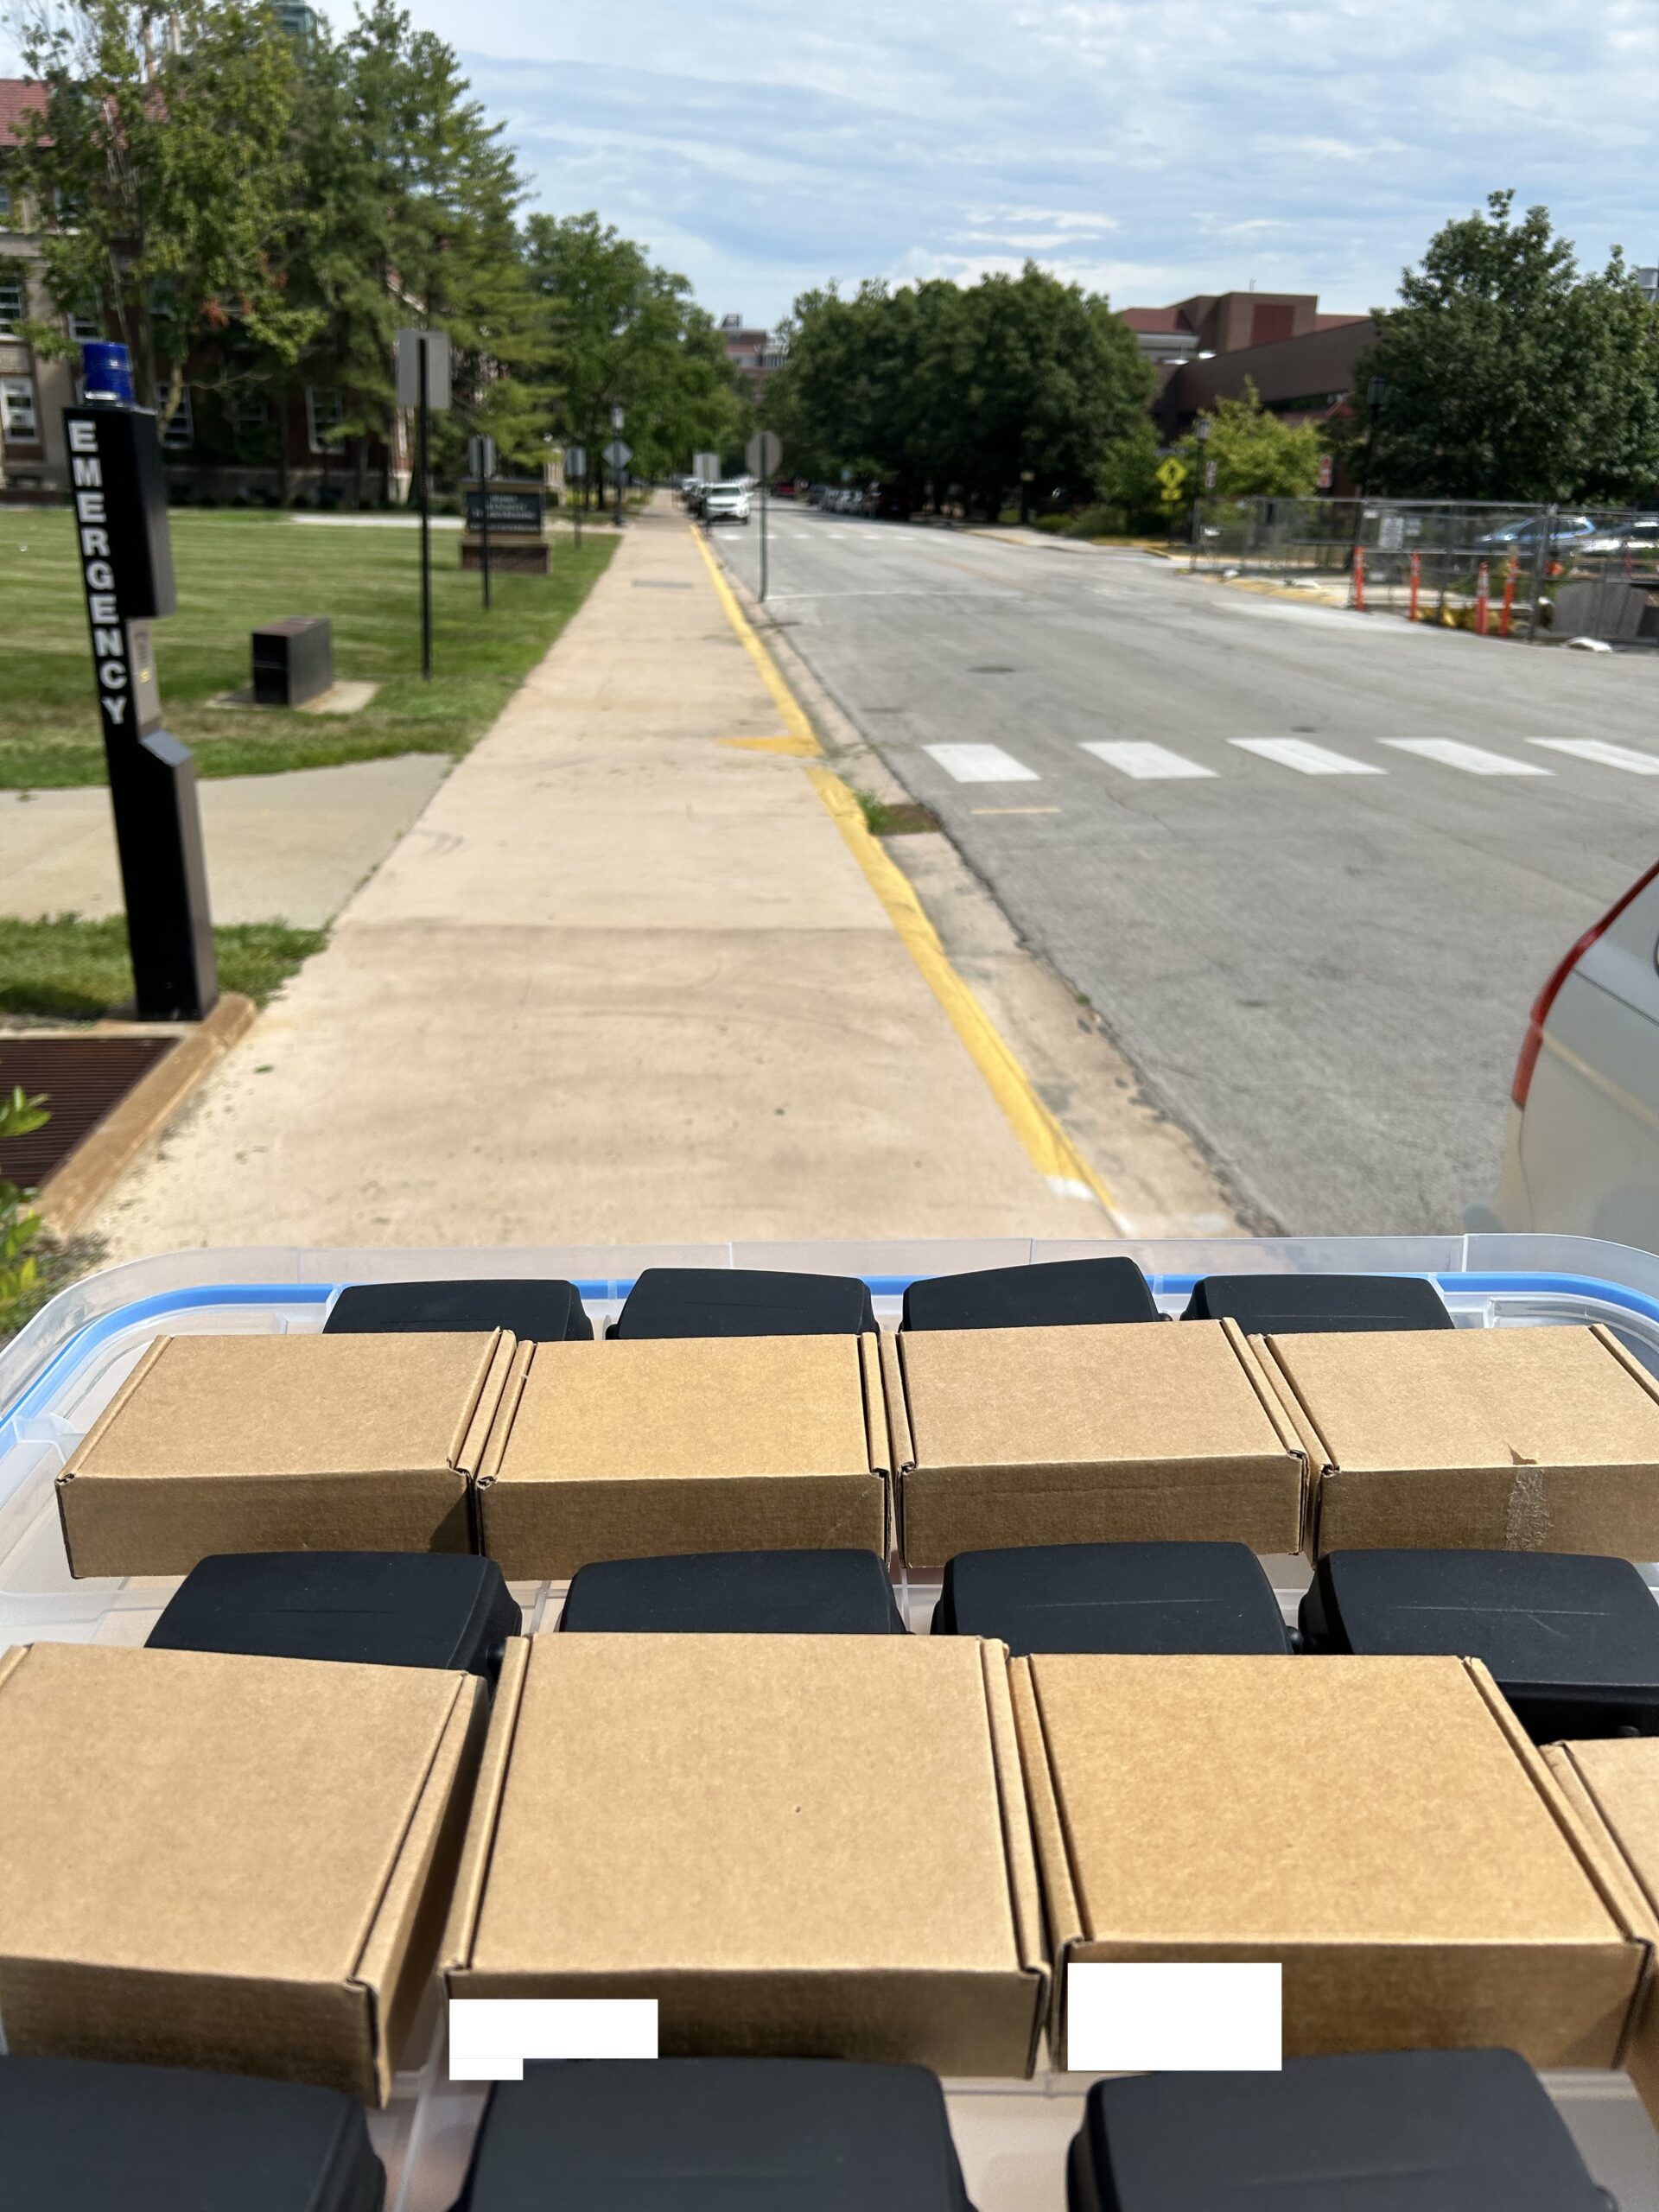
In early September 2025 at the beginning stages of harvest, we verified LoRaWAN coverage for one of the trackers from our gateway location to Lake Ontario while driving a tractor.
We then used Velcro tape to place 4 trackers on 4 harvest platforms to keep track of harvest progress. The platform locations were viewable on both the TagoIO mobile app and on laptops with the TagoIO online dashboard. The GPS trackers were used to view live locations of harvest platforms, check historical progress, and reference locations when driving out to harvest platforms to check on employees. The location accuracy was solid for these purposes but would not be something to use with precision implements.
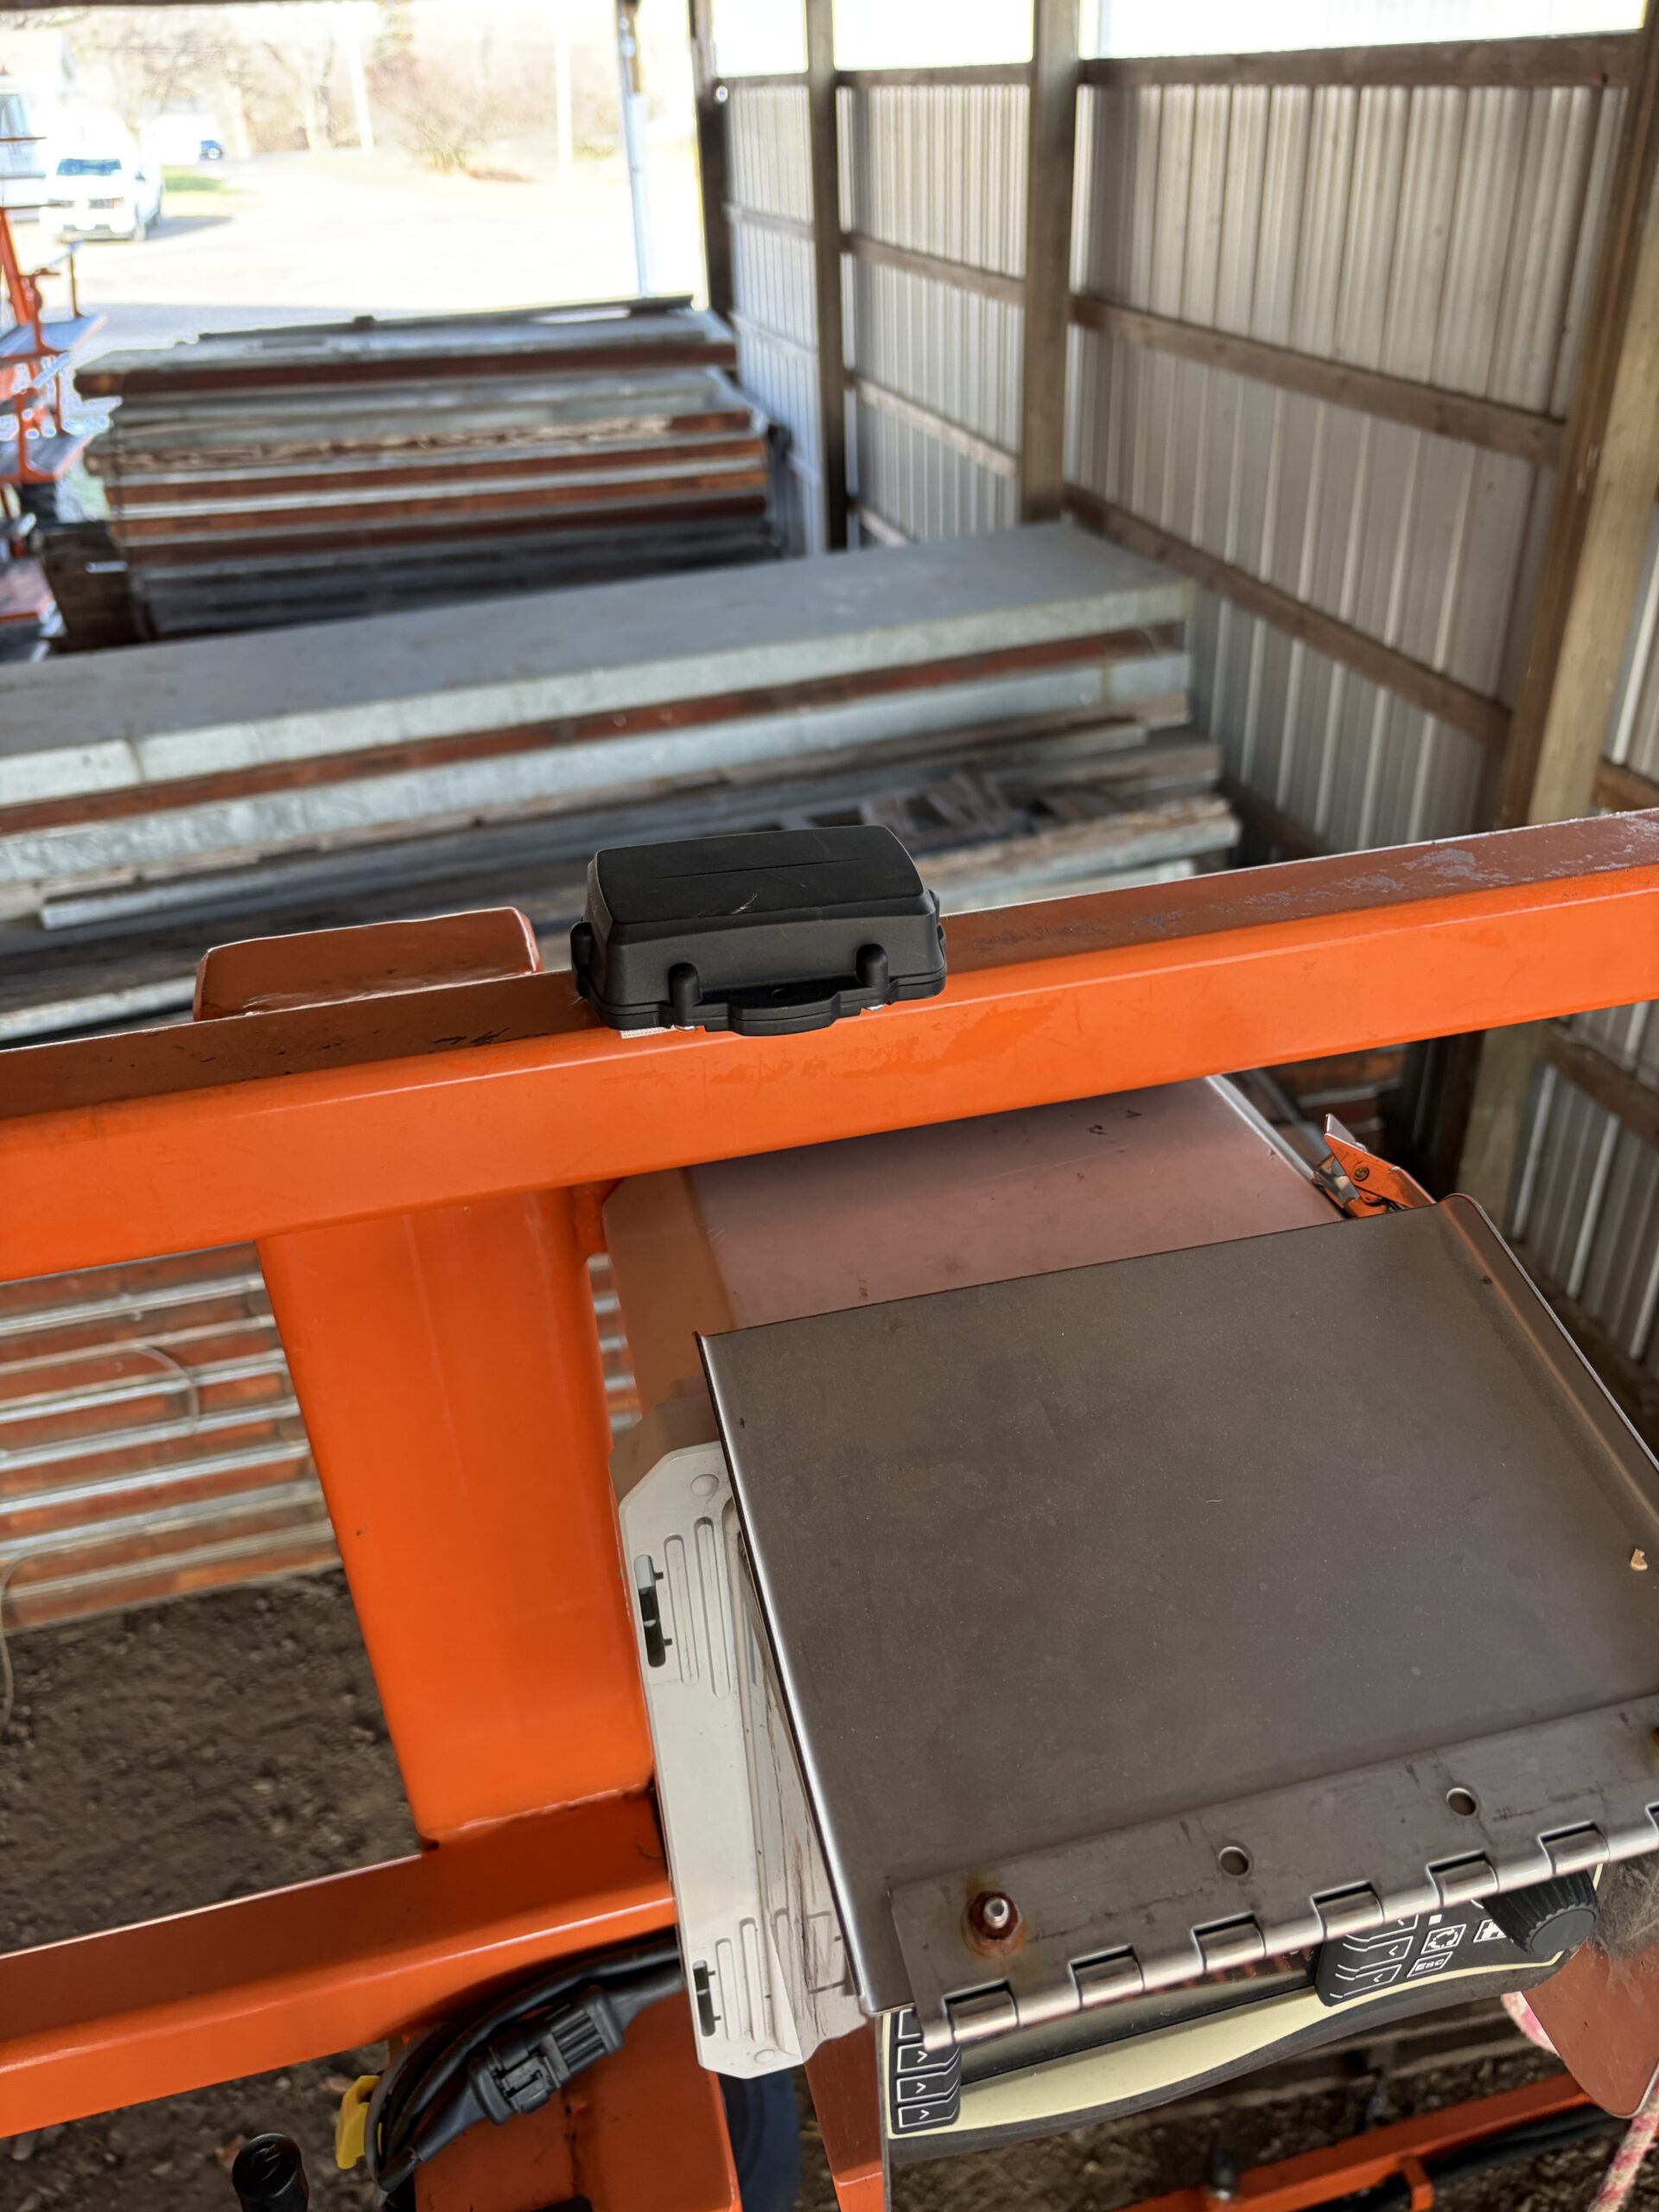
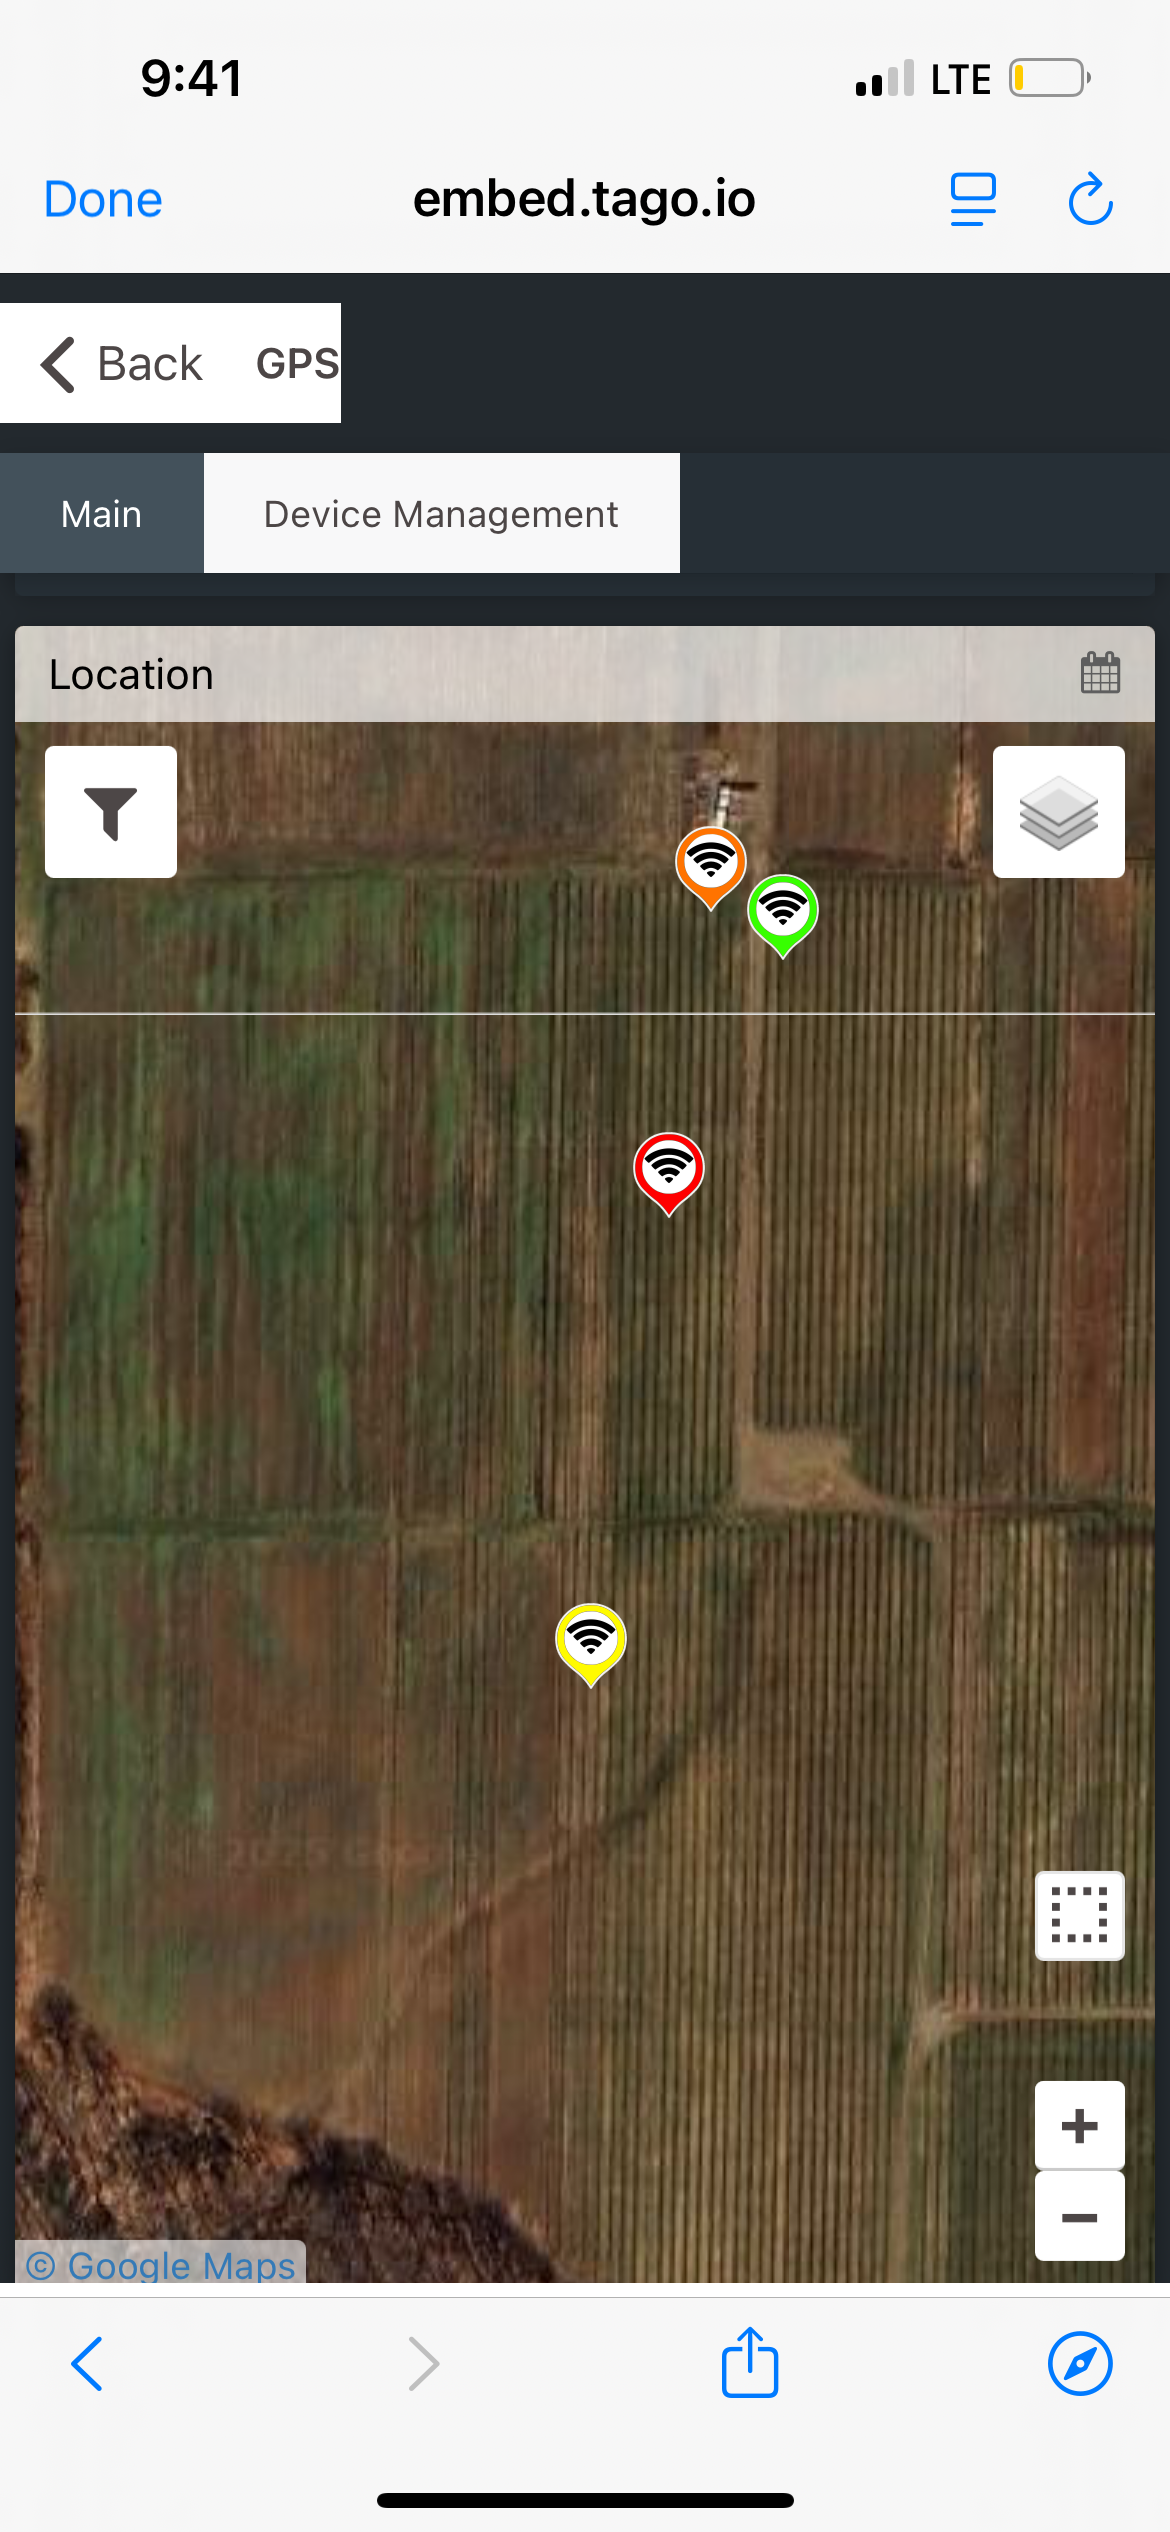
The devices worked well for about a week but then we noticed issues with the rate data was coming in. They’d been programmed to transmit data every 2-10 seconds but some were transmitting as little as once per hour, leading to inaccurate live locations. After discussing this with Purdue OATS Center researchers, it was determined the issue was likely due to battery limitations as the devices only use 3 AA batteries for power and the high data rate of 2-10 seconds was probably draining it too fast. We looked into other Digital Matter products but unfortunately the wired options that could be connected to equipment batteries or fuse boxes aren’t FCC compliant in the U.S. and therefore unavailable. We explored other vendor options as well such as those offered by Tektellic, but they don’t provide the level of positioning accuracy to see machinery locations within specific tree rows and are more used for transportation and logistics purposes. Therefore, we tried to reconfigure the devices for 5–10-minute transmissions instead. This in theory gives us a better balance with battery power and would reduce the number of times the batteries need to be swapped out, however we realized it won’t give us the same level of data that we’d hoped for in terms of closer live locations and speed tracking. Based on these experiences, we recommend battery-powered LoRaWAN GPS trackers for slower moving applications that might require transmissions only 1 time per hour or 1 time per day.
6. Fuel Tank Monitoring
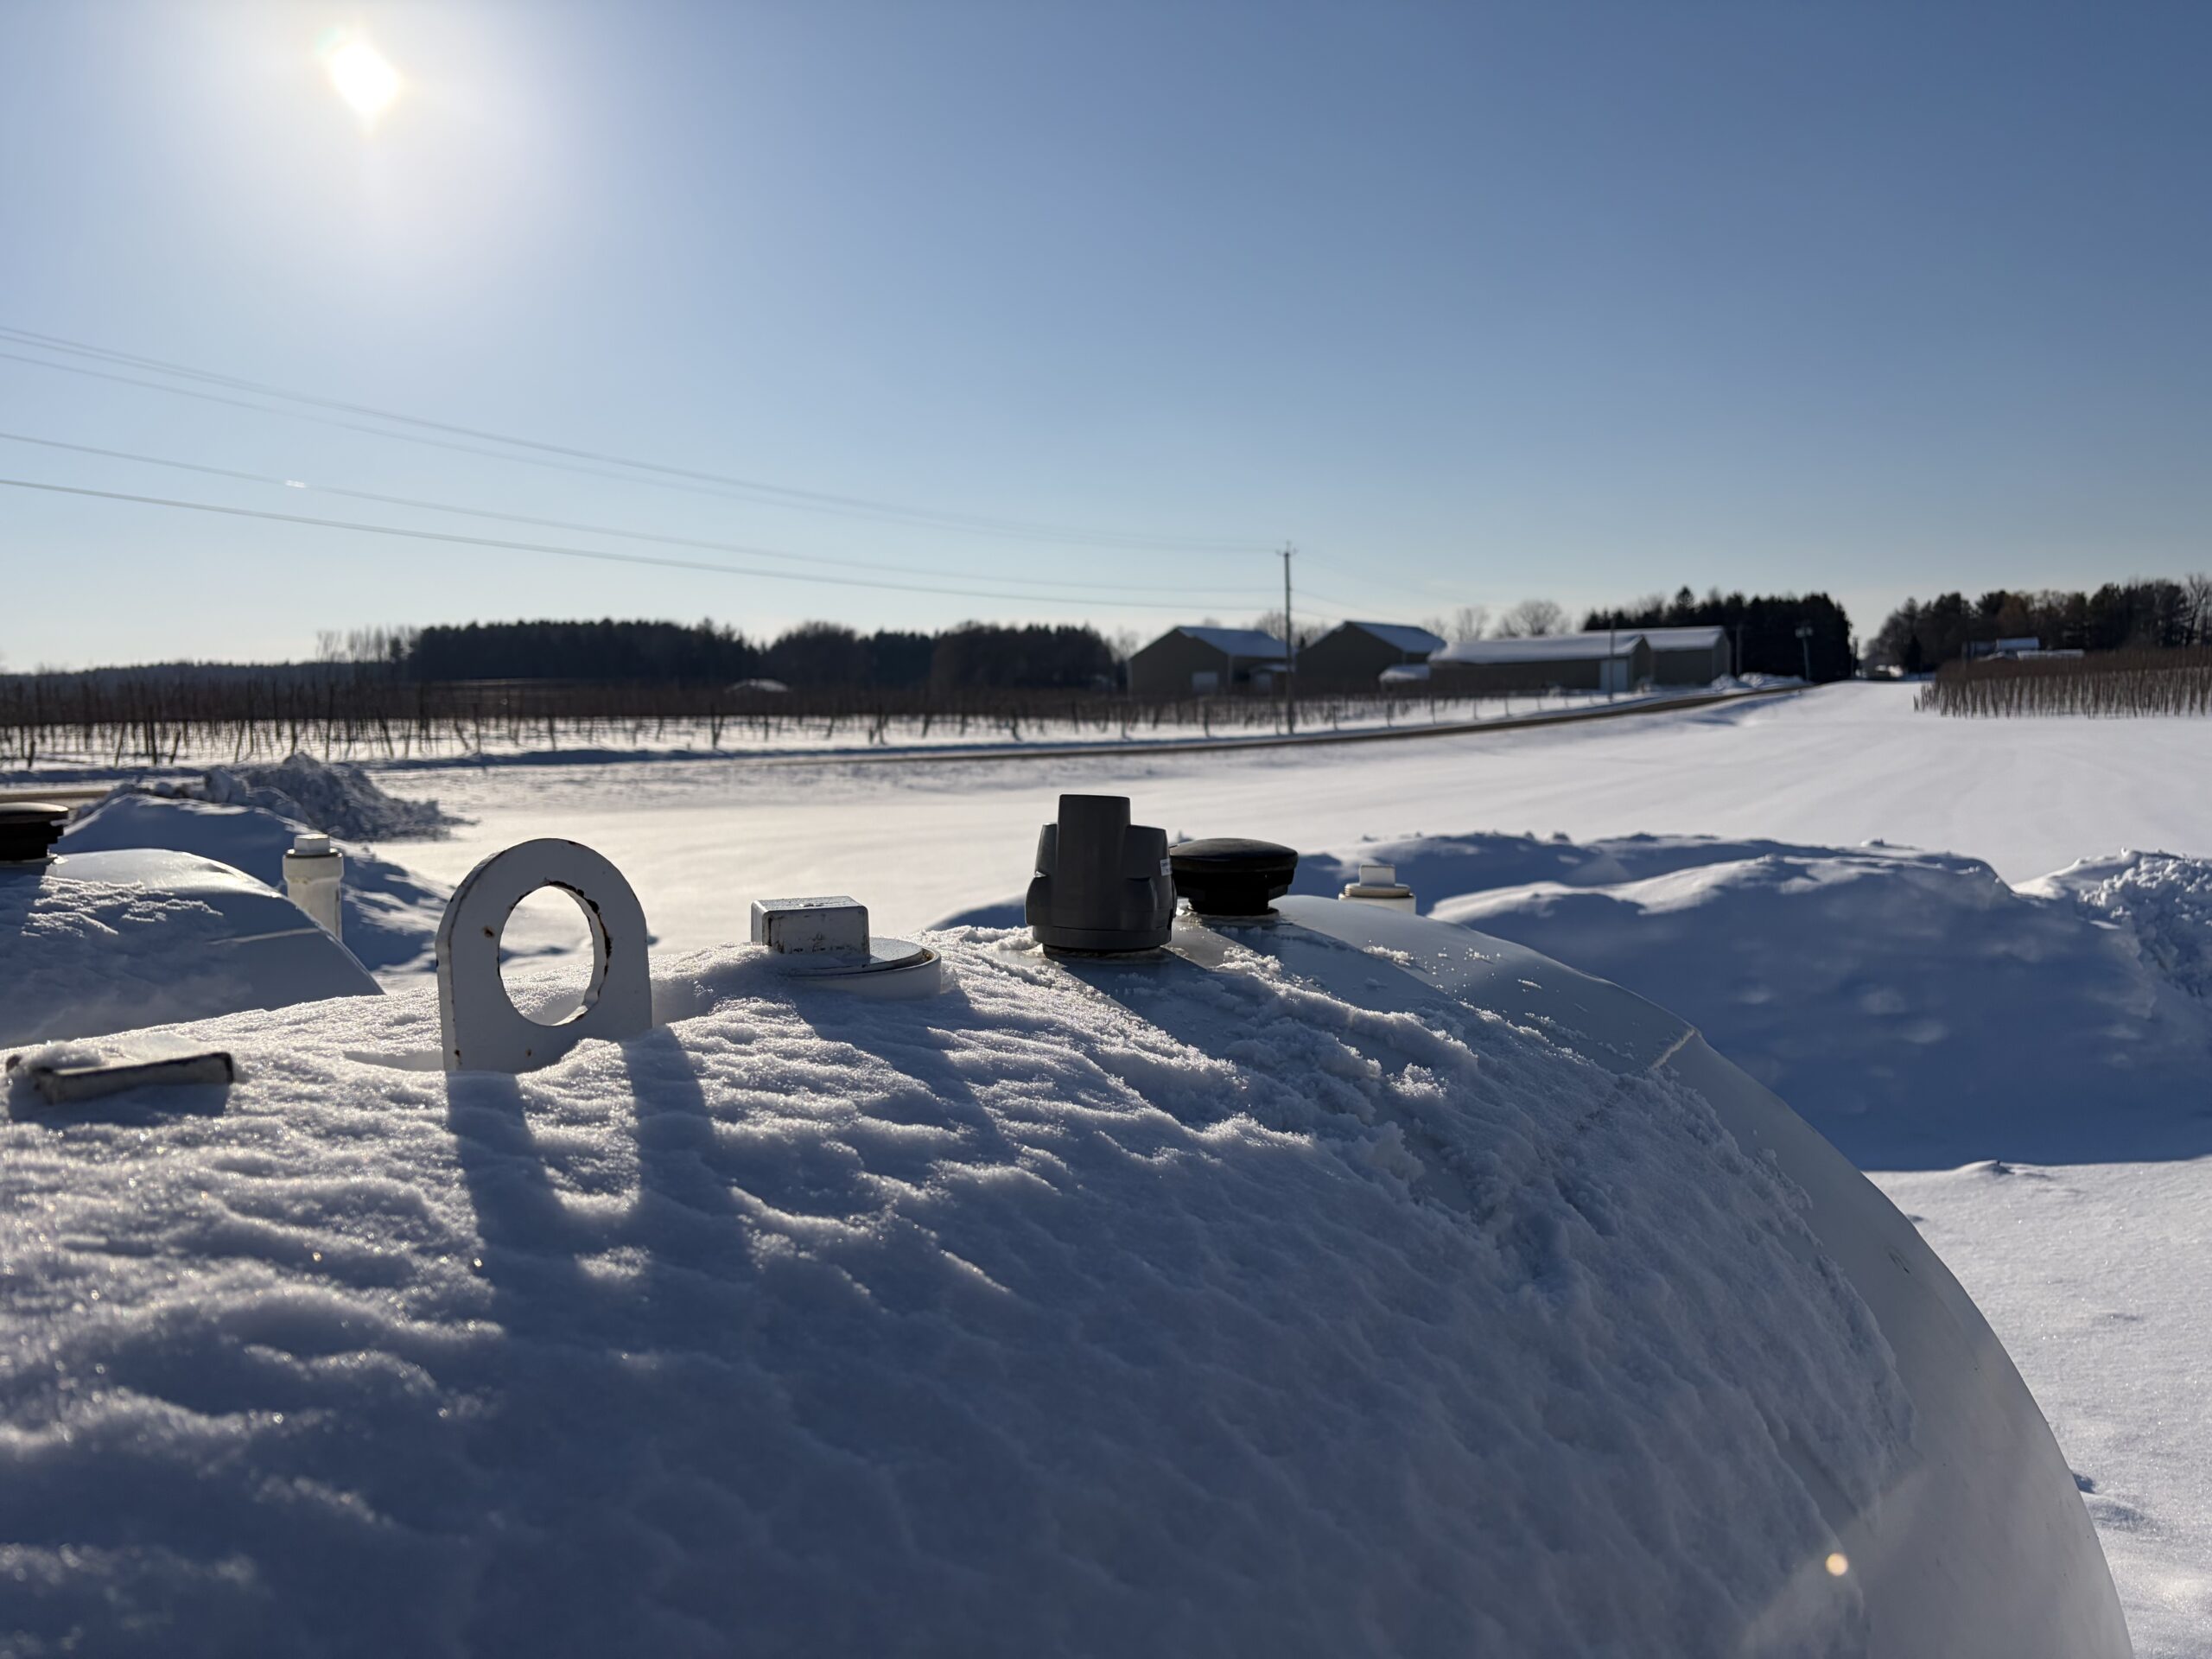
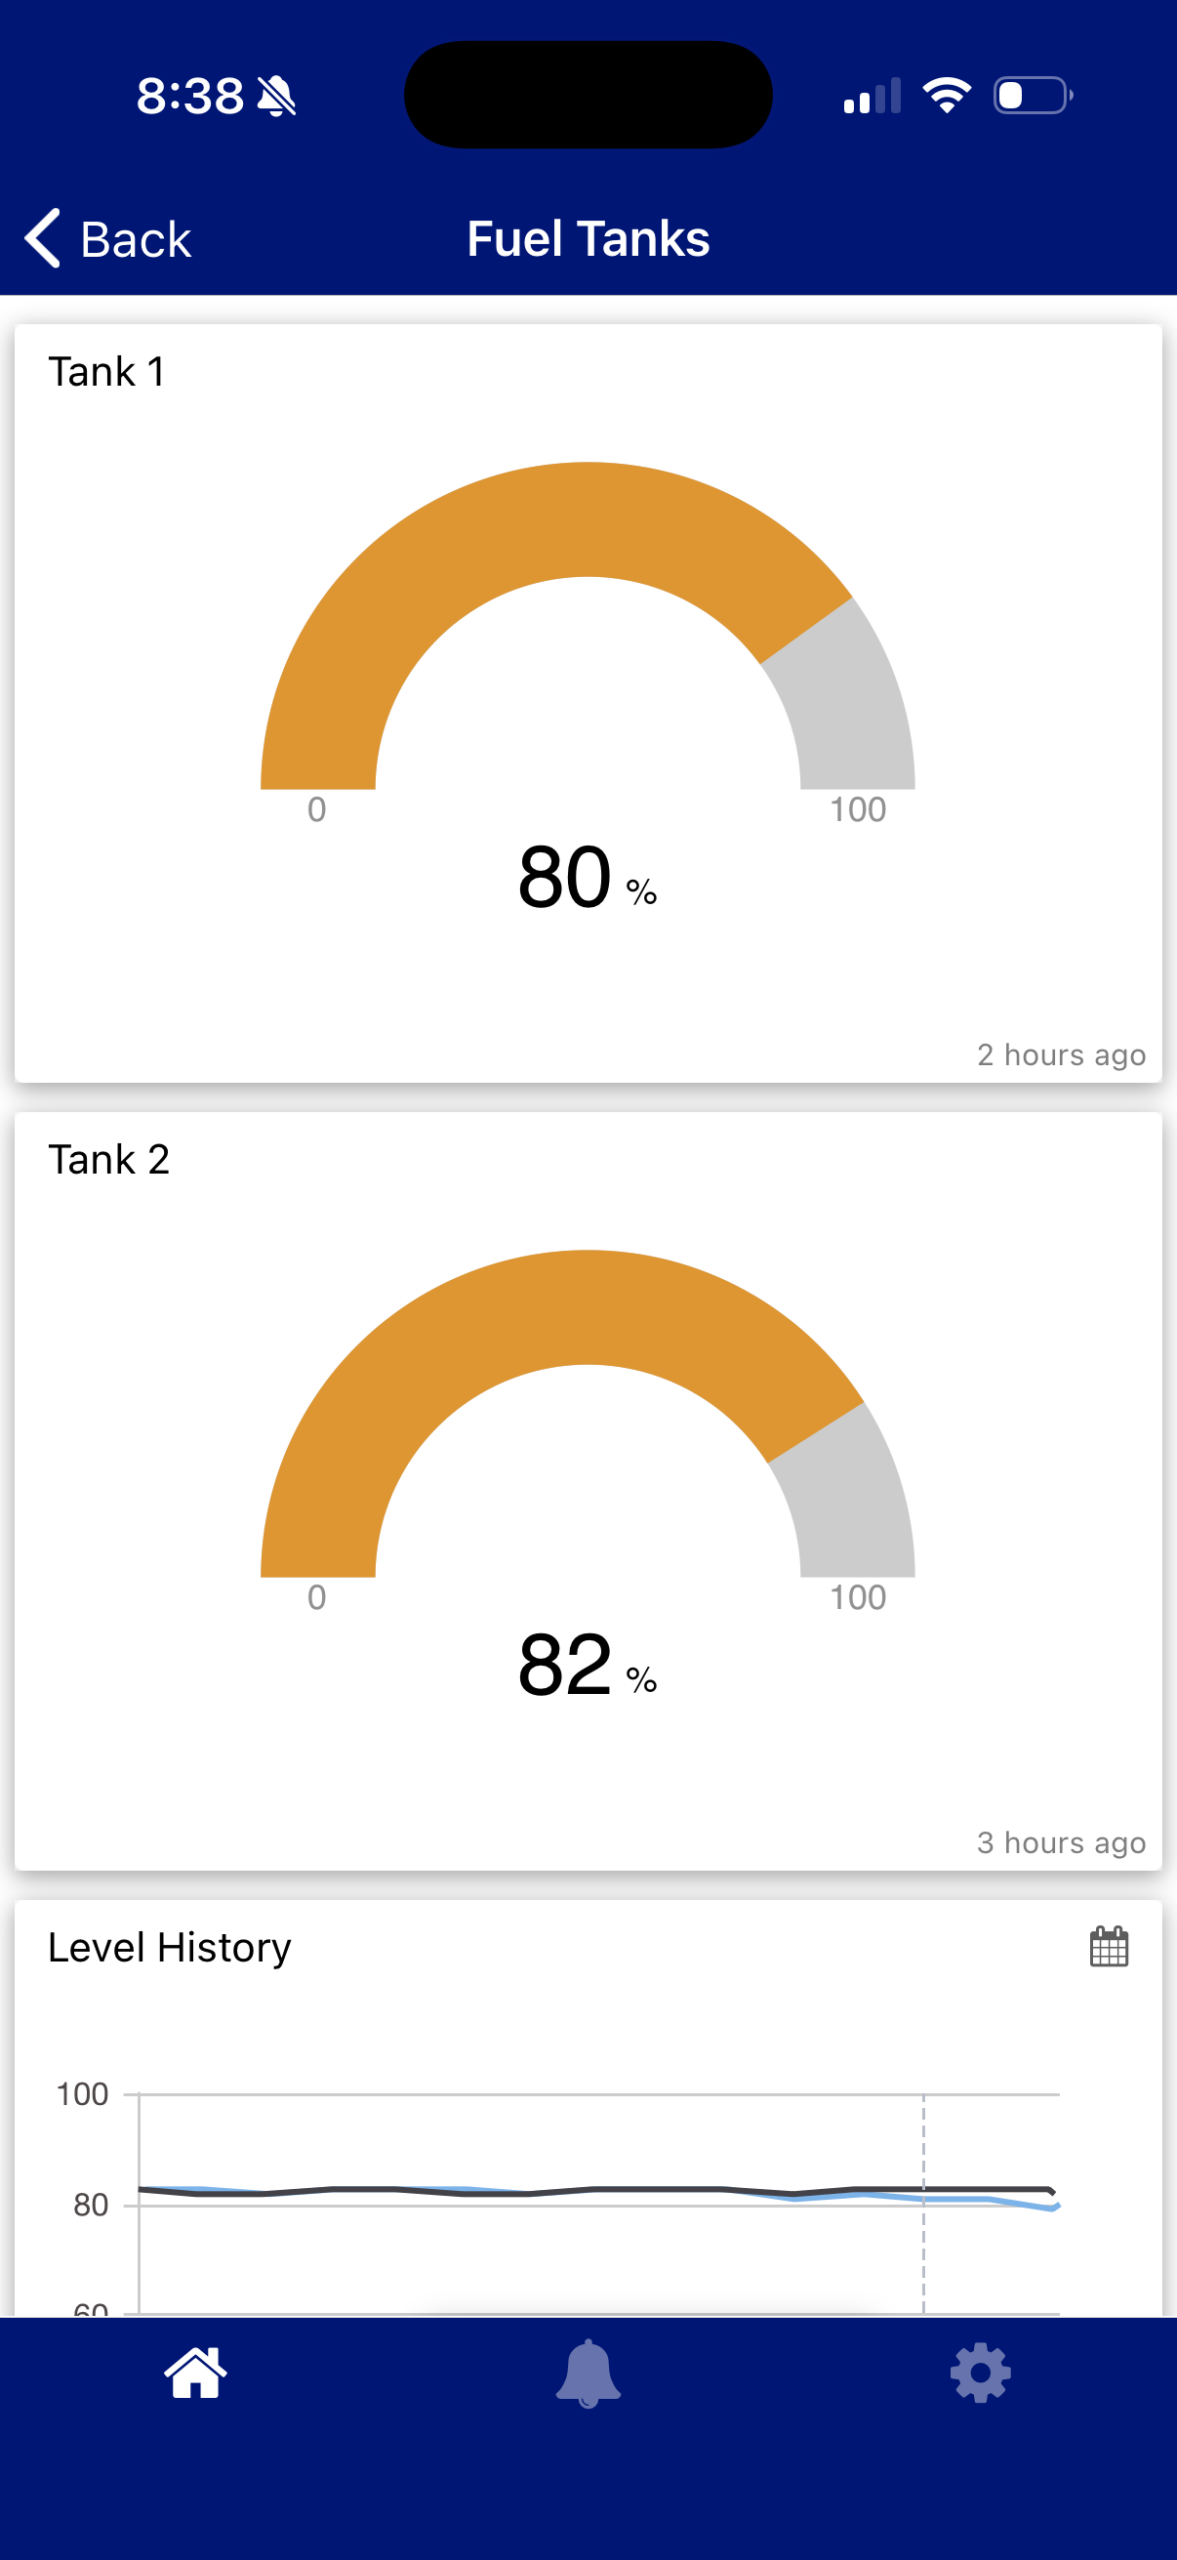
After much searching, we were able to determine a suitable fuel tank level sensor that fits our needs. In the summer of 2023, two options that had been evaluated were Dragino’s LDDS20 LoRaWAN Liquid Level Sensor and IOT Factory’s Fuel-Water LoRaWAN Sensor (Ultrasonic). The issue we faced with the Dragino sensor was it requires a slightly flat surface at the bottom of a fuel tank, and in our case our tanks are perfect cylinders. For the IOT Factory sensor (and in general), we require LoRa products that can operate at the US frequency level (US915), but unfortunately IOT Factory doesn’t offer the US frequency for this specific product. We discussed options with a former extension agent from North Dakota State University who has published extension reports on LoRaWAN implementation on farms, however the recommended products couldn’t be used for our scenario. In the summer of 2025, we evaluated products offered by GAOTek, Daviteq, and finally settled on a product offered by Tekelek/Rochester Sensors that best fits our needs at a reasonable price. The distributor, Timitoo Tank Monitoring Solutions, provided us with TEK 888 LoRaWAN Ultrasonic Subband 2 915 fuel tank monitors with threading that we screwed onto the tops of our 2 diesel fuel tanks in place of some caps. We were successfully able to connect the devices to our ChirpStack server, get raw data into TagoIO, and then get a payload parser to read actual data from the devices. We may have to adjust how far the sensors tighten into the tank in the future, as we noticed during install that the threads on our tanks are less than on the sensor. The general recommendation from Timitoo was to check if the liquid in the tank can reach all the way to the top. If it does, then we’ll need to screw the sensor only as far down as the threads on the tank go so it doesn’t come in contact with the content of the tank. If there is plenty of distance, then we’ll need to screw the sensor in as far as it can go. For now, we’re just using the general readings and so far, they seem accurate enough.
6a. Facility Monitoring
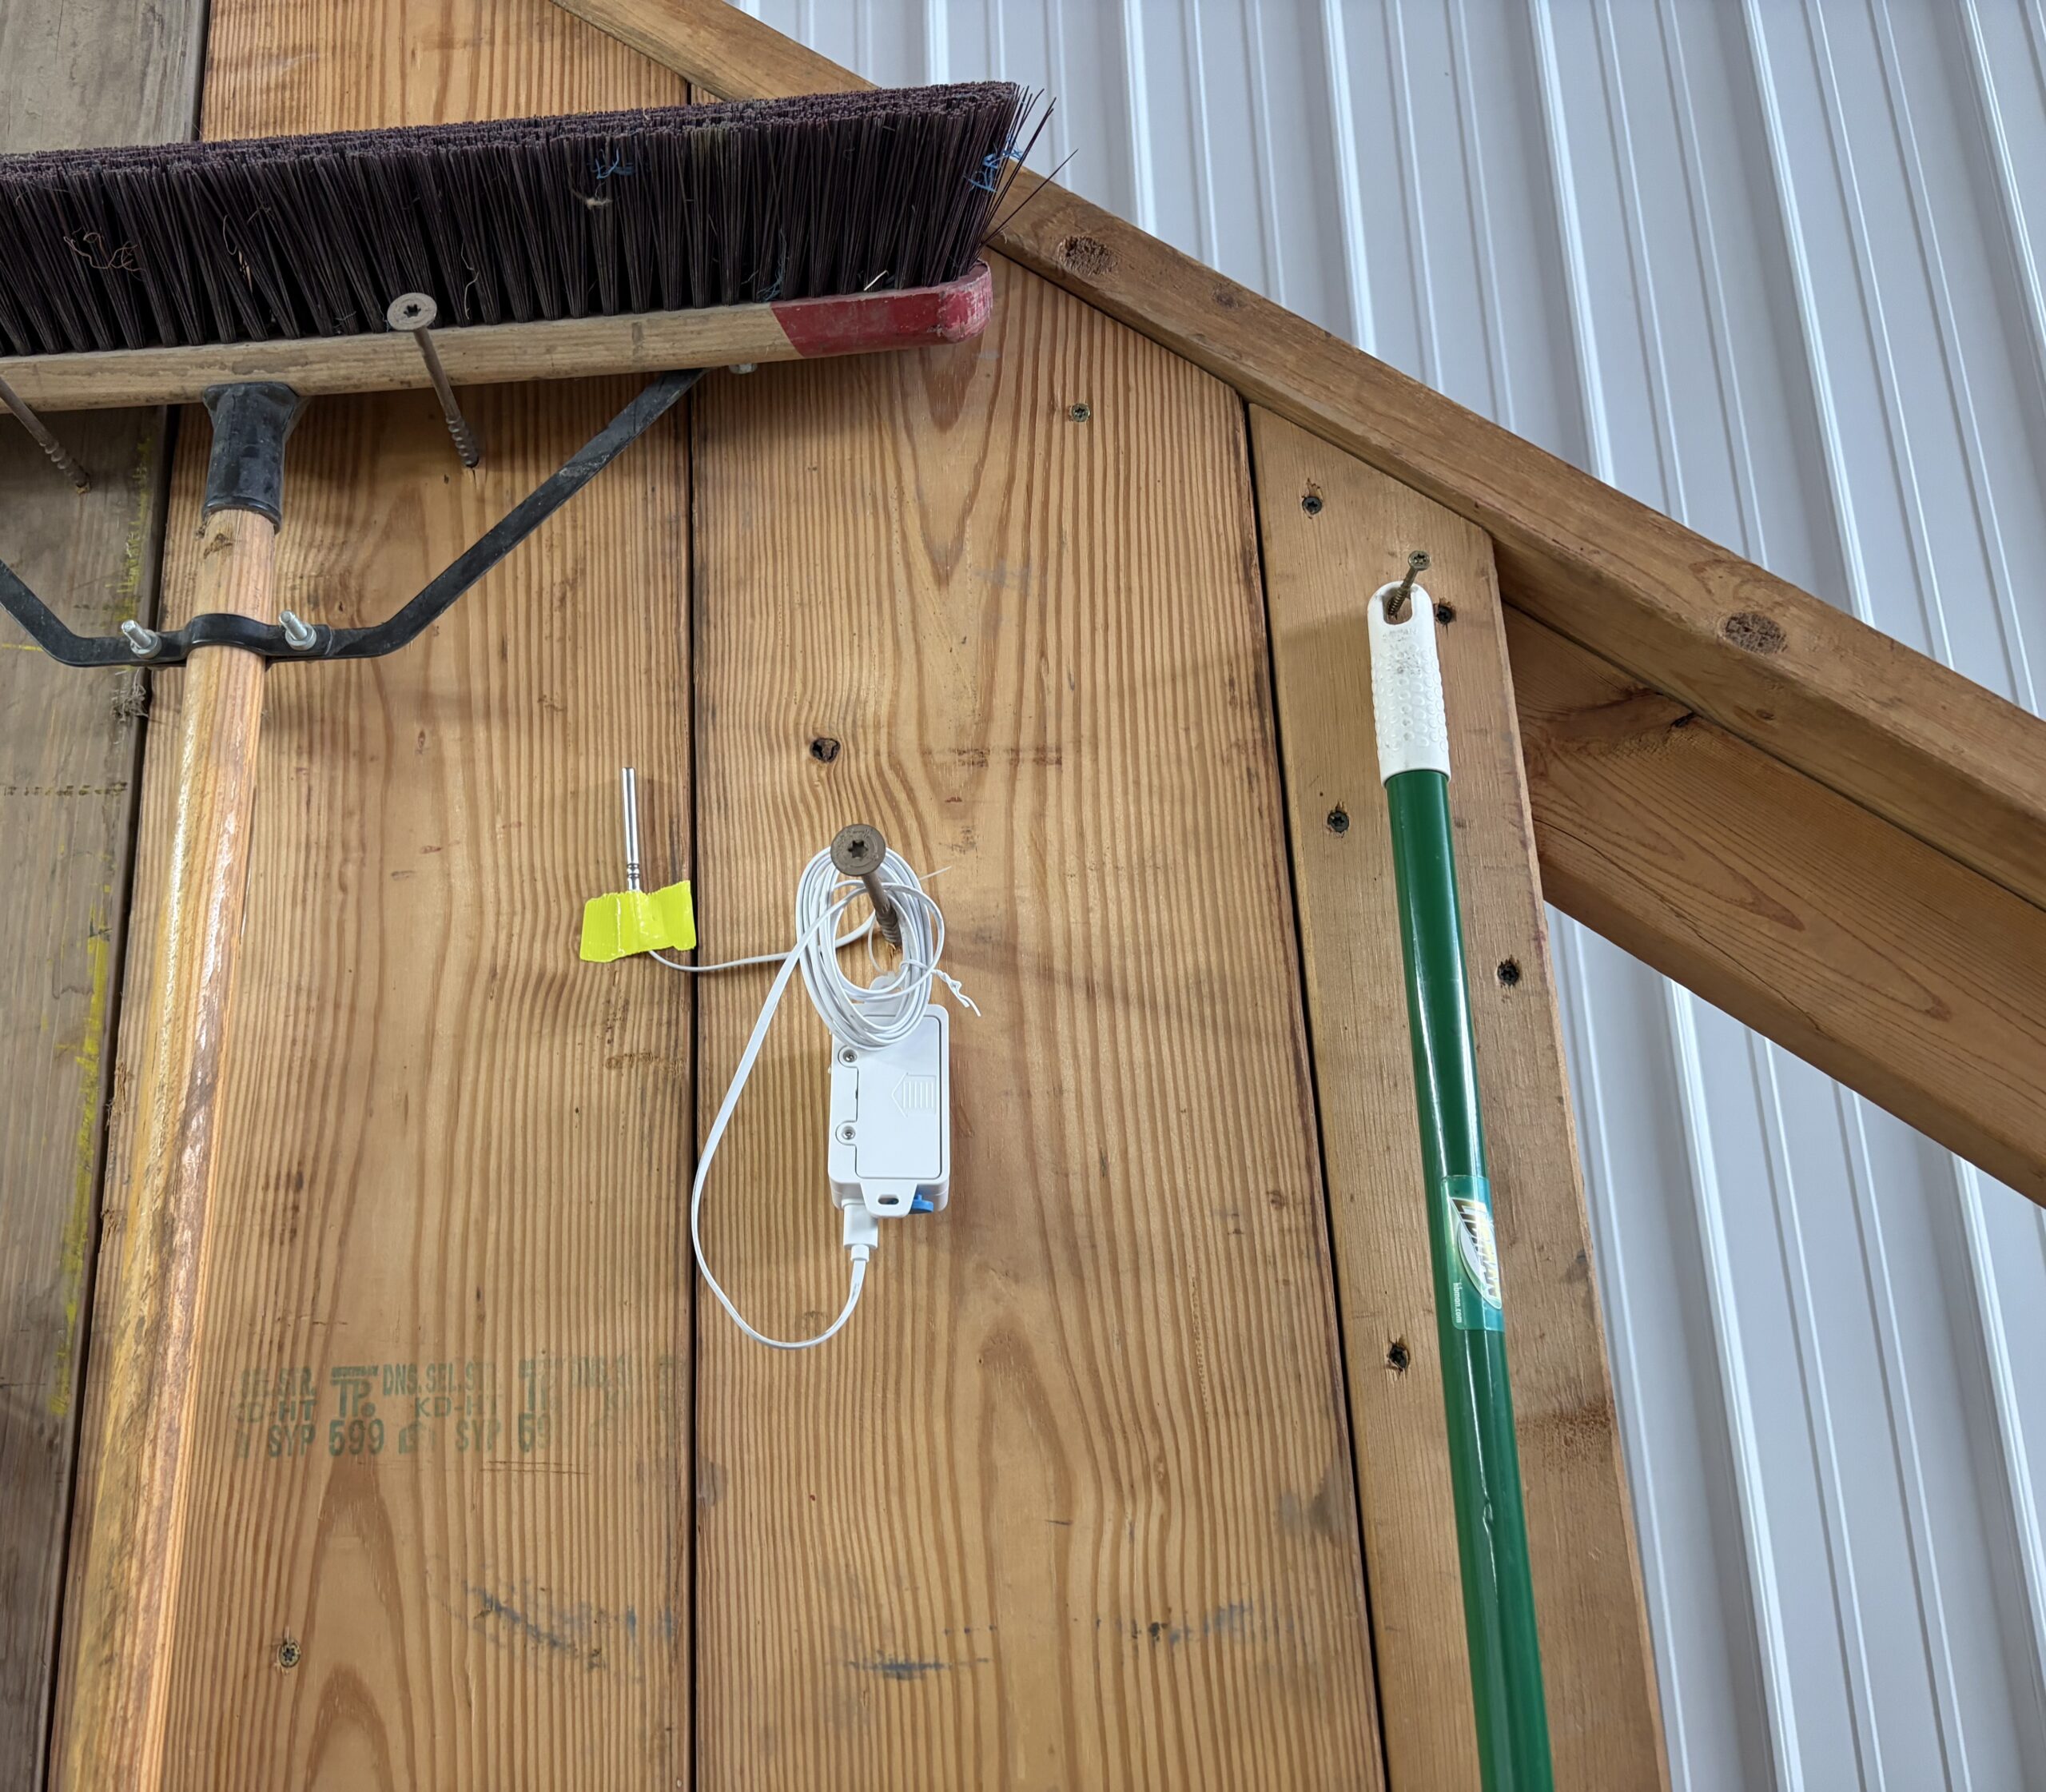
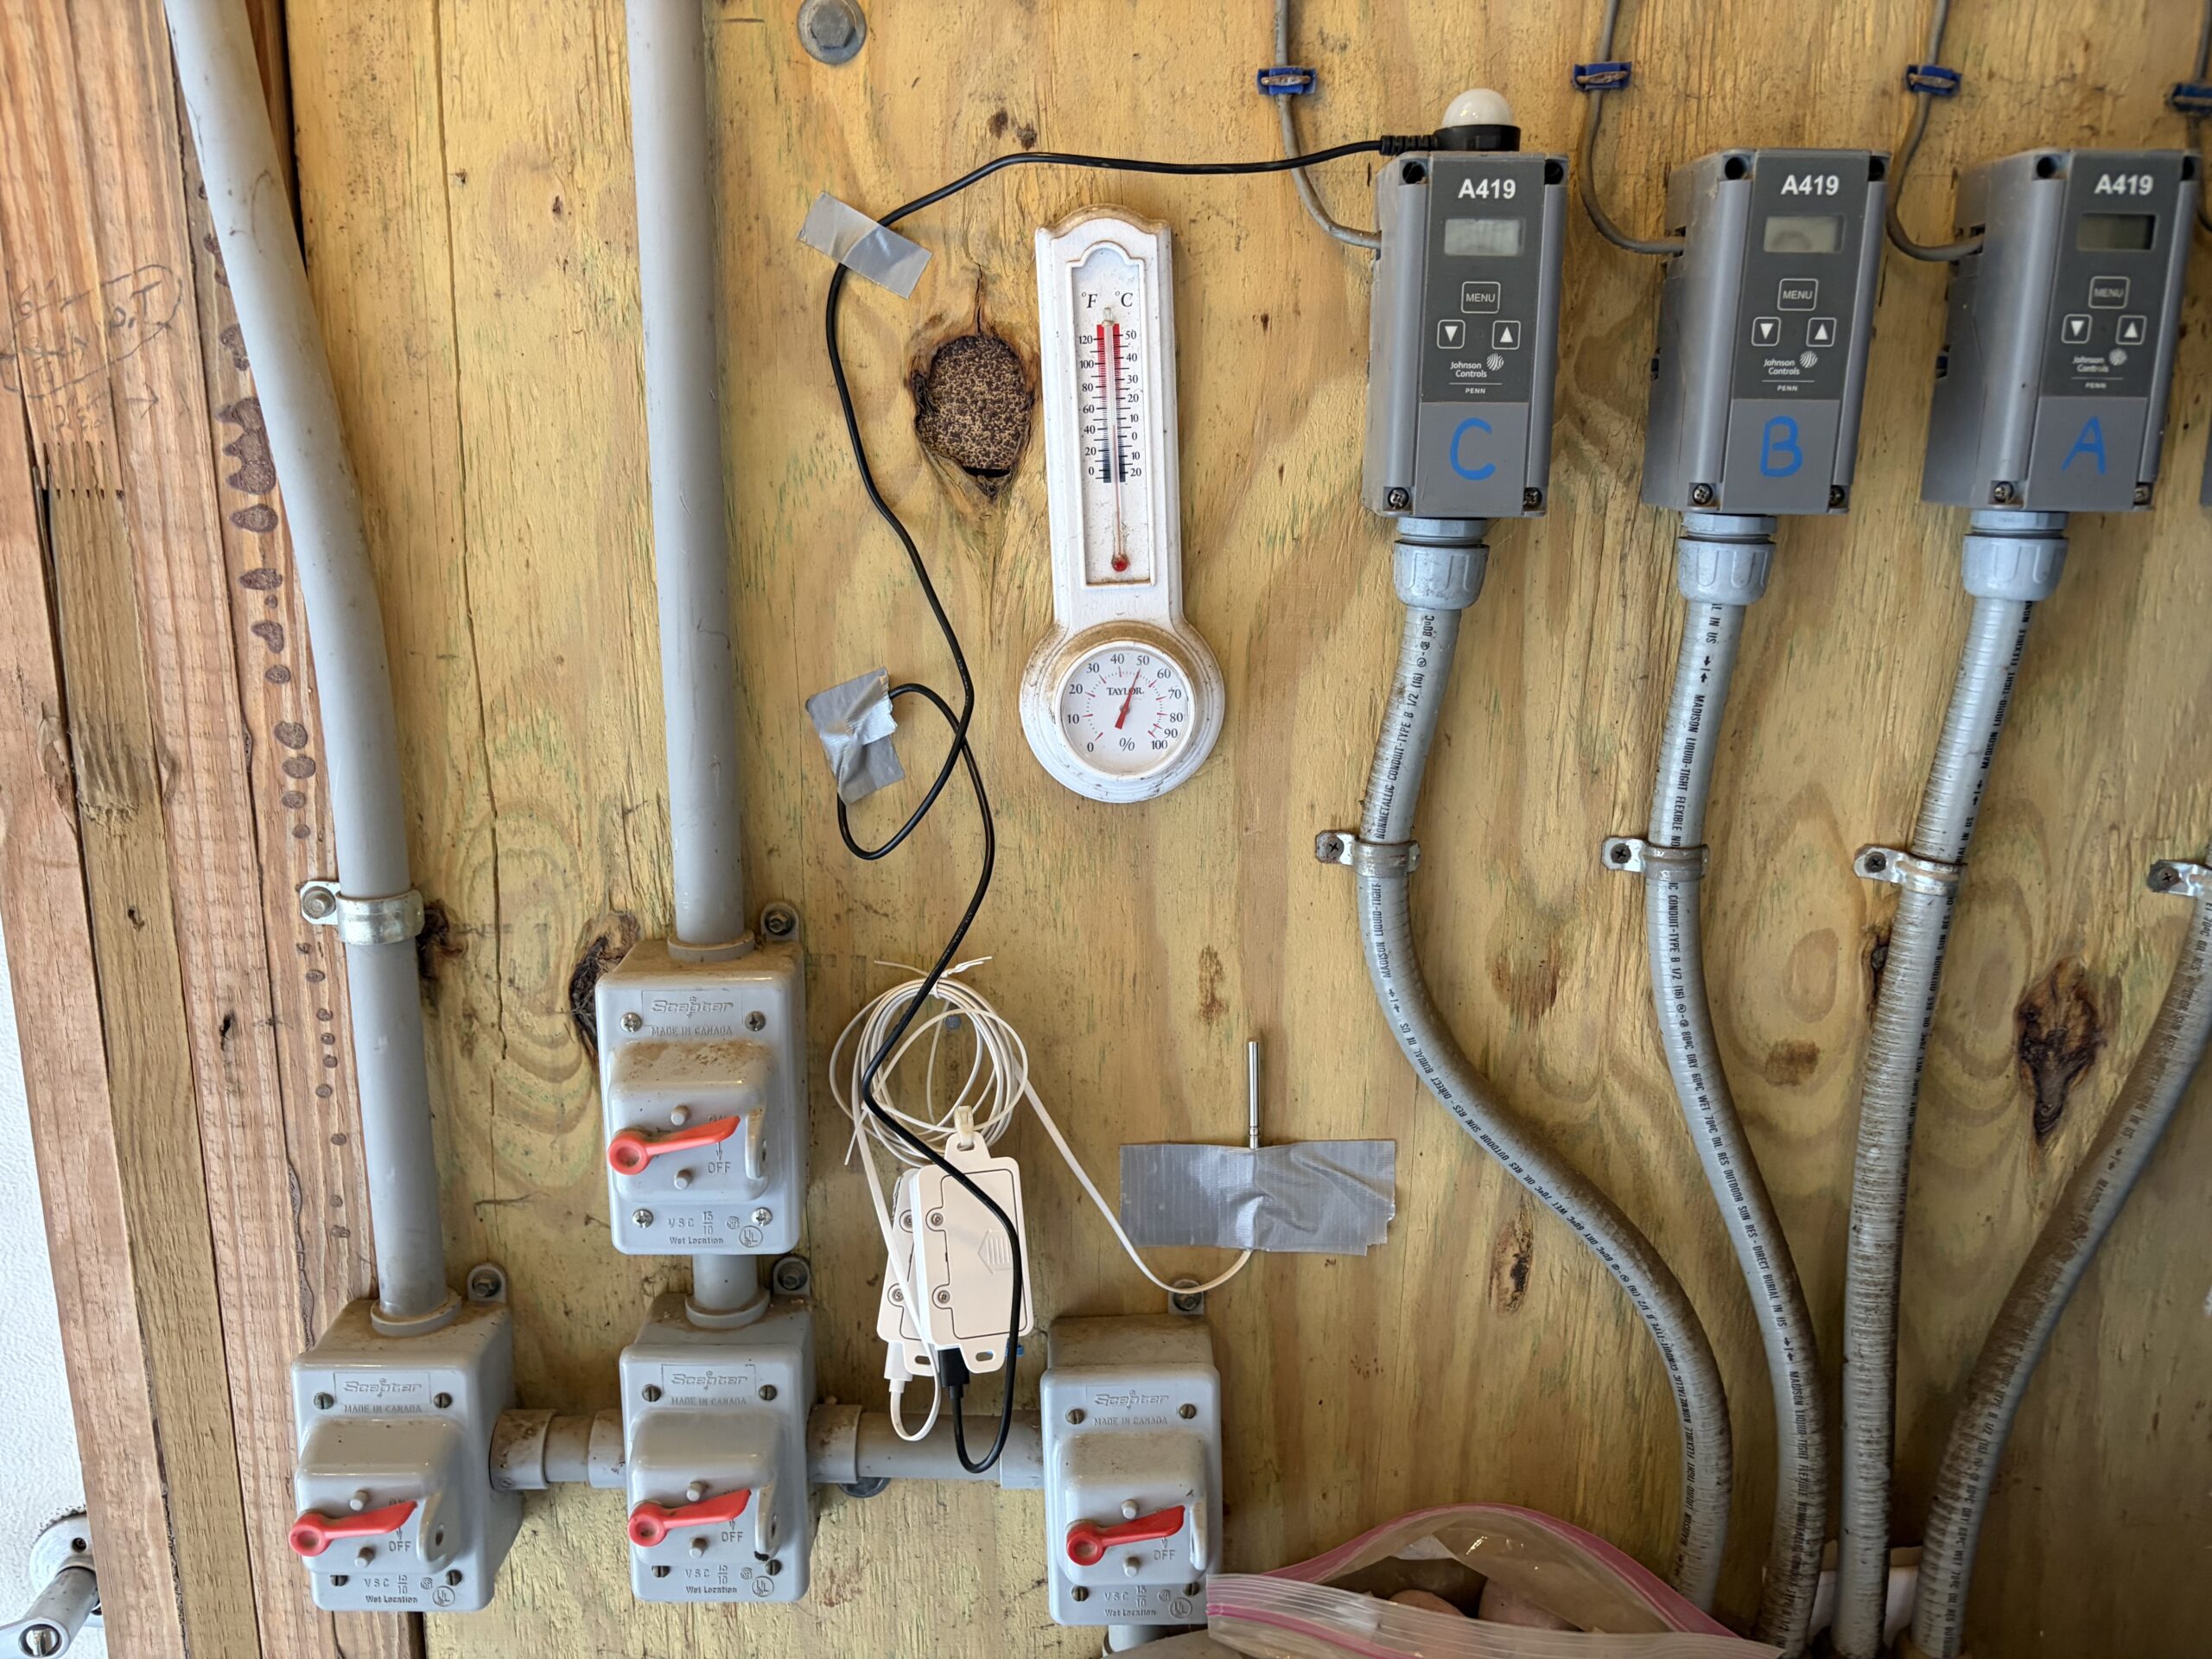
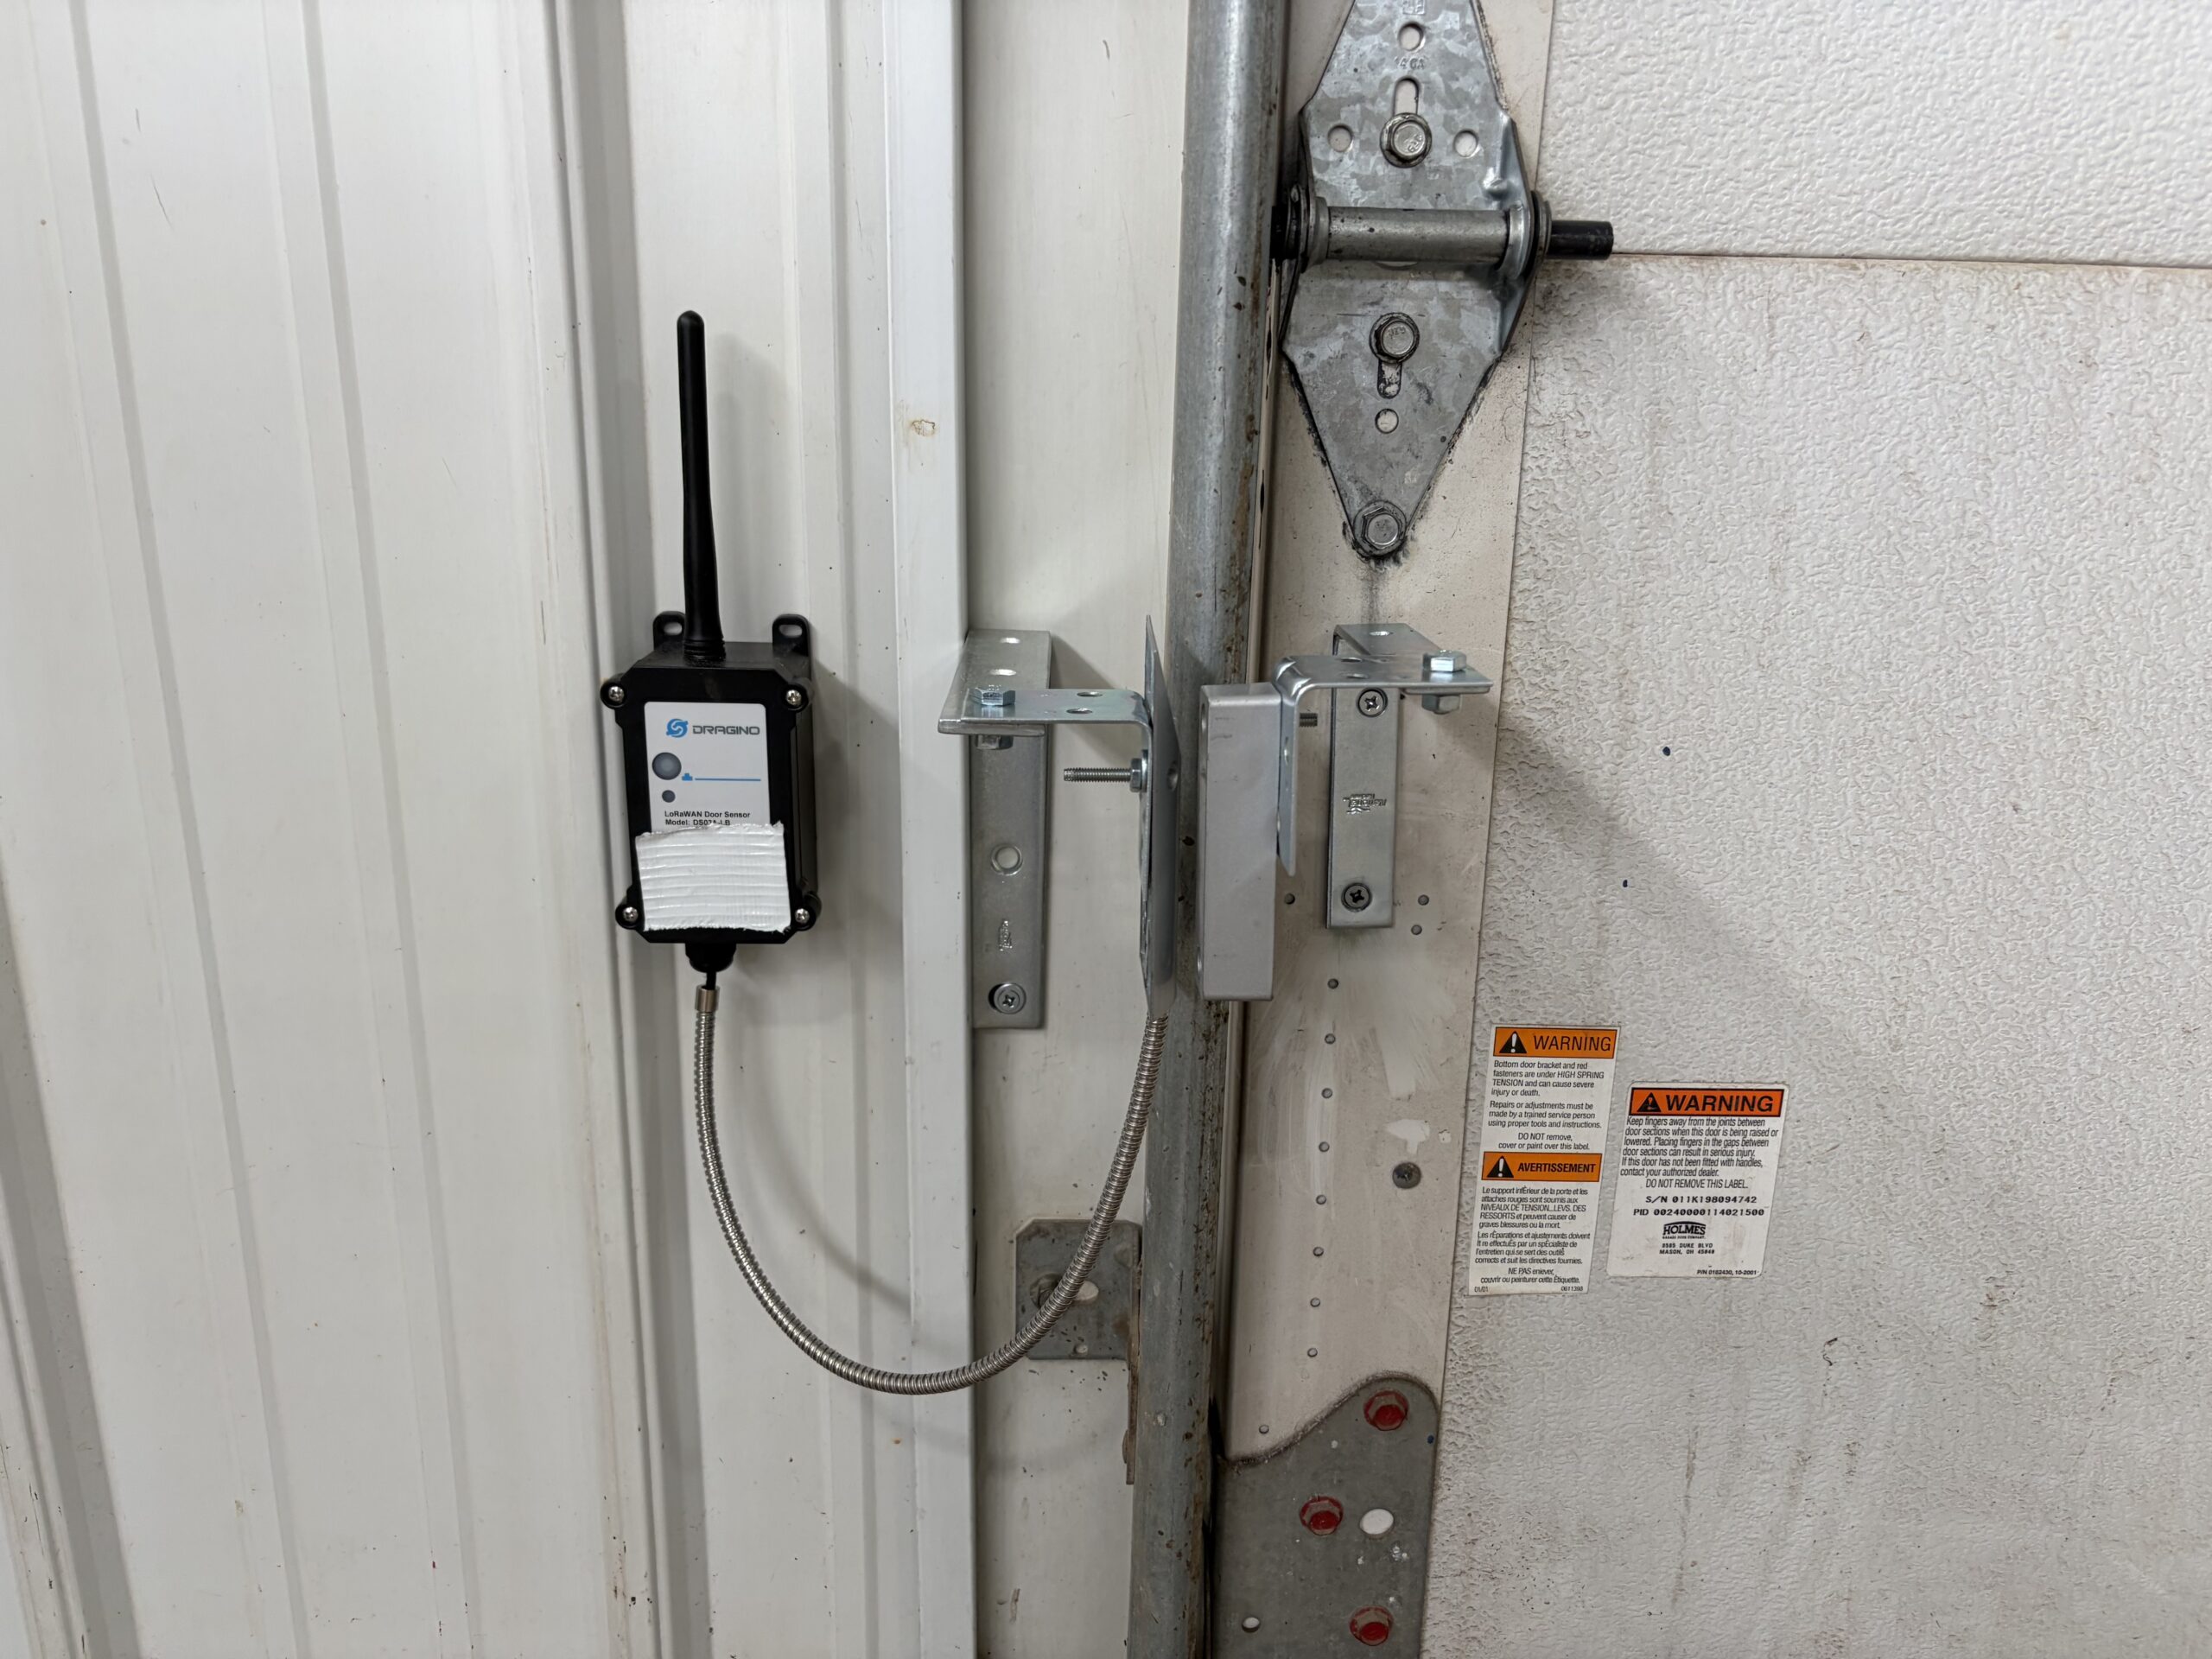
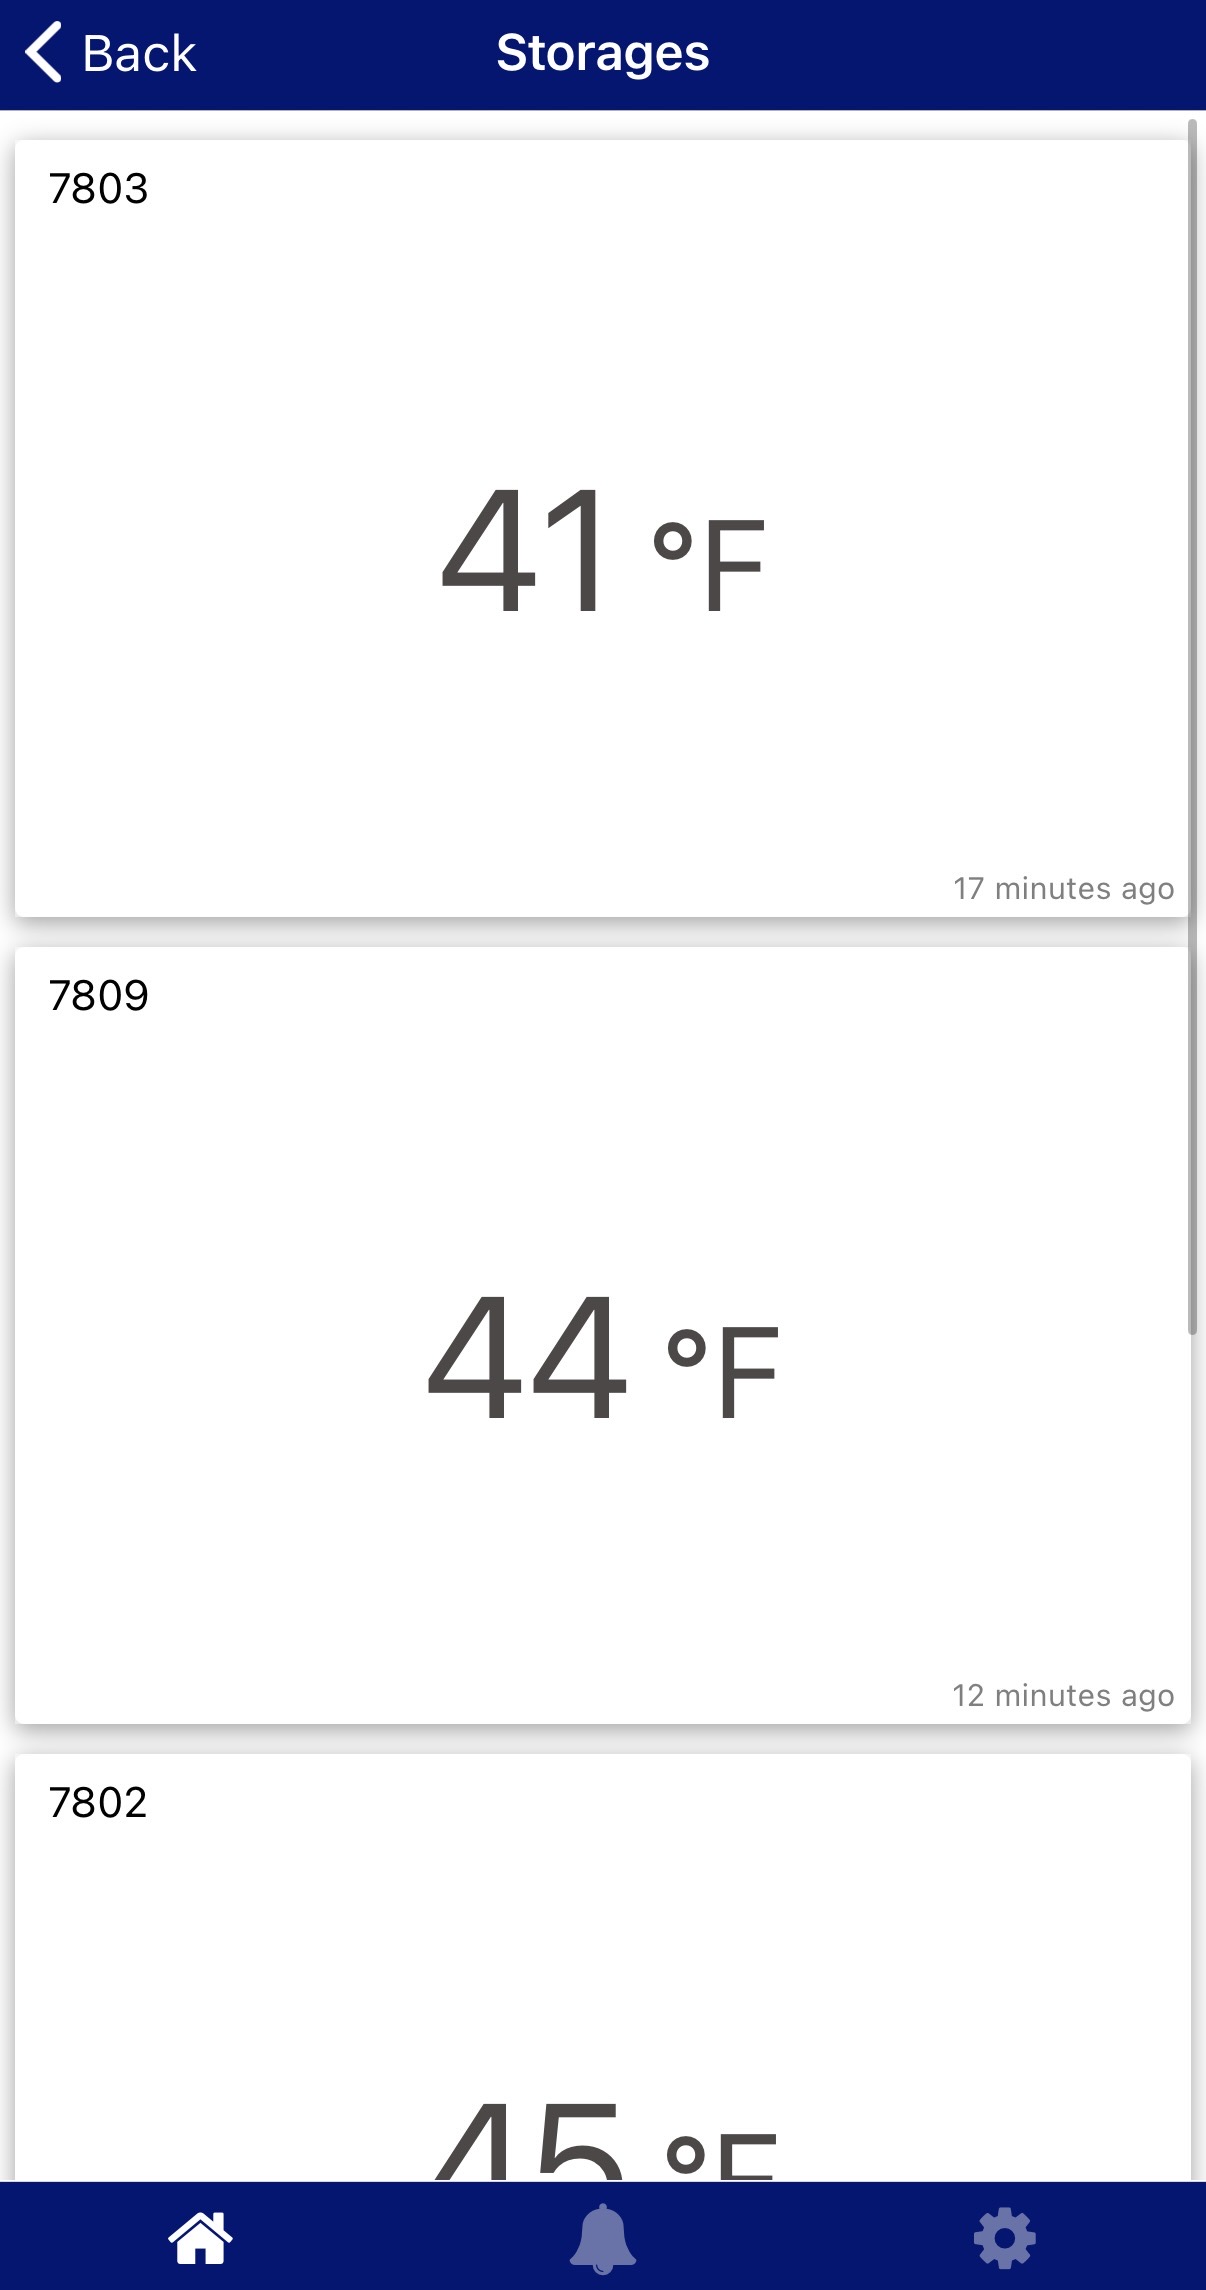
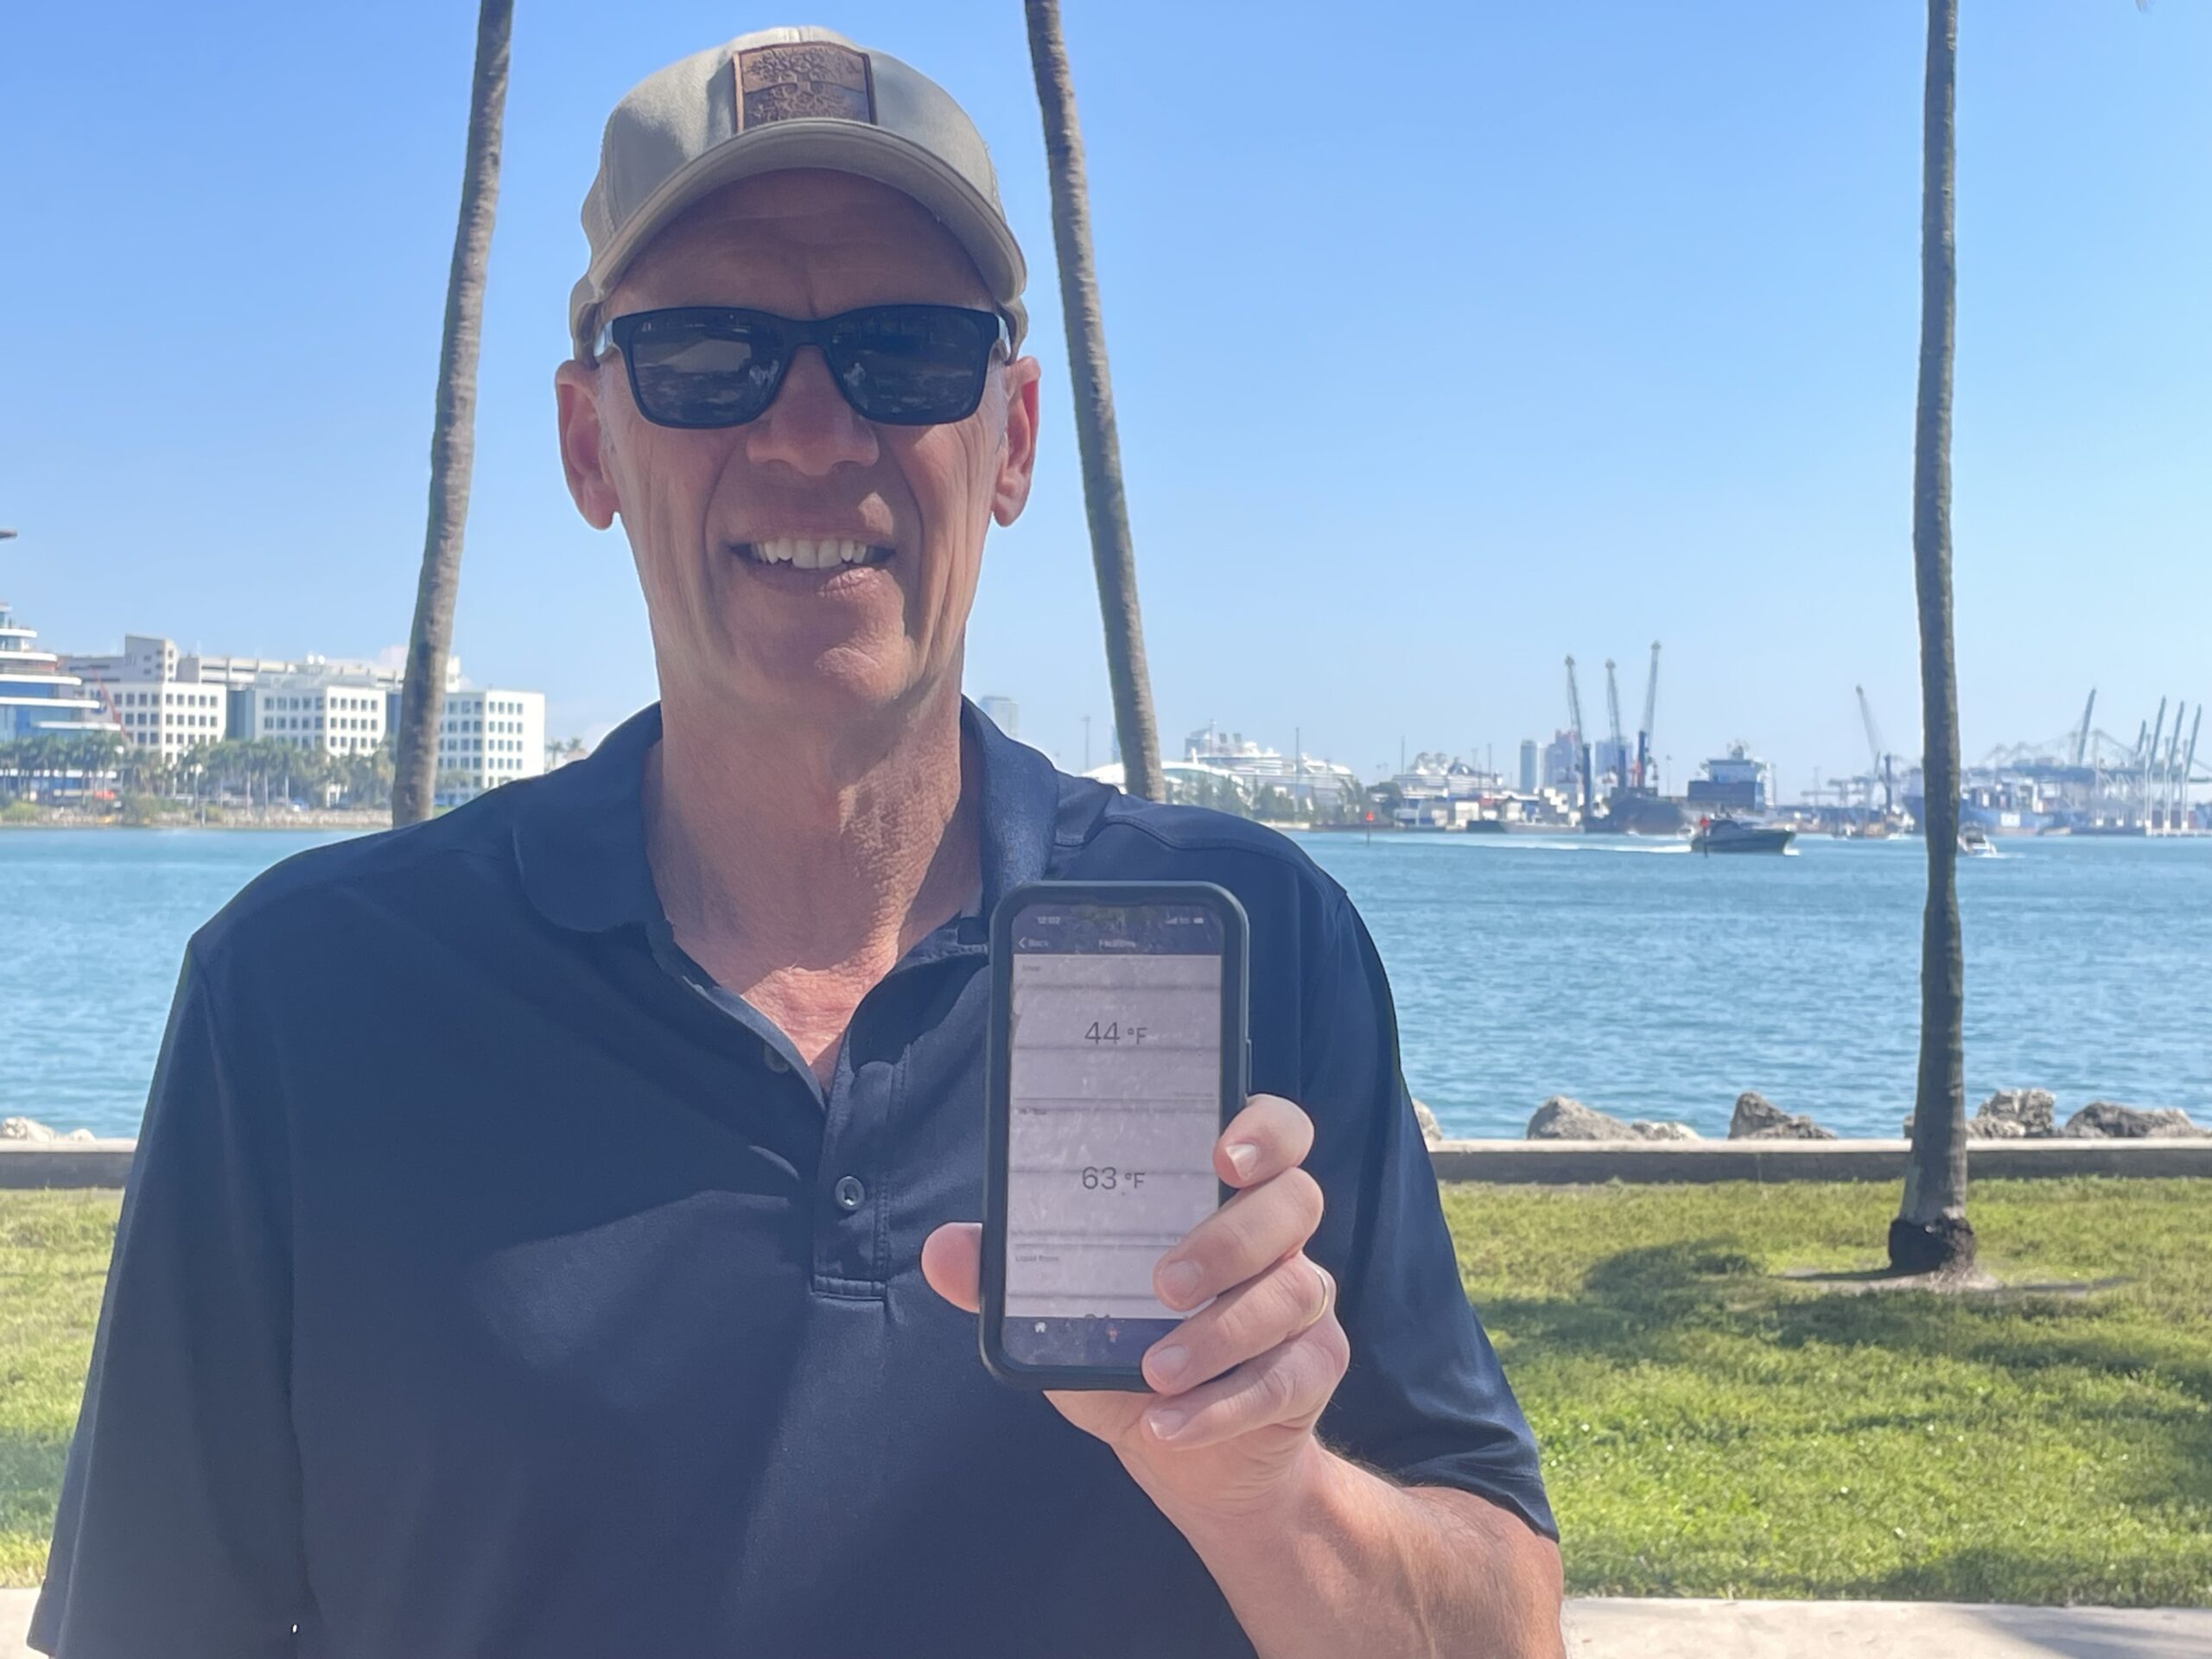
While not originally in the scope of our grant project, another application we discovered was using simple LoRaWAN temperature/humidity sensors for monitoring conditions in our cold storages remotely. After purchasing some Dragino LHT65N-E31F LoRaWAN Temperature & Humidity Sensors, we deployed 3 in 3 storages on the walls near the center entrances where we had digital monitors that had to be checked manually. The sensors were able to send data via LoRaWAN even though they were inside separate metal buildings. We were able to monitor the data and the data proved consistent from manual verification of the existing digital monitors. We were then able to expand on this and added 3 more of the same sensors to our shop, chemical storage room, and water room. These were especially helpful in the winter of 2026 which was one of the most extreme New York has seen in years. The management team was able to monitor temperature conditions remotely to make sure pipes and materials weren’t freezing and coordinate schedules during night and day for when to come in and turn on heaters. This also enabled peace of mind for managers to leave for vacations during this offseason period with confidence that other team members were properly taking care of facilities. With the success of these facility monitoring tools, final purchases made in the grant included an indoor CO2 sensor, door sensors, and light intensity sensors. The CO2 sensor was purchased with the idea that it could help ensure worker safety in the event CO2 levels exceeded dangerous thresholds, but so far, the readings haven’t been the most useful. The door sensors are encouraging, and one is fully operational on our overhead shop door, and we can see when the door is open or closed. We now have one light intensity sensor running in a storage building and we can see when lights have been turned on or off based on the lux % readings. While an unexpected avenue for the grant, these facility monitoring sensors have actually shown some of the most promising results.
7. Dashboard Integration
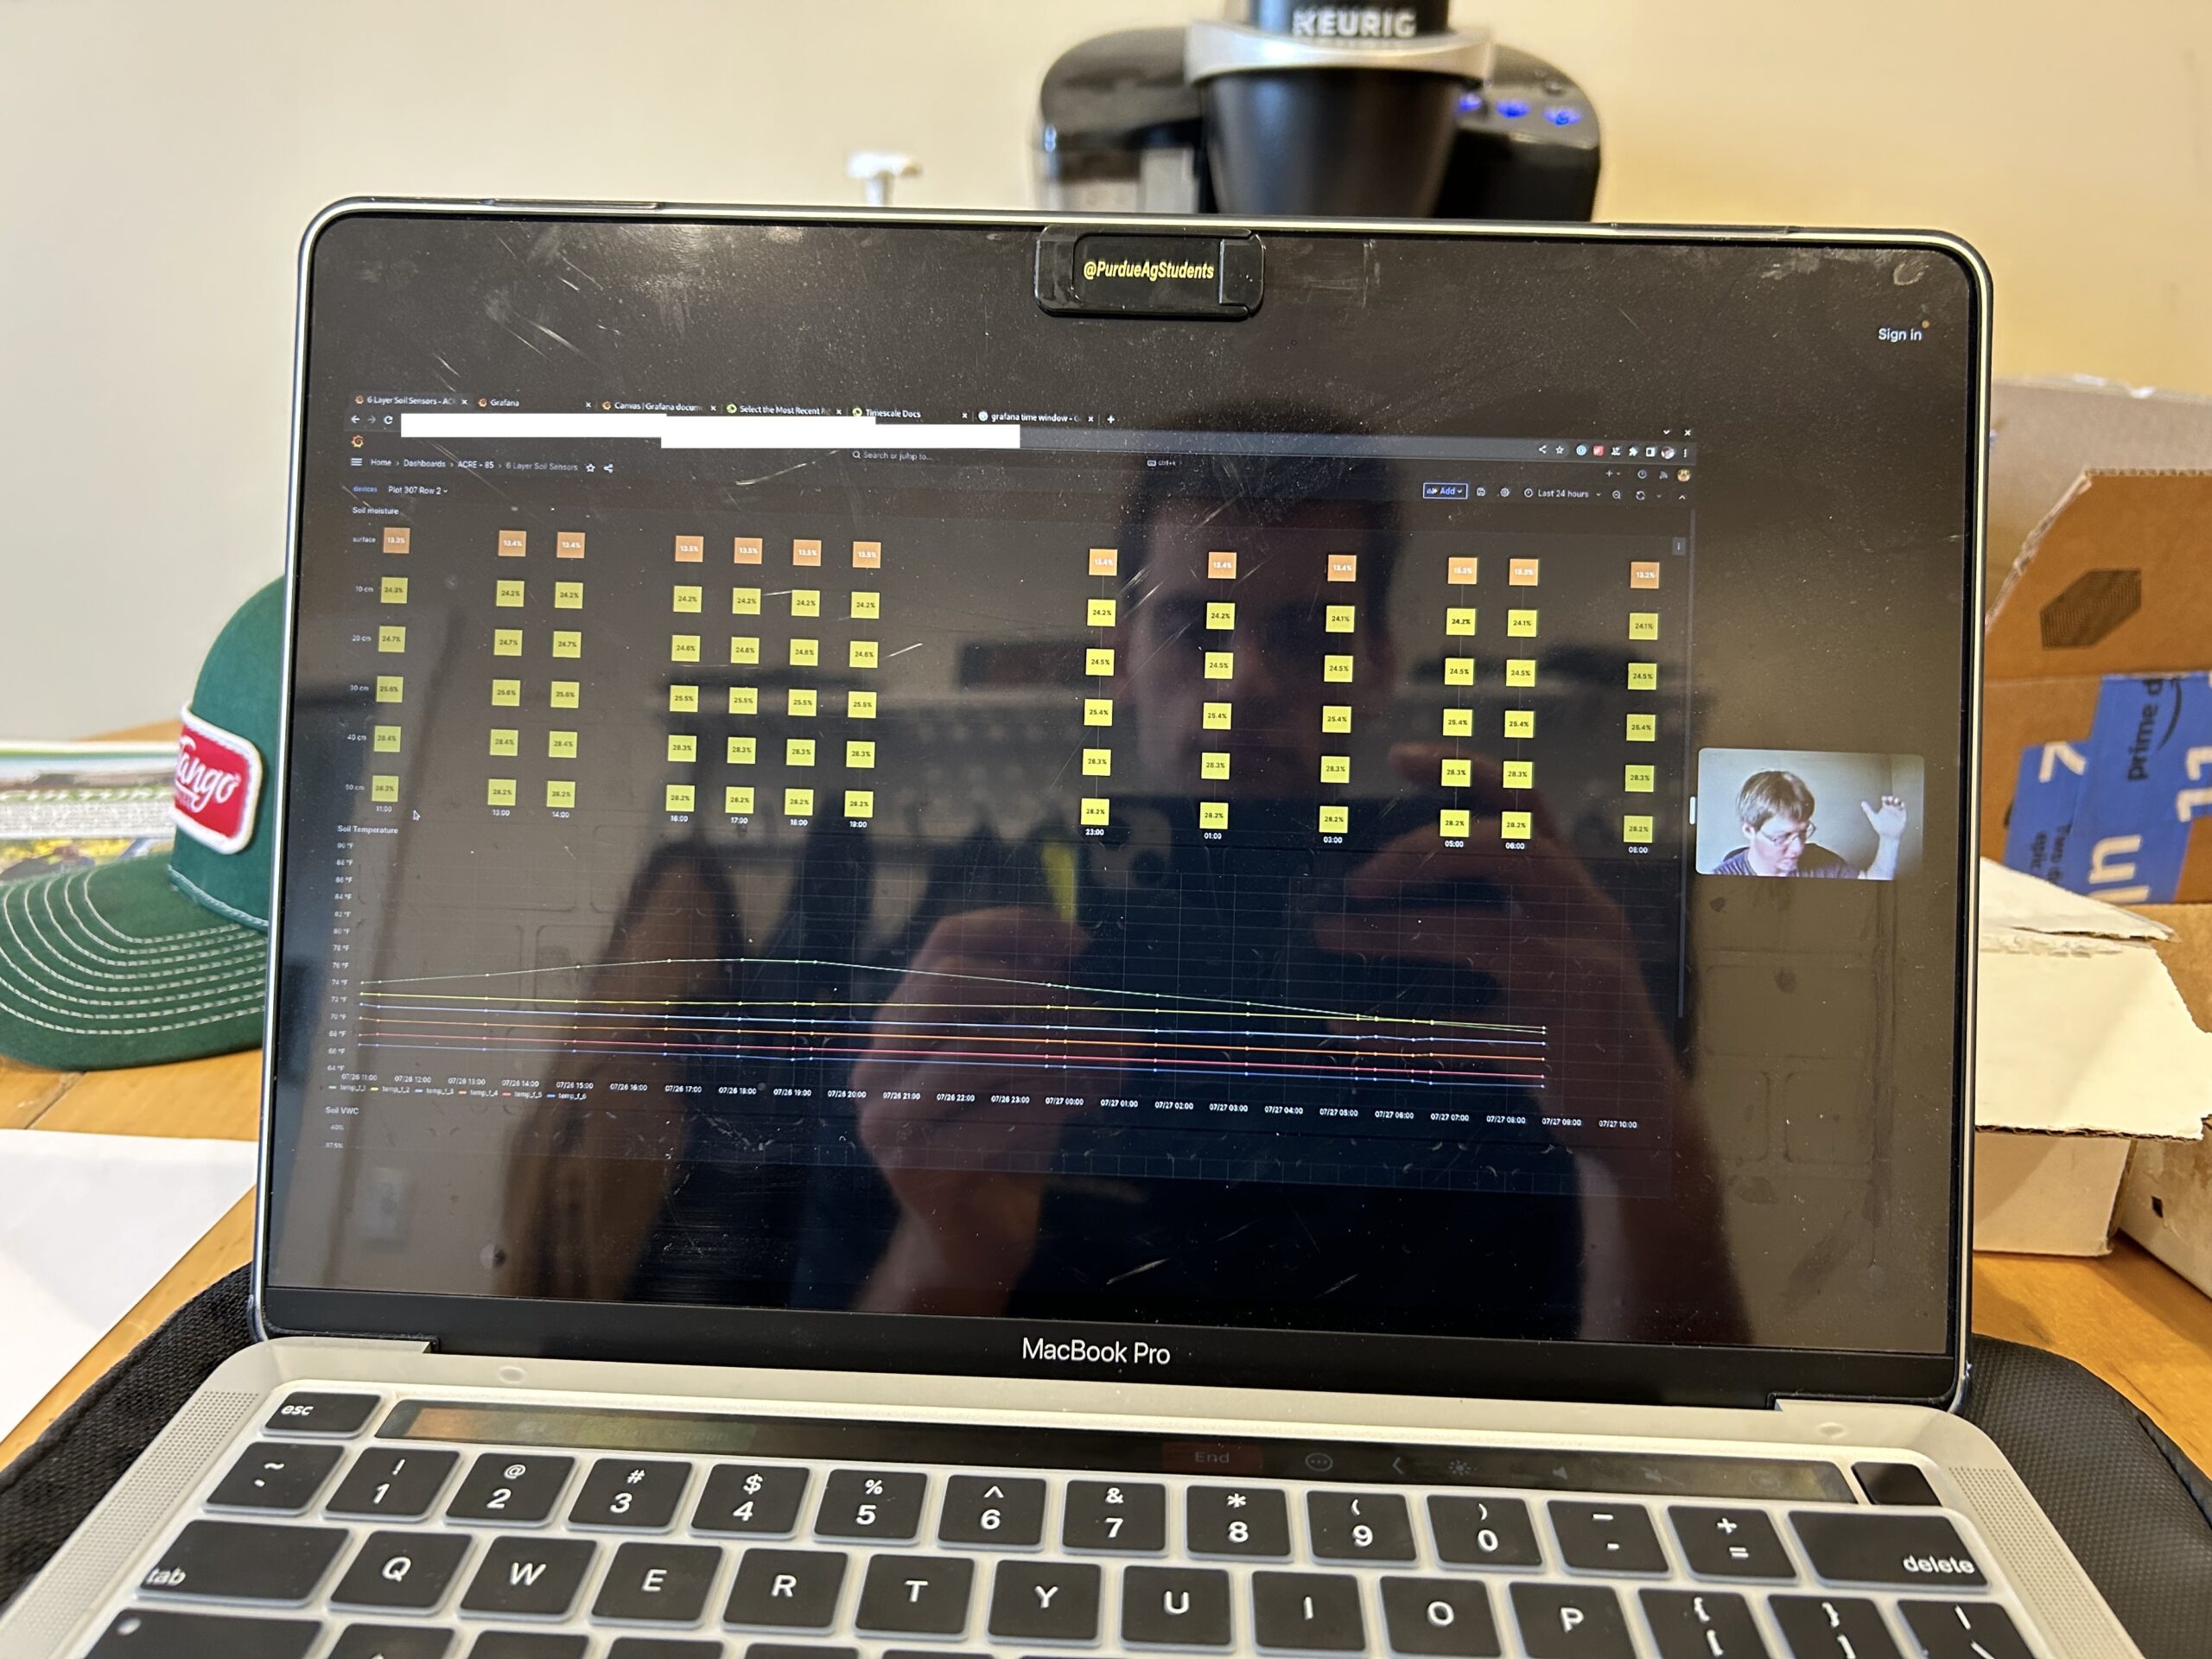
When starting the grant project, we’d hoped to utilize the free, open source dashboard Grafana to synthesize all data points collected to one location for ease of use for farmers, meaning all soil moisture sensor systems would be displayable as graphs live and over time, fuel tanks would show their levels, and the locations of vehicles would be shown on a map, for example, all in the same place. In the summer of 2024, an iteration of the Purdue OATS Center’s custom data pipeline, Avena, was implemented halfway for initial testing of a cloud-based data management system. Accessible from anywhere, the data pipeline components streamlined data flow and minimized cost for a cloud-based system. ChirpStack was primarily used within Avena to connect the gateway, the first smart valve, and four soil moisture sensors and then monitor the quality of data communications. In the summer of 2025, work was continued in this area with the support of researchers from the Purdue OATS Center. First, 8 Tektellic Clover Ag Sensors and the 8 Dragino soil moisture sensors were successfully added through the entire data pipeline and visualized in Grafana. The dashboard was made publicly available and data collected during this time was made available to IoT4Ag’s SPRING educational modules for students to have an opportunity to work with sensor data not just from Purdue’s ACRE research farm but also a commercial farm/orchard setting.
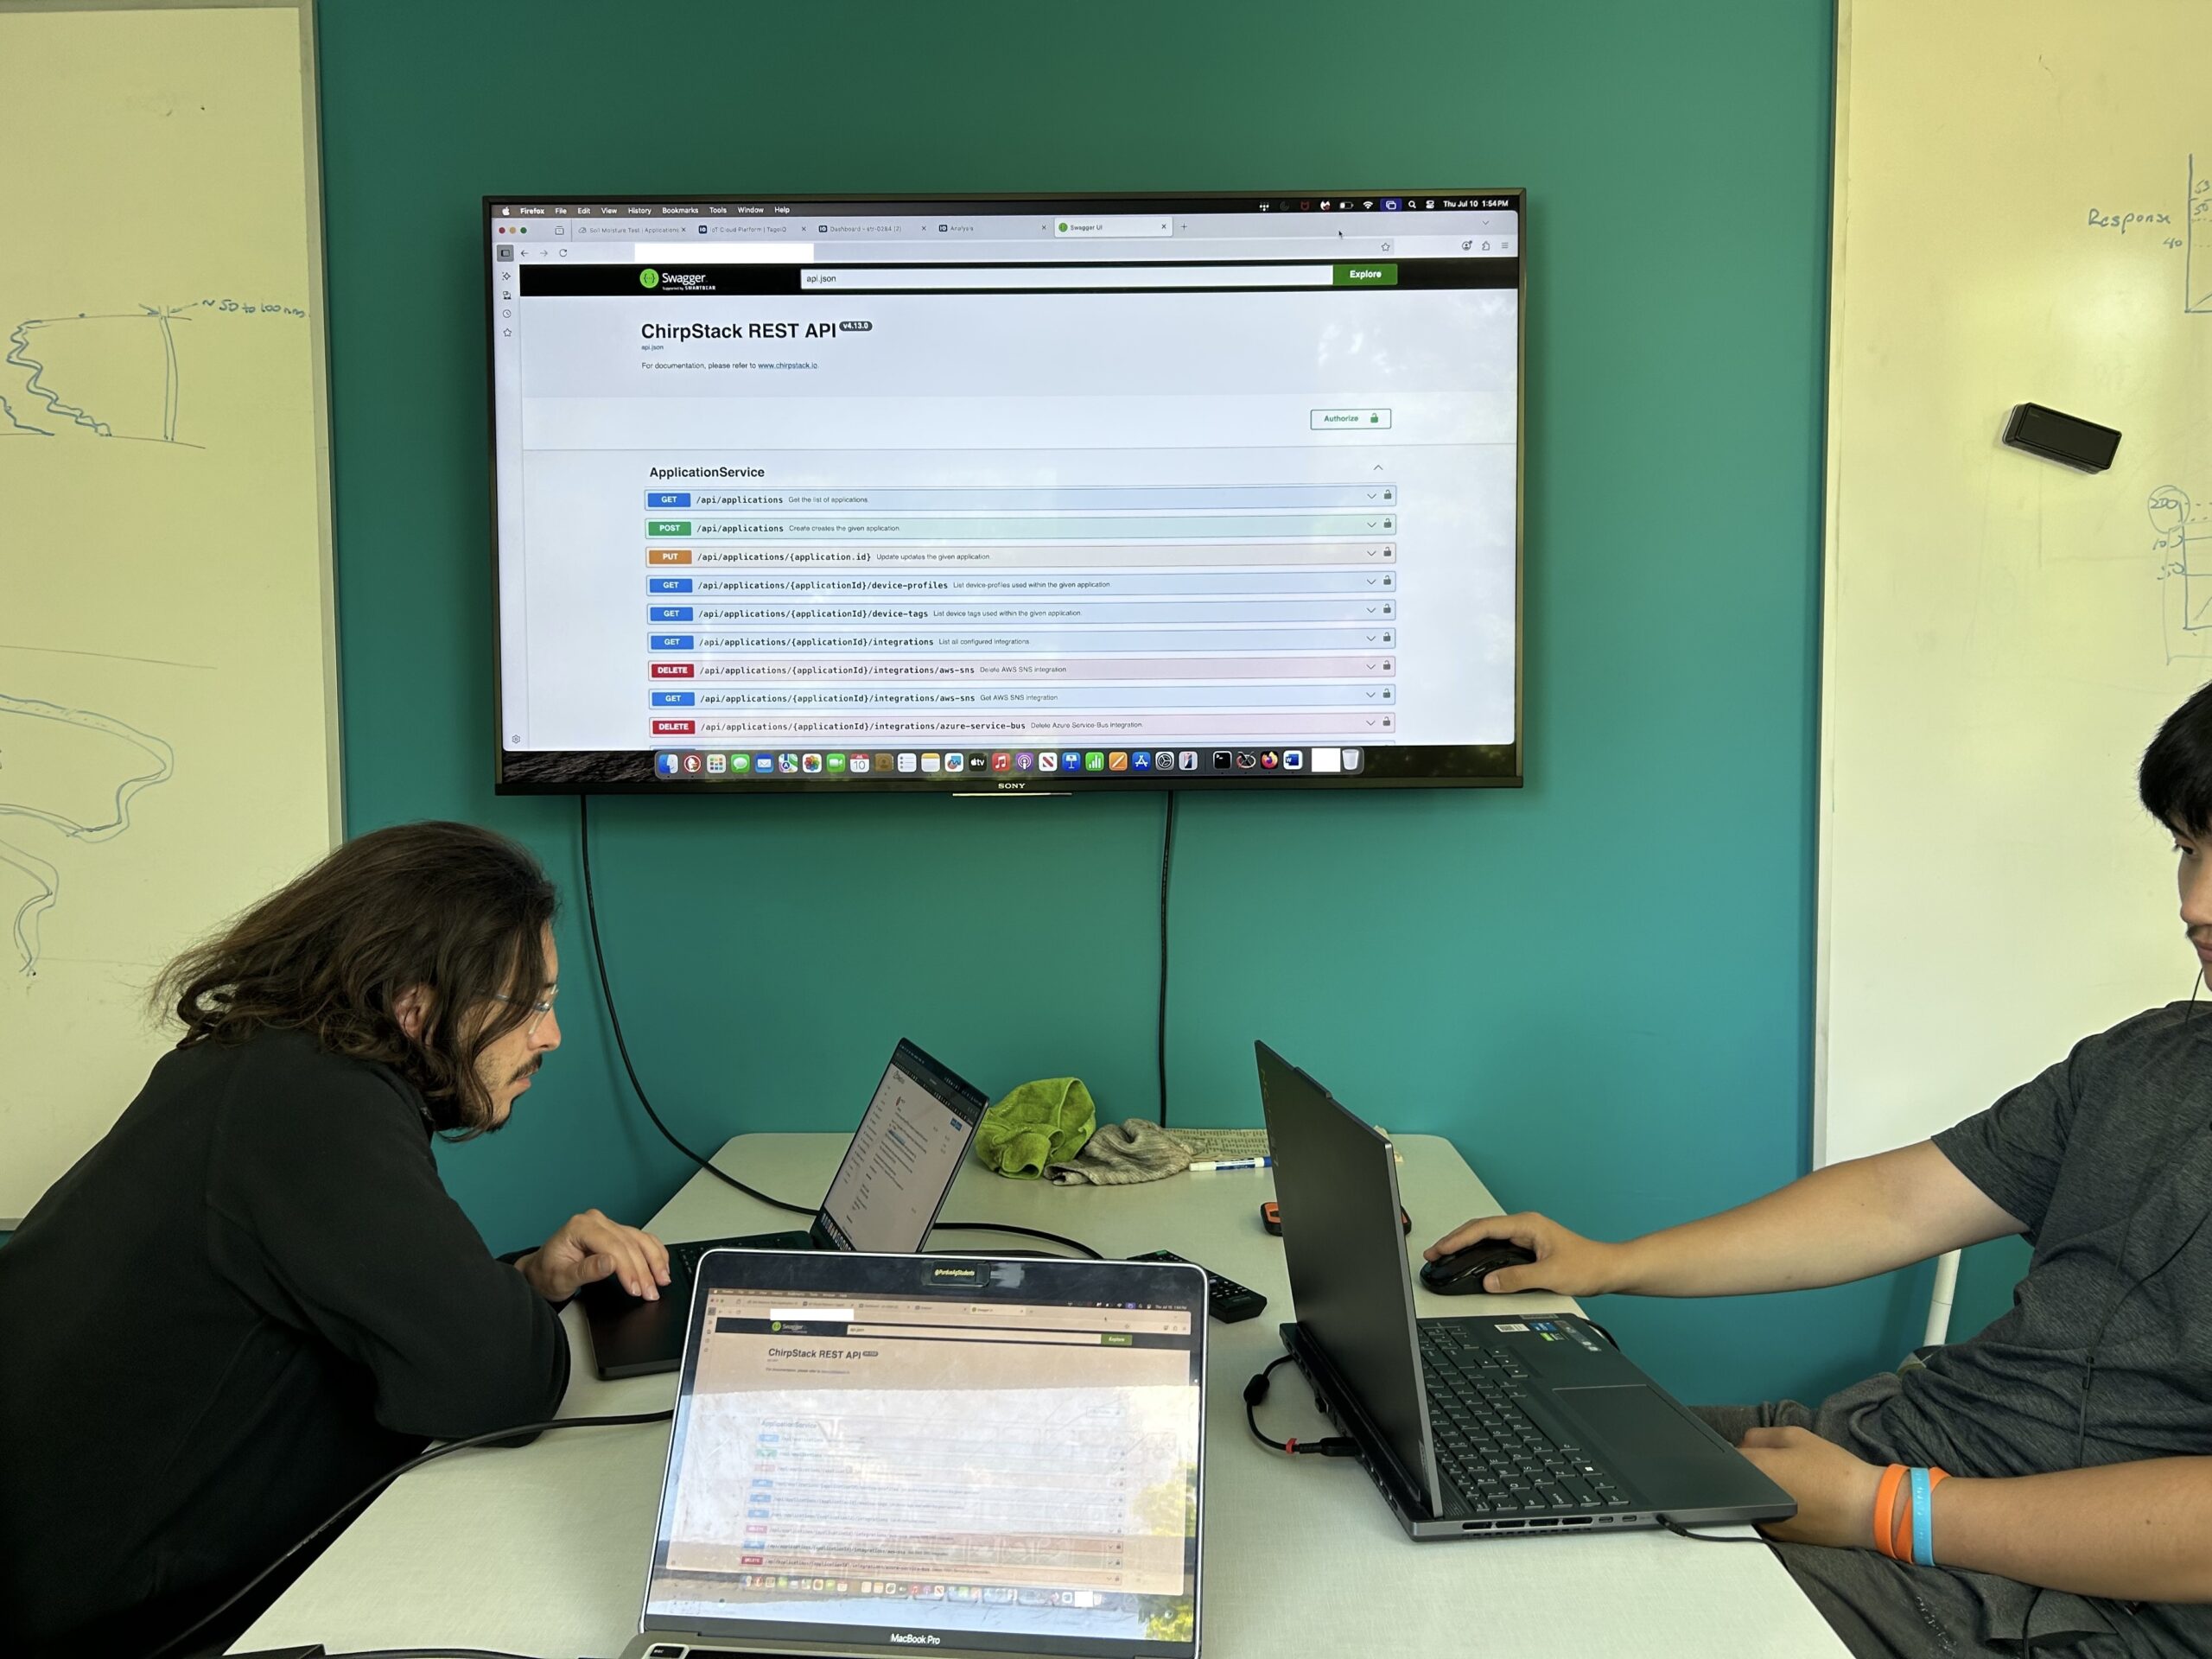
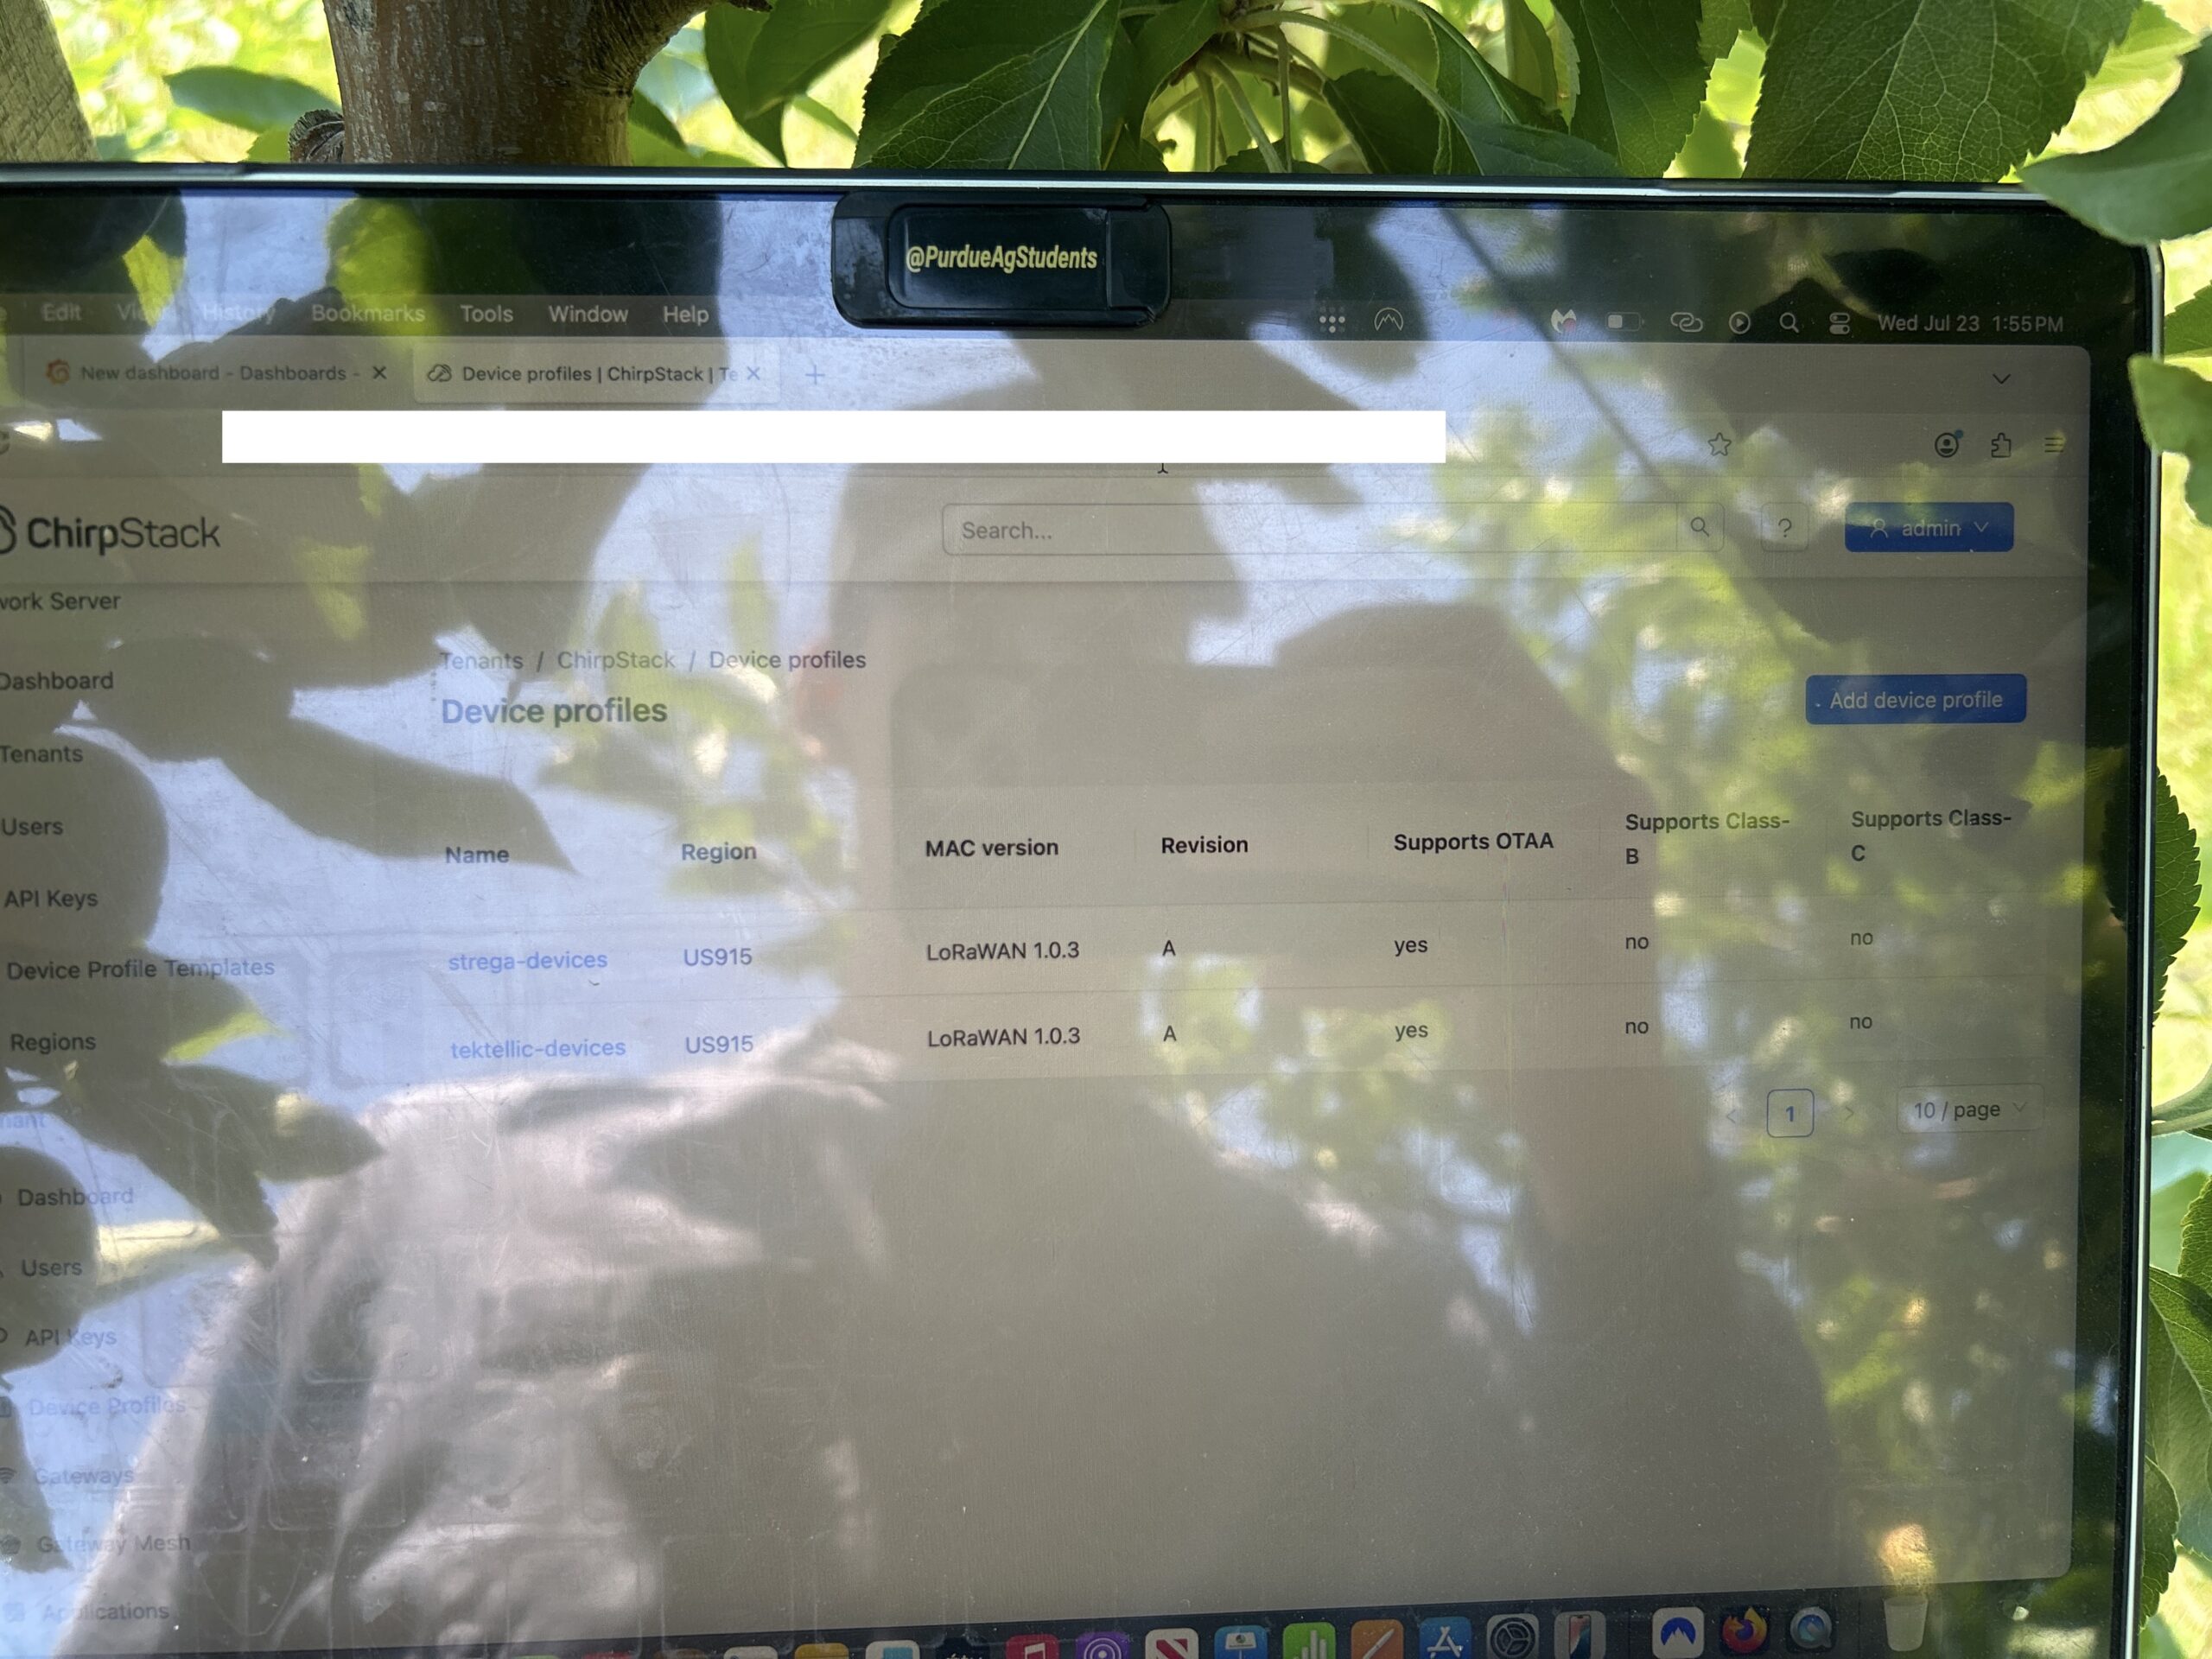
As we attempted to move more systems to Grafana, limitations became apparent in that many features required for agricultural dashboards were not available unless external plugins were developed for their specific use cases. These include the ability to easily import updated basemap imagery, draw field boundary polygons and create irrigation schedules. In general, we hoped to simplify backend challenges in the data pipelie for applications such as sending downlink commands to smart valves to turn them on/off so if issues occurred, they’d be easier to solve. Plus, Grafana is not as mobile friendly to date, although dashboards can be accessed from any device with internet access. Therefore, we decided to focus exclusively on TagoIO, which we already had experience with from the smart valves. Some advantages of this new approach are it simplified our data pipeline (now only the default gateway manager, ChirpStack, and TagoIO need to be managed), the ability to parse payloads live with TagoIO’s features, create dashboards very quickly, automate devices out of the box, and now deploy them to mobile applications using TagoRUN. Some disadvantages are TagoIO has data retention limits (up to 9 years of storage), limits on the number of messages that can be sent per month (unless paying for more), and pricing tiers that can restrict the number of devices a farm can connect affordably. The data limits especially stress the importance of payload parsing, which is easier being able to do it live in the TagoIO platform, but still requires a level of coding. We were able to use ChatGPT and import sensor documentation into chats, add specifications on variables we wanted to save and how the data would be used, and get mostly correct payload parser scripts to copy/paste into TagoIO, but it wasn’t always the best. TagoIO does offer engineering services and users can pay a fee for payload parsers for each device they use, but it can be expensive if just used for a farm setting. Hybrid approaches to the data pipeline were explored as well, especially with an interest in being able to store historical data permanently, but nothing seemed comprehensive enough to work. While TagoIO enables you to export data to databases and in file formats, it would be ideal to be able to continue viewing all data collected in the same dashboard.
In the summer of 2025, we had room in our grant to get an inexpensive drone, the DJI Mini 4 Pro, and test if we could conduct orchard mapping and acquire updated basemap imagery at a more affordable cost. We were successfully able to fly the drone using maps generated from WaypointMap Premium, an affordable online tool for mapping autonomous missions for supported drones, including the DJI Mini series. Flights were tested at various heights above the ground, and we were able to get the most complete orchard maps when flying at the maximum allowed altitude (slightly under 400 ft) but got much better resolution when flying lower to the ground, such as 90 ft. The maps generated from WaypointMap glitched a bit for us, particularly when attempting to use hundreds of waypoints for lower altitude flights, leading us to consider whether it fully met our needs for large-scale farm mapping. Battery limitations were also an issue (40 minutes of flight time but really closer to 30 considering safety procedures), but it’s not an uncommon problem for drones. We were able to complete a full map of a small orchard section and stitch the images together using a free trial of Pix4D. However, when we overlayed the results in QGIS, there were some discrepancies. For those interested in large scale drone mapping, we suggest exploring higher-end drones equipped with RTK GPS for enhanced precision, along with more advanced autonomous drone software for efficient extensive area land coverage.
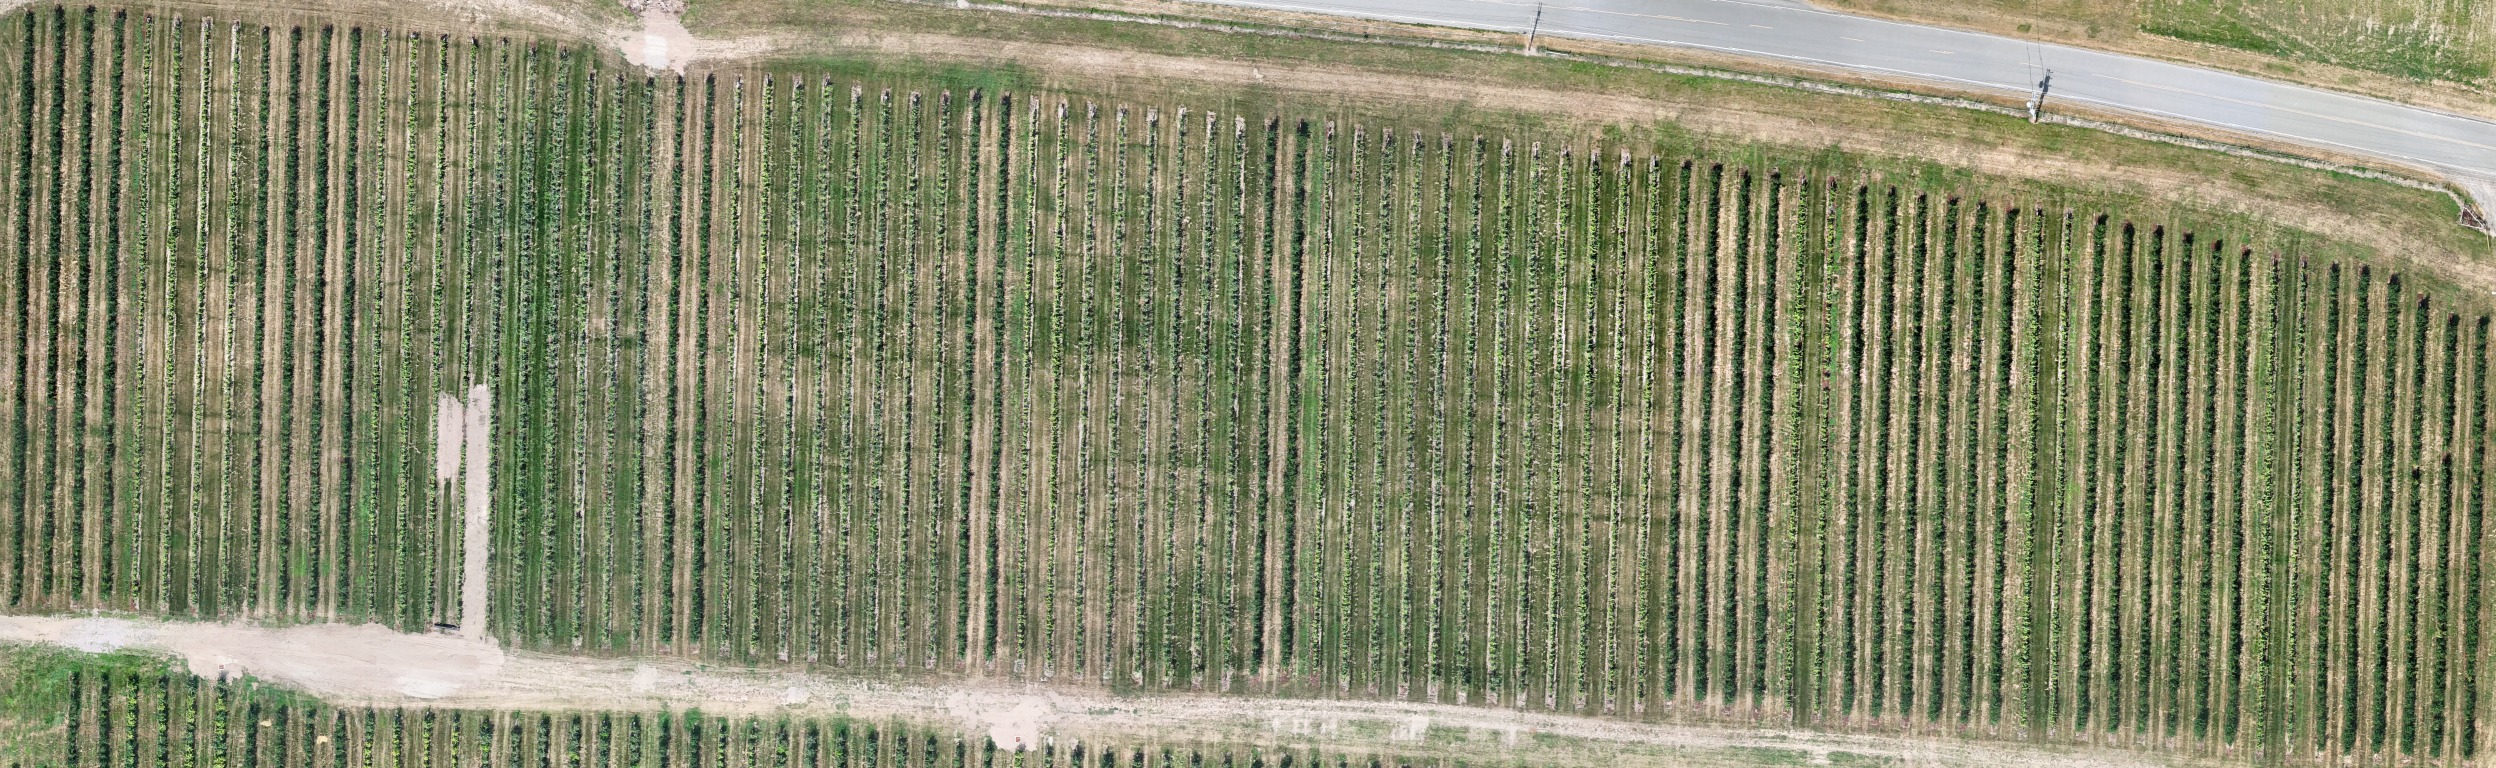
Because of the nature of our project, experimentation and testing of each objective were frequent and throughout the development process, reflective of a true R&D phase. To make the system more resilient, we started with our focus on the closest block of orchard to our gateway and tested the system over longer periods to observe data collection and infrastructural stability, all while learning how to adapt our systems to the weather and environment of the Northeast.
References
Bailey, J. K. (2025). IoT and generative AI for enhanced data-driven agriculture (Master’s thesis, Purdue University Graduate School). https://doi.org/10.25394/PGS.28899107.v1
The project demonstrated that a LoRaWAN-based agricultural monitoring and automation system can provide meaningful operational value in a commercial orchard, but performance varies significantly depending on subsystem complexity, hardware reliability, and environmental conditions. Across all components, the most consistent outcome was that basic sensing applications (facility monitoring, fuel tanks, and environmental data collection) were highly reliable and immediately useful, while more complex systems (irrigation automation, high-frequency GPS tracking, and low-cost soil sensing at scale) showed mixed performance and required substantial redesign or adjustment.
Gateway deployment confirmed that a single strategically placed LoRaWAN gateway can achieve near-farmwide coverage, but environmental features such as dense tree groves create measurable signal degradation and localized communication gaps. This led to the conclusion that a clustered gateway approach may be necessary for long-term reliability and redundancy. A shift to cloud-hosted infrastructure further improved system resilience by removing reliance on on-site computing hardware and reducing maintenance and cybersecurity burdens.
In irrigation management, soil moisture sensing provided useful but inconsistent data at scale. Only a subset of sensors produced stable readings, but those that did enabled actionable insights into soil drying patterns and directly influenced irrigation scheduling decisions. Despite reliability issues, the system also demonstrated unexpected value in off-season applications such as nursery tree storage monitoring. Irrigation automation via smart valves showed promise in remote control capability but suffered from mechanical reliability issues, with several valves failing over time. This highlighted that actuation hardware, rather than connectivity, is the primary limiting factor in scalable automation.
Other sensor systems produced clearer operational benefits. Facility monitoring sensors proved to be one of the most successful outcomes of the project, enabling remote oversight of cold storage, equipment buildings, and environmental conditions, particularly during extreme winter weather. Fuel tank monitoring also performed reliably and required minimal maintenance once installed. Asset tracking provided useful operational visibility during harvest but was constrained by battery limitations and transmission frequency tradeoffs, making it more suitable for low-frequency logistics tracking rather than real-time precision movement monitoring, unless wired trackers are available.
Finally, data integration efforts showed that while open-source tools like Grafana offered flexibility, a simplified pipeline centered on ChirpStack and TagoIO provided a practical and maintainable solution for a private farm level deployment. Overall, the project demonstrated that incremental adoption of robust, well-supported IoT components yields the most dependable improvements in farm operations, while an overemphasis on inexpensive or minimally supported systems often introduces reliability and maintenance challenges that outweigh their intended benefits.
The objective of this project was to test a LoRaWAN-based system on a commercial orchard to improve farm management through real-time data collection, automation, and decision support. Specifically, the project aimed to test applications including soil moisture monitoring for irrigation management, remote valve automation, weather data collection, asset tracking, fuel tank monitoring, and centralized data visualization, while assessing feasibility, reliability, and scalability in a real-world farm environment.
To achieve this, a cloud-based IoT data pipeline framework was developed. A LoRaWAN gateway was installed and optimized to provide farm-wide coverage, with range testing conducted using soil moisture sensors to measure signal strength and reliability.
Multiple sensor systems were deployed and evaluated. Soil moisture sensors were installed using GIS-informed placement methods to represent irrigation zones, and while some sensors provided actionable data (e.g., identifying water retention rates and influencing a shift from irrigating two subzones per day to three), overall data consistency was limited due to sensor reliability and placement challenges. Irrigation automation was partially successful, with LoRaWAN-controlled smart valves enabling remote operation; however, hardware reliability issues (including failure rates of up to 50% within one season) prevented full adoption.
Additional systems were tested with mixed results. GPS asset tracking demonstrated usefulness for monitoring general equipment location, though battery limitations restricted data frequency and precision. Weather station integration faced technical and compatibility challenges, delaying meaningful data collection. In contrast, fuel tank monitoring and facility monitoring sensors (temperature, light intensity, door status) performed reliably and required minimal maintenance.
The project successfully answered its core question: while a privately managed LoRaWAN-based smart farm system is technically feasible, it is not yet a turnkey solution for most farms due to challenges in device reliability, system integration, and required technical expertise. However, specific components of the system proved highly effective and are being adopted.
Irrigation insights from functioning soil sensors led to improved scheduling decisions, optimizing water usage based on observed soil behavior rather than fixed schedules. However, the most impactful and scalable improvements came from facility monitoring and selective sensor deployment. For example, remote temperature monitoring in storage buildings and facilities reduced the need for manual checks and enabled proactive responses during extreme winter conditions, helping prevent freeze-related damage and reducing labor requirements.
In conclusion, while full system integration remains complex, targeted adoption of reliable, low-maintenance IoT solutions can readily deliver measurable operational benefits.
Education & outreach activities and participation summary
Participation summary:
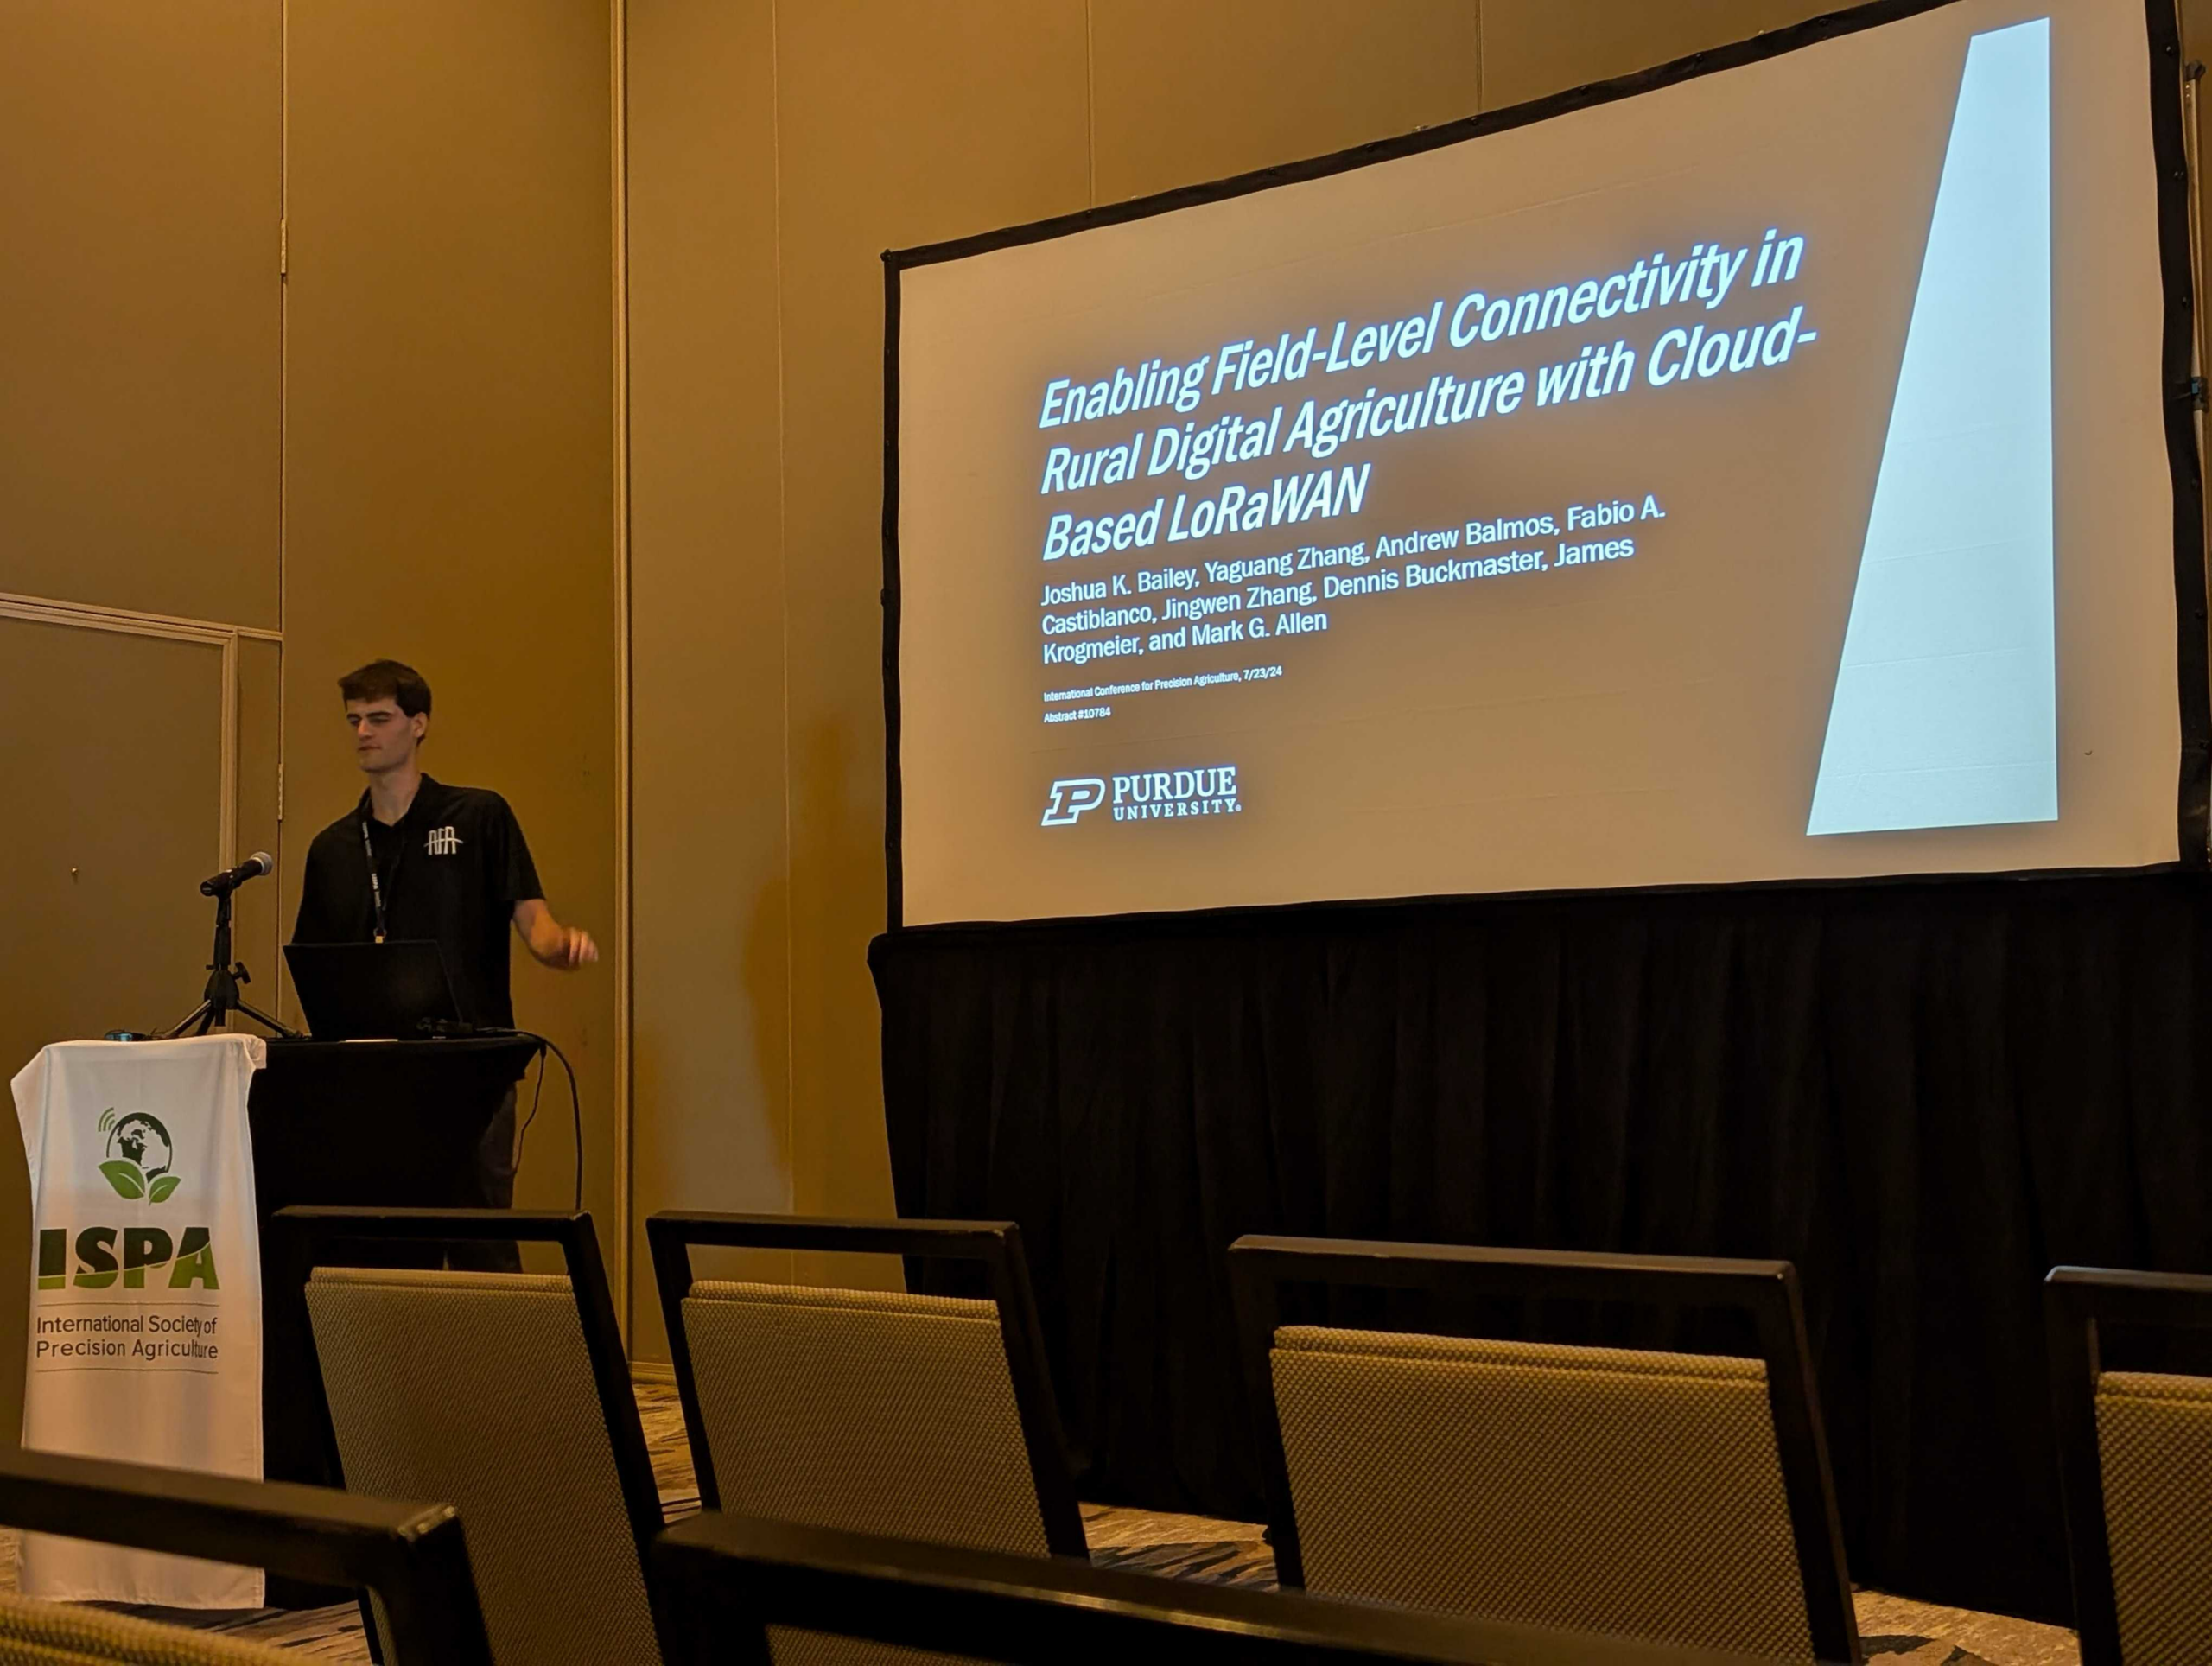
Elements of this project were completed, presented, and published during my time as a graduate student at Purdue University. A lot of the agrosecurity and cloud-based data pipeline components concepts were developed for an agricultural informatics class, I was able to help assemble and deploy Solar-Powered Remote IoT4Ag Network Gateways (SPRINGs) at two of the University of Florida’s research farms, I supported the deployment of a SPRING at the University of Pennsylvania, and I continued to collaborate with OATS members on this project and related work at the Purdue Agronomy Center for Research and Education (ACRE). I also attended academic conferences including the International Conference on Precision Agriculture in Manhattan, Kansas over the summer of 2024 and was able to share results related to this project and learn from others.
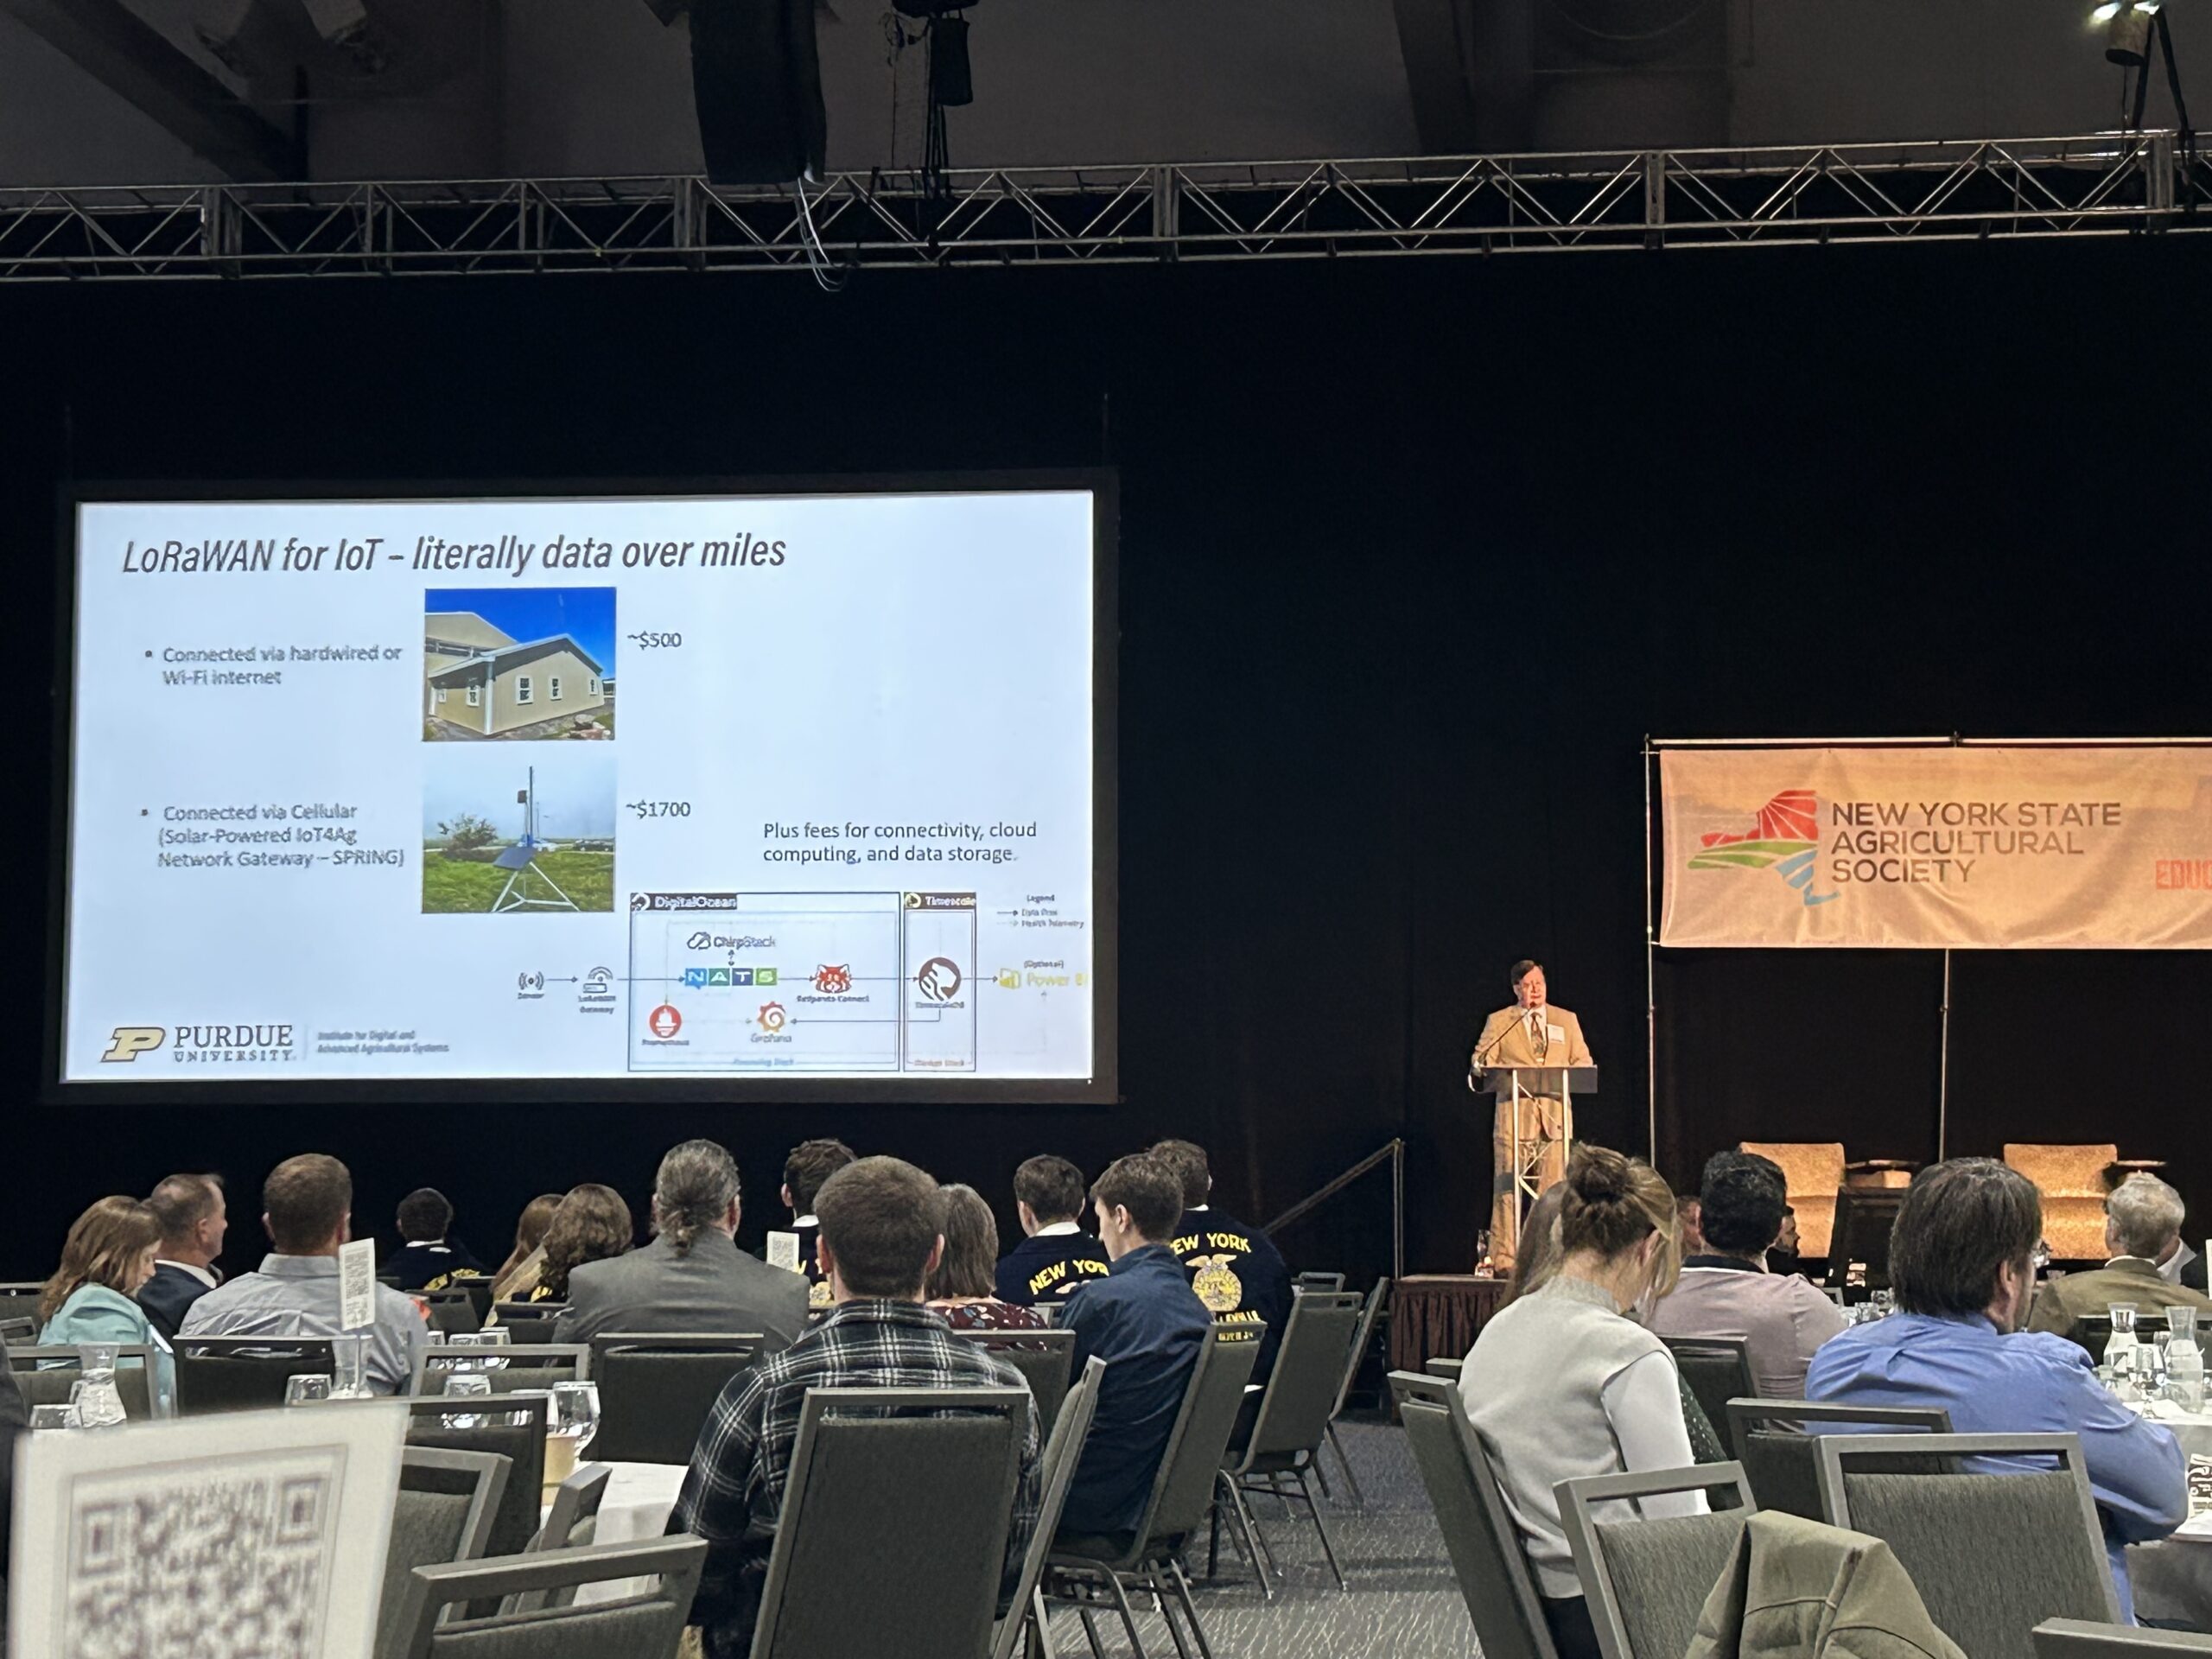
My major professor (Dr. Buckmaster, also a technical advisor for this project) has been able to share results in additional presentations including at the New York State Agricultural Society 193rd Annual Forum in the winter of 2025.
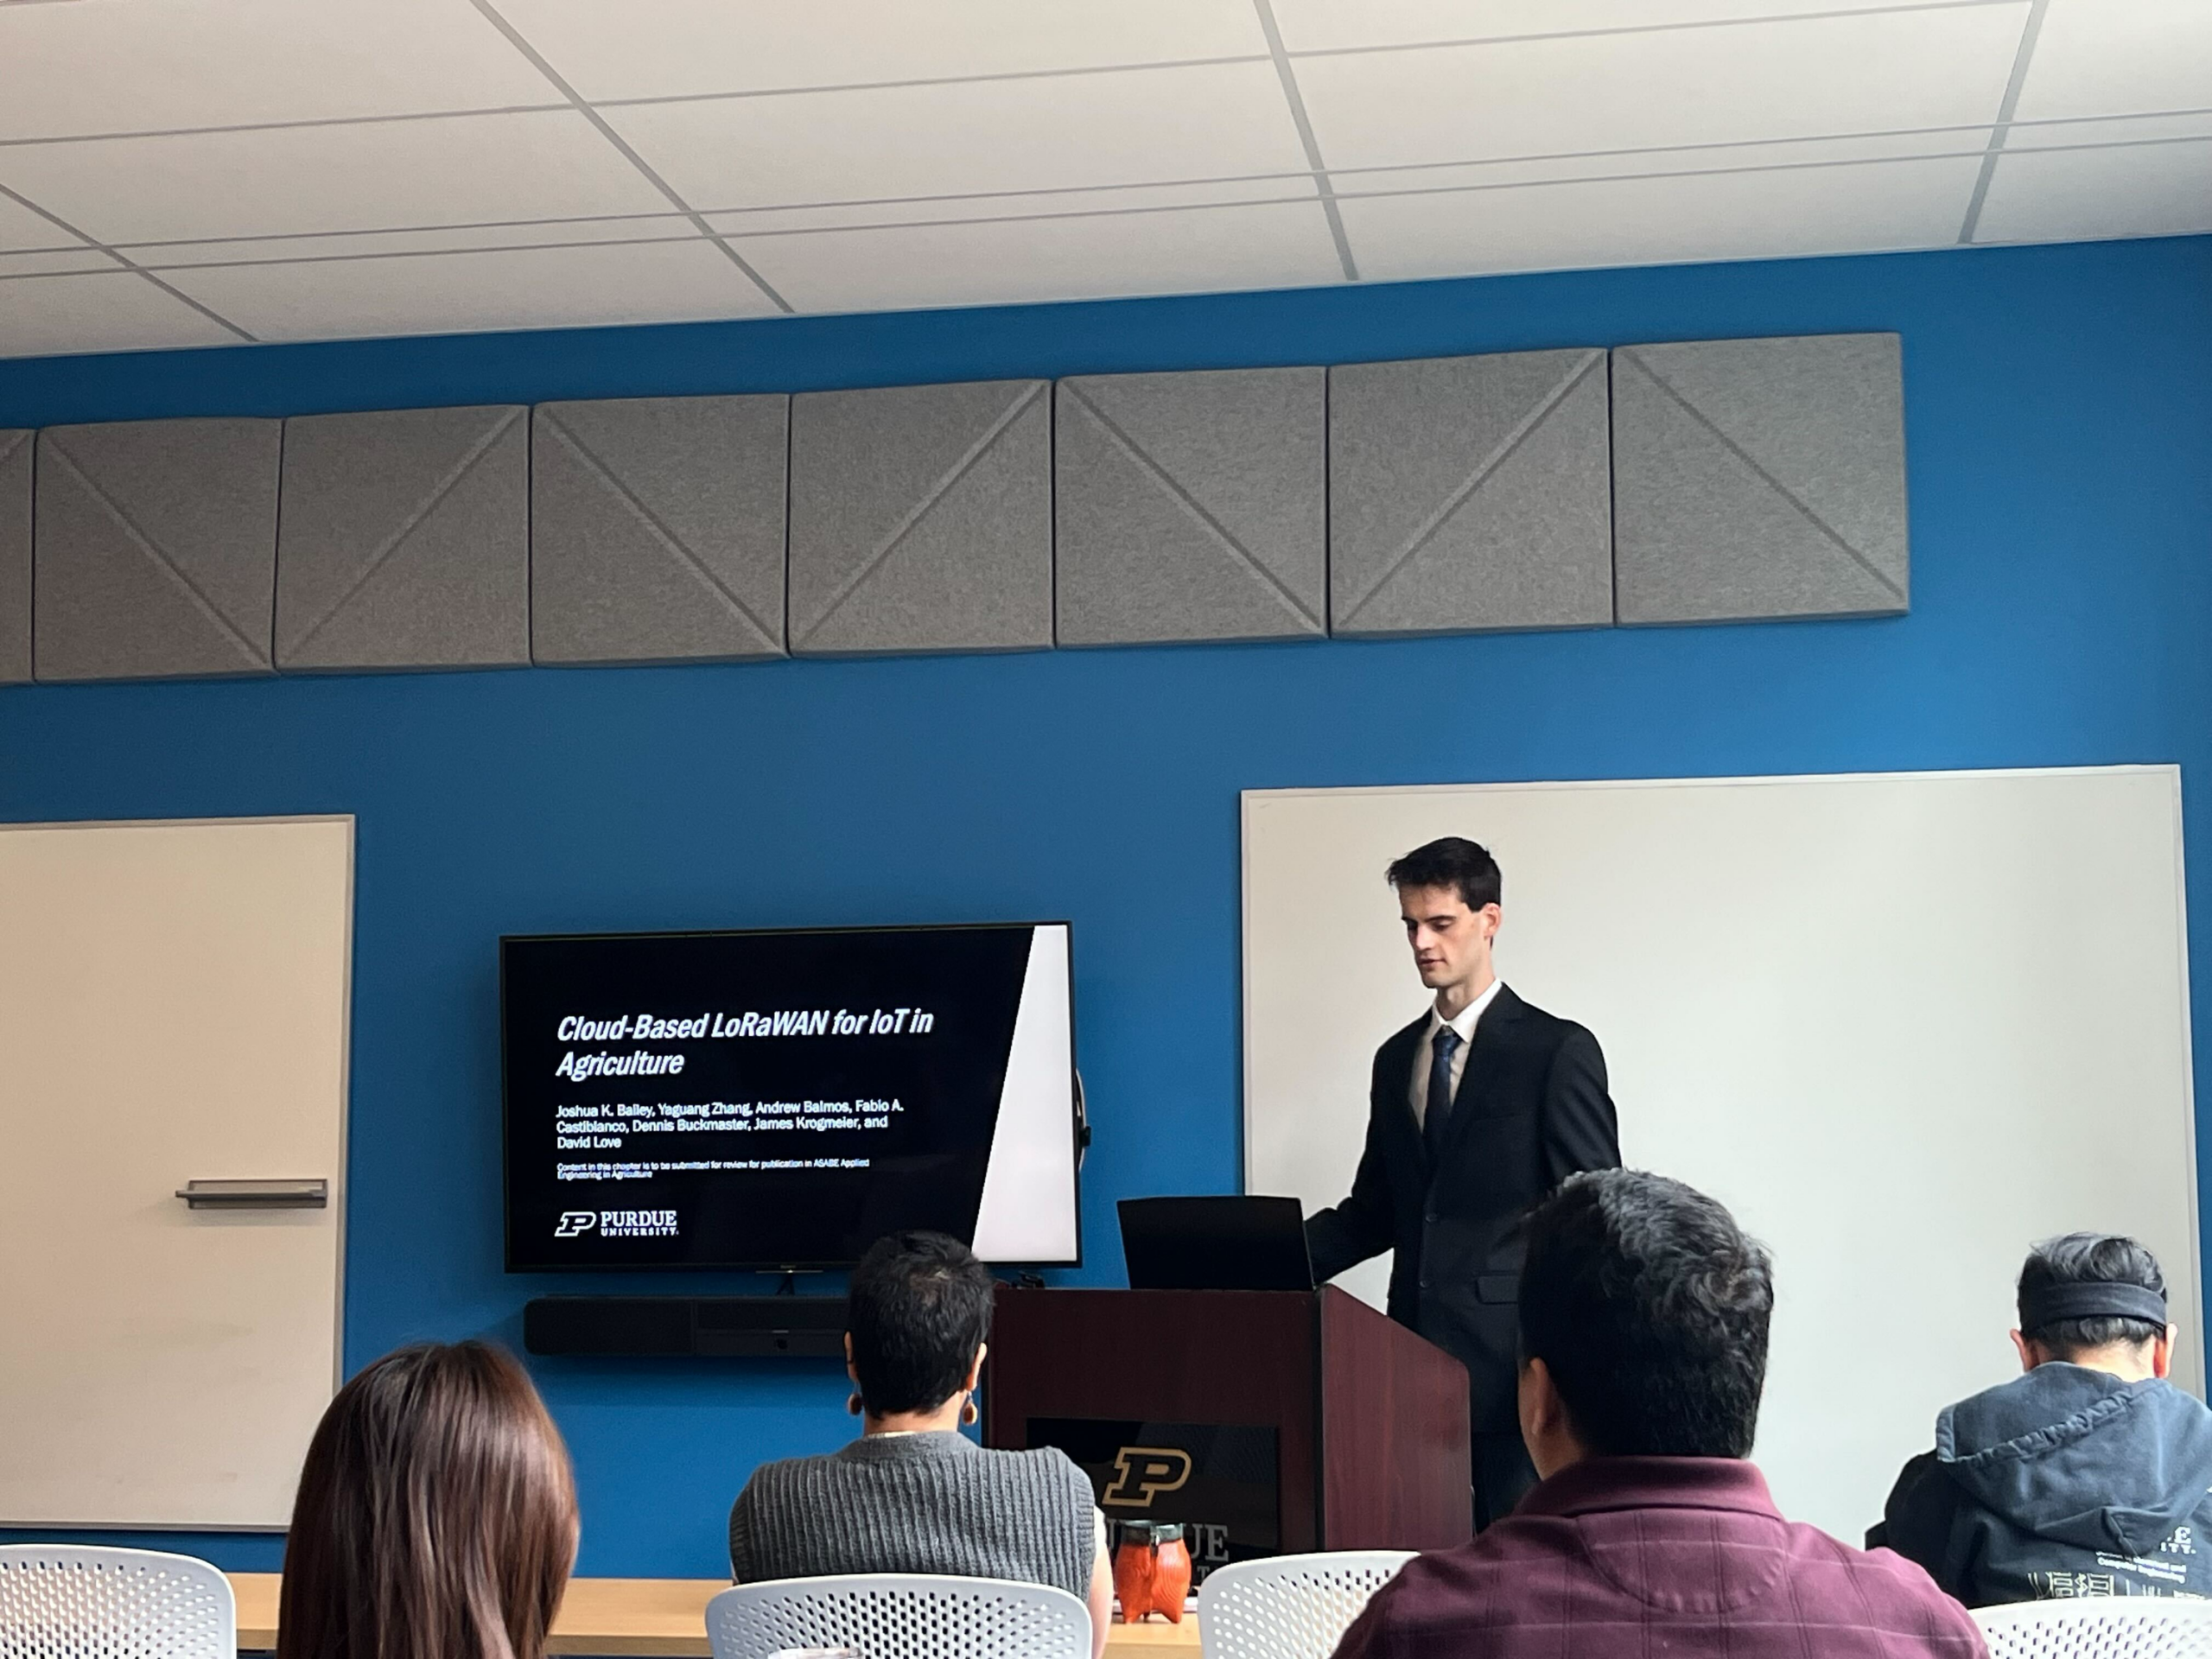
Half of my master’s thesis was dedicated to this topic and successfully defended in April, 2025.
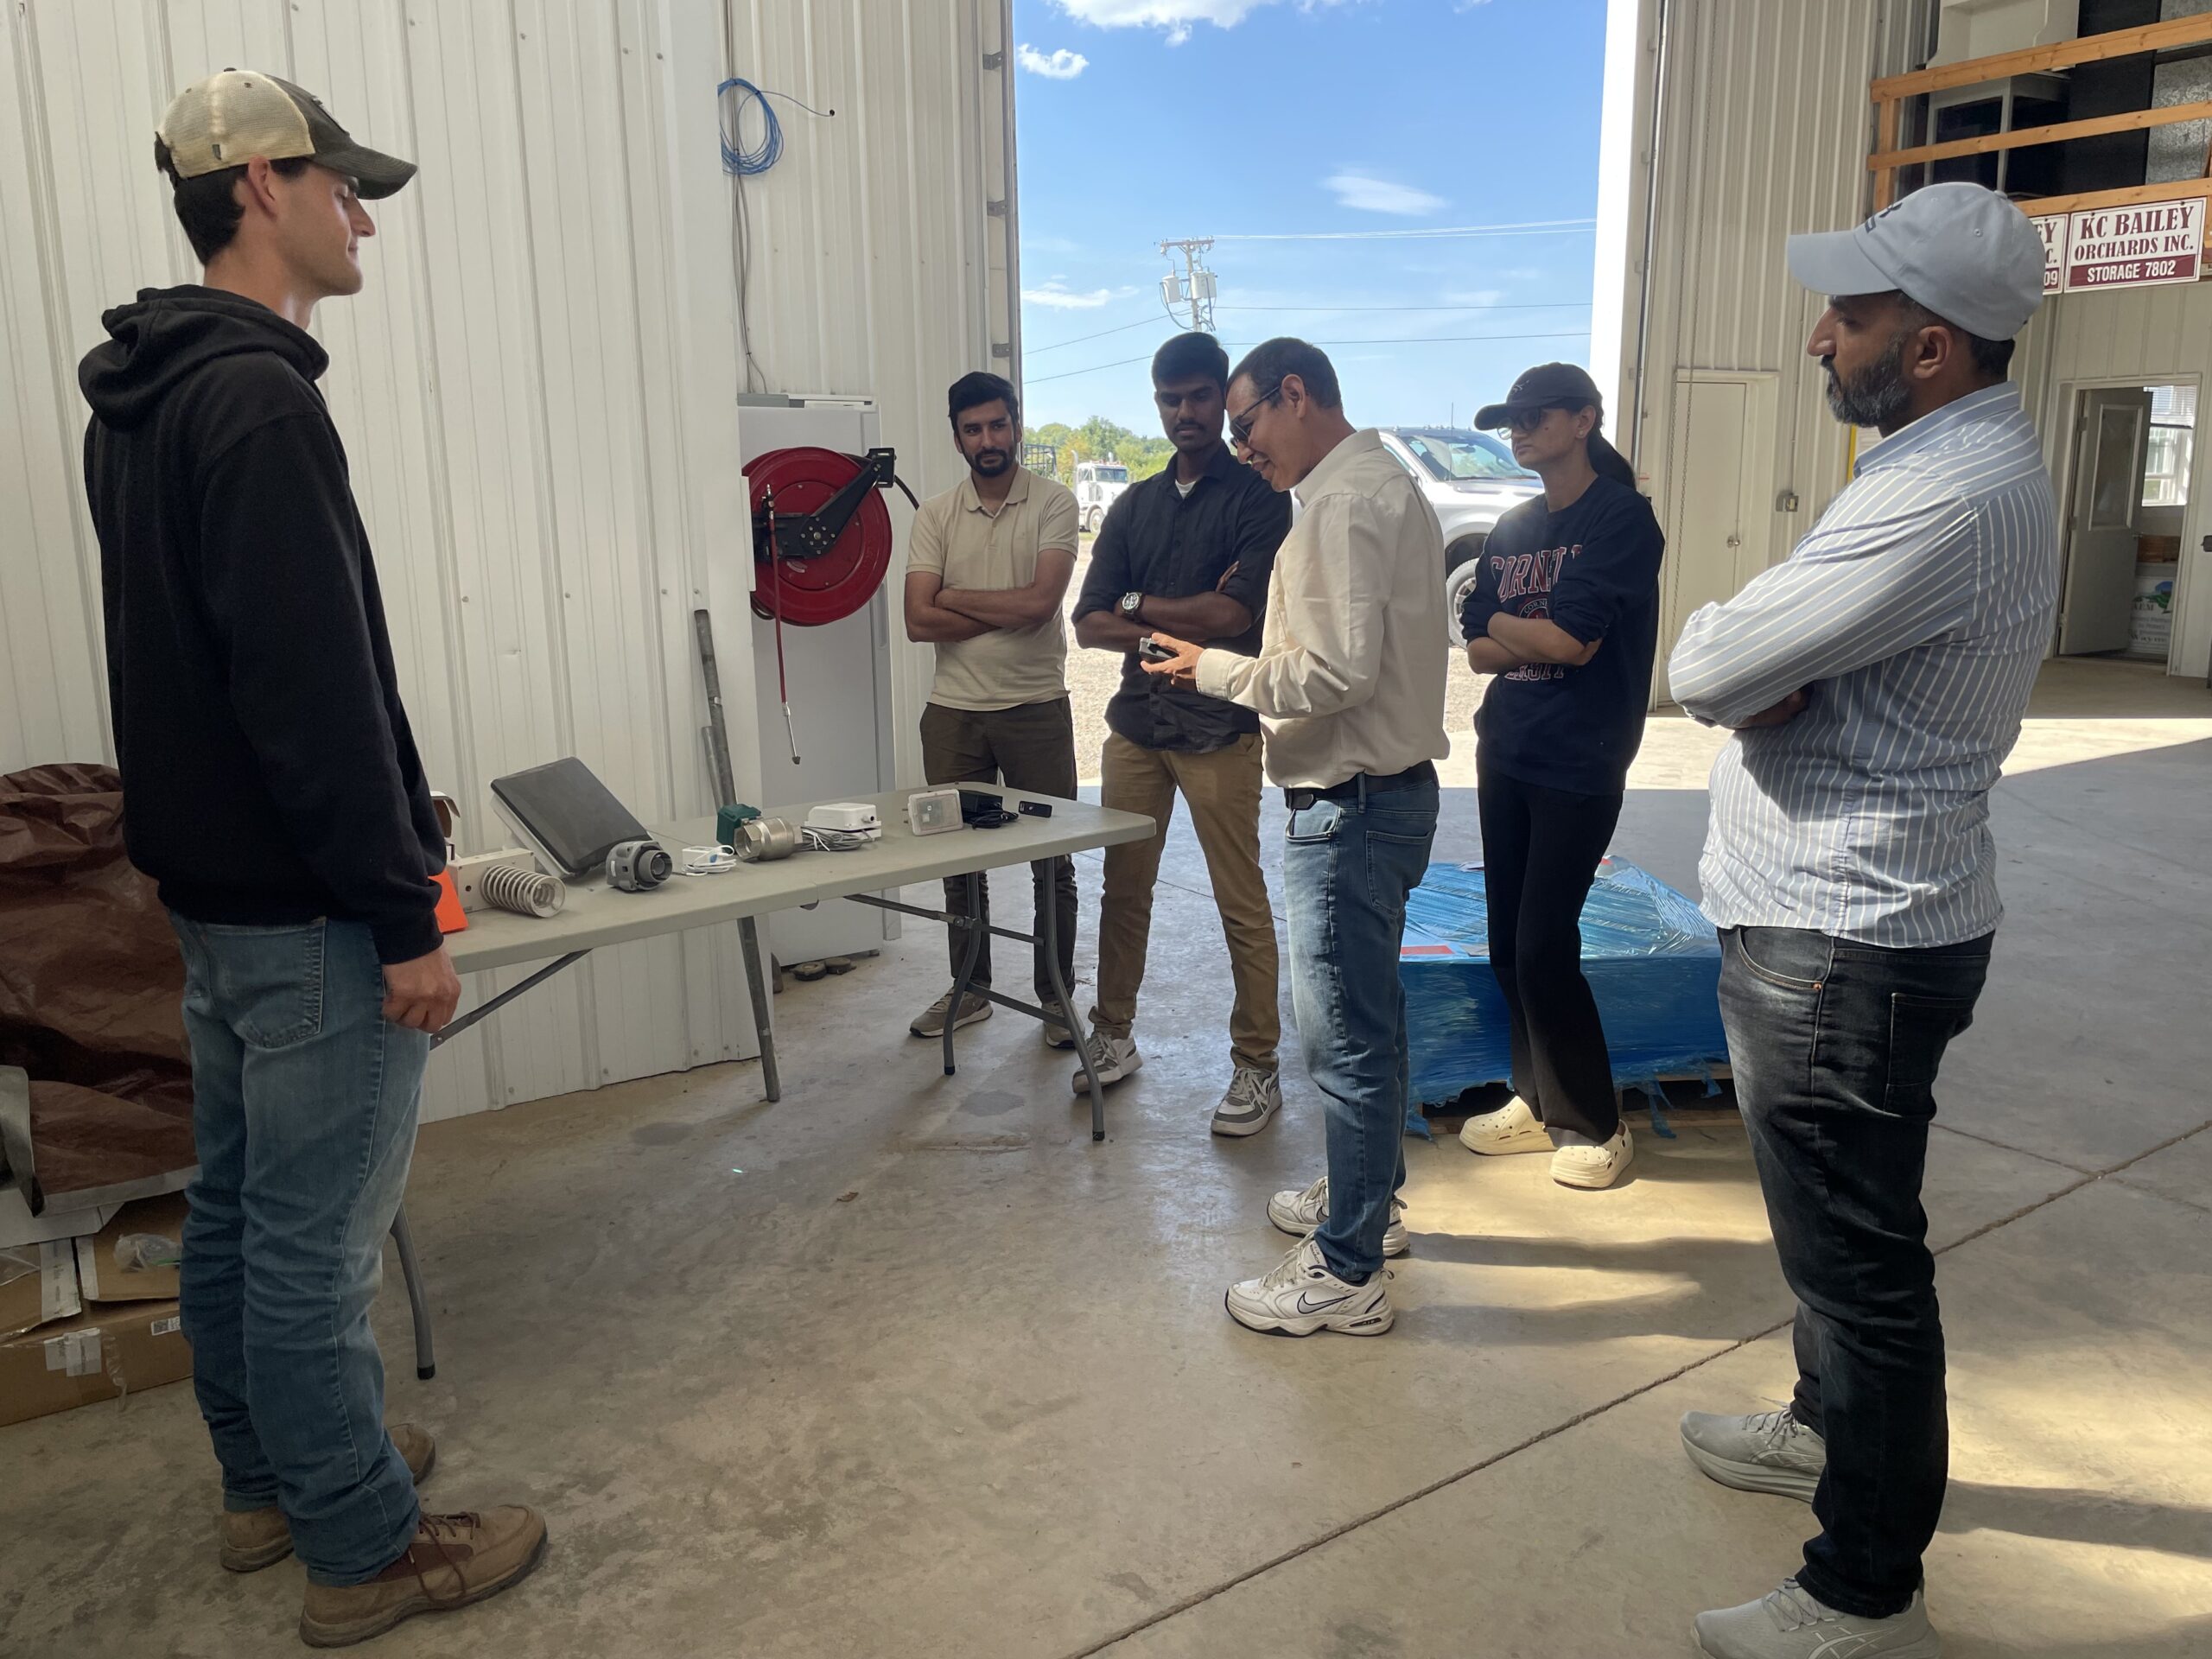
After the thesis defense, I helped deploy another SPRING at the Purdue Student Farm. After graduating, I’ve continued my involvement with IoT4Ag and supported the center’s efforts with the experiences gained through this project and have met with students to talk about how we’ve used systems developed through the OATS Center and IoT4Ag on a commercial farm. As mentioned in the Methods and Materials section of this report, some of our sensor data was even used for educational materials created by IoT4Ag researchers to connect students in middle and high schools to real farm data. Back on the farm, I’ve been able to network with groups from other universities as well, such as the Ag Robotics Lab from Cornell University and share with them what we’ve worked on through this grant.
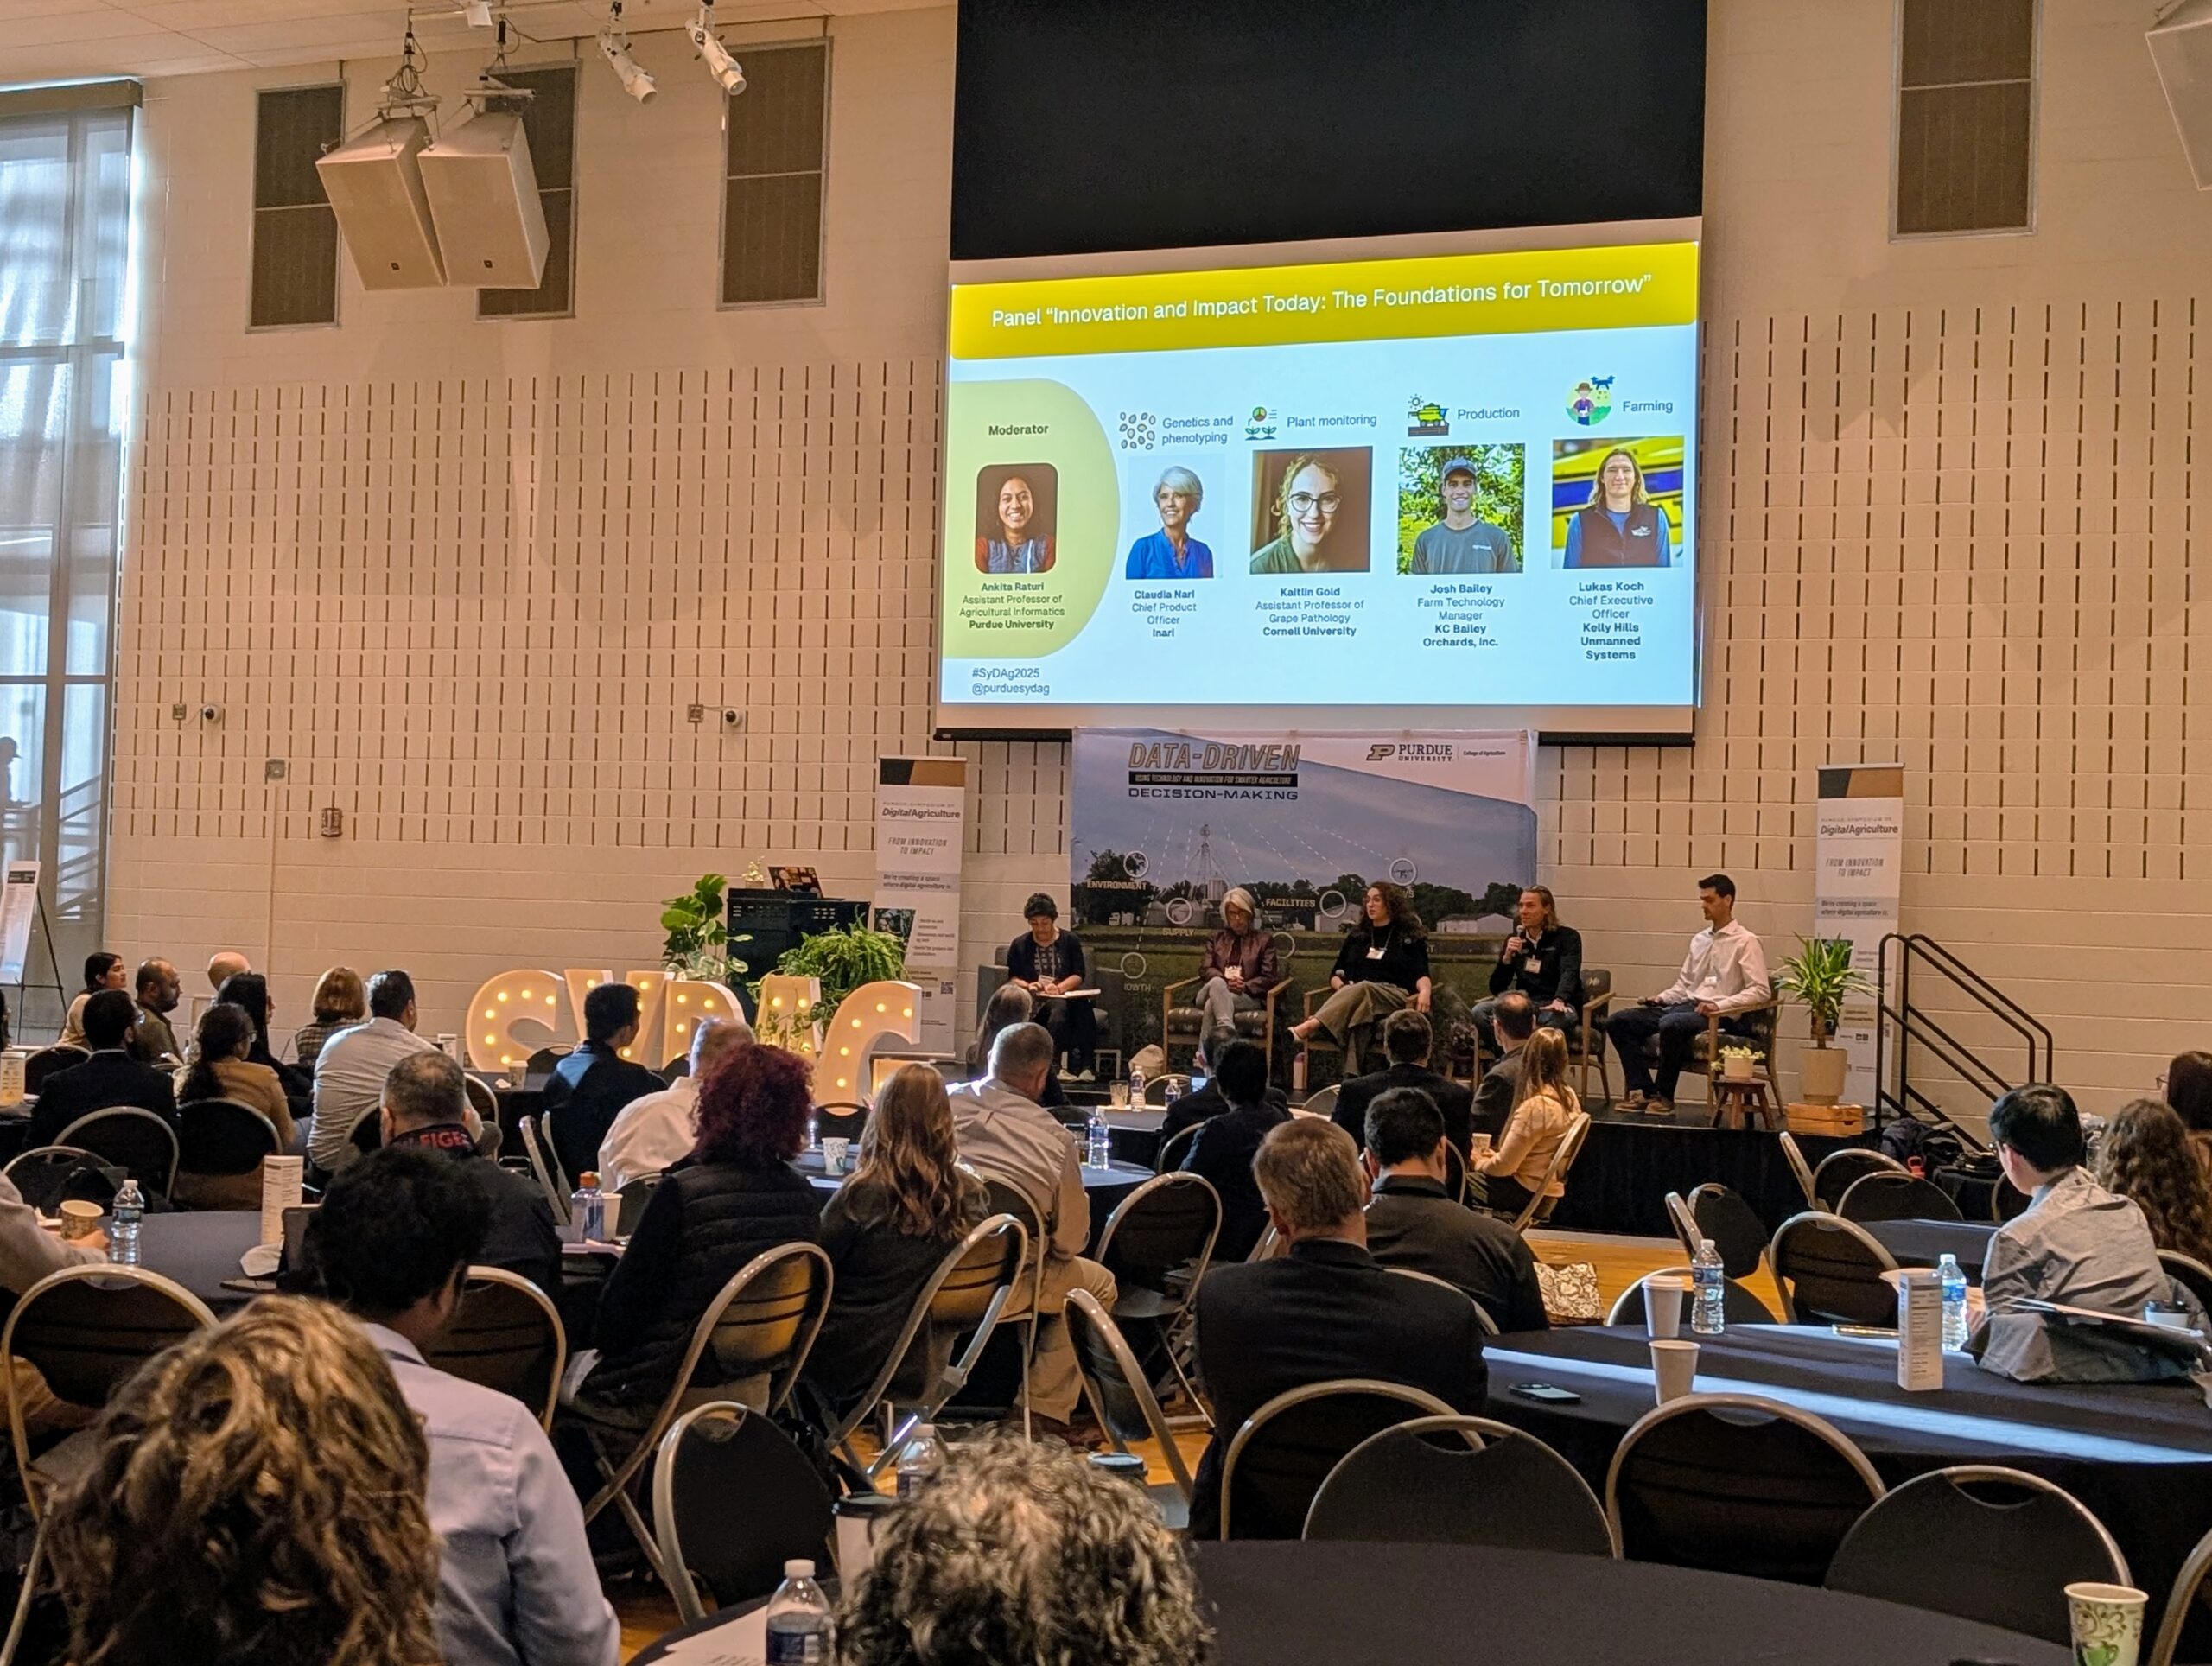
In the fall of 2025, I had the opportunity to come back to Purdue for the first ever Symposium of Digital Agriculture and speak on a panel titled "Innovation and Impact Today: The Foundations for Tomorrow” and talk about our experiences with digital agriculture on our farm, a lot of which had to do with this grant.
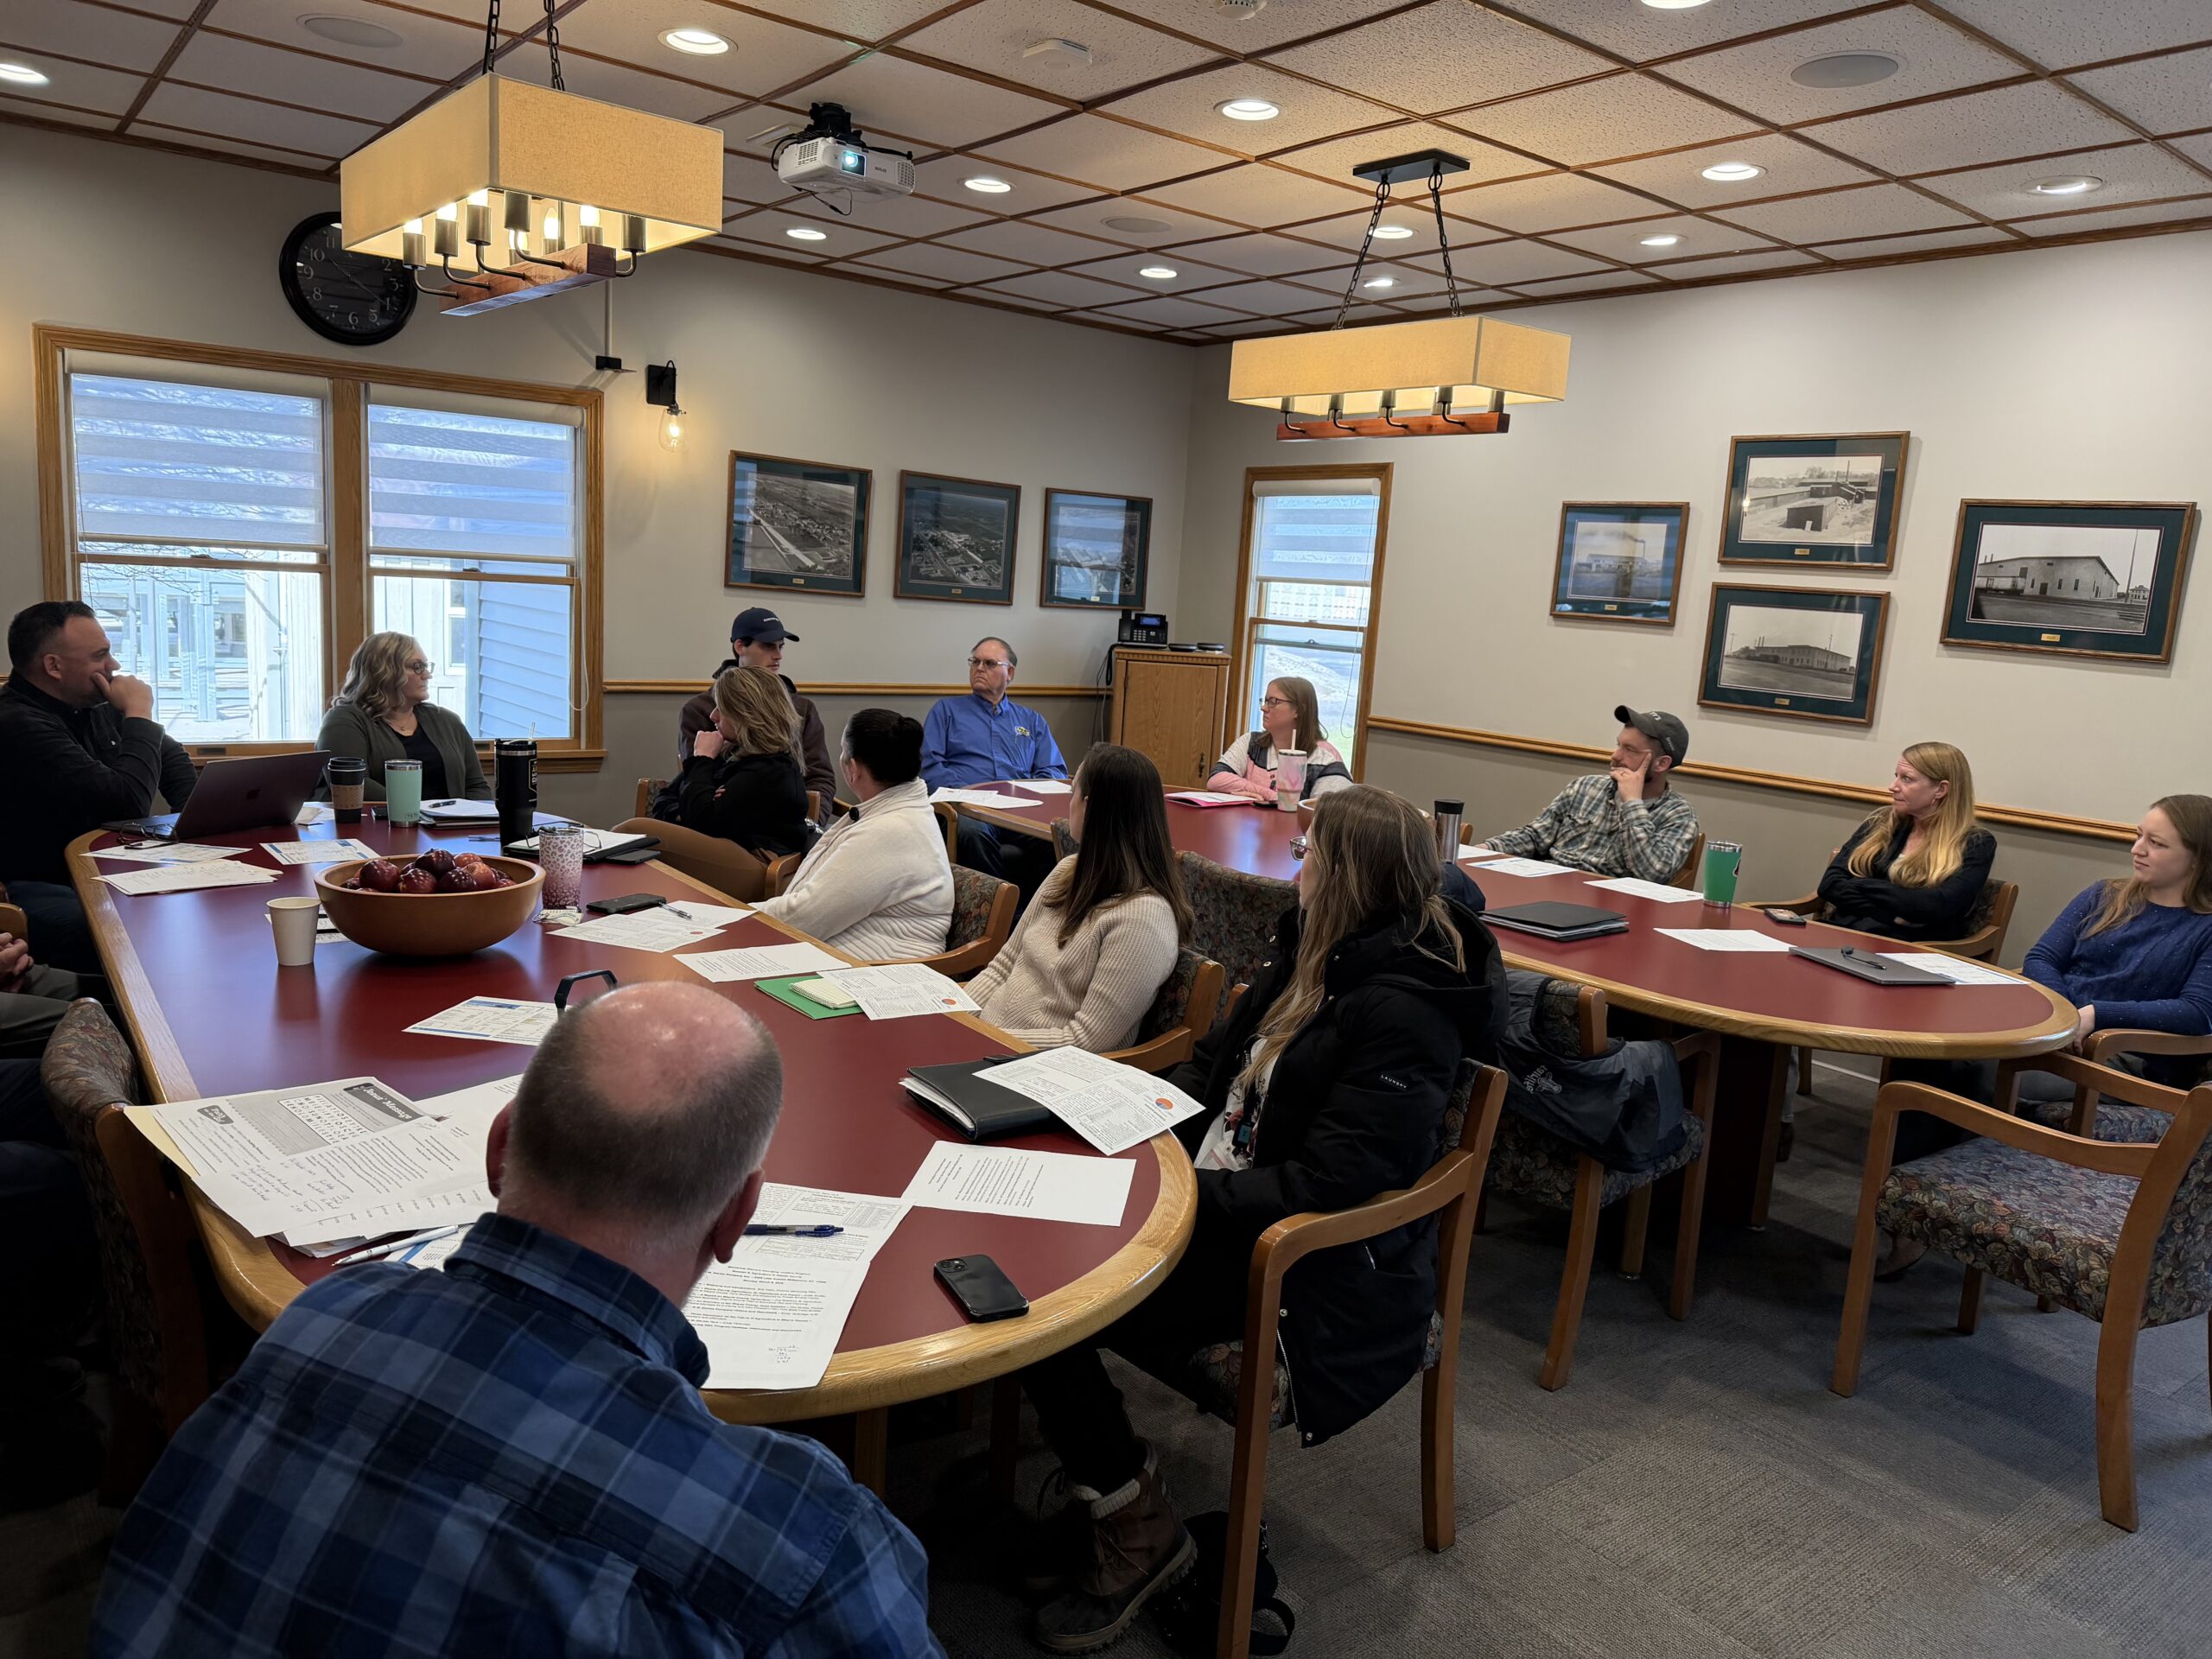
Lastly, I was able to attend the Session 5: Agriculture in Wayne County event for the Mentoring Wayne’s Emerging Leaders Program in March 2026 and sit on a panel discussion talking about the future of agriculture in Wayne County. Through this, I was able to present results from this project to local farmers, businesspeople, and government employees, and passed out an information flier at the end.
Learning Outcomes
Farmers participating in this project reported increased knowledge of how IoT and LoRaWAN systems function on a farm, including how sensors, gateways, and cloud platforms work together to collect and manage data. They better understand the strengths and limitations of different technologies, such as which sensors provide reliable data and how environmental factors can affect connectivity and performance. This experience also shifts attitudes where farmers have moved away from viewing these systems as simple, plug-and-play solutions and instead recognize the need for careful setup, ongoing management, and selecting the right tools for specific use cases.
In terms of skills and awareness, farmers gained hands-on experience installing sensors, interpreting data, and using dashboards to support decisions like irrigation scheduling. At the same time, they become more aware of the real-world challenges, including hardware reliability issues, data limits, and costs associated with scaling these systems. Importantly, the project showed that simpler applications such as facility monitoring and basic sensors provided the most immediate and dependable value while also being easy to manage within a private LoRaWAN system without requiring significant local support.
Project Outcomes
The greatest successes experienced were with simple facility monitoring sensors, which was a category not considered when initially writing the grant. This area holds promise for assisting farm managers in daily operations and can truly impact farmer livelihoods, providing peace of mind and confidence to step away from the operation for personal time, such as vacations during off-seasons.
Since the initial writing of this grant in 2022, many changes have taken place that have affected the outcomes of this grant project. In general, LoRaWAN in the U.S. is a fragmented but growing market, driven more by private enterprise deployments than nationwide public networks, with strong global momentum but less visible infrastructure compared to Europe. While our grant has produced successes in certain areas, it would be unwise to recommend this system as a turnkey solution for farmers: in the U.S., deploying private LoRaWAN networks often requires farmers to act as their own integrators—managing gateways, connectivity, and setup—and even with the simpler data pipeline we’ve moved to, it would still present technical challenges without strong local support. Additionally, sourcing devices from a fragmented global market introduces supply uncertainty, compatibility issues, and limited support, further increasing the complexity and risk of deployment.
Simple facility monitoring sensors are an exception to this, as they are relatively easy to deploy, require minimal integration, and consistently provide reliable, actionable data. These systems can be implemented without extensive technical expertise and offer immediate value in day-to-day farm operations, such as monitoring storage temperatures, preventing freeze-related damage, and improving overall management oversight. Their simplicity and dependability make them a practical entry point for farmers interested in adopting IoT technologies without requiring heavy support.
From a broader standpoint, recent efforts made by companies such as Emergent Connext are making it easier for farmers to adopt LoRaWAN technologies that span all facets of farming operations, showing promise in this space. While these are not privately-managed LoRaWAN deployments by the farm, they provide valuable support and software infrastructure.
Information Products
- Enabling Field-level Connectivity in Rural Digital Agriculture with Cloud-based LoRaWAN
- Enabling Field-Level Connectivity in Rural Digital Agriculture with Cloud - Based LoRaWAN
- Cloud-Based LoRaWAN for IoT in Agriculture
- IoT and Generative AI for Enhanced Data-Driven Agriculture
- IoT4Ag SPRING Portal
- Testing LoRaWAN in NY Apple Orchards