Final report for FNE23-037
Project Information
The purpose of this project was to test whether high-frequency environmental monitoring can improve farm-scale predictions of oyster growth and mortality and be translated into practical decision-support tools for commercial oyster farmers.
In 2024 and 2025, Ferda Farms paired continuous in-water environmental monitoring (a UMaine YSI sonde in 2024 and a Bluesonde satellite-connected buoy in 2025) with repeated oyster sampling from bags located adjacent to the sensors at approximately two-week intervals. In 2024, growth and survival were tracked on individually tagged oysters (three bags of ~75 oysters each), while in 2025 the farm used a scalable protocol based on aggregate bag weights (six bags of ~200 oysters each) to estimate average individual weight. Environmental variables (temperature, salinity, turbidity, chlorophyll, dissolved oxygen) were summarized over each sampling interval and analyzed using multivariable regression and generalized additive models for growth, and binomial logistic regression approaches for mortality, with model performance evaluated using out-of-sample prediction error.
Across both seasons, oyster growth was strongly seasonal and was largely explained by age/time alone. In 2024, adding environmental covariates consistently worsened prediction, increasing mean absolute error by ~3–5% and RMSE by up to ~10% relative to age-only models. In 2025, temperature provided a modest improvement in growth prediction (≈5% reduction in median absolute prediction error versus age-only). Mortality modeling differed sharply by year: in 2024, mortality was substantial (40 of 225 oysters died), and a contrast-based risk index identified a high-risk “stacked stressor” regime with modeled mortality risk of ~83% per interval when high chlorophyll variability and high temperature co-occurred, compared with ~1.1% under typical conditions; in 2025, mortality occurred in only two sampling intervals, making regression-based mortality inference unstable and results primarily descriptive. Because environmental covariates did not consistently improve growth prediction, the project’s web application was ultimately built around robust age- and observed-growth–based models, with environmental data retained for context and future multi-year refinement.
Outreach included multiple LinkedIn and Instagram posts by Fathom Fishing, Seaport Systems, and Bluesonde Technologies that collectively reached several thousand viewers, as well as consultations, on-farm demonstrations, and tours with farmers and agricultural service providers interested in practical precision aquaculture methods. The project resulted in a prototype web application that translates the study’s findings into a practical decision-support tool for oyster farmers. Based on project results, the app uses oyster age and observed growth rates to project growth trajectories and estimate timing for bag splits and harvests, without requiring real-time environmental sensor data.
This project sought to...
- Collect environmental data using monitoring buoys at a growout site on the New Meadows River. We collected two uninterrupted datasets for the location, with high temporal resolution, over two growing seasons.
- Collect oyster weight and mortality data from bags located adjacent to the data buoys. We collected this data every two weeks at the site. Additionally, market oysters were sampled to calculate market volume and weight.
- Model oyster growth rate and mortality. Oyster growth rate was modeled using multivariable regression and generalized additive models, with growth expressed as weight increase per day and environmental covariates summarized over each sampling interval. Oyster mortality was evaluated using a binomial logistic regression framework relating environmental conditions to the presence of mortality within sampling intervals.
- Use this model to make farming recommendations. These recommendations addressed density splitting, sales planning, and methods to limit mortality risk.
- Package these results into a generalizable protocol that farmers can use to better manage their farms. The anticipated result of this step will be open source code and a web application that takes in a location of interest, environmental data from the closest data buoys, and then outputs predicted growth rates and farm management recommendations, such as a sorting or harvest schedule.
Most oyster farmers don’t use environmental data to manage their farm’s operations. This leads to a whole host of problems including inaccurate growth and sale projections, unexpected mortality events, biofouling, improper site selections, and untimely harvest closures. These problems hurt oyster farmers’ profitability, income, and relationships with buyers. All of these issues can be addressed by using environmental data to model the oyster farm.
Using buoys equipped with sensors, we will be able to predict conditions that may be harmful to oysters, conditions that may result in harvest closures, and the conditions that will impact oyster growth rate. We sought input from oyster farmers, kelp farmers and aquaculture researchers in order to choose the strongest indicators of site viability, crop health, and value to researchers. As a result, the monitoring buoys that we will use are designed to generate data including current and tide profiles, temperature, water depth, conductivity, chlorophyll, and dissolved oxygen. With growth rate models we can predict stocking density. This will allow for efficient scheduling of sorting, grading, defouling, and density splitting. Maximizing efficiencies in processing steps will result in a higher market value for the oysters because they will be handled more (resulting in better oyster shape), while simultaneously reducing labor per oyster, and therefore operational expense. Additionally, environmental data provided by these buoys can predict environmental conditions harmful to oysters and other potential crops. By providing real-time environmental data, farmers can take mitigating actions and protect their oysters from often deadly conditions. Algal blooms are a perfect example of this. When all of the algae die and begin to decompose a large amount of oxygen is consumed which can lead to anoxic conditions. These conditions may cause mortality events on the farm. Understanding environmental trends that often take place before mortality events could be very beneficial as it would allow farmers to harvest ahead of these events to protect their shellfish from loss.
Addressing this problem will improve the sustainability of oyster farms because it will give them a tool to help manage the effects that a changing climate has on their farms. In the Gulf of Maine, we are seeing a period of rapid temperature increase and ocean acidification. There are more frequent extreme weather events. Optimal management of an oyster farm in a rapidly changing environment is impossible without an understanding of that environment. This project aims to model environmental changes using data buoys. The Gulf of Maine is expected to continue changing quickly, so environmental data will be even more valuable to farmers in the future.
Time can be used as a predictor for oyster growth, but oysters don't grow based on time. The amount of food, the flow rate of the water, and the temperature of the water are more direct predictors of oyster growth rate. However, these metrics change from location to location and from year to year. A growth curve from last season may not be the same as this season and growth rates from week to week may vary greatly based on environmental conditions. This makes it difficult for oyster farmers to predict how their farm will perform. This research will explore a novel method for data driven, predictive oyster farming. In summary, this solution will result in improved productivity, reduction of costs, and increase of net farm income by developing a protocol that will allow farmers to train a model of environmental data to the growth rate of their oysters, and then use that model to better manage their farm.
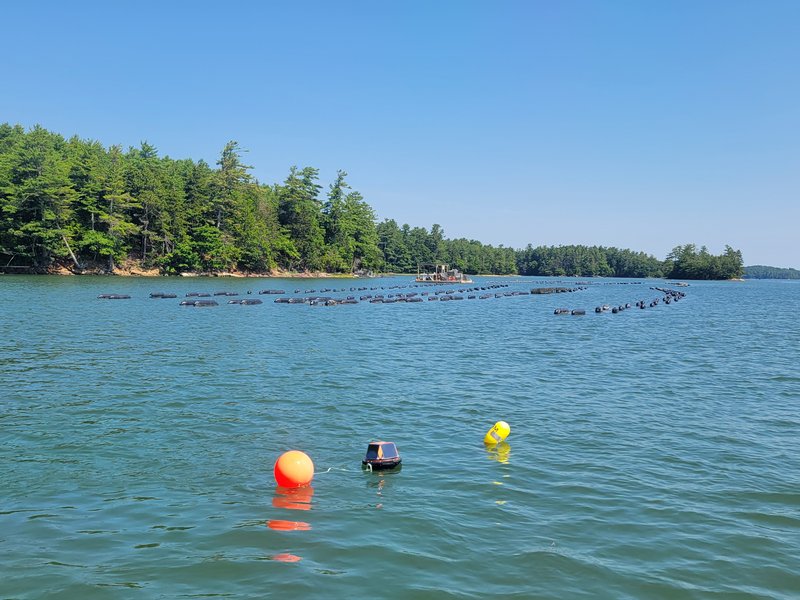
Ferda Farms LLC is a commercial oyster farming operation based in Brunswick, Maine. The farm has been producing Eastern oysters (Crassostrea virginica) since 2018 and has grown from a small pilot operation to a multi-site business harvesting approximately 200,000–250,000 oysters annually. Production occurs across multiple limited-purpose aquaculture (LPA) sites and a 2.4-acre standard lease on the New Meadows River using floating cage culture, with oysters managed through regular sorting, density adjustments, and biofouling control throughout the growing season.
The farm sells oysters through a diversified set of markets, including direct-to-consumer sales, wholesale to restaurants, and distribution partners throughout Maine and New England. Ferda Farms also engages in value-added and educational activities such as farm tours and on-site events, which provide additional revenue streams and public outreach opportunities. The business operates year-round, with the primary growing and harvesting season extending from spring through late fall. Farm ownership and management are full-time, supported by a combination of year-round and seasonal employees.
Ferda Farms is equipped with substantial on-water and shore-based infrastructure that supported this project, including two work boats, two floating work platforms, and an offshore solar power system used to operate processing and farm equipment. The farm already owned and maintained standard aquaculture gear, scales, washing equipment, and data logging tools required for oyster sampling and husbandry. These existing resources allowed the project to be implemented without additional capital investment beyond the scope of the SARE grant. Farm labor, vessels, grow-out gear, and processing space were all dedicated to supporting buoy deployment, oyster sampling, and data collection throughout the project period.
In addition to physical resources, the farm contributed significant managerial and analytical capacity to the project. The project lead has a background in engineering and data analysis and is directly responsible for daily farm operations, data collection, and model development. This integration of farm management and technical analysis ensured that the research remained grounded in real-world farming constraints and that results were immediately applicable to commercial oyster production.
Cooperators
- - Technical Advisor
- (Researcher)
- (Researcher)
Research
This project used a combination of on-farm environmental monitoring, repeated oyster sampling, and statistical modeling to evaluate how environmental conditions relate to oyster growth and mortality at a commercial oyster farm. All data collection and analysis occurred during the active growing season and were integrated into normal farm operations to ensure that the methods were practical, scalable, and repeatable by other growers.
Environmental monitoring
Environmental data were collected using monitoring buoys deployed at Ferda Farms on the New Meadows River. In 2024, a YSI multiparameter sonde provided by the University of Maine was used to collect in situ measurements. In 2025, a buoy provided by Bluesonde Technologies was deployed, which transmitted data to the cloud via satellite connection. Buoys were installed in the spring by attaching them to existing moorings near active oyster cages. Sensors continuously measured water temperature, salinity, turbidity, chlorophyll, and dissolved oxygen at high temporal resolution. Environmental measurements were summarized over biologically relevant time windows aligned with oyster sampling intervals. Buoys were periodically inspected and maintained as part of routine farm operations to ensure data quality.
Oyster sampling and biological measurements
Oyster growth and mortality were monitored using marked grow-out bags located adjacent to the monitoring buoys. In 2024, a cohort of one-year-old Eastern oysters (Crassostrea virginica) was tracked throughout the growing season by University of Maine researcher Kelsey Wells. Sampling began once oysters were raised from the bottom in the spring and continued at approximately two-week intervals, with some variation due to weather and farm logistics. During each sampling event, oysters were retrieved by farm staff and brought to shore, where individual oysters were measured for shell length, weight, and survival status. Three bags were sampled, each containing approximately 75 individually tagged oysters, allowing repeated measurements of the same individuals through time.
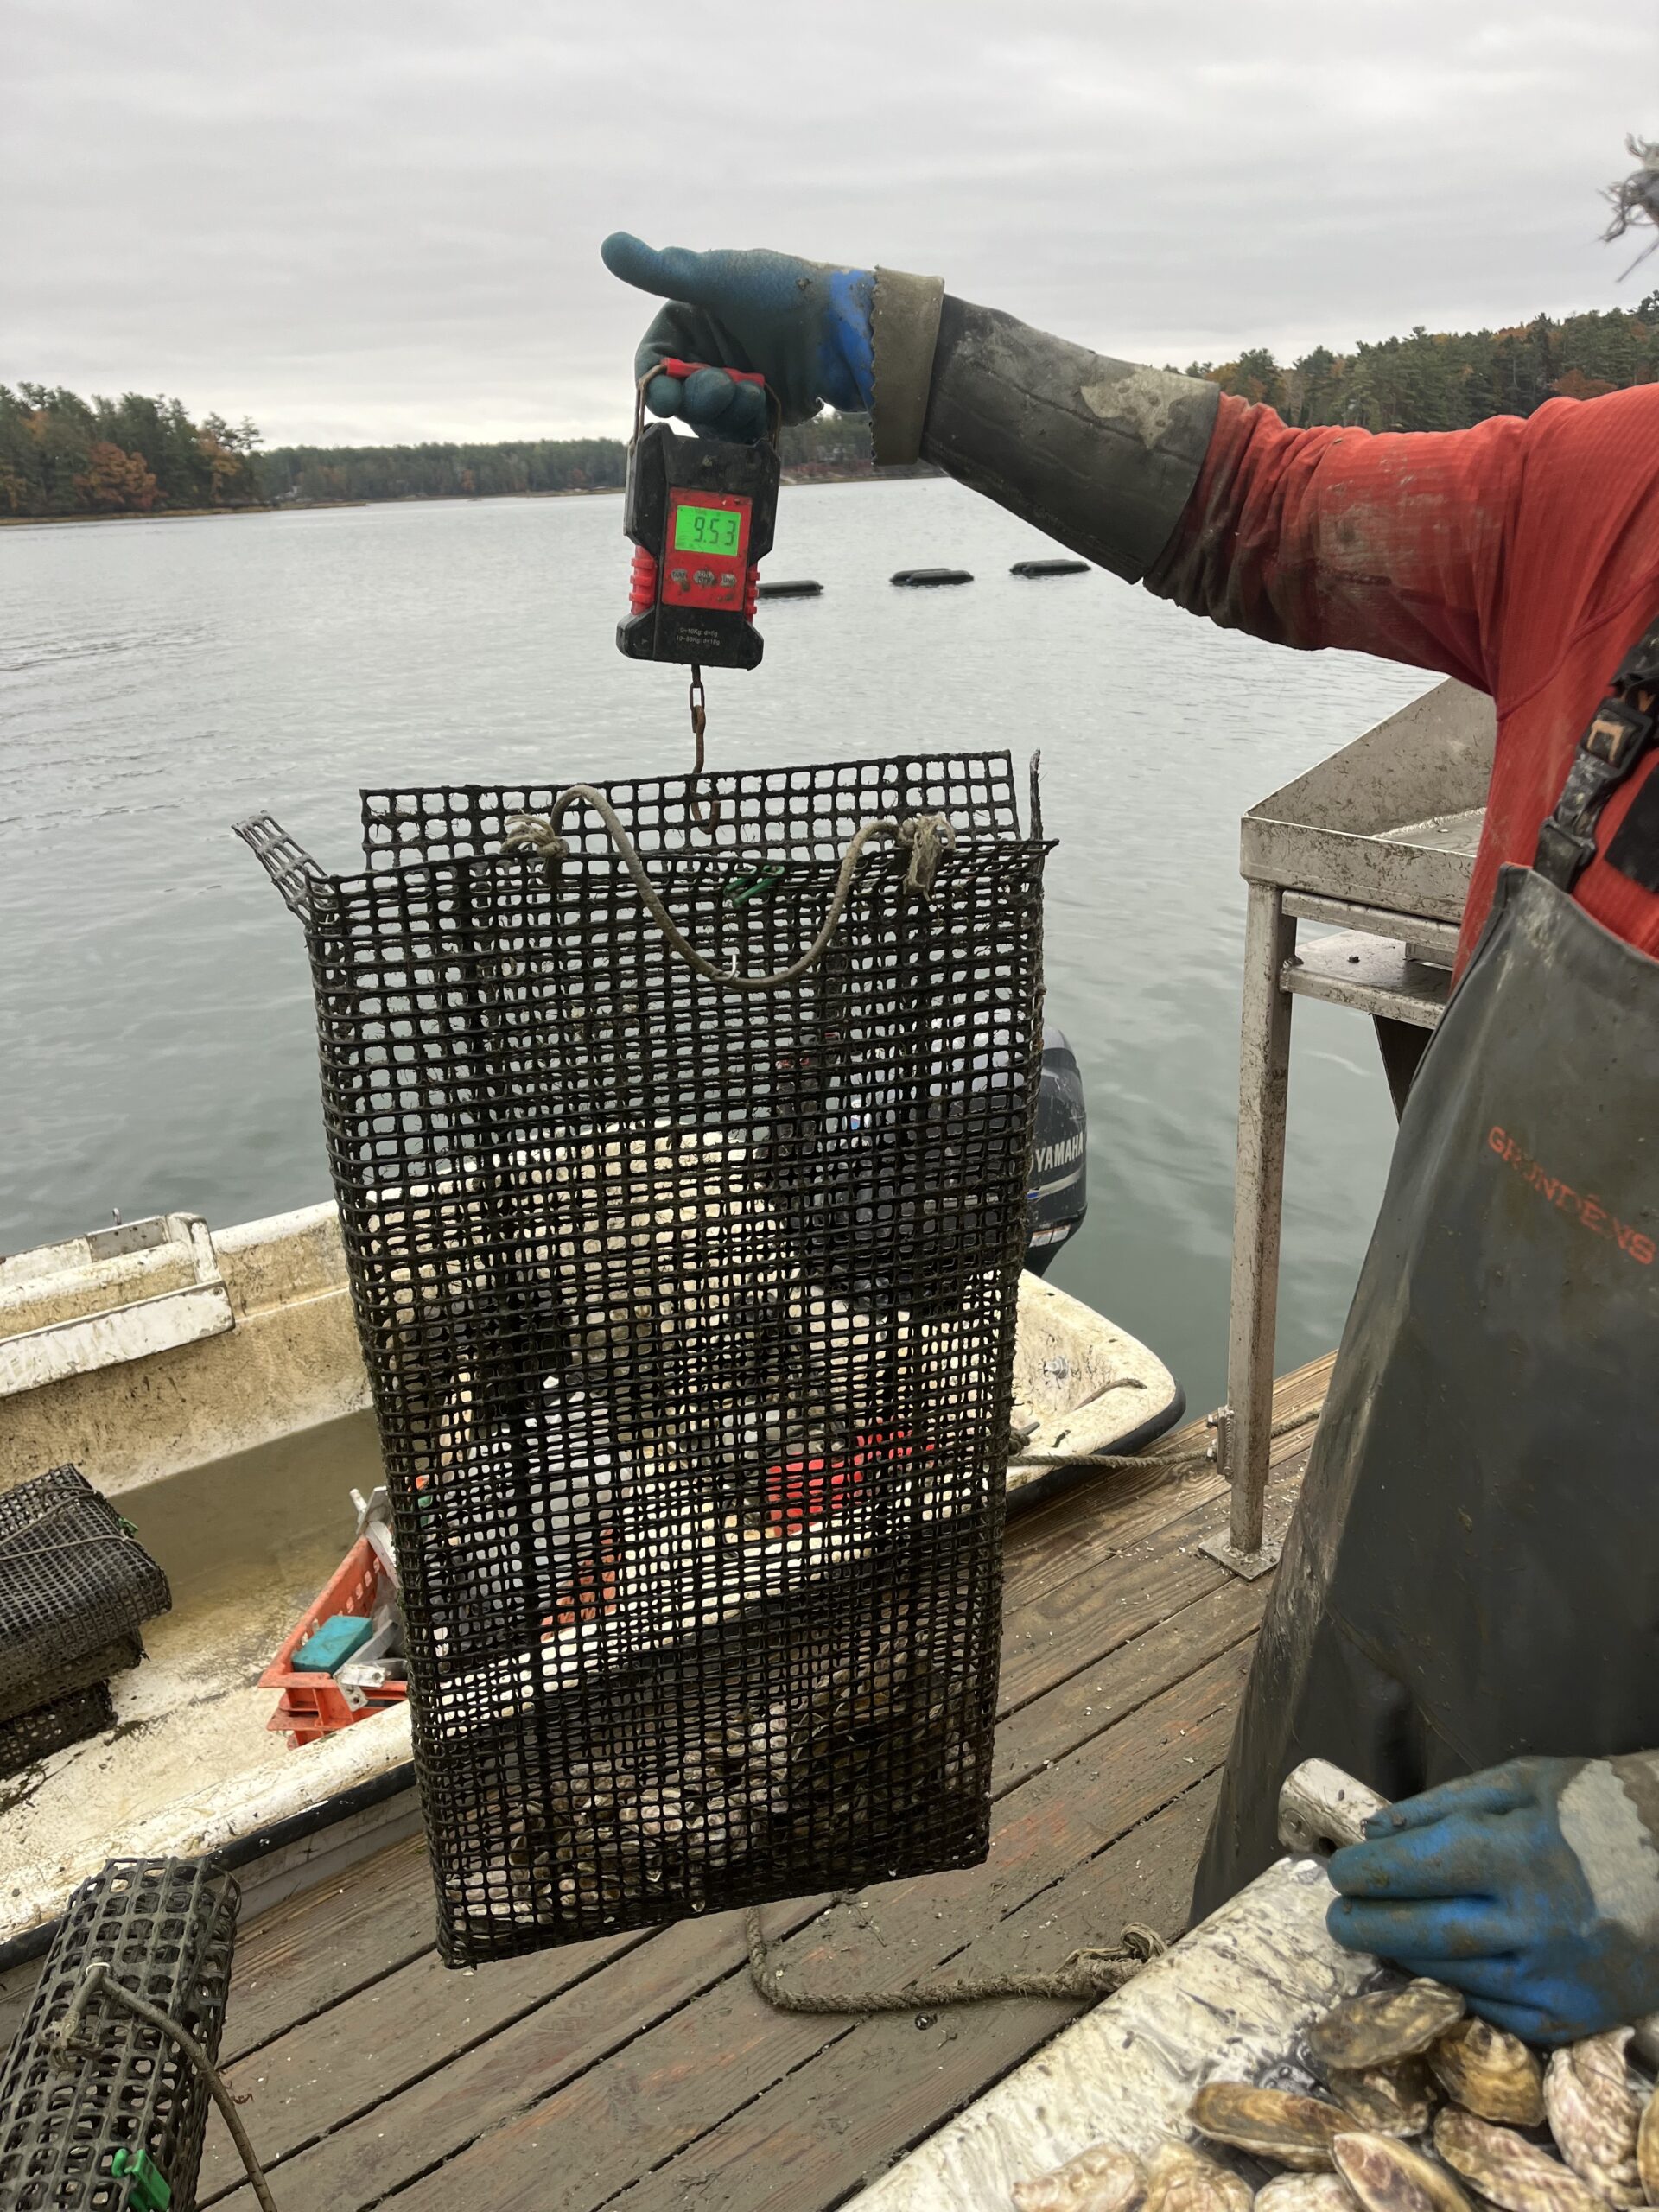
In 2025, a separate cohort of one-year-old oysters was tracked by Ferda Farms staff using a sampling approach designed to better reflect routine farm practice. Six grow-out bags, each containing approximately 200 oysters, were sampled at each sampling event. Bags were brought to the processing float, oysters were washed to remove fouling and pseudofeces, and mortality was assessed by counting oysters with open shells, which were classified as dead and removed. Live oysters were weighed in aggregate using a hanging scale, with the empty bag tared prior to weighing. Average individual oyster weight was calculated by dividing total live weight by the number of live oysters remaining in the bag, after which oysters were returned to grow-out.
To support density and gear capacity calculations, a separate sample of market-size oysters was collected during the 2025 season. These oysters were weighed using the same methods as grow-out samples, and volume was measured using water displacement in a graduated container. Measurements of both mass and volume were used to estimate oyster density, allowing weight-based measurements to be translated into volume-based space and gear requirements.
Data aggregation and interval definition
All analyses were conducted at the sampling-interval scale, defined as the period between consecutive oyster sampling events. Environmental data were aggregated over each interval using summary statistics (e.g., means and measures of variability) to align environmental exposure with biological response. Growth rate was calculated as the change in oyster weight divided by the number of days in each interval. Mortality was recorded as the presence or absence of death events within each interval.
Statistical analysis of growth
Oyster growth was modeled using a combination of multivariable linear regression and generalized additive models (GAMs). GAMs were selected to allow for nonlinear relationships between growth rate and key predictors such as temperature, seasonality, and oyster size, which are known to influence bivalve growth in non-linear ways. Models included oyster age (or time since deployment) as a baseline predictor, with environmental covariates added sequentially to evaluate their marginal contribution.
Model performance was assessed using out-of-sample validation, comparing prediction error metrics (including mean absolute error and root mean square error) between age-only models and models that incorporated environmental variables. This approach allowed direct evaluation of whether environmental data improved predictive performance beyond time or age alone, rather than relying solely on in-sample fit.
Statistical analysis of mortality
Mortality was evaluated using a binomial modeling framework. In 2024, mortality was analyzed at the oyster-interval level, enabling exploratory logistic regression to assess associations between environmental conditions and the probability of death during an interval. In addition to coefficient-based interpretation, a contrast-based risk index was constructed by evaluating fitted models under typical versus extreme environmental conditions observed during the season. This approach emphasized identification of high-risk environmental regimes rather than calibrated mortality prediction.
In 2025, mortality occurred in too few sampling intervals to support regression-based inference. Logistic regression models exhibited near-complete separation and unstable coefficient estimates, and mortality results were therefore summarized descriptively rather than interpreted quantitatively.
Analytical implementation
All data processing and statistical analyses were conducted using open-source Python libraries, including packages for data manipulation, regression modeling, and generalized additive modeling. All analytical steps, assumptions, and data transformations were explicitly documented to support reproducibility. The methods developed through this project emphasize analytical approaches that can be realistically implemented by commercial oyster farms and adapted as longer time series and additional environmental variability become available. The Python notebooks and data for this project are stored here.
This project generated paired environmental and biological datasets across two growing seasons (2024 and 2025), allowing us to evaluate how oyster growth and mortality varied through time and how strongly those patterns aligned with measured environmental conditions. The results highlight both the value of environmental data for understanding oyster growth and the practical limitations of modeling rare mortality events at the farm scale. Environmental data were successfully collected throughout the growing seasons, providing high-frequency measurements of temperature, salinity, turbidity, chlorophyll, and dissolved oxygen adjacent to active oyster grow-out areas. In 2024, the YSI sonde provided continuous in situ measurements that were later aligned with oyster sampling intervals. In 2025, the Bluesonde buoy transmitted data to the cloud in near real time, demonstrating the feasibility of remote environmental monitoring for commercial farms.
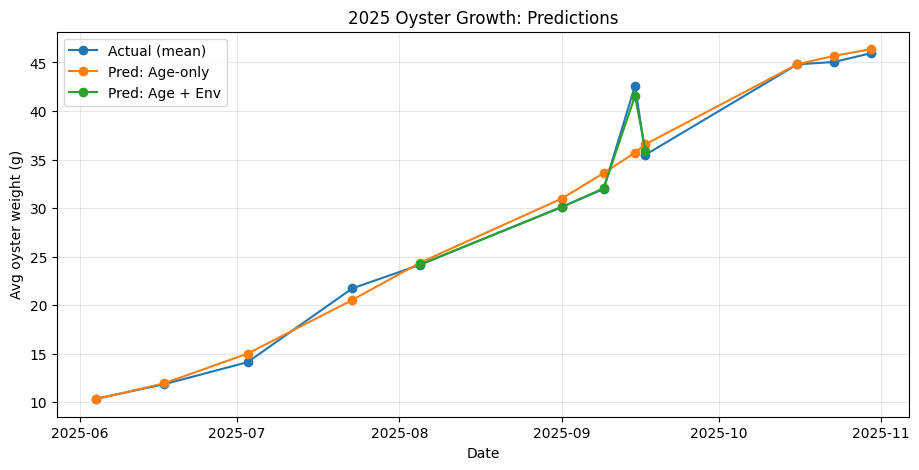
Across both seasons, temperature showed strong seasonal structure, increasing rapidly in late spring, peaking in mid-summer, and declining through the fall. Chlorophyll and turbidity were more variable at shorter time scales, with episodic peaks that were not well captured by time alone. Oyster growth was successfully tracked in both years, although the sampling design differed. In 2024, growth measurements were based on individually tagged oysters (three bags of approximately 75 oysters each), which allowed repeated measurement of shell length and weight for the same individuals. In 2025, growth was measured using aggregate bag weights (six bags of approximately 200 oysters each), a method more closely aligned with standard farm practice and lower handling time. Oyster growth rates showed strong seasonal structure across both years, with rapid growth during mid-summer and slower growth during spring and fall shoulder seasons. Models based on time or seasonality alone captured a large proportion of the observed variation in growth rate.
Fitting growth
The inclusion of environmental variables such as temperature, chlorophyll, salinity, turbidity, and dissolved oxygen did not consistently or substantially improve growth predictions relative to time-based models. Although environmental variables were correlated with growth and often aligned with observed changes in growth rate, their predictive contribution beyond time alone was limited, likely due to strong collinearity between environmental conditions and seasonal progression.
In 2024, oyster growth was best explained by age alone. Inclusion of environmental covariates—including temperature, chlorophyll, turbidity, and salinity consistently increased prediction error, raising mean absolute error by 3–5% and root mean square error by up to 10%. This indicates that environmental variability did not independently modulate growth during that year. The 2025 data indicated that oyster age explained the majority of variation in individual weight, with temperature providing a modest improvement in predictive accuracy. Additional environmental variables did not improve performance and increased prediction error, likely due to collinearity and limited temporal replication. Including temperature reduced the median absolute prediction error by approximately 5% relative to an age-only model, while additional environmental covariates did not improve predictive performance.
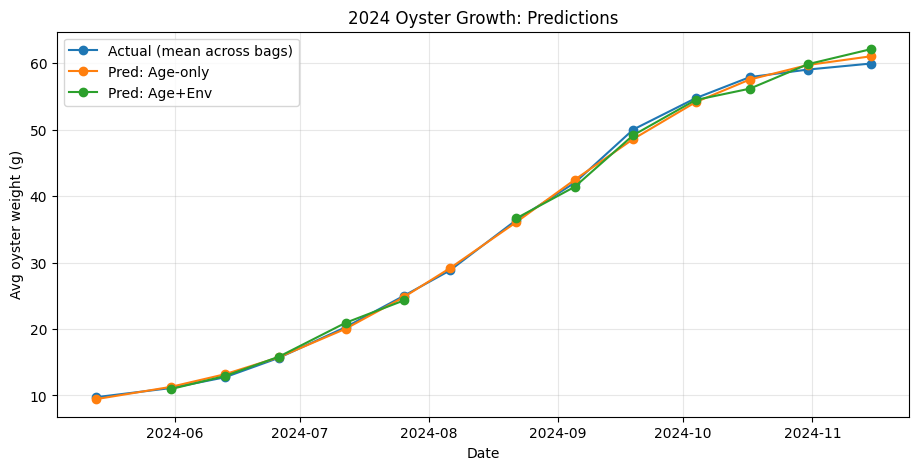
Because the inclusion of environmental data only modestly improved growth prediction in 2025 and did not improve predictive performance in 2024, the final web application was designed around models using oyster age and observed growth rates rather than real-time environmental forcing. Across both years, time- or age-based models captured the majority of predictable variation in oyster growth, and the additional complexity introduced by environmental covariates did not result in a meaningful or consistent improvement in out-of-sample performance. This indicated that, under typical growing conditions, calendar-based growth trajectories provide sufficiently accurate guidance for short-term farm planning.
This design choice prioritized robustness, simplicity, and usability for farmers. Models based on age and historical growth data require fewer inputs, are less sensitive to missing or noisy sensor data, and can be applied consistently across farms that do not have access to environmental monitoring equipment. Environmental data remain valuable for interpretation, situational awareness, and future multi-year modeling, but were not necessary to generate reliable baseline growth projections within the scope of this project. As a result, the web application emphasizes tools that farmers can immediately adopt using data they already collect, while retaining the flexibility to incorporate environmental predictors as longer time series and additional stress years become available.
Fitting Mortality
Mortality patterns in 2024 were most clearly expressed when results were evaluated using a contrast-based risk index rather than individual regression coefficients. Forty out of 225 oysters died, which resulted in a strong mortality dataset. When environmental conditions were shifted from typical seasonal values to extreme conditions observed during the study period, predicted mortality increased sharply, particularly in intervals characterized by high chlorophyll variability. Elevated temperature alone was associated with a modest increase in predicted risk, but when elevated temperature and high chlorophyll variability co-occurred, modeled mortality increased substantially, identifying these intervals as the highest-risk regime observed in the dataset. These results indicate that short-term environmental instability, rather than average conditions, was most strongly associated with mortality events in 2024. When chlorophyll variability and temperature were simultaneously in their upper-percentile (“danger”) ranges, the fitted model predicted mortality probabilities of approximately 83% per interval, compared to approximately 1% under typical 2024 conditions, indicating a strong stacking effect when multiple stressors co-occurred. Predicted mortality probabilities represent the likelihood that a grow-out bag experienced at least one mortality event during a sampling interval, rather than the probability of death for an individual oyster or total bag loss.
| Environmental condition | Description | Predicted mortality (% per interval) | Change vs. typical |
|---|---|---|---|
| Typical 2024 conditions | All predictors at median seasonal values | ~1.1% | — |
| High chlorophyll variability | chl_sd_mean at danger threshold (top ~9%) |
~46.8% | +45.7 pp |
| High temperature | temp_mean at danger threshold (top ~9%) |
~6.0% | +4.9 pp |
| High chlorophyll mean | chl_mean at danger threshold |
~0.0–0.1% | −1.1 pp |
| High chl variability + high temperature | Both chl_sd_mean and temp_mean at danger thresholds |
~83.4% | +82.3 pp |
Notes: Predicted values are derived from a fitted logistic mortality model evaluated using a contrast-based risk index. “Typical” conditions correspond to median 2024 values, while “danger thresholds” represent upper-percentile values observed during the study period. Predicted probabilities should be interpreted as relative risk contrasts, not calibrated mortality rates.
In contrast, direct interpretation of logistic regression coefficients yielded weaker and less consistent signals. While temperature showed a statistically detectable positive association with mortality, other environmental predictors exhibited wide confidence intervals and unstable effect sizes, reflecting strong collinearity and temporal clustering of mortality events. As a result, coefficient-level results were less informative for distinguishing high-risk from low-risk periods. Together, these findings suggest that mortality in 2024 was driven by combinations of environmental stressors acting over short time scales, and that evaluating mortality risk through realistic environmental contrasts more effectively captured biologically and operationally meaningful patterns than per-unit effect estimates alone.
In 2025, observed mortality occurred in only two sampling intervals, resulting in insufficient information to support statistical mortality modeling. Logistic regression models exhibited near-complete separation, with unstable coefficients and inflated predicted probabilities. As a result, 2025 mortality analyses were not interpreted quantitatively and were used only to document the frequency and timing of observed mortality events.
Changes from the original plan
Several deviations from the original project plan influenced the final results. The number and configuration of buoy deployments changed over time as equipment availability and reliability evolved, and different monitoring platforms were used across years. The initial three data buoys did not perform as delivered and two of them sank. This caused a delay in the projects timing and the need to pivot to other sensors from UMaine and Bluesonde. Sampling design also shifted between years, from individual oyster tracking in 2024 to aggregate bag-based measurements in 2025, reflecting a transition toward methods that are more practical for routine farm use.
Rather than limiting the project, these changes strengthened its relevance by demonstrating how analytical approaches can adapt to different data resolutions and sampling intensities. The comparison between individual-level and bag-level data clarified the tradeoffs between biological detail and operational efficiency.
Farm-level implications
Although this project did not directly quantify changes in profit or input costs, it produced clear operational insights. Environmental data improved confidence in seasonal growth expectations, reduced reliance on fixed calendars for planning harvests and bag splits, and provided early warning of periods when growth slowed or became more variable. The 2025 sampling protocol reduced handling time compared to individual measurements, demonstrating a scalable approach for commercial farms.
Overall, the project showed that integrating environmental monitoring with simple, repeatable oyster measurements can meaningfully improve farm awareness of growth dynamics. While, longer time series or high mortaltity rates are needed to robustly predict mortality, the methods developed here provide a transferable framework that other oyster farmers can adopt and expand as additional data are collected.
The objective of this project was to evaluate whether high-frequency environmental monitoring data could meaningfully improve predictions of oyster growth and mortality at the farm scale, and whether those predictions could be translated into practical decision-support tools for commercial oyster farmers. To address this question, paired environmental and biological datasets were collected across two growing seasons using in-water sensors and repeated oyster sampling. Growth and mortality were analyzed using multiple statistical approaches to assess the added value of environmental covariates relative to simpler, time-based models.
The results showed that oyster growth in both 2024 and 2025 was strongly seasonal and was largely explained by oyster age or time alone. Environmental variables such as temperature, chlorophyll, salinity, and turbidity were correlated with growth, but did not consistently improve out-of-sample predictive performance beyond age-based models. In 2024, inclusion of environmental covariates increased prediction error, while in 2025, temperature provided a modest improvement (~5%) relative to age alone but additional environmental variables did not further improve performance. These findings indicate that under typical growing conditions, calendar-based growth trajectories provide sufficiently accurate guidance for short-term growth planning, and that environmental data do not substantially enhance growth prediction over the time scales examined.
Mortality analyses yielded a different set of insights. In 2024, mortality was substantial at the oyster level, allowing exploratory modeling. A contrast-based risk index revealed that mortality risk increased sharply under conditions of high chlorophyll variability, particularly when combined with elevated temperature. These stacked stressor conditions corresponded to the highest modeled mortality risk regimes observed during the season. In contrast, direct interpretation of logistic regression coefficients was less informative due to collinearity and temporal clustering of mortality events. In 2025, mortality occurred in too few sampling intervals to support statistical modeling, and results were documented descriptively. Together, these findings suggest that short-term environmental instability, rather than average conditions, plays a key role in mortality events, but that longer time series are required to robustly predict mortality risk.
Based on these results, the primary change adopted from this project was the design of a web application centered on oyster age and observed growth rates rather than real-time environmental forcing. This decision prioritized robustness, simplicity, and accessibility for farmers, as age-based models performed consistently across years and do not require specialized sensor infrastructure. Environmental data are retained as a contextual and exploratory tool, particularly for identifying anomalous conditions and informing future multi-year analyses. In addition, the project demonstrated that aggregate, bag-based sampling substantially reduces handling time relative to individual tagging while still capturing meaningful growth patterns, improving scalability for commercial operations.
Overall, this project met its objective of evaluating the practical value of environmental data for precision oyster farming. While environmental monitoring did not substantially improve short-term growth prediction, it provided valuable insight into mortality risk regimes and informed the development of decision-support tools grounded in real farm constraints. The methods and conclusions from this work provide a transferable framework that other oyster farmers can adopt and refine as longer datasets and additional environmental variability become available.
Education & outreach activities and participation summary
Participation summary:
Education and outreach for this project occurred primarily through industry-facing communication and informal knowledge sharing rather than formal classroom or workshop settings. Project activities and preliminary findings were shared through multiple social media platforms, reaching a broad audience of aquaculture professionals, technology developers, and researchers.
Several posts describing the project, buoy deployments, and early results were shared on LinkedIn and Instagram by project partners including Fathom Fishing, Seaport Systems, and Bluesonde Technologies. These posts highlighted the use of environmental monitoring tools in a commercial oyster farming context and generated engagement from growers and industry stakeholders. Collectively, these posts were viewed several thousand times, indicating strong interest in practical applications of environmental data in aquaculture.
In addition to social media outreach, the project has been discussed informally with other oyster farmers and aquaculture professionals during routine farm interactions and industry conversations. These discussions focused on the feasibility of environmental monitoring, sampling design, and the practical implications of the project’s findings, particularly the use of simplified growth models and the limitations of short-term mortality prediction. Outreach related to this project is ongoing, with plans to continue sharing results through industry networks and future presentations as opportunities arise.
Learning Outcomes
Farmers gained a clearer understanding of how oyster growth relates to time, temperature, and seasonal patterns, and where environmental data do and do not add predictive value. In particular, the project clarified that oyster age or seasonality alone can explain much of the predictable variation in growth under typical conditions, while short-term environmental variability is more relevant for interpreting anomalies and mortality risk. This helped demystify environmental monitoring and reduced assumptions that more data necessarily leads to better short-term prediction.
The project influenced attitudes toward complexity and technology adoption in farm management. Rather than viewing precision aquaculture tools as inherently complex or sensor-dependent, farmers expressed increased confidence in simpler, age-based approaches supported by occasional environmental context. This shift reduced apprehension around adopting data-informed practices and reinforced the idea that precision farming can be incremental and scalable rather than all-or-nothing.
The project strengthened practical skills related to sampling design, data interpretation, and decision-making. Farm staff and collaborating growers improved their ability to collect consistent growth measurements, evaluate trends across sampling intervals, and interpret model outputs critically rather than taking predictions at face value. The transition to aggregate, bag-based sampling also built skills in designing monitoring protocols that balance biological detail with labor efficiency.
Farmers reported increased awareness of short-term environmental instability, such as rapid changes in water conditions, and its potential role in stress and mortality events. Even though environmental data did not substantially improve routine growth prediction, it heightened awareness of periods when oysters may be more vulnerable, supporting more attentive farm management during those windows. More broadly, the project increased awareness of the data requirements needed to reliably model mortality, helping set realistic expectations for future monitoring efforts.
Project Outcomes
As a result of this project, Ferda Farms changed both its sampling practices and its approach to growth planning and decision support. Prior to this work, growth expectations and management decisions were largely based on calendar time, intuition, and historical averages. Through this project, we tested whether higher-resolution environmental data could improve prediction and decision-making, and in doing so clarified which practices added value and which did not under typical growing conditions.
One direct outcome was a shift in how environmental data are used on the farm. Rather than attempting to use environmental variables to fine-tune short-term growth predictions, we now use age-based growth trajectories as the primary planning tool, informed by observed growth rates. This simplified approach proved to be robust across seasons and eliminated reliance on continuous sensor data for routine planning. Environmental monitoring remains valuable, but is now used primarily for context and situational awareness, particularly for identifying periods of environmental instability that may warrant closer attention to oyster health or operational adjustments. This reframing reduced complexity without sacrificing decision quality.
The project also influenced the design of the farm’s decision-support tools. The web application developed as part of this work intentionally emphasizes inputs that farmers already collect, like observed growth, making it accessible to farms without specialized monitoring equipment. This increases the likelihood of adoption by other growers and reduces barriers to entry for data-driven farm management. Several neighboring oyster farmers expressed interest in the simplified growth tools precisely because they do not require additional sensors or infrastructure.
At a personal and operational level, the project increased confidence in farm planning and reduced uncertainty around growth expectations. Knowing that age-based models perform comparably to more complex environment-forced models under typical conditions has made harvest scheduling, bag splitting, and labor planning more predictable. It also provided meaningful insight about how environmental changes result in mortality.
Overall, this project led to measurable improvements in efficiency, decision clarity, and scalability of monitoring practices at Ferda Farms, while producing tools and lessons that are directly transferable to other small and mid-scale oyster farms operating under similar constraints.
Overall, the project successfully met its objective of evaluating whether environmental monitoring data could meaningfully improve oyster growth and mortality prediction at the farm scale, and of translating those insights into practical farm management tools. A key strength of the project was that all data collection and analysis were embedded within normal farm operations. This ensured that the methods tested were realistic, scalable, and representative of the conditions under which commercial oyster farmers actually operate. The paired collection of biological and environmental data across two growing seasons also allowed direct comparison between years and sampling approaches, strengthening the conclusions.
One of the most important lessons from this work was the value of testing methodological assumptions explicitly. While the project originally aimed to build environment-forced predictive models, the results showed that oyster age or seasonality alone captured most of the predictable variation in growth under typical conditions. Recognizing this early allowed the project to pivot toward simpler, more robust modeling approaches that better serve farmers. Similarly, shifting from individual oyster tagging in 2024 to aggregate bag-based sampling in 2025 represented an intentional methodological refinement that reduced labor demands while preserving decision-relevant information. These revisions improved the practicality and long-term sustainability of the approach.
The primary challenge encountered was the inherent difficulty of modeling mortality events at the farm scale. Mortality proved to be episodic and temporally clustered, limiting the effectiveness of traditional regression-based prediction, particularly in 2025 when few mortality intervals occurred. While this constrained the ability to build calibrated mortality models, it clarified that environmental monitoring may be most useful for identifying high-risk regimes and anomalous conditions rather than producing precise short-term mortality forecasts. This insight represents an important outcome of the project, even though it differed from the original expectations.
In light of these findings, Ferda Farms plans to continue using age-based growth tracking and simplified monitoring protocols developed through this project. These practices improve planning reliability without requiring specialized equipment, making them accessible to a wide range of growers. Environmental data will continue to be collected selectively for situational awareness and future multi-year analyses, but will not be relied upon for routine growth prediction. Additional work is needed to evaluate mortality risk over longer time horizons, across more sites, and during years with higher environmental stress, which would improve statistical power and help determine when and where environmental monitoring provides the greatest benefit.
The results of this project will be most useful to small- and mid-scale oyster farms in temperate coastal regions, particularly in the Gulf of Maine and similar environments where strong seasonal patterns dominate growth. Farmers considering investments in environmental monitoring equipment, as well as extension staff and researchers working on precision aquaculture tools, would benefit from understanding both the strengths and limitations identified in this work. Even where results were negative or neutral, they provide valuable guidance for targeting future research and avoiding unnecessary complexity in farm management systems.