Final report for FNE25-131
Project Information
1.1. Summary
This project sought to execute a design iteration of the 3D-COAST oyster raft system, measure its effects on reliability, and most importantly measure the production capacity of the system over a summer and use the data to build a production modelling tool for determining the commercial potential. First, a set of old generation 3D-COAST rafts were retrofitted with updated parts, these rafts were then launched and loaded with seed or year-old oysters. During operation, over the course of the summer, any breakdowns were recorded and the failure rate compared to previous years to determine if the new designs had a positive impact. Whenever husbandry tasks were performed on the raft the labor times were recorded for use in predicting labor requirements for running a 3D-COAST farm. Additionally, oysters were measured periodically to build a dataset to use for calibrating a production model. The final phase of this project involved synthesizing this data into a small desktop application for simulating the growth and production of oysters, preloaded with inputs that mimic the performance of the 3D-COAST rafts in mid-coast Maine. The conclusion of this production modelling and data gathering determined that the design changes had a drastic effect, improving reliability by an order of magnitude over 2024. The production potential and efficiency of a 3D-COAST farm was backed up with data, showing the possibility of producing 60% more oysters with a given labor force and doubling projected farm profit margins over traditional floating gear. Over the course of the summer TWIYO hosted several farm tours and demonstrations to individual farms as well as organizations such as the Darling Marine Center, Maine Aquaculture Innovation Center, and the Maine Aquaculture Association. The production model was published on the TWIYO webpage for free use and credited as an informational product of this grant.
1.2. Project Objectives
Objective 1: Construct the next generation 3D-COAST prototype raft that increases the technology readiness level from 6 to 8, with an eye towards future manufacturability, reliability, and commercialization in a real oyster farm environment. This can be accomplished in a cost effect manner by upgrading an early proof of concept prototype raft to the latest specification. Meeting this objective will mean a new generation of raft with functional improvements stationed at the farm site ready to generate data needed to meet the next two project objectives.
Objective 2: Measure reliability and evaluate any new issues. TWIYO has a measure of reliability for the system in early development stages, quantified as a running percentage of down time over a span of a couple of operational summer months. These reliability figures need improvement, without reliability this system will never be adopted by farmers. A target outcome will be a chart plotting measured down time over the course of a three-month period that can be used for estimating farm maintenance costs, compared to the previous version of the raft. Specific breakdown events will be detailed and in-situ fixes or improvements listed with a plan of how to resolve any issues during the next phase of development.
Objective 3: Integrate and refine the integration of the 3D-COAST raft into existing farm workflows and measure labor benchmarks for farm efficiency and production modelling. Improvements in oyster growth and reductions of biofouling have been demonstrated on previous prototypes, however, careful measurement demonstrating how the prototype would fit into a farm’s existing workflows and what quantitative cost savings could be expected needs to be measured concretely. This information is critical for demonstrating and marketing the commercial opportunities of the system, as well as information needed by farmers planning a new installation. A successful outcome of this objective will be plots of time benchmarks and a MATLAB computer model that simulates the production levels and needed inputs of hypothetical farm scenarios using this data. This model will allow future customers (and TWIYO ourselves) to game out what their farming operations could look like using the 3D-COAST system, a valuable marketing tool as TWIYO attempts to invite adoption of 3D-COAST within the aquaculture community.
According to the UN, world food supply must double by 2050[1] to meet the projected demand from a growing population. The US trails much of the world in one of the most efficient methods of producing protein for human consumption: aquaculture. The 3D-COAST system will address specific roadblocks for oyster farmers in the US, fostering growth in this sector. Specifically, the system will help reduce high rates of injury, simplify labor-intensive processes, address scaling difficulties for small farms, simplify achieving social license, improve product quality, and increase profit margins.
Encouraging new growth in the aquaculture sector is important because aquatic animals are more efficient than land-based animals at converting energy into meat and protein[2]. Fin fish have a feed conversion ratio of 1-2, compared to chicken at 2, pork: 3, and beef: 8[3], but filter feeders, such as oysters, don’t need any food inputs at all. Terrestrial animals also require far more fresh water; beef, pork, and chicken all require 4,000-16,000 liters/kg of water[4]. Oysters do not require any fresh water for production. The elimination of water and feedstock needs for the production of protein through shellfish aquaculture make this industry one of the most important players in the fight against changing conditions, while also tapping into the vast potential of our oceans to sustainably meet growing global food needs.
The 3D-COAST system is a three-dimensional, solar powered, oyster growing raft. TWIYO’s solution for growing oysters is different from current alternatives because we will use the sun to automatically clean and tumble the oysters by rotating them vertically through the water column and briefly into the sun using solar-powered motorized belts of cages. The sun exposure will reduce bio-fouling, and the solar-powered motion will shape the oysters with tumbling action, while also taking advantage of three-dimensional water space rather than the two-dimensional nature of traditional oyster culture.
3D-COAST will address these specific pain points for sea farmers:
- High rates of injury and labor-intensive processes: Growing oysters in Maine is labor intensive and hard on workers’ bodies[5]. On Maine farms, labor is the highest cost contributor[6], therefore using it more efficiently can have a large impact on overall farm productivity. Tumbling oysters and cleaning cages manually are some of the most demanding farm tasks. 3D-COAST could drastically minimize or eliminate both of these tasks by using solar power to slowly, continuously, and automatically perform these tasks. After placing seed in the rotating baskets much of the labor is done.
- Difficulty scaling: Starting and scaling a sea farm is a huge challenge. On average, it takes five years for a Maine sea farm to see profitability and be considered established[7]. One specific issue is relatively low growing density of shellfish with current technology (66,000 oysters/acre for established 2D suspended culture farms on average)[8]. Each pair of 3D-COAST rafts are projected to produce 250,000 oysters/year using 400 square feet of surface, orders of magnitude more oysters per acre than surface culture alone. 3D-COAST will make it easier for small farms to start and achieve profitability by requiring smaller, cheaper, and easier-to-license lease spaces.
- Achieving social license: There are always tensions between aquaculture and riparian landowners, other fishers, recreational users, and towns[9]. Because these rafts grow oysters more densely, there will be less surface area covered with floating cages, and therefore less conflict with riparian landowners. Smaller footprints of 3D-COAST rafts will also reduce conflict with lobster and crab fishermen by decreasing the risk of gear entanglement and overlap created by sprawling surface culture systems. Additionally, the rafts do not encroach on mud flat space that is coveted by clam and worm diggers.
- Inconsistent product quality and profit margins: Producing consistent high-quality product is important to maintain a strong customer base. Many new farmers rush to increase scale because of profitability issues. Given these pressures, the product quality often suffers or varies considerably throughout the season as overworked farmers attempt to keep up with husbandry tasks. Because oysters placed in the 3D-COAST system are automatically cultivated, there is reduced risk of neglect. Additionally, the three-times-daily automatic solar flip will significantly improve shell quality by chipping off the edges of fast-growing shell; this increases shell thickness and density, making a more robust and higher quality oyster.
[1] (General Assembly GA/EF/3242, 2009)
[2] (Fry, Mailloux, Love, Milli, & Cao, 2018)
[3] (Fry, Mailloux, Love, Milli, & Cao, 2018)
[4] (Do you know how much water was used to grow your food and to produce your clothes and the things you buy?, 2010)
[5] (Morse, 2023)
[6] (Engle, van Senten, Schwarz, Brayden, & Belle, 2020)
[7] (Engle, van Senten, Schwarz, Brayden, & Belle, 2020)
[8] (Engle, van Senten, Schwarz, Brayden, & Belle, 2020)
[9] (Rappaport, 2023)
1.4. Description of Farm Operation
TWIYO’s operations are broken into four departments: Oyster Farming, Retail Delivery, Catering, and Equipment Sales. Our farming and equipment sales departments are headquartered in Wiscasset, ME, while our retail delivery and catering operations are centered in Brooklyn, NY.
1.4.1. Oyster Farm
The farm uses our innovative new growing technology called 3D-COAST (3-Dimensional Cultivation of Oysters Automated with Solar Tumbling). MTI, Focus Maine, the USDA, and The Island Institute have all contributed to the development of 3D-COAST and the project is successfully embarking on the commercialization phase of development. The farm first put oyster seed in the water in 2022, and harvested the first oysters in 2023. In 2023 8,700 were harvested, in 2024 27,200 were harvested, and 72,000 in 2025. Fiscal break-even is planned for 2027 and by 2028 the goal is to be harvesting 1M oysters annually using 8x 3D-COAST rafts (16ft x 100ft of water space). In 2025 2 active 3D-COAST rafts were used (8ft x 50ft of water space). Currently the farm has the equivalent of 1.5 full time employees, and by 2028 will have 4. The farm will be a profitable enterprise on its own, but an important role of the farm will always be for development and improvement of the 3D-COAST husbandry equipment.
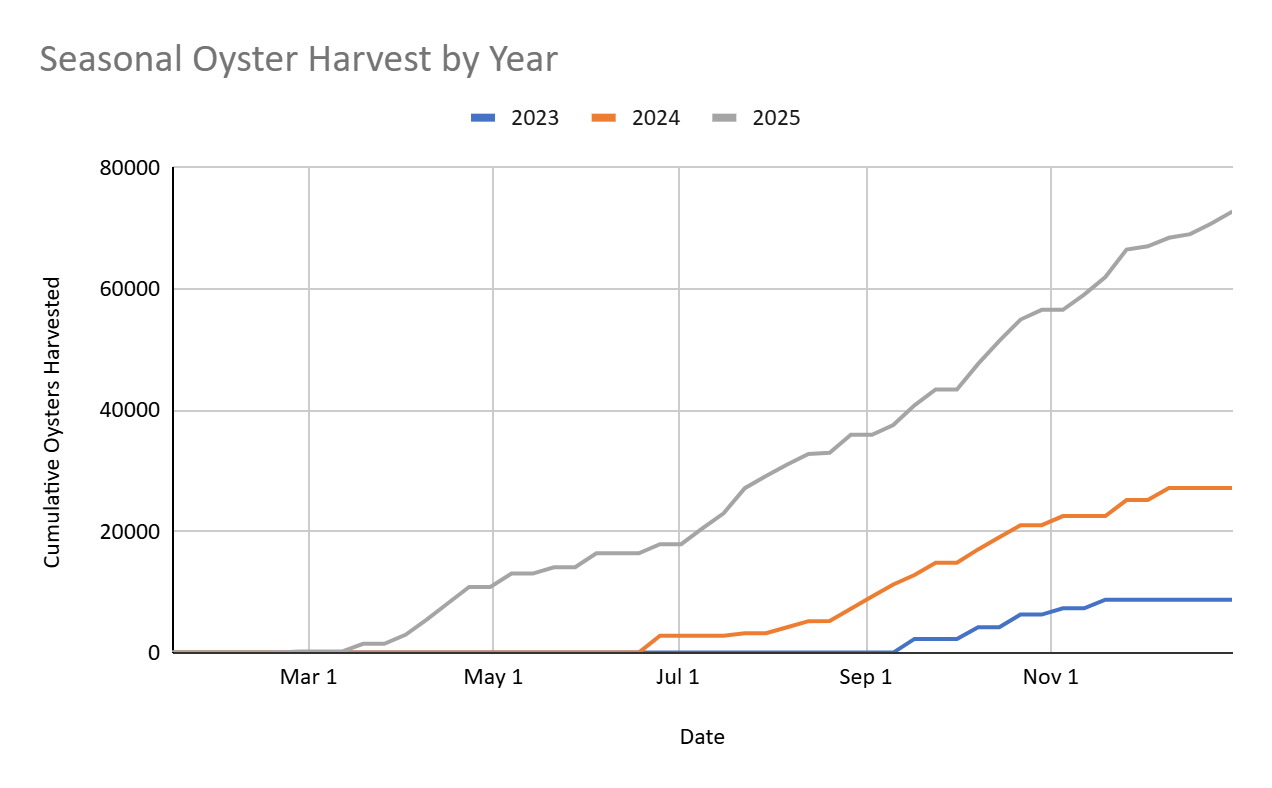
Figure 1: TWIYO has realized increased farm harvest year over year
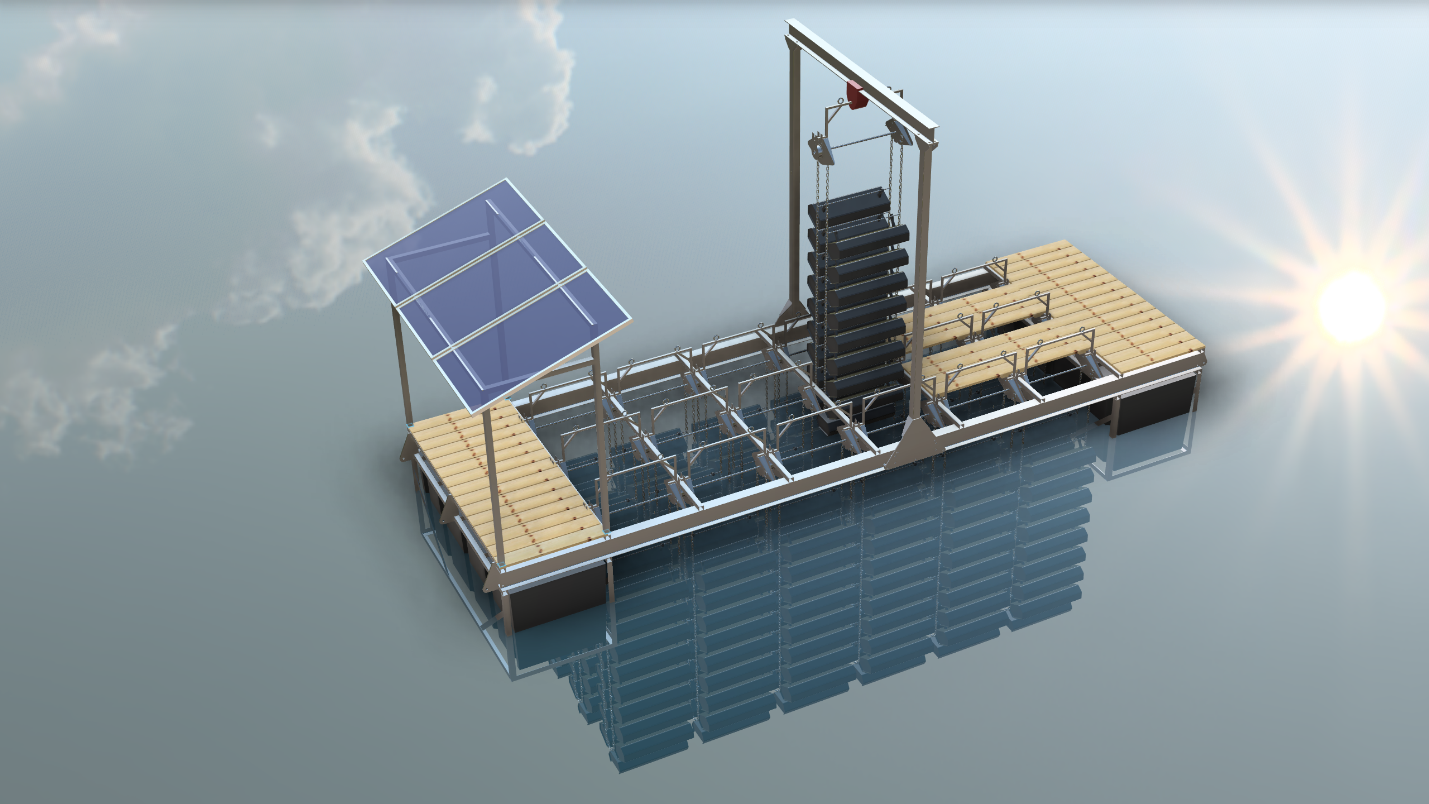
The 3D-COAST system is a three-dimensional, solar powered, oyster growing raft. A rendering of a single raft is shown in Figure 2. TWIYO’s solution for growing oysters is different from current alternatives because we use the sun to automatically clean and tumble the oysters while also taking advantage of three-dimensional water space rather than the two-dimensional nature of surface or bottom culture. These factors reduce labor time and increase growing density while also improving product consistency and quality. The 3D nature of the system can be seen in Figure 2 with the oyster baskets hanging vertically throughout the water.
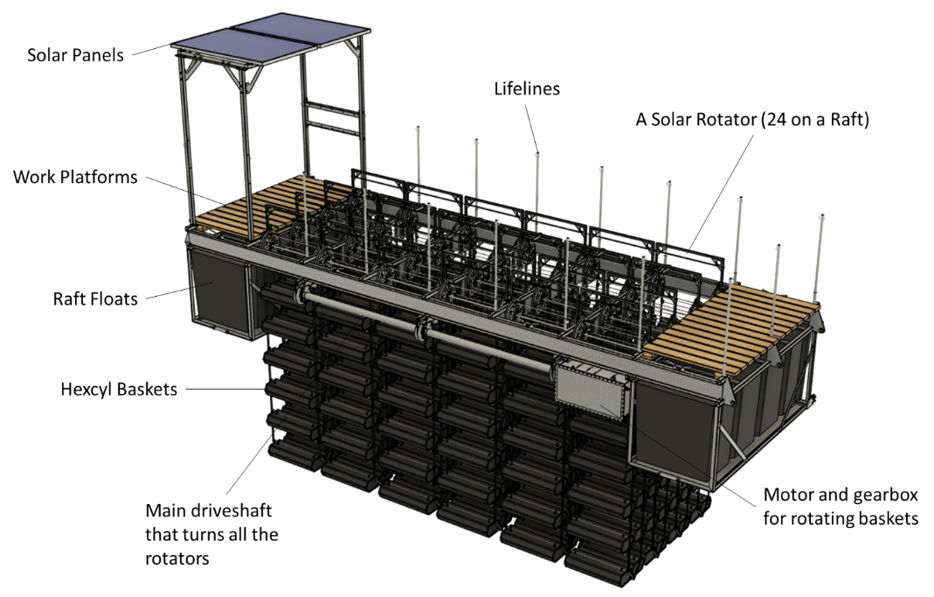
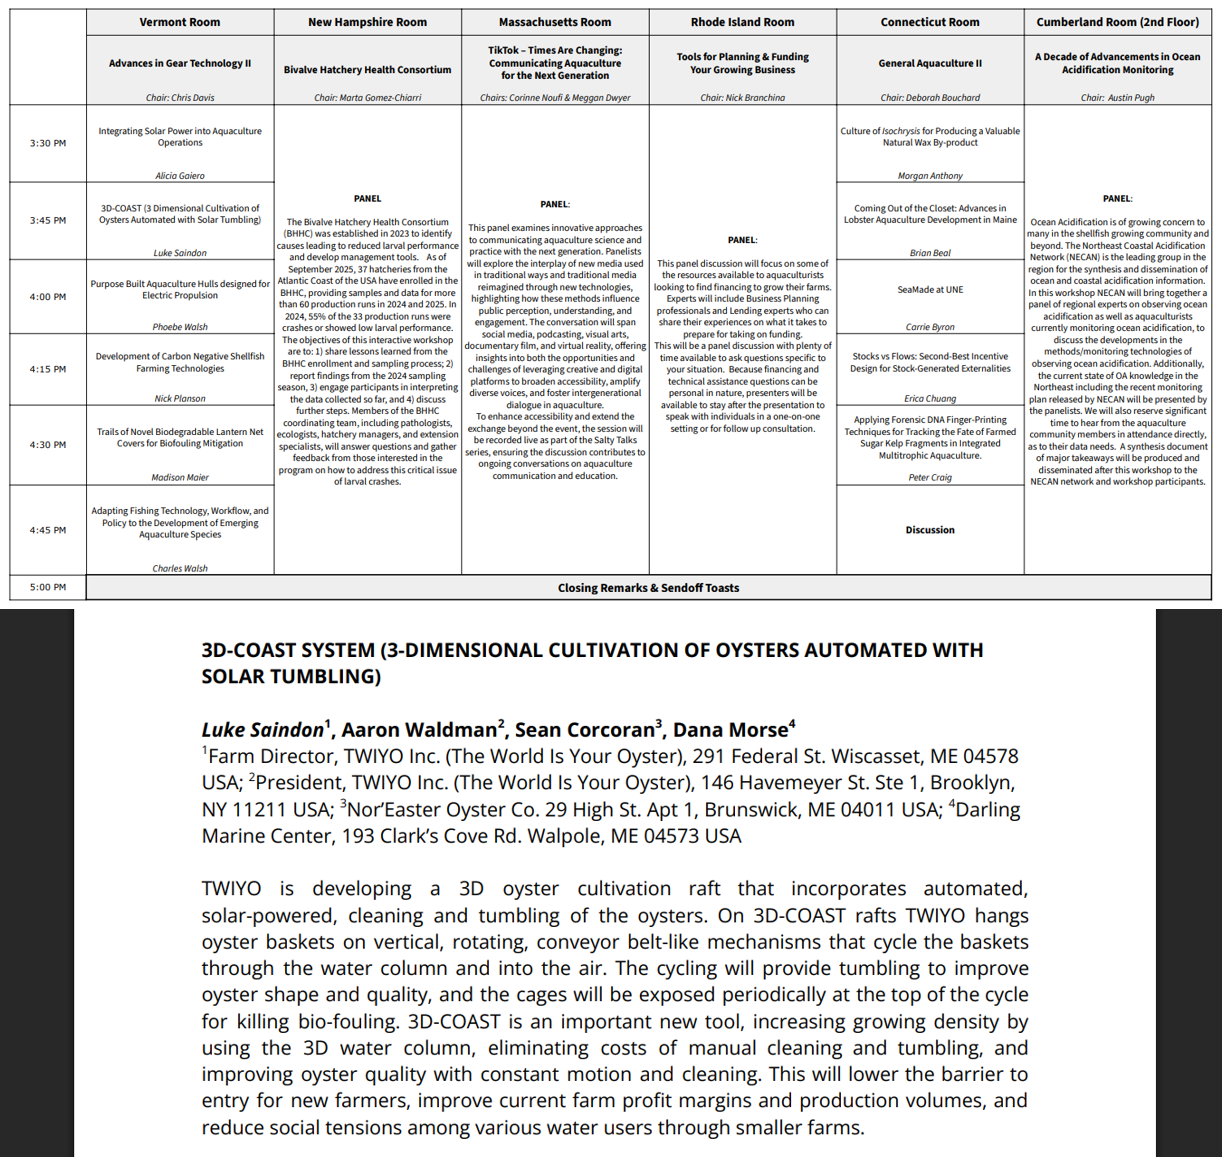
Figure 2: A CAD rendering pointing out the main components of a 3D-COAST raft
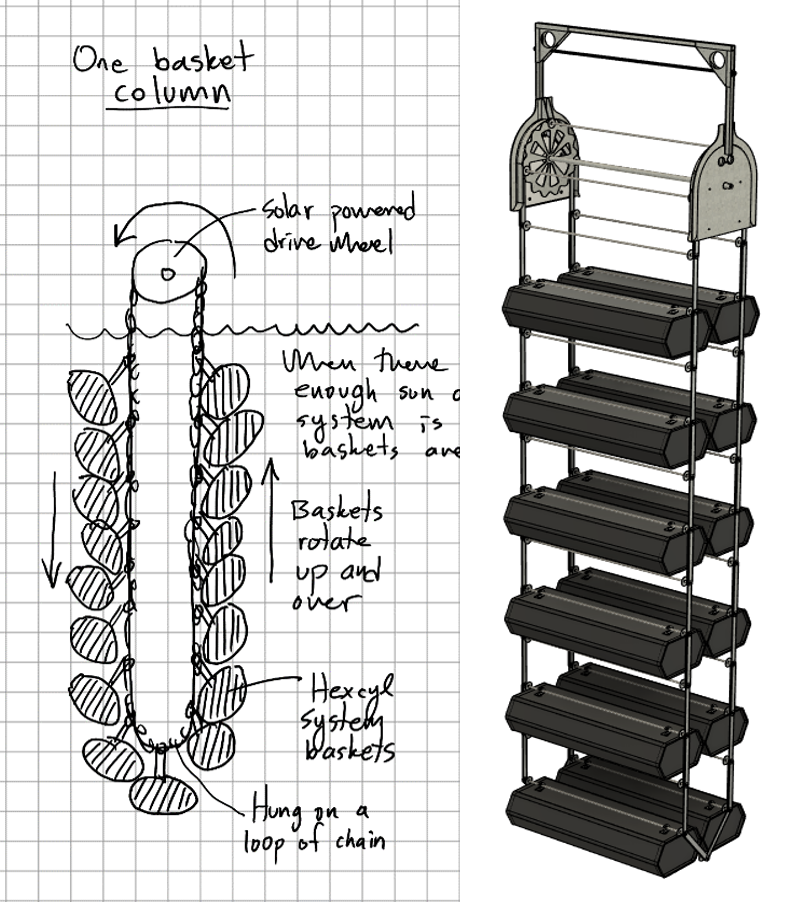
Figure 3: A simple diagram (left) and a CAD design (right) showing how columns of baskets are hung from loops of chain that run over a solar-powered drive wheel. This wheel will rotate the loop of chain continuously and slowly, cycling three times per day, gently tumbling the baskets and exposing each one to sun for a couple of hours to limit the biofouling. 24 such rotators are affixed to each raft.
The act of rotating oyster cages up and down within the water column provides several benefits. During the up and down journey of a cage, the movement will provide gentle tumbling action to improve oyster shape, quality, and shell form while eliminating the manual task of tumbling the oysters periodically. Additionally, the cages will be exposed to air and sun for several hours each day at the top of the cycle. This will kill biofouling that clog the cages and eliminate the manual cleaning usually required. Figure 3 shows a detail of how the cages are hung on a rotating ladder system. Drive power required to rotate all of the oysters on one raft averages around 100W, provided by two solar panels, which would rotate all the baskets through one cycle every 6 hours (the sprockets over which the basket chain drapes rotate roughly 1 revolution/hour). This would give each basket 2-3 hours above the water surface on each cycle.
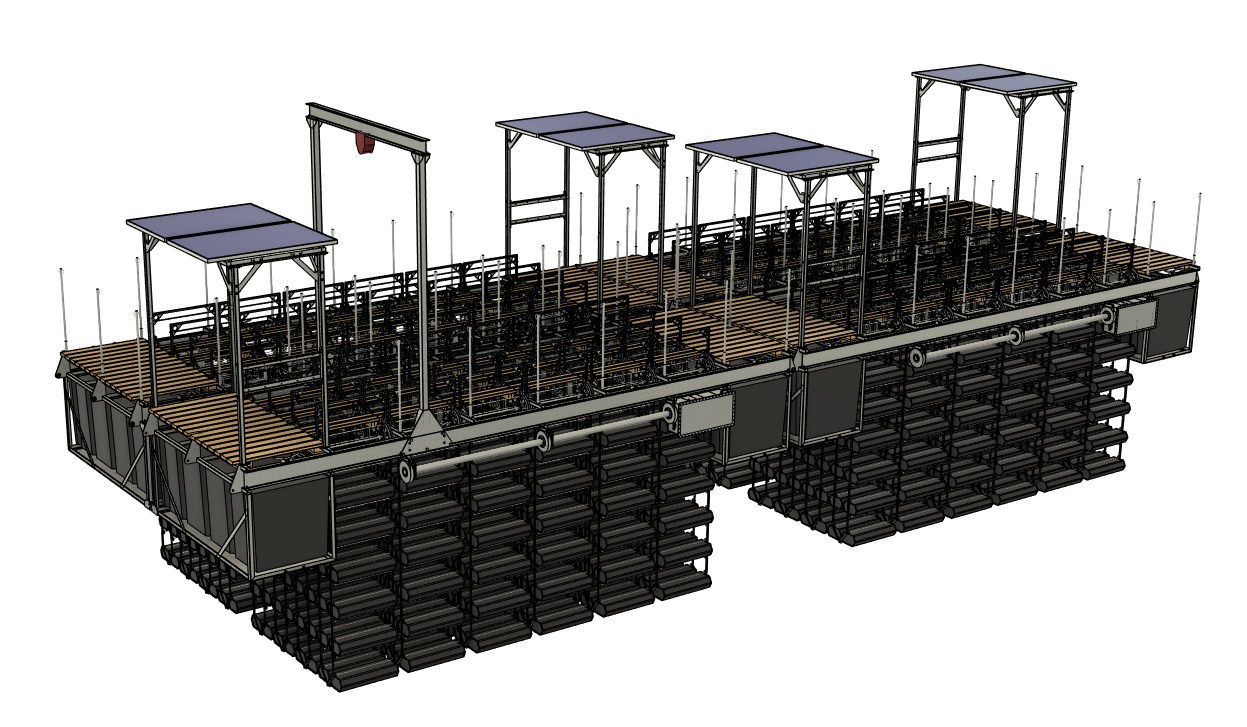
Figure 4: The set of four 3D-COAST rafts modularly combined above could produce 500,000 oysters per year. This would require only 800 square feet, or two Maine LPA licenses. Significantly reducing the footprint of farms, and making the size of necessary leases smaller, both helping farmers turn profits more easily and sooner (smaller leases are quicker to get) as well as improve social license issues (farms aren’t as intrusive looking to riparian owners or take away as much space from heritage fisheries).
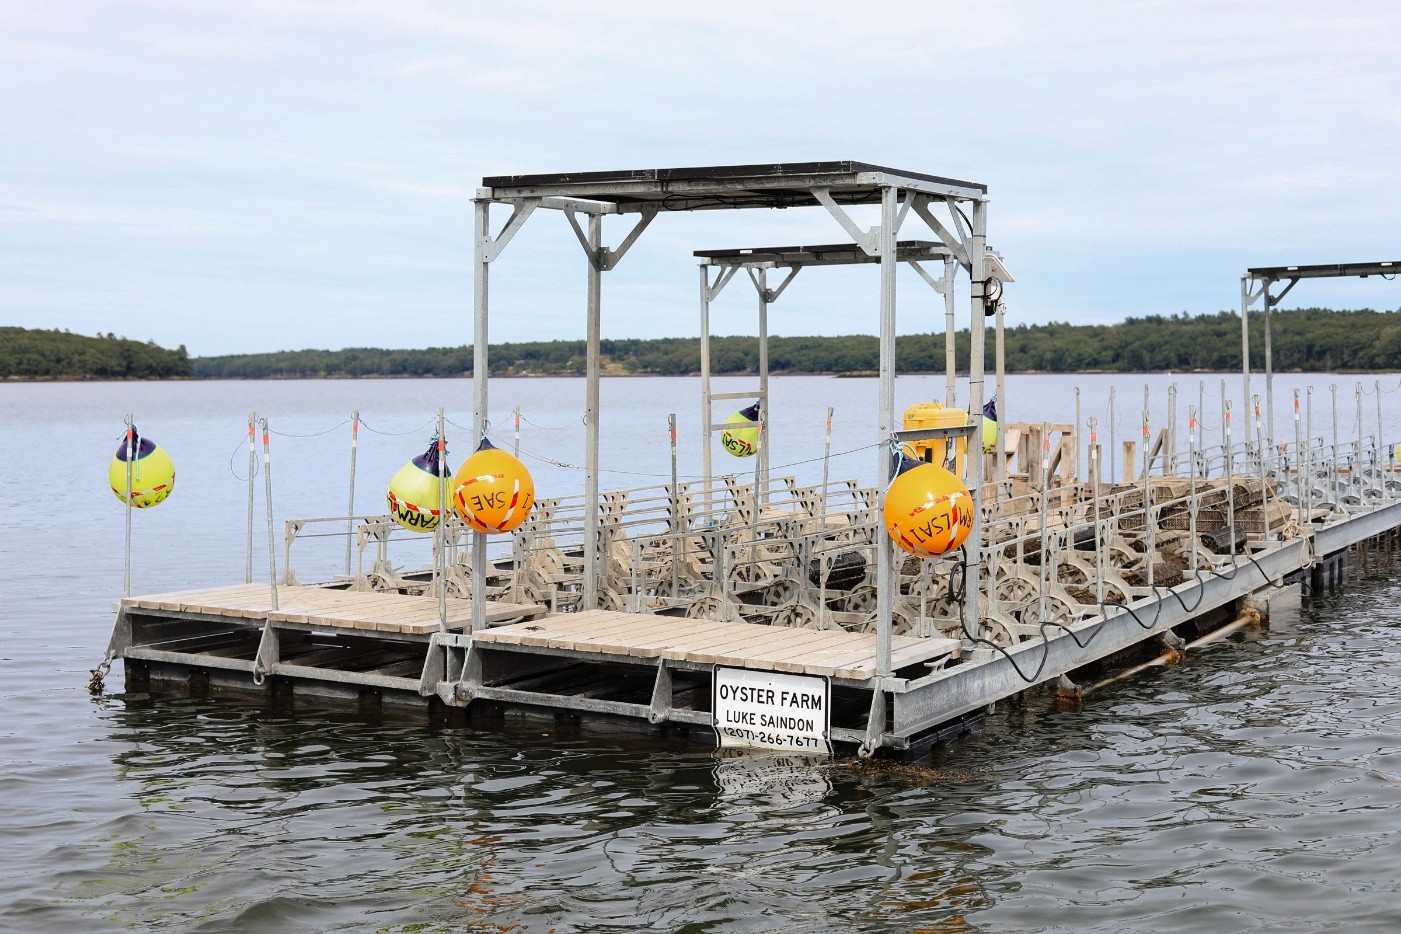
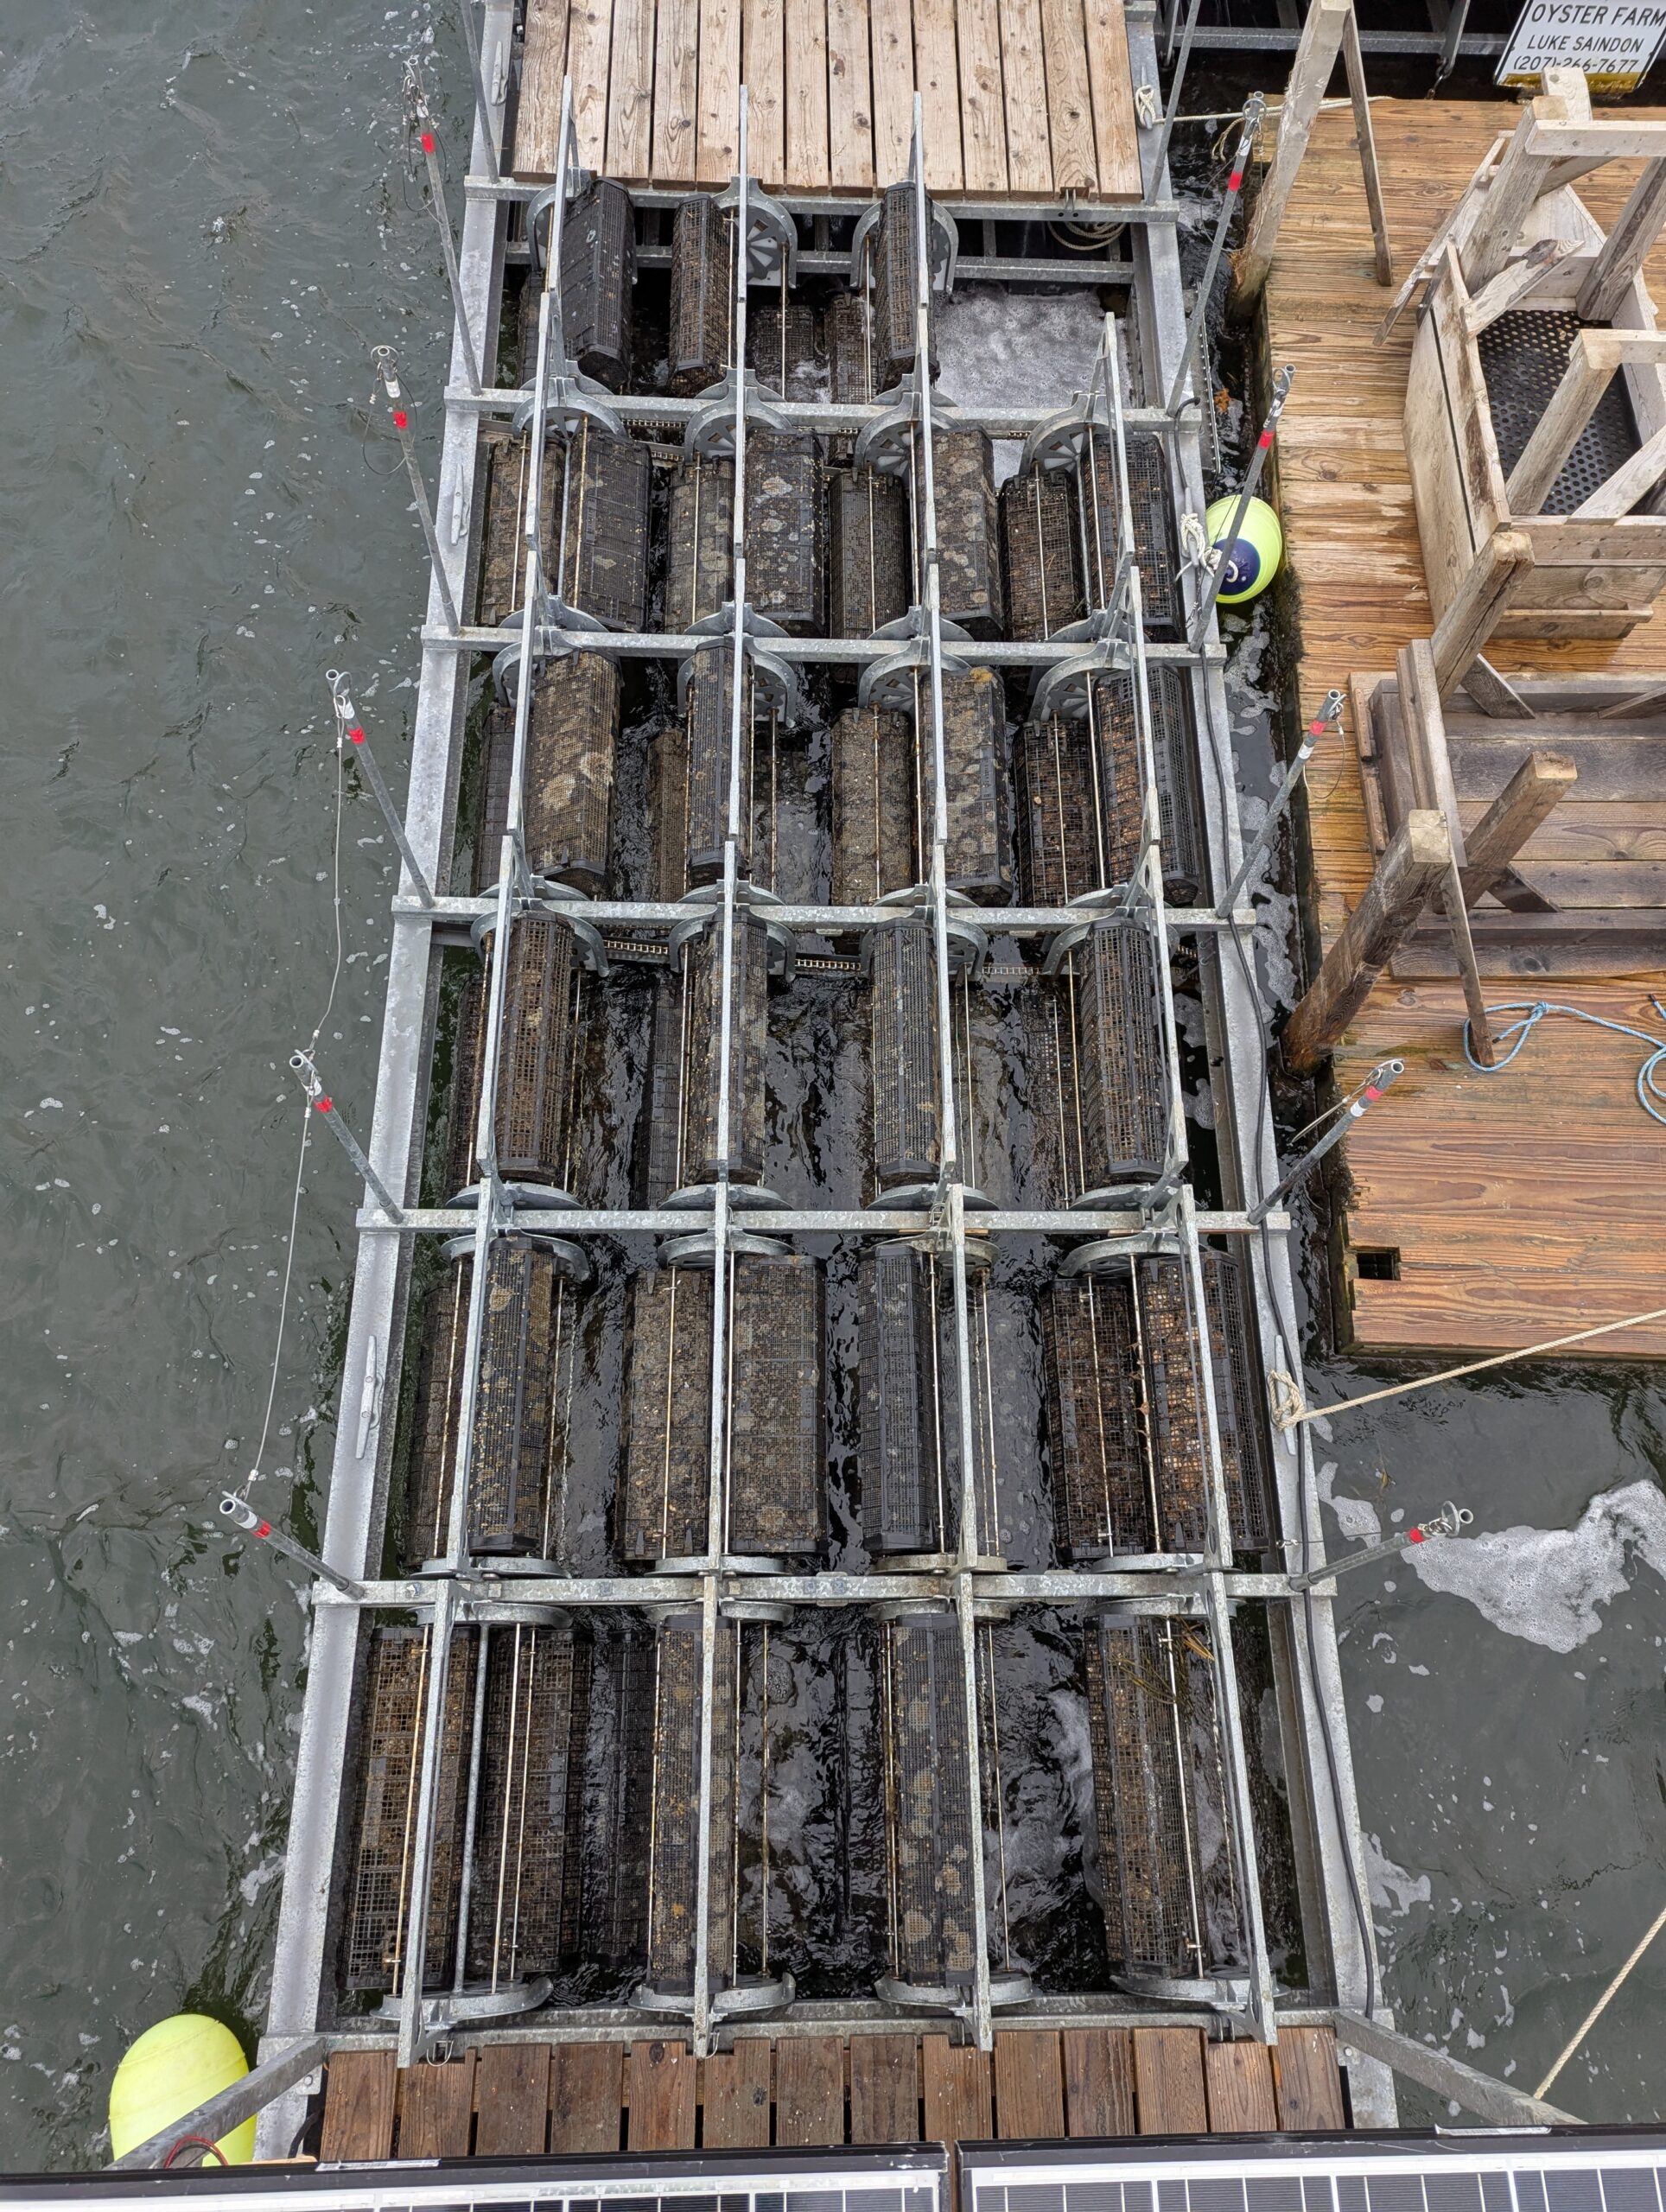
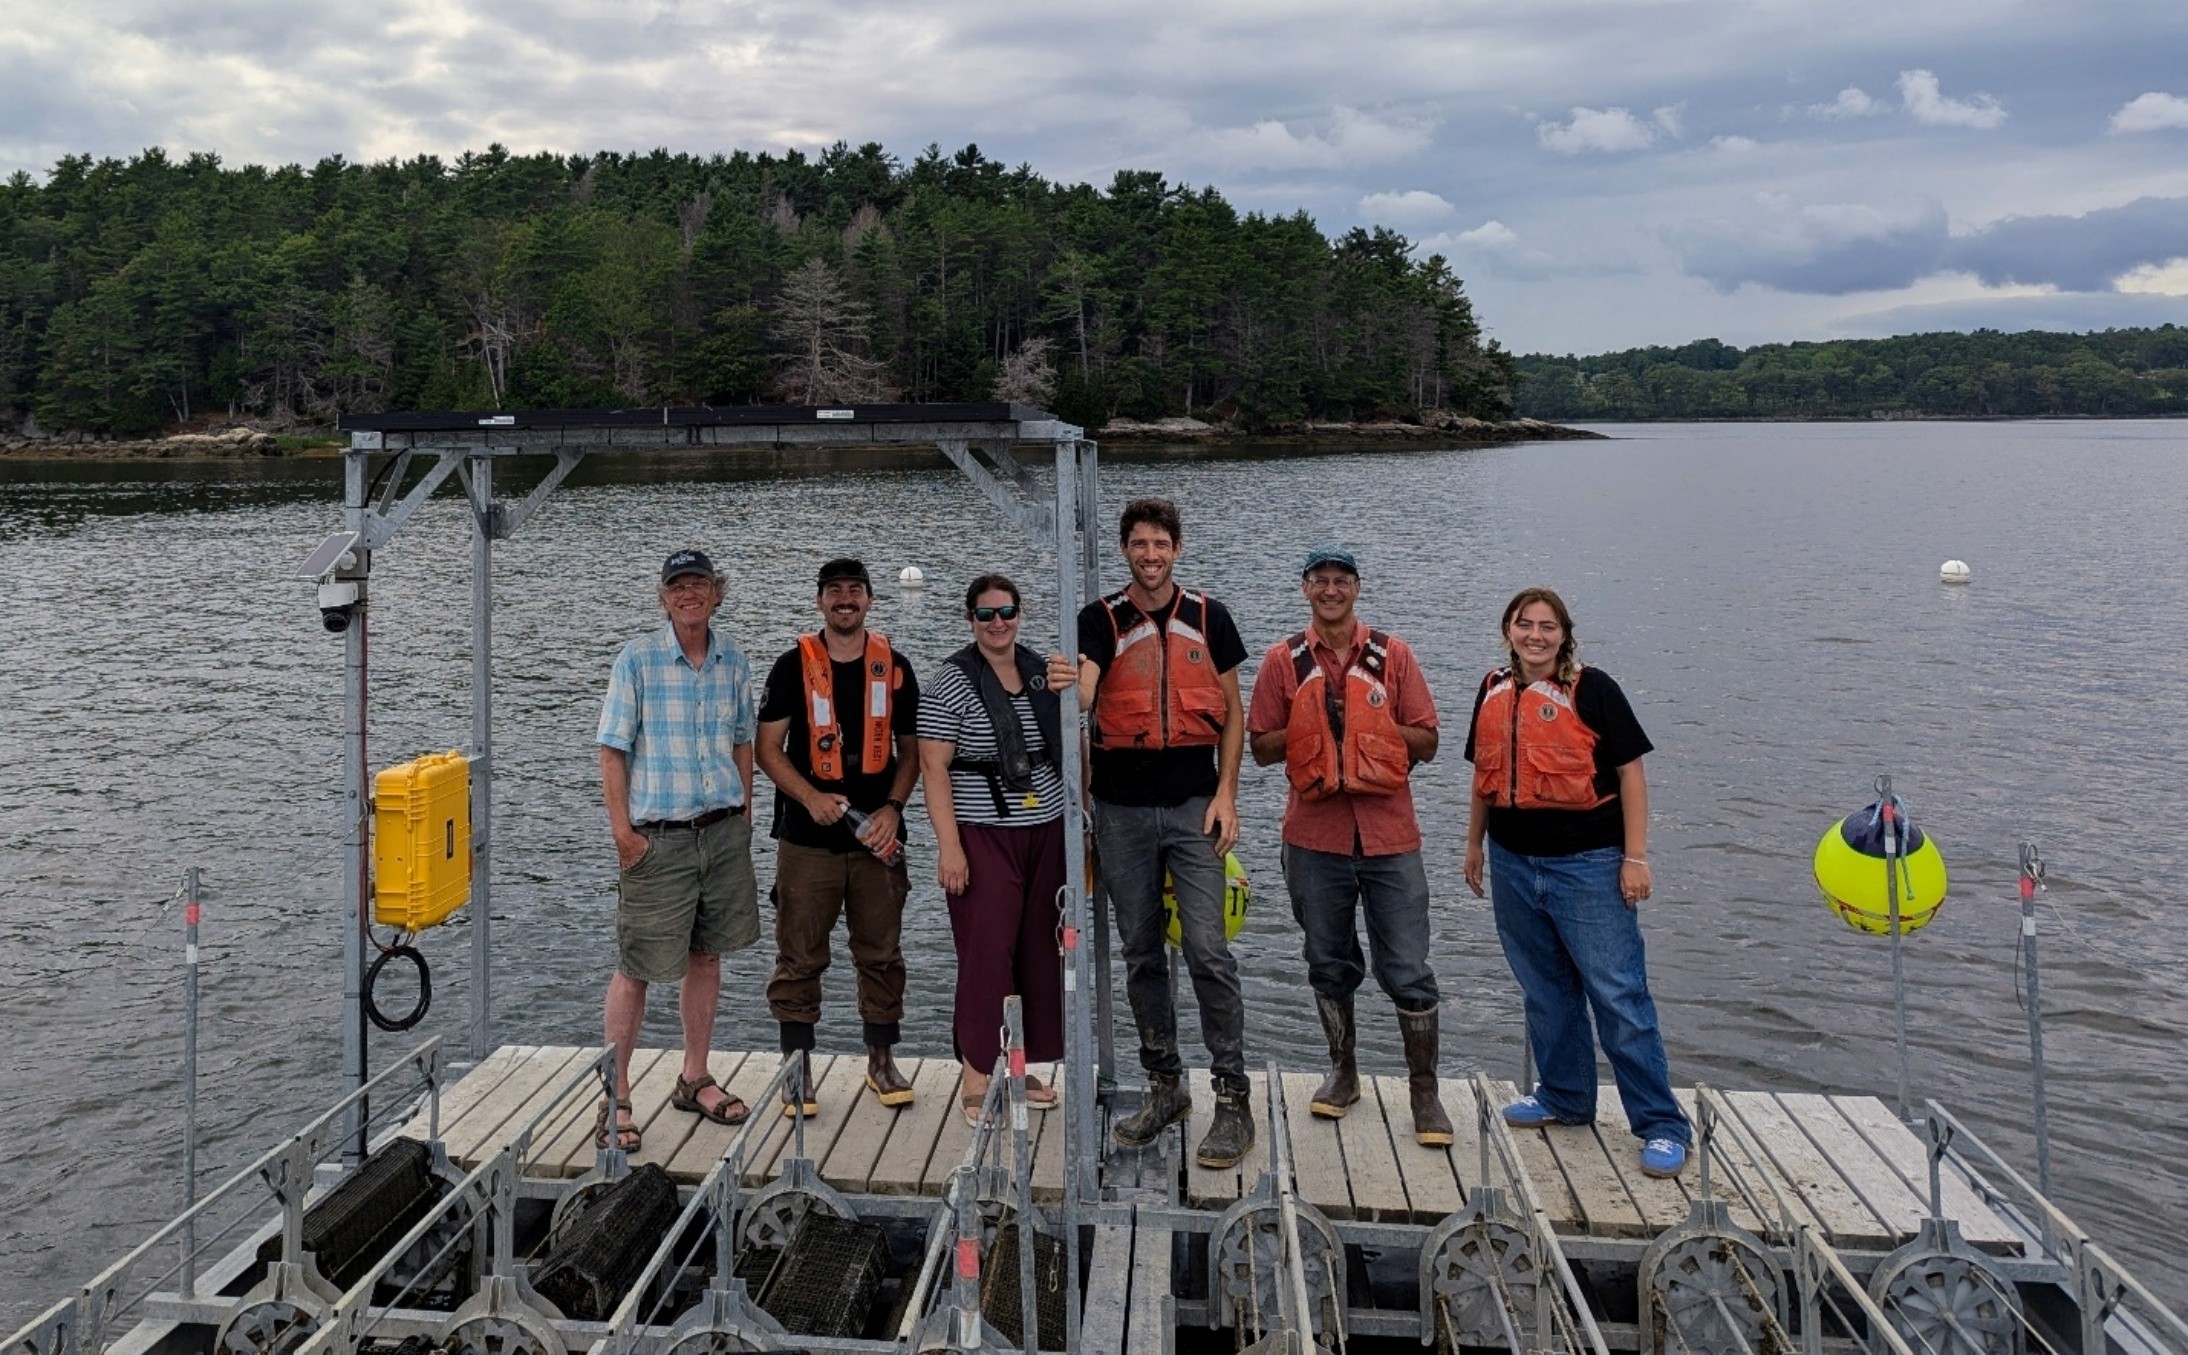
Figure 5: 3D-COAST rafts deployed on the TWIYO farm that were upgraded and used during this grant
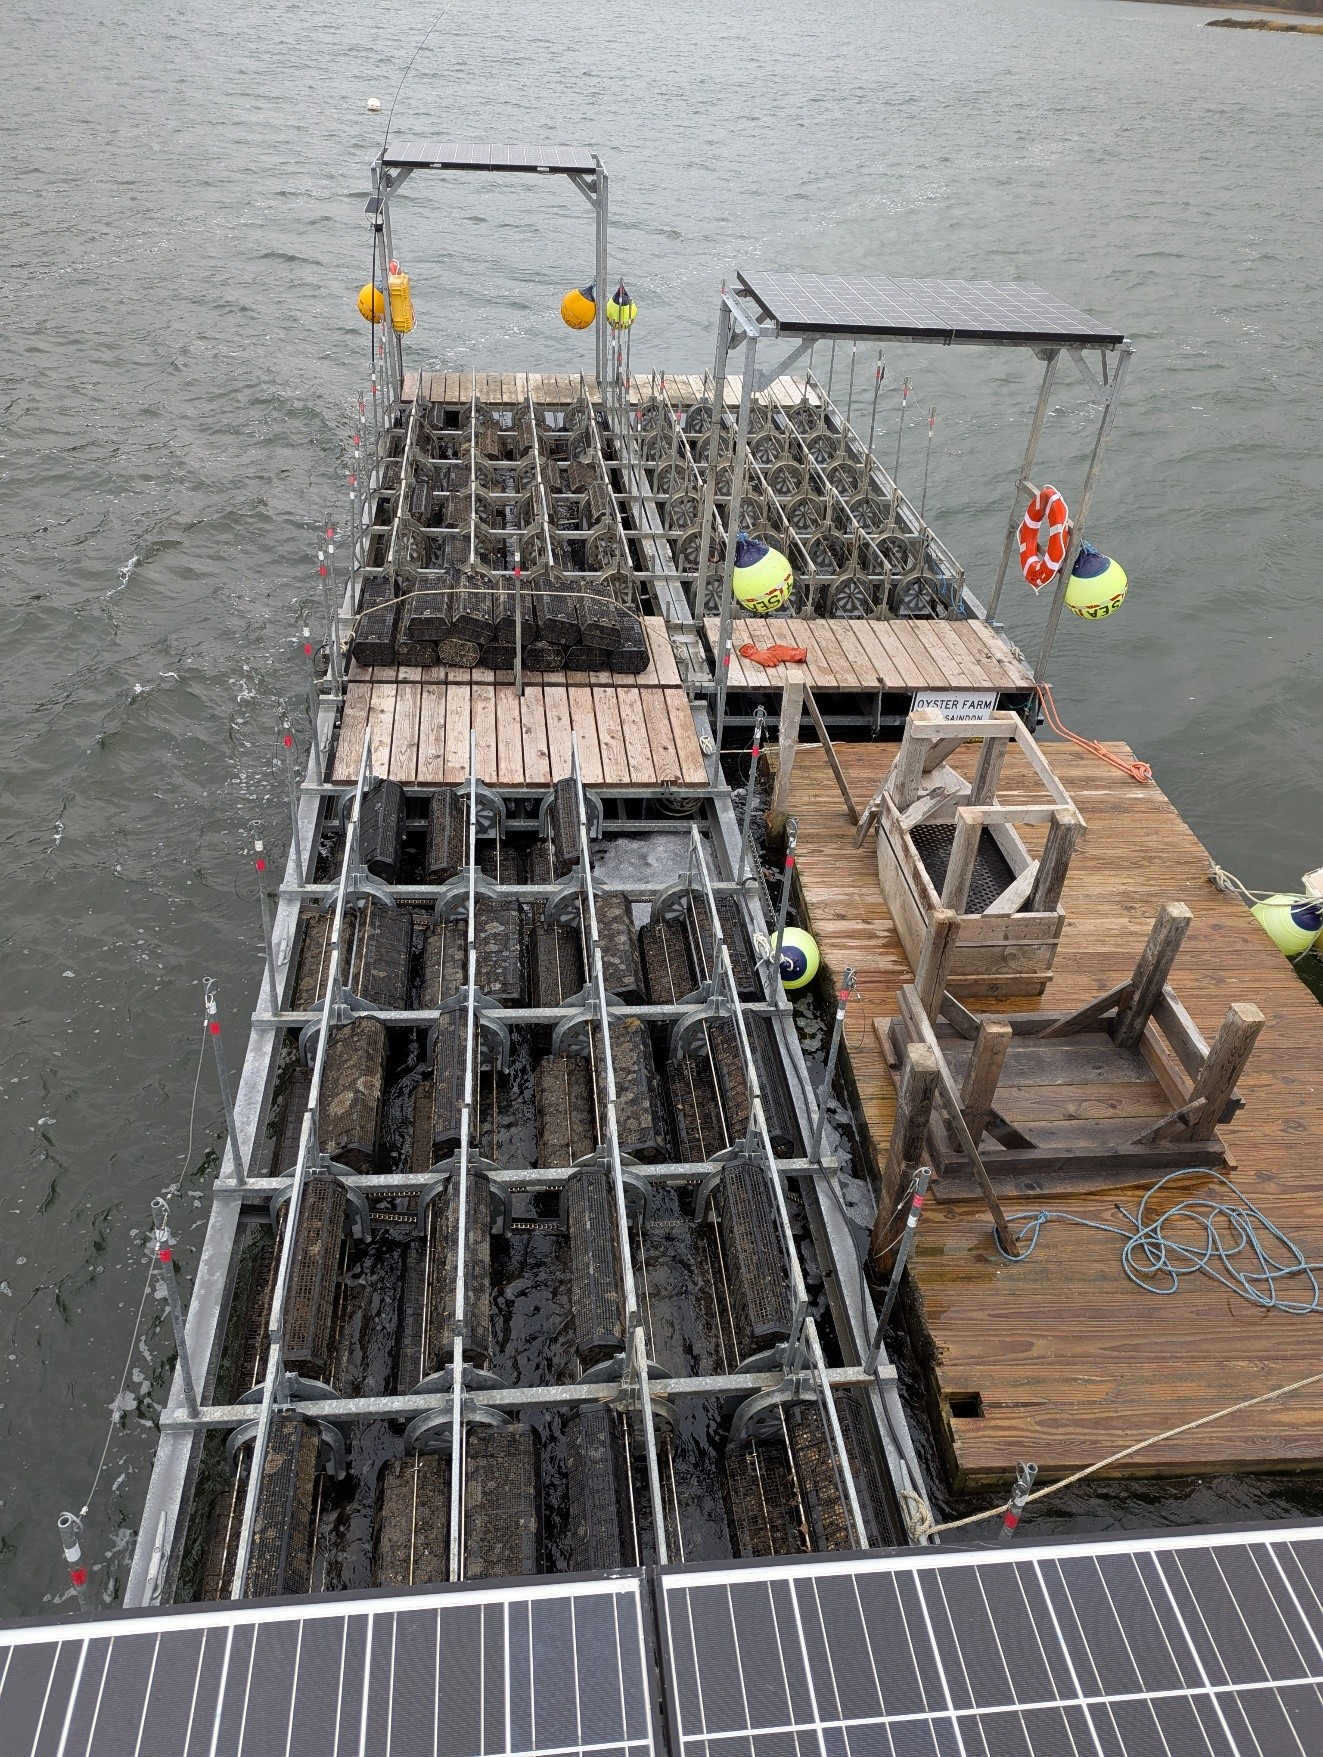
Figure 6: Additional top-view of operational 3D-COAST rafts
1.4.2. Catering
Our oyster catering service in NYC distributes some of the product from our Maine farm by providing raw bar and roaming shucking services to a wide variety of events ranging from weddings, to pop-ups, to conferences. Annual revenue from catered events averages $50k per year.
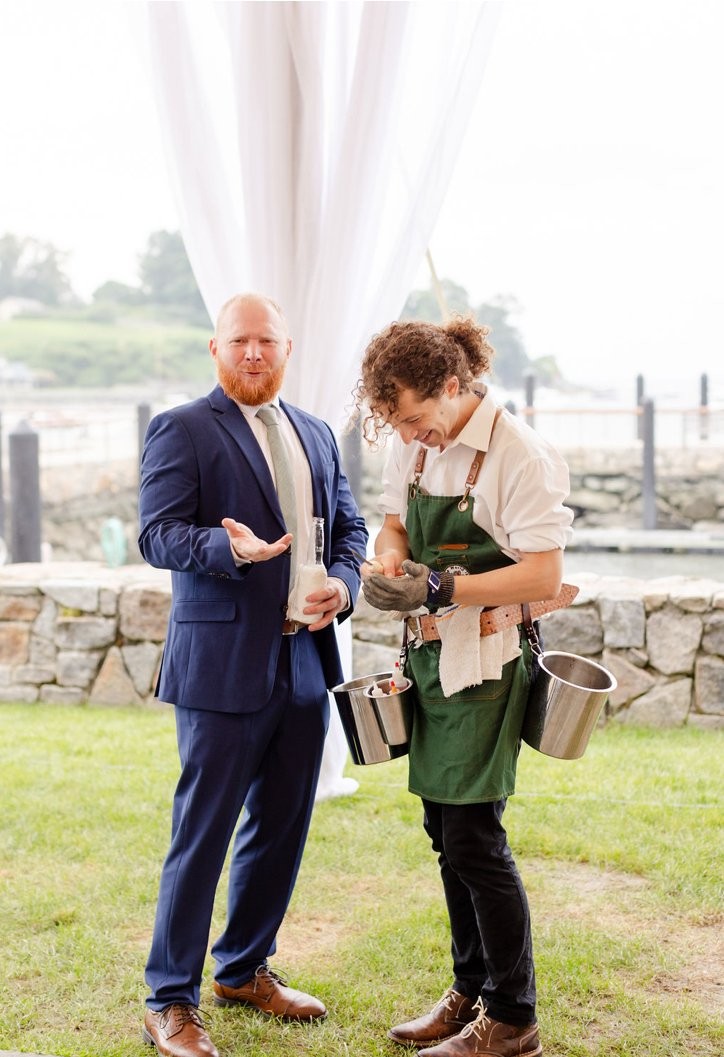
Figure 7: Founder Aaron Waldman working as a roaming shucker at a TWIYO catered event
1.4.3. Retail Delivery
Retail delivery is TWIYO’s original department: It began in 2020 when founder Aaron Waldman founded the Northeast oyster CSA. The CSA model has now been replaced by home deliveries in New York City and the Hudson Valley. The oysters distributed in the CSA were originally from other farms, but now they are all sourced from our farm. This department was the primary source of revenue for TWIYO, peaking at $324K in 2023, but over time wholesale from the farm has become more of the focus, with that projected to reach roughly $800k revenue by 2028 while retail delivery is a small, albeit high margin, piece of our business that generates roughly $30k per year (as of 2025).
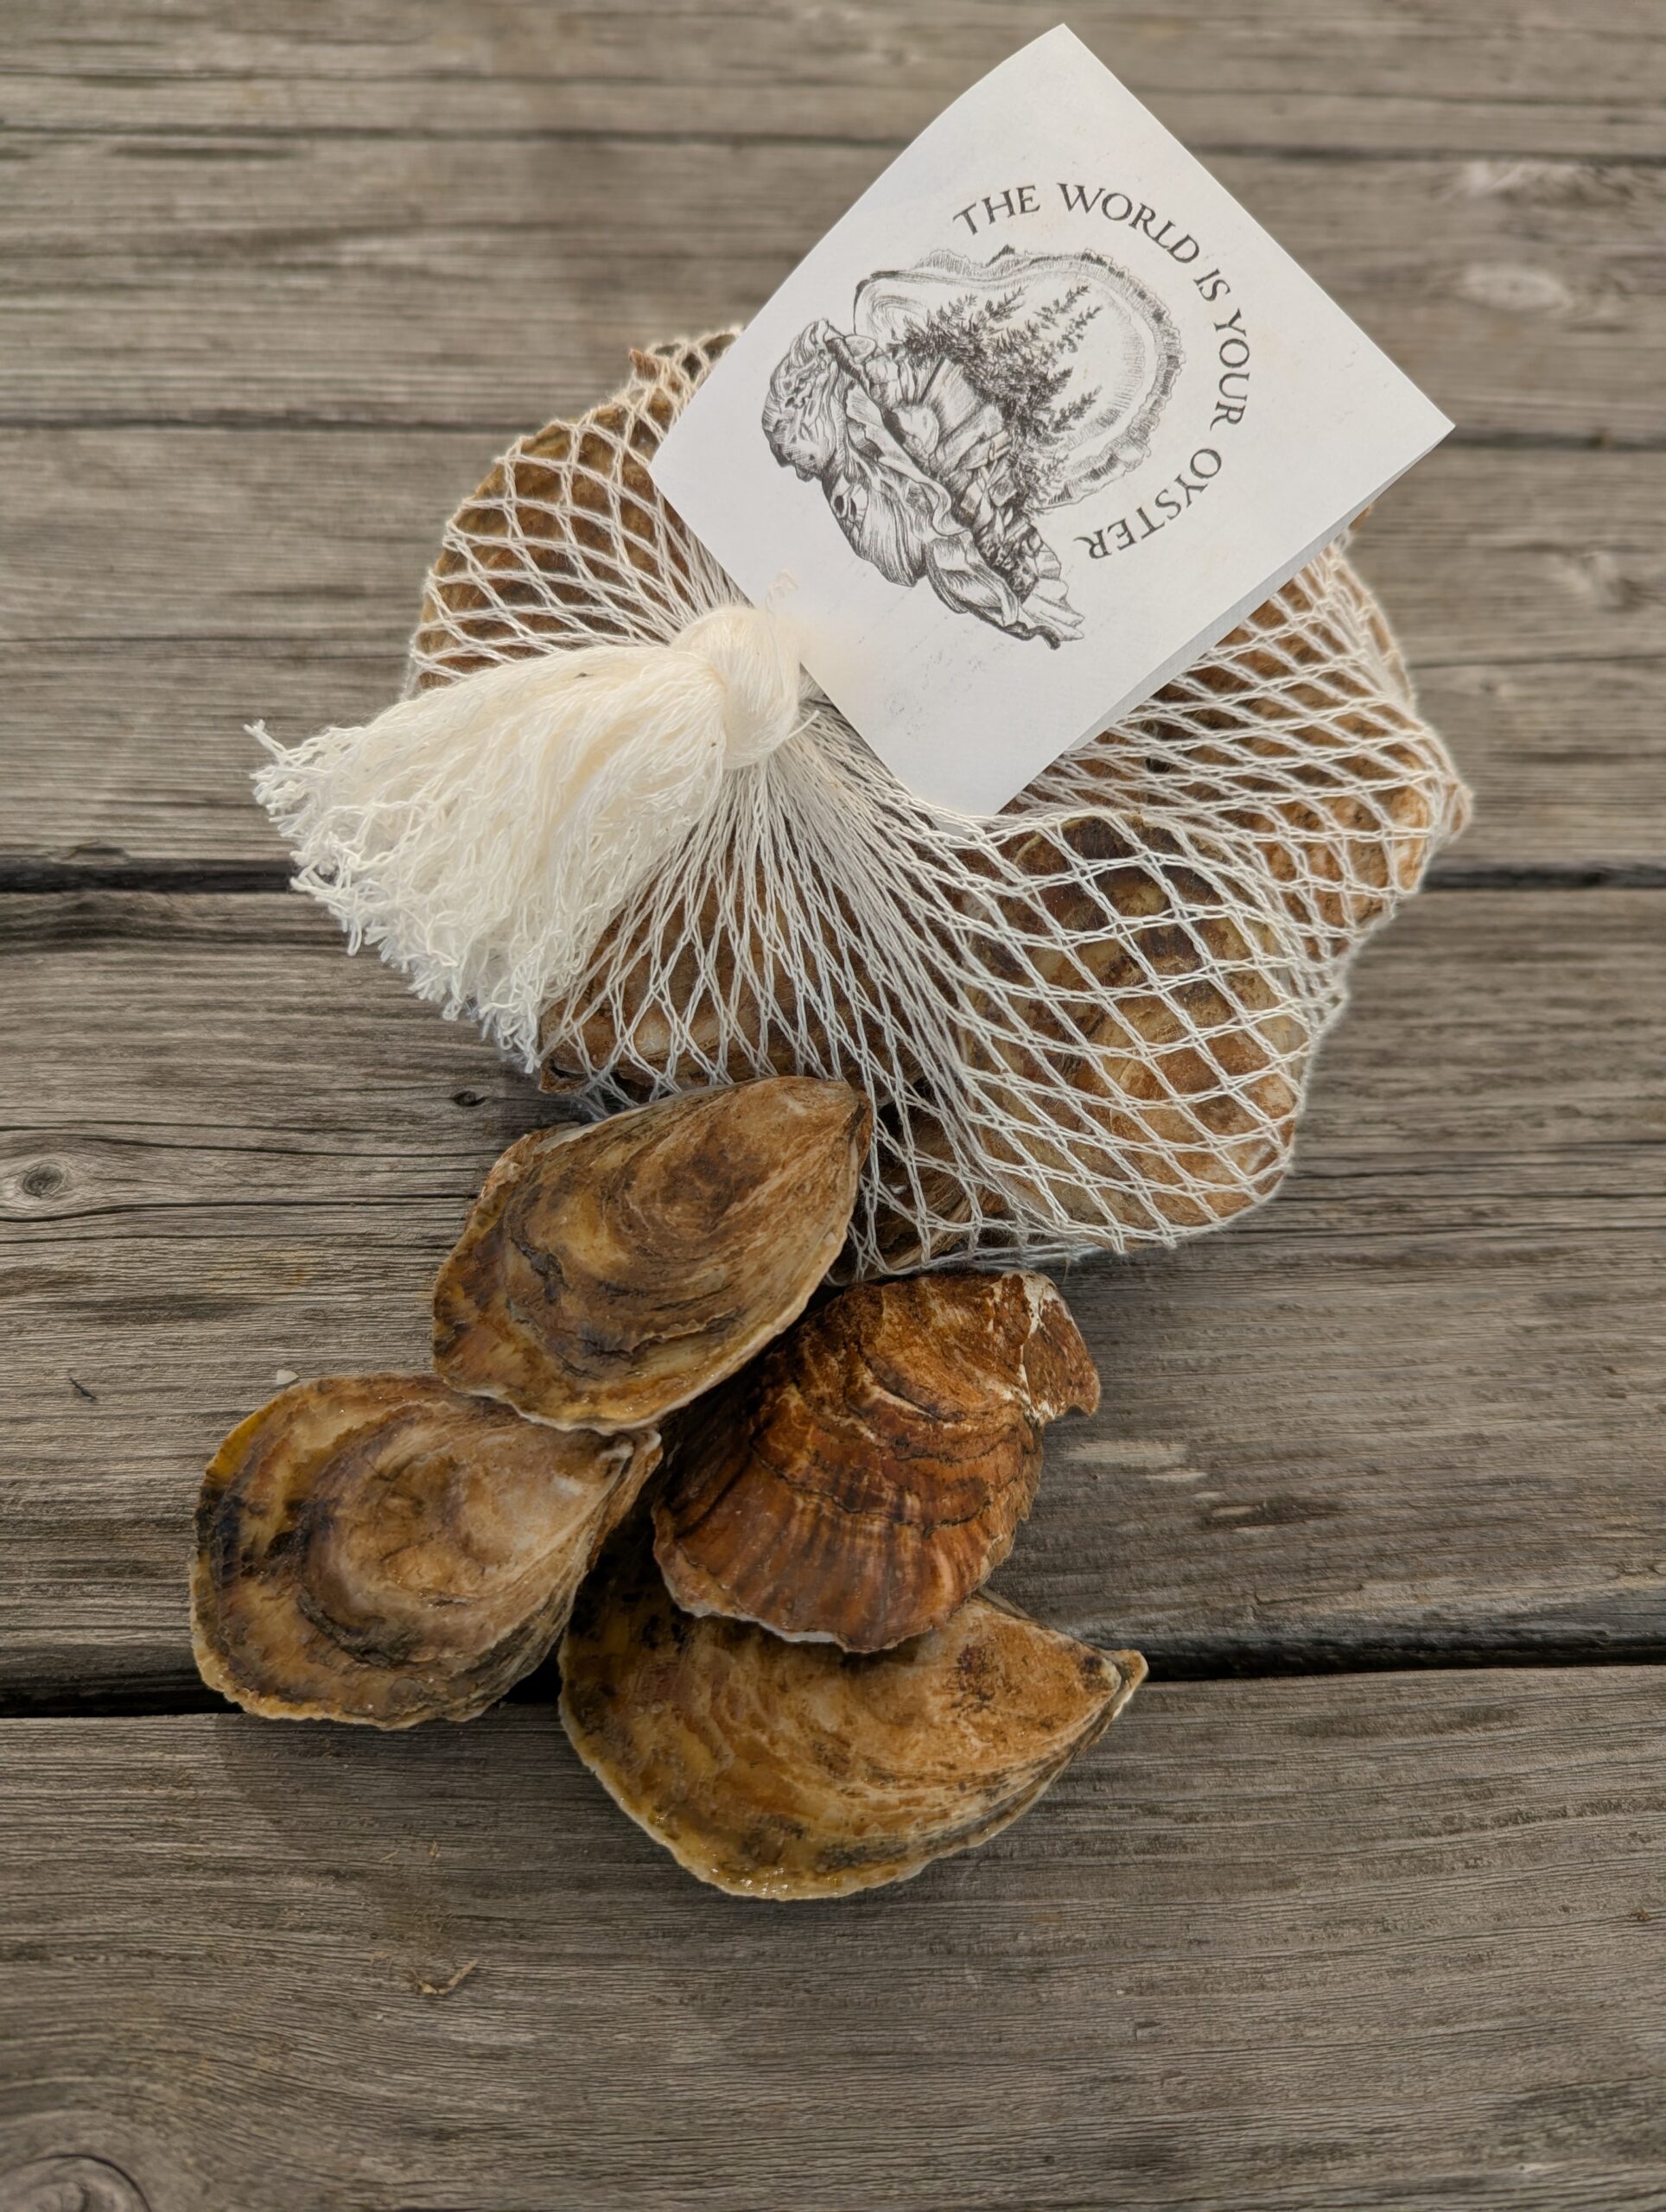
Figure 8: A bag of TWIYO Stone Fruit oysters prepared for the shellfish CSA
1.4.4. Oyster Equipment Sales
The newest department is one which will sell our new farm gear (3D-COAST) to other aquaculture business, helping modernize and develop the US aquaculture sector. No gear has yet been sold, and realizing this goal is somewhat dependent on future funding, with a commercialization plan proposed in a USDA Phase II SBIR application that involves beta testing the equipment on 3rd party farms. In the scenario where this Phase II is funded and TWIYO moves forward with becoming a gear supplier Table 1 shows the target numbers for raft distribution.
Table 1: Projected 3D-COAST Raft Sales & Market Segments
|
Year |
2027 |
2028 |
2029 |
2030 |
|
Target Area Market (TAM) |
Maine |
New England |
New England |
New England |
|
TAM Farm Gate Sales[1] |
$12,444,877 |
$72,444,734 |
$73,966,073 |
$75,519,360 |
|
TAM Equipment Spending[2] |
$1,792,062 |
$10,432,039 |
$10,651,112 |
$10,874,785 |
|
3D-COAST Rafts Sold |
4 |
8 |
8 |
20 |
|
3D-COAST Sales[3] |
$160,000 |
$326,400 |
$332,928 |
$848,966 |
|
Our Market Share |
8.93% |
3.13% |
3.13% |
7.81% |
1.4.5. Team
The core team at TWIYO is composed of president Aaron Waldman, events director Kyle Crew, and farm director Luke Saindon. Their diverse backgrounds, which range from engineering to music to food service and events, have fostered a grounded, innovative mentality which has turned a one-man oyster wholesale experiment into a $350k/year three-owner S-Corp with two write-ups in the New York Times.
Aaron Waldman, from Southern Maine, was the founding member of TWIYO Inc. Aaron has spent over half of his life working in restaurants and bars. His experience has proven invaluable in connecting with wholesale clients, finding catering opportunities for the events department, and ensuring that all seafood is stored and transported safely. The interpersonal skills he developed through bartending make him a strong leader and networker, and have allowed him to put together a talented team of owners to manage a vertically-integrated seafood company that does everything from farming oysters in Maine to catering events in New York City.
Luke Saindon is the TWIYO farm director, and started the company’s oyster farm in Wiscasset, Maine in 2021. The Maine oyster farm is the focus of this USDA funding. Luke grew up in Deer Isle, Maine, a community tied closely to the working waterfront, and was looking for ways to return to that setting in some form while combining his love for engineering, care for the ocean, and a desire to help fight our environmental challenges. Luke is a licensed professional engineer with a background in mechanical engineering: his experience in prototype development and R&D for the Navy, NASA, and the Air Force provide an excellent foundation for farm related technology development tasks such as 3D-COAST. He has worked for various small engineering firms developing new technology through SBIRs; this experience was both technically involved and practical as ideas are developed from theory to product. Much of Luke’s aquaculture knowledge has come from attending various workshops, specifically the Aquaculture in Shared Waters courses, as well as hands on learning by interacting with other local oyster farmers. Luke has worked in the New England area for his whole career and understands the local supply chain for materials and engineering services and was responsible for leading this SARE project.
Kyle Crew joined The World Is Your Oyster in 2021 to help Aaron with delivery driving and logistics. It quickly became apparent that his decade of catering and private bartending in New York City made him the perfect candidate for running the catering department: His connections with hotels and venues throughout the city bring in a steady flow of private events opportunities and popups, his knowledge of fellow caterers ensure that staffing is never an obstacle, and his experience working black tie affairs shows through in the attention to detail and attractive visual presentations he brings to all of TWIYO’s private events. These events in NYC provide an excellent sales outlet for the oysters produced on the farm.
Our team’s financial acumen has allowed us to develop from a one-van wholesale operation founded with $6,000 to a full-fledged oyster farm with 1,000,000+ seed in the water and over $200,000 of assets. We funded all of our growth from 2020-2023 with our own profits, and did not have to take out any loans until 2024. Our experience with cashflow management has taught us to plan ahead while keeping our options open for the many hurdles that inevitably arise while operating a small business. Keeping a diverse group of revenue streams while we prepare the 3D-COAST System for commercialization will allow us to adapt as necessary to ensure robust management of our entity and our funds.
Because TWIYO did not have a deep background in aquaculture at the onset the business, we have developed a good working relationship with local farmers and the University of Maine. Specifically, Sean Corcoran, who was the director of operations at John’s River Oyster Company, and Dana Morse who is the aquaculture lead at the Maine Sea Grant and University of Maine Cooperative Extensions. Both Dana and Sean have been collaborators on previous 3D-COAST related grants and have continued to lend their expertise as needed during troubleshooting and assessment of the husbandry related tasks around the development of 3D-COAST and the oyster farm in general. Additionally, TWIYO regularly hosts industry visits and solicits feedback on the 3D-COAST demonstration farm from organizations such as the Maine Aquaculture Association, Island Institute, and Darling Marine Center.
In addition to the three founders, three part time aquaculture technicians assist on the farm 2-3 days per week. By full operation in 2028 employment is projected to grow to 4 full time positions in addition to the founders. Beyond providing employment there are several other direct impacts TWIYO will have on the northeast economy:
- Our manufacturer of 3D-COAST oyster rafts is a Maine company, and for every raft built will take 1.5 people 1 month (based on historical data from past build-years). Therefore, when you consider the planned sales of the gear to external farms plus replacement (8-year lifecycle) on TWIYO’s own farm there will need to be approximately 21 rafts built per year by 2030. This equates to our manufacturer adding approximately 3 well-paid full-time fabrication jobs.
- All raw materials for raft construction will be purchased from Maine-based suppliers, such as Tri-State Steel in Auburn. These raw materials equate to roughly $15,000 per raft built, or an additional $315,000 per year spent in the Maine economy.
- The oyster farm raw inputs, primarily oyster seed, will be purchased from Maine hatcheries, or an additional $65,000 per year.
[1] Farm gate sales reported to The East Coast Shellfish Grower’s Association’s in 2023, with a compounded annual growth rate of 2.1%
[2] Equipment spending estimates based on averages from the Maine Aquaculture Association’s 2019 Benchmarking Report
[3] Rafts will be sold for $40,000 in 2027, then increased 2% annually for inflation
Cooperators
- - Technical Advisor
- - Producer
Research
3.1. Materials and Methods
In the proposal for this SARE award TWIYO organized the proposed work into tasks categorized by objective.
Objective 1: Construct the next generation 3D-COAST prototype raft that increases the technology readiness level (see objectives section for details).
Note: The design aspects of the updates for the new generation raft have either been completed already or are not part of the scope of this grant, this funding focuses specifically on executing the updates and then using the more refined hardware to collect new data needed about the system before it can be used on real sea farms.
Note: To reduce cost an old generation raft can be mostly repurposed and retrofitted, not all parts of the design need updating.
Task 1.1: Prepare the older prototype for work by setting it up on stands, cleaning old biofouling off the frame, and removing the parts which are being replaced or upgraded. TWIYO’s farm headquarters has a fabrication and storage yard that is flat and dry, necessary dunnage, along with shipping containers for tool storage and organization in which to work.
Task 1.2: Perform a detailed assessment of exactly which parts of the new design are needed for the rebuild by surveying the old prototype while comparing it to the new design and marking parts off in the bill of materials. During prototype design TWIYO has generated a detailed bill of materials that correlates to the parts shown in the raft CAD model.
Task 1.3: Order the upgraded prototype parts from external vendors as necessary, using the drawings and manufacturing materials prepared during the design phase. The bill of materials has a tracking column where the status of each part can be tracked (quoted, ordered, shipped, received, installed, etc.). Through the process of making earlier prototype hardware TWIYO has established relationships with Maine based small businesses for welding (Willis Fabrication), machining and cutting (G&M Precision Manufacturing), raw metal material (Tri State Steel), rigging (Weymouth Yacht Rigging), etc.
Specific upgrades have been identified from previous grants (such as the USDA Phase I SBIR) which need to be addressed before commercialization. The primary examples are listed below. The design phase of these upgrades is already the scope of a different project, TWIYO needs SARE’s help in implementing the changes, testing them, and gathering data about effectiveness.
- Higher capacity floats. In to maximize growth potential TWIYO discovered that the baskets could be doubled up on the solar rotators, increasing the capacity and improving system profit margins. This, however, overtaxes the dock floats currently in use. Changing the geometry of the floats would solve this issue and maximize the system’s potential.
- Brushless DC motors. The previous rafts used brushed DC motors, which were a reliability issue. The new rafts will use more efficient and more robust modern brushless motors.
- Chain drives. The previous versions of the rafts used a cable drive system to transfer rotation from the gearbox to the oyster baskets. This was a cause of constant breakage and slipping, resulting in significant down time. This drive system needs to be overhauled and replaced with a roller chain.
- Remove hydraulics. Hydraulic tensioners were used as part of the cable drive system described above. This system will be unnecessary and add additional cost once the roller chain drive is installed.
- More rugged shear pins between driveshaft and oyster baskets. To prevent damage, the oyster basket conveyors are attached to the drive system with shear pins, these pins need to be increased in size to reduce inadvertent shearing.
Task 1.4: Once parts have been received there will be some limited assembly that must be done on site, TWIYO staff have the tools and expertise to do this assembly themselves. The primary structure of the prototype exists from the previous summer, but the new or altered features must be installed on the raft frame. Activities will include bolting in new driveshafts, wiring new drive motors, threading new drive chains, and assembling new oyster baskets.
Task 1.5: All new design functions for the upgraded 3D-COAST prototype raft will be tested on land before launching, such as driveline rotation, solar charging, and gantry crane fitment. When the raft is on stands the solar driveline can be run and tested for binding, tangles, or interference. Oyster baskets can even be hung on the conveyor belts and observed outside of the water. The focus will be on testing moving mechanical parts that are difficult to service while the raft is in the water.
Task 1.6: Transport new raft to the town landing for launch, and tow to the sea farm lease site for commissioning. TWIYO has a modified flatbed trailer which works well to drive the raft to the boat ramp. TWIYO’s work boat has the power and maneuverability to easily tow the raft down the river to the site where it can be tied up along the rest of the farm infrastructure for testing. This process has been tested with other work rafts that have been used at the farm site, and is a well-practiced event.
Objective 2: Measure reliability and evaluate any new issues (see objectives section for details).
Task 2.1: Establish a log of raft runtime. For each breakdown event log total number of baskets on the raft, the number of baskets that are not functioning in the mechanism, their position on the raft, and once they are repaired record the number of hours that they were out of commission. This information is enough to plot the percentage of baskets that were “down” as a function of time, and can be compared to the previous summer using the older prototype.
Task 2.2: For each breakdown or event in the log record what the issue was, how it was resolved, and how long the repairs took. If the issue requires larger design changes make a note so that those changes can be integrated into the next version of raft.
Task 2.3: Based on the data collected in the first two tasks estimate, at the end of the season, what the cost to the farm was from any reliability issues. Account for both the hours it took for the repairs and the team members hourly rate, as well as the lost opportunity cost of baskets that were not actively rotating.
Objective 3: Integrate and refine the integration of the 3D-COAST raft into existing farm workflows and measure labor benchmarks for farm efficiency and production modelling (see objectives section for details).
Task 3.1: Populate the new raft half with fresh oyster seed from Muscongus Bay Aquaculture’s hatchery, and half with mature oysters from the TWIYO farm. This will allow measurement of processes related both to seeding and early oyster life stages as well as harvesting and culling of older market ready oysters.
Task 3.2: Install the new gantry crane feature that will reduce lifting required to harvest oysters, the crane has been purchased previously but not installed or tested.
Task 3.3: Operate the raft for at least 3 months, harvesting oysters, splitting baskets as the oysters grow, and seeding new oysters as necessary. Each time an operation occurs record the date, number of people working, labor time, and number of units processed. For example, if 10 baskets are 90% full and need to be split into 30 baskets that are 30% full then record how many people worked for how long to split 10 baskets. This will provide a per basket metric for splitting baskets. If a change in process is developed or discovered then note this in log so that its effectiveness can be evaluated at the end of the season by looking for a decrease or increase in the process time before and after the change.
Task 3.4: Leave one basket of each year-class oyster (seed, 1-year-olds, and 2-year-olds) stationary and not solar tumbled by 3D-COAST. Twice per month measure a sample of oysters from a solar tumbled basket and one from a stationary basket. Measure the number of oysters per liter, their length, thickness, and width. This will allow TWIYO to calibrate a growth curve and statistical variance of oyster parameters, both necessary pieces of information for building a production model of the 3D-COAST system. This data has been done to a limited extent with earlier prototypes, but since reliability has been an issue it is necessary to continue gathering this data to see if outcomes improve with more consistent motion.
Task 3.5: Use MATLAB programming language to build a computer model of the 3D-COAST raft that simulates the measured growth rates using the same statistical distributions that were measured in the samples. This dimensional and growth rate model combined with the measured labor times can be put together to predict the production capacity and labor time needed to operate a 3D-COAST raft. The project leader is comfortable with the MATLAB language and has built similar computer programs for other applications.
Task 3.6: Wrap this computer model with a user-friendly graphical user interface such that it can be used as an accessible tool for assessing the suitability of the 3D-COAST system for various interested oyster farmers, to simulate and game out what their operations could look like with the system.
3.2. Research Results and Discussion
The results of this SARE funding are organized by objective, as described in the objectives and methods section.
3.2.1. Objective 1: Construct the Next Generation 3D-COAST Prototype Raft
At the start of the project there were several improvements planned for the older 2024 model 3D-COAST raft, most of those improvements were necessary, although a few turned out to be dead-ends and were changed or abandoned as better solutions presented themselves. Most of the design work was completed as part of a MTI grant before SARE, but the actual construction of the upgrades occurred during this project. Overall, this was a very practical part of the project that was all about getting hardware ready for testing and data gathering. Just before the 2025 oyster seed arrived on the farm the third and final upgraded raft was launched. The other two rafts were retrofitted while in the water.
The primary upgrades made were: Changing the solar rotation drive system from wire to chain; improved gearbox motor and bearing design; removal of a complicated hydraulic tensioning system; and reconfiguration of basket clip system. The raft floatation modifications mentioned in the proposal did not turn out to be necessary.
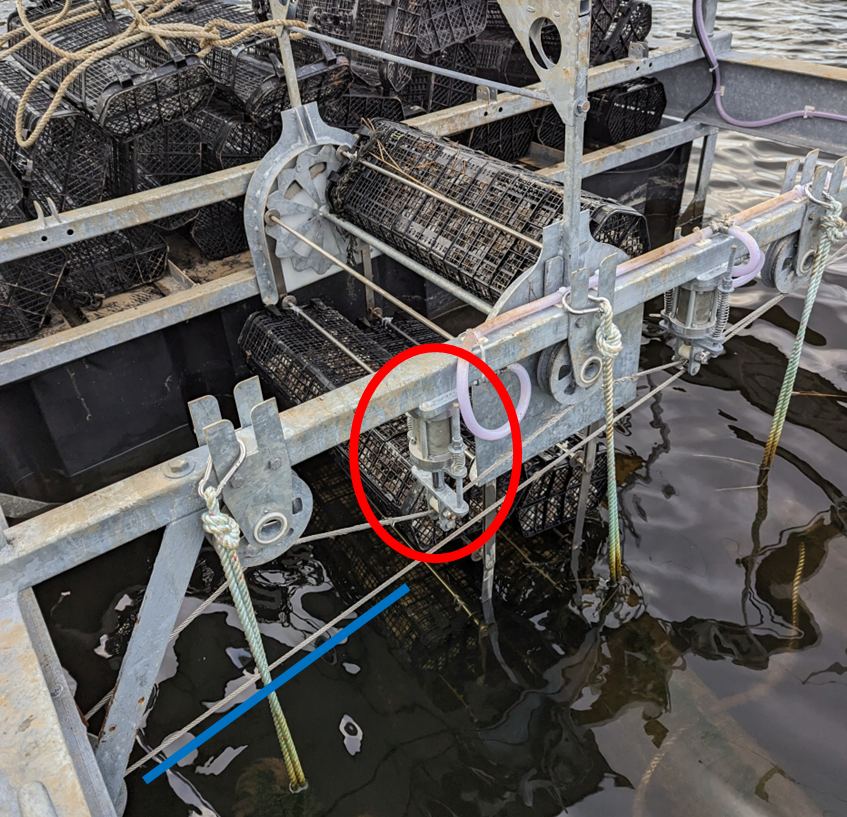
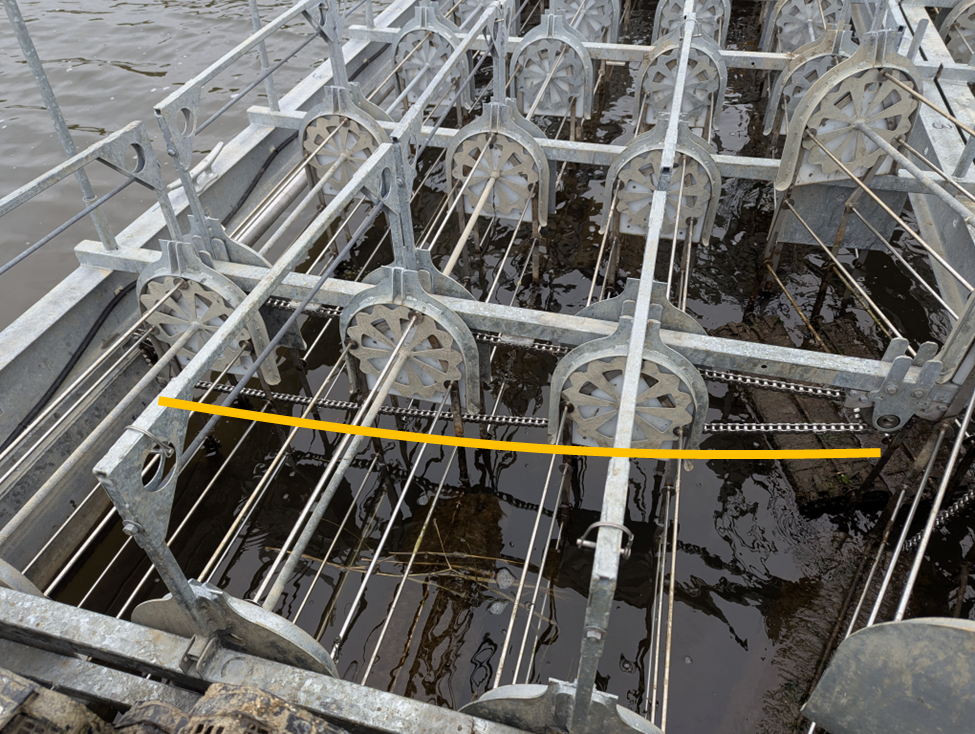
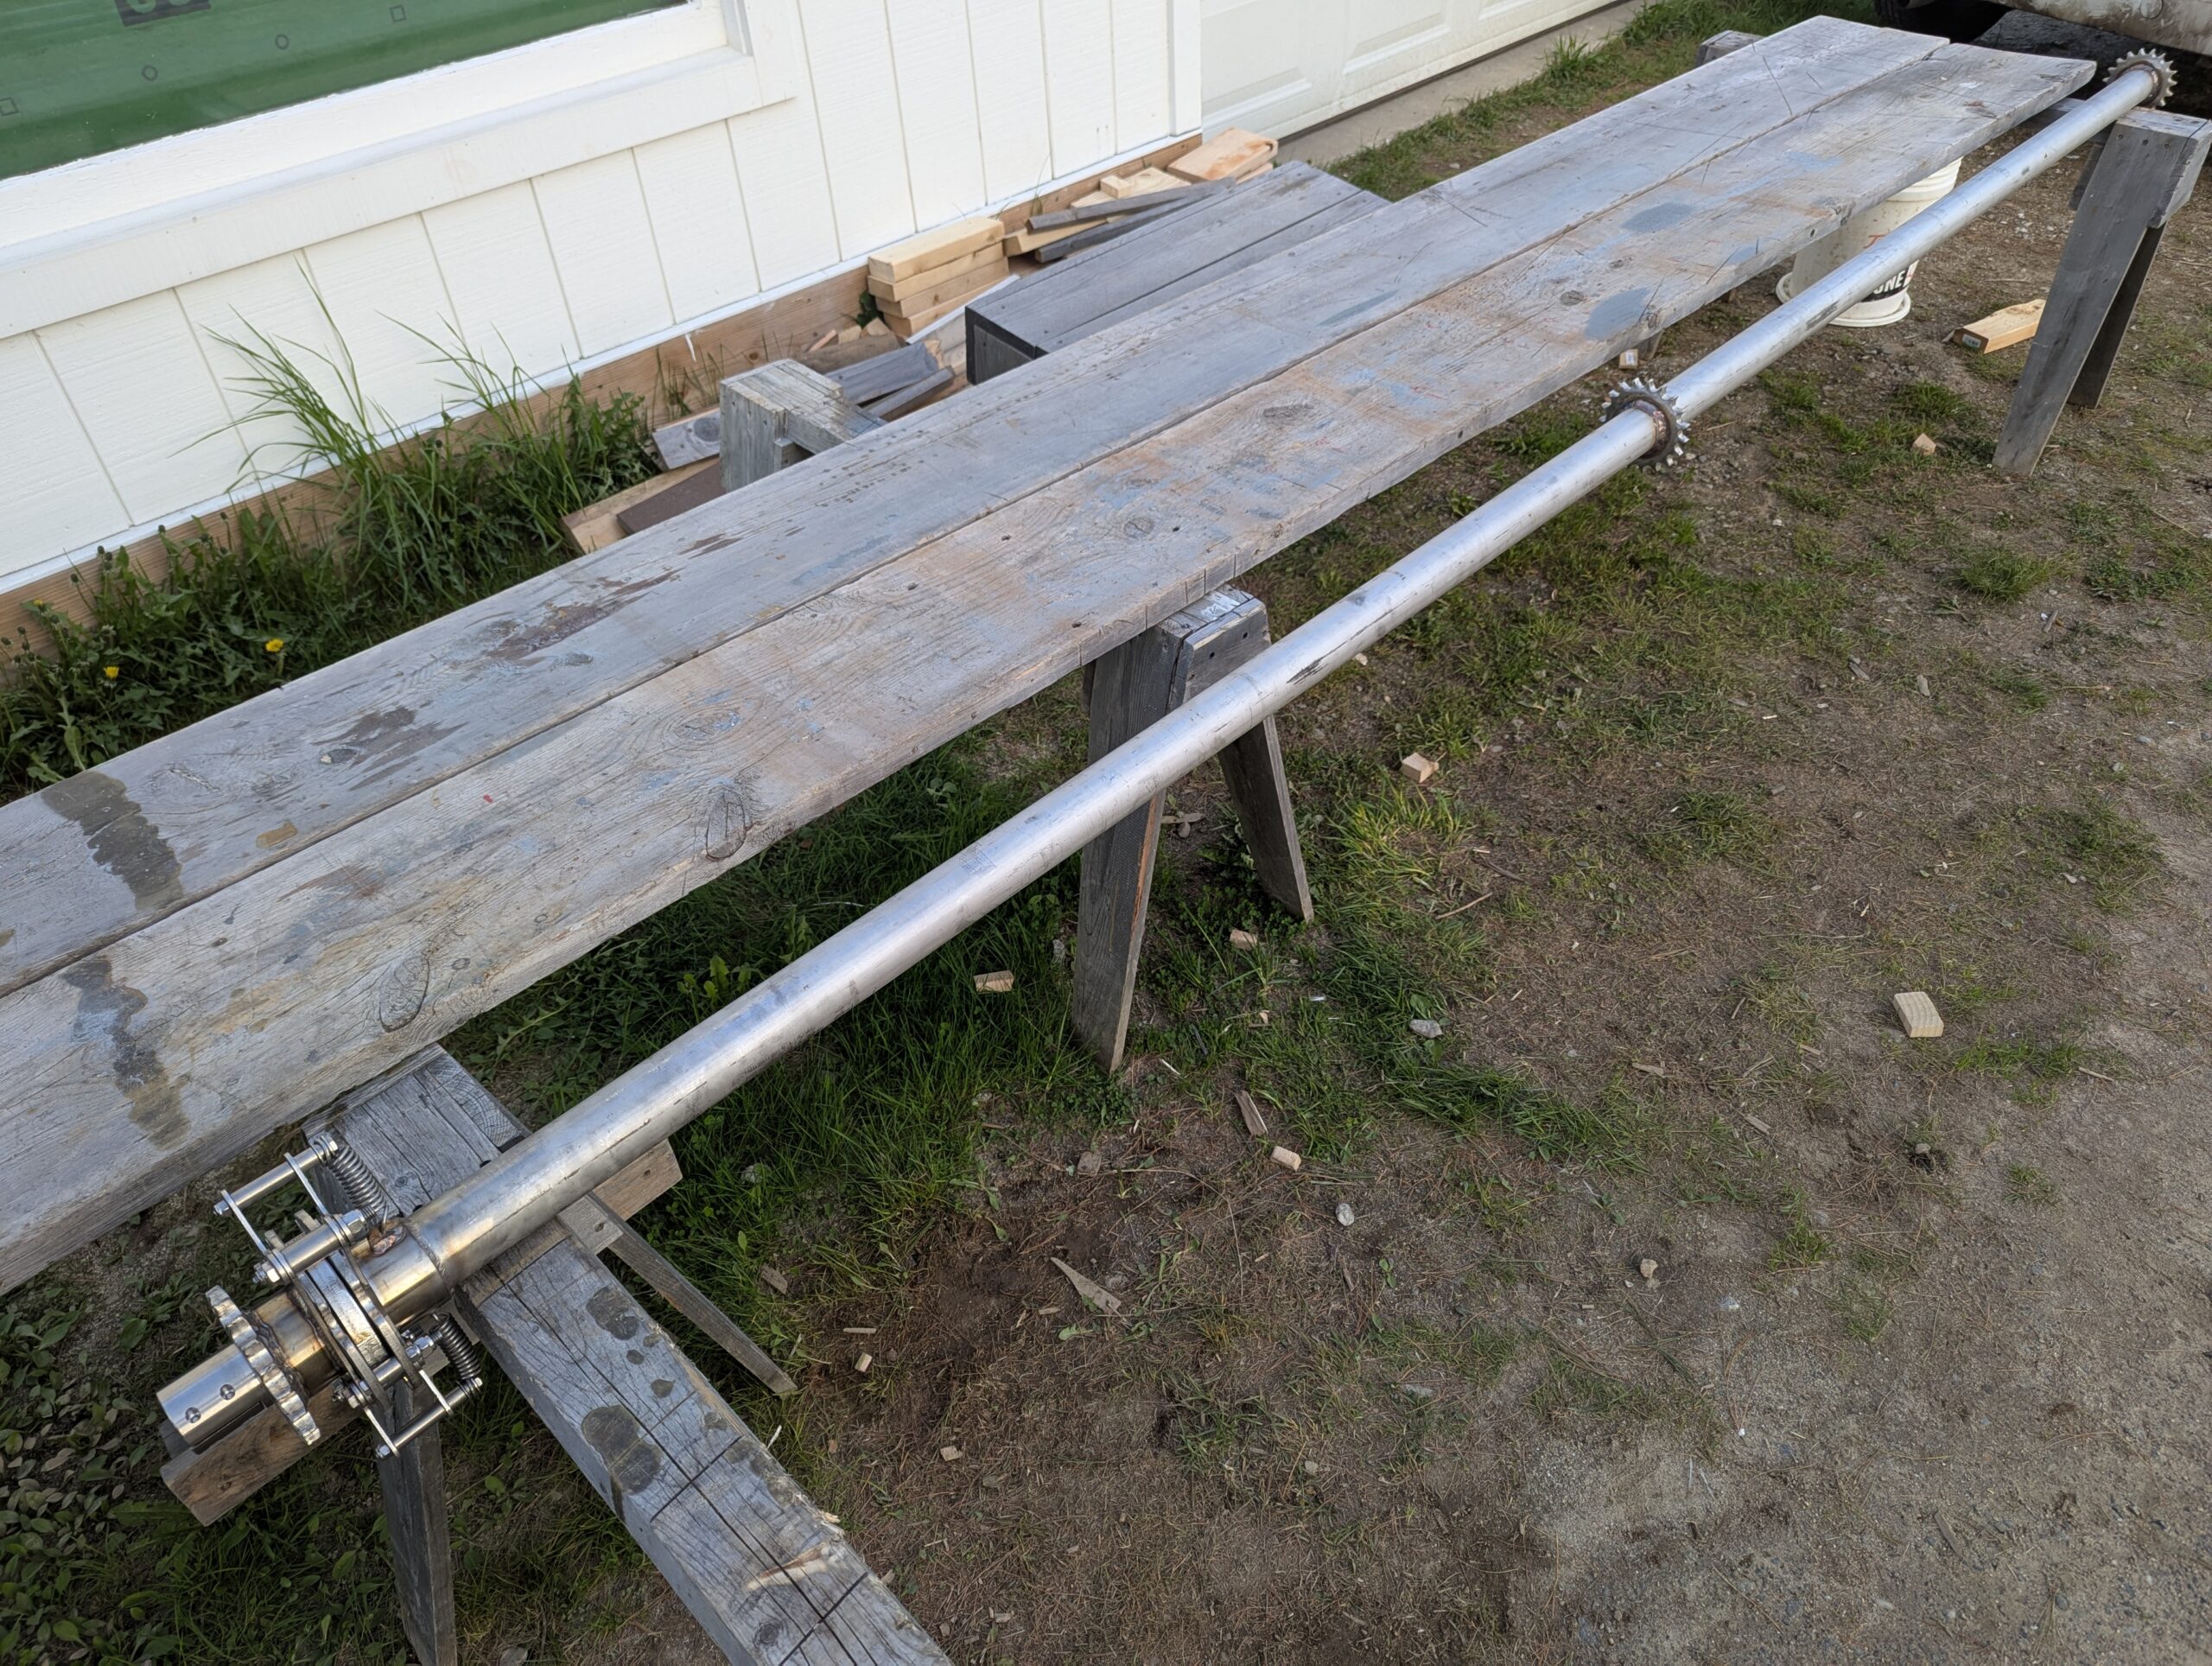
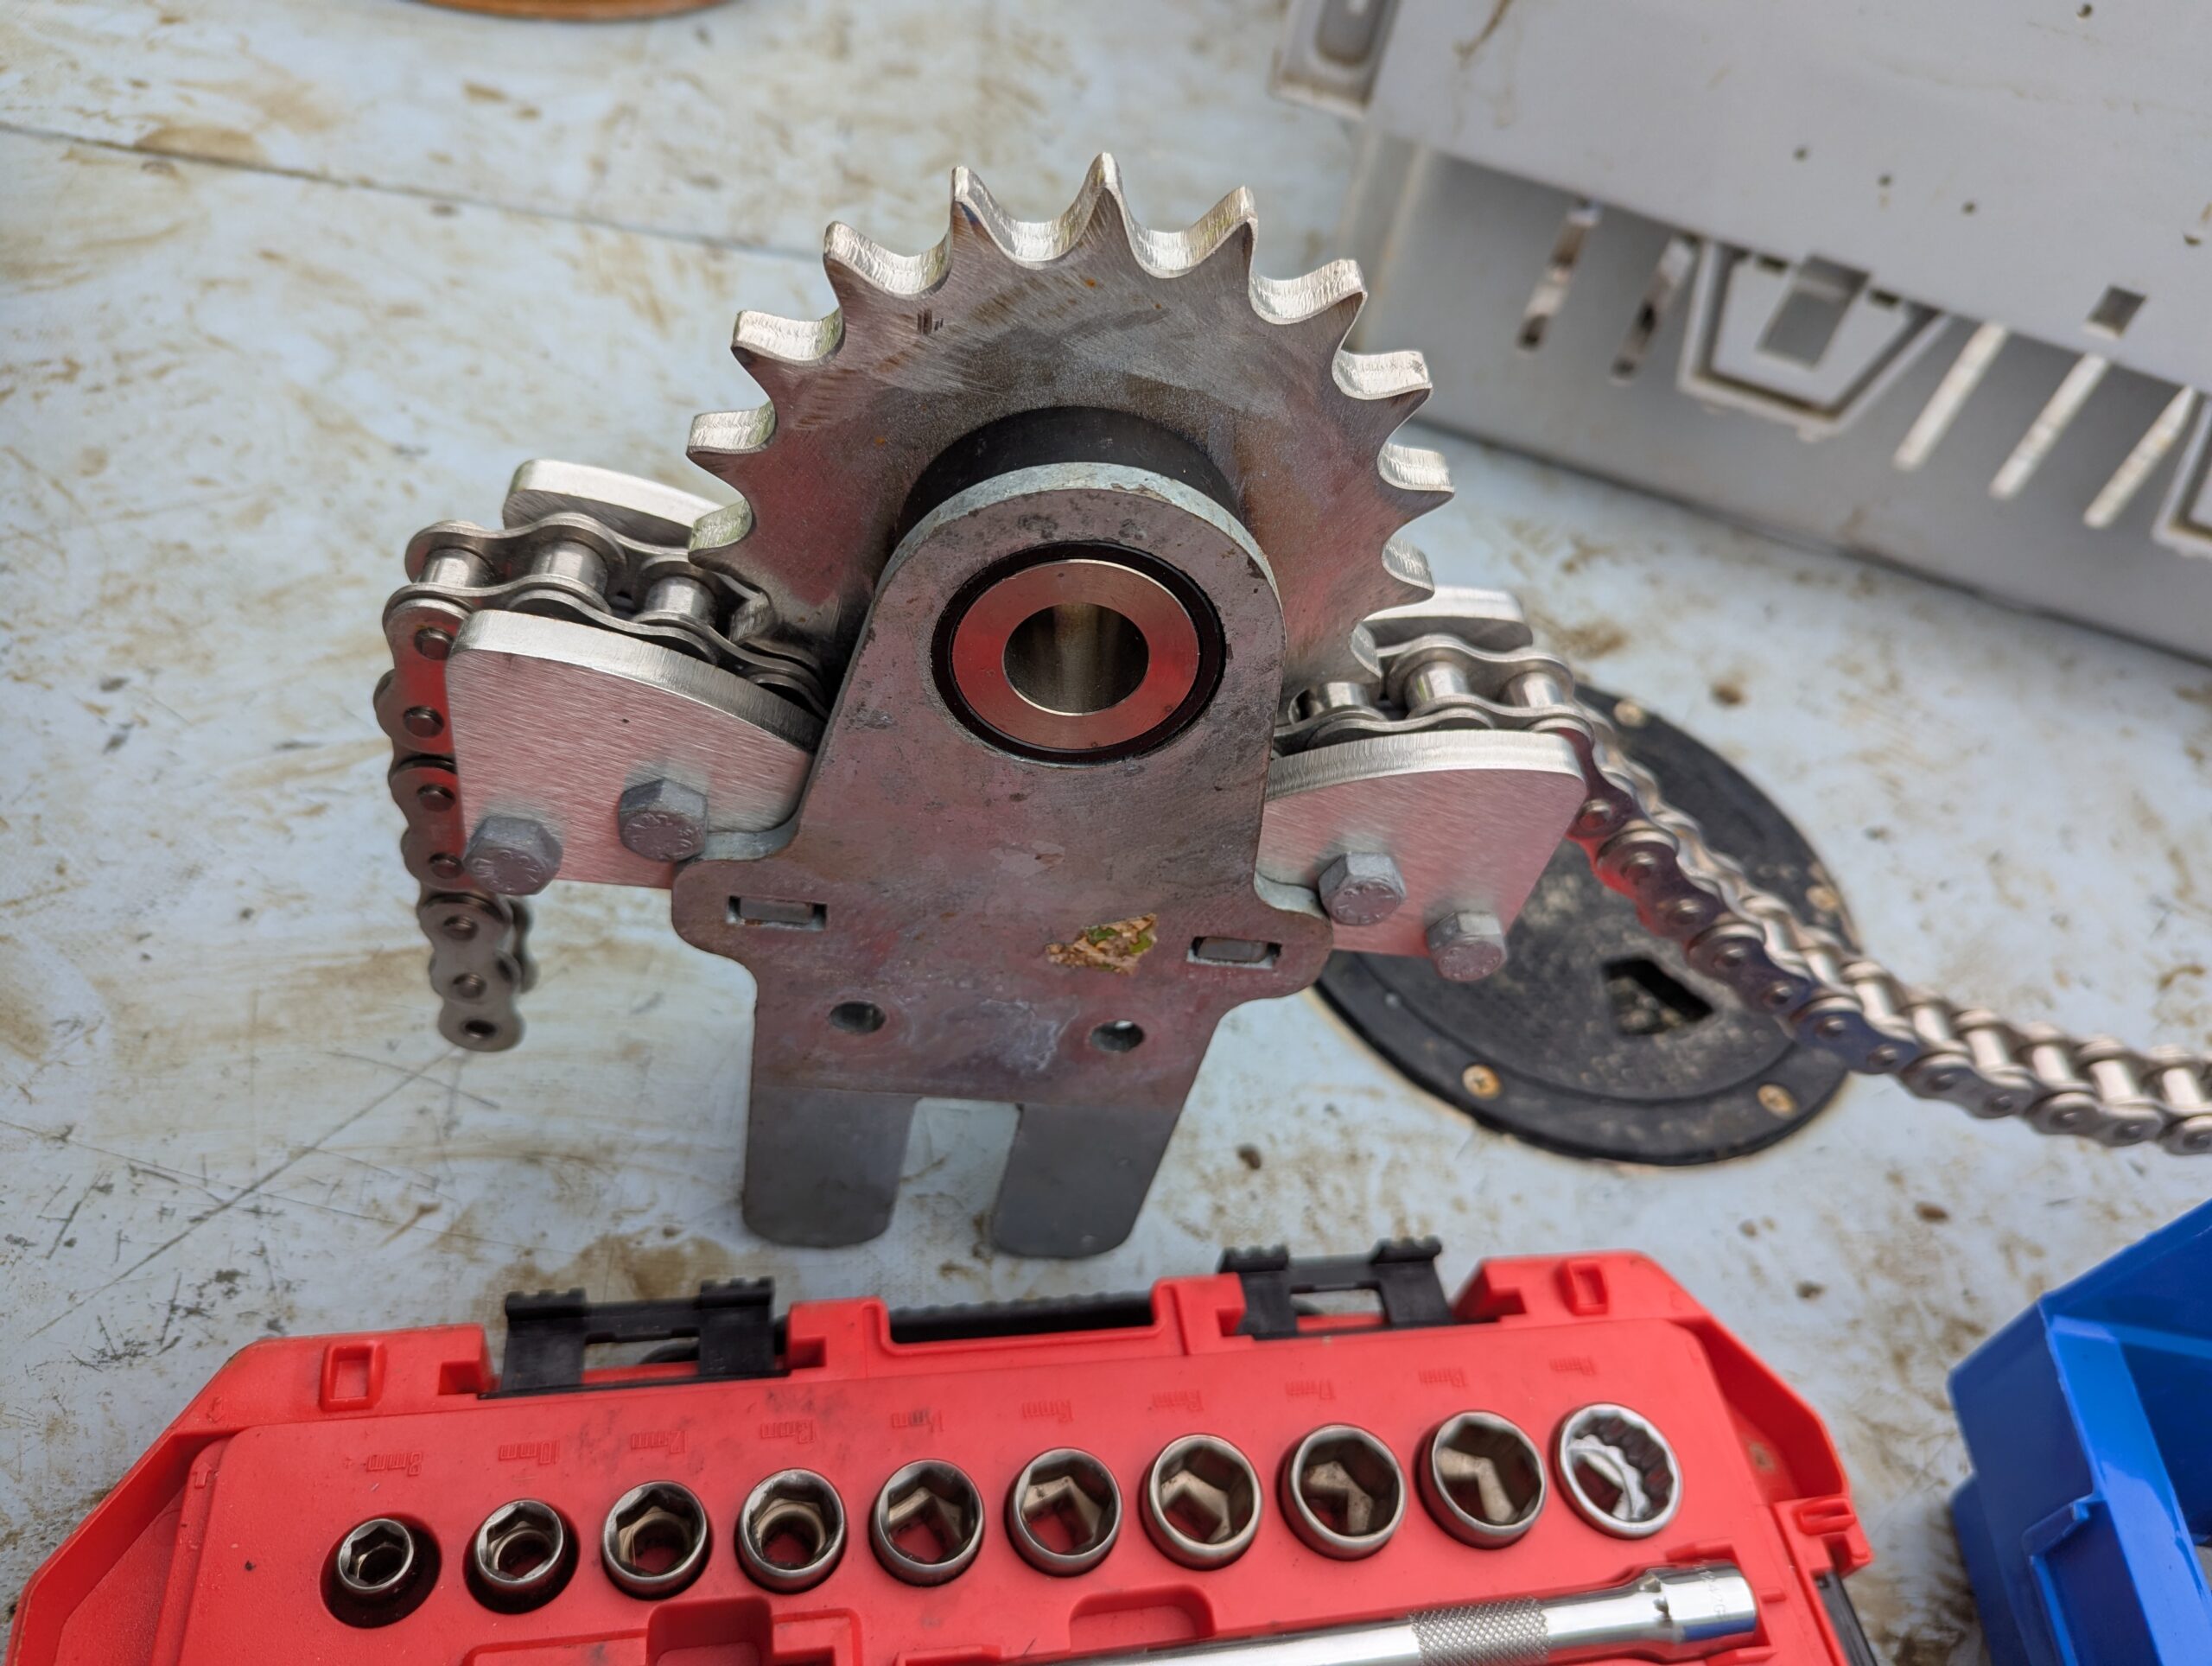
The single largest issue with the 2024 3D-COAST prototype that this SARE grant helped fix was the drive system for the solar rotators. The initial design used a steel cable and pulley system, hydraulically tensioned. Figure 10 shows the cable (underlined in blue) running to pullies that would connect to the solar rotators. This cable was then tensioned hydraulically (circled in red) and all the rotators would be linked together to the drive gearbox. Overall, this system had advantages, but the cable had issues becoming tangled and slipping. In 2025 this cable was replaced with a #60 stainless steel roller chain, as shown in Figure 11. This solved the slipping issue and after some tweaking became a very reliable design by the end of the effort. Another change made to the rafts were new driveshafts running from the gearboxes (Figure 12) and new sprockets on the drive wheels for each solar rotator (Figure 13).
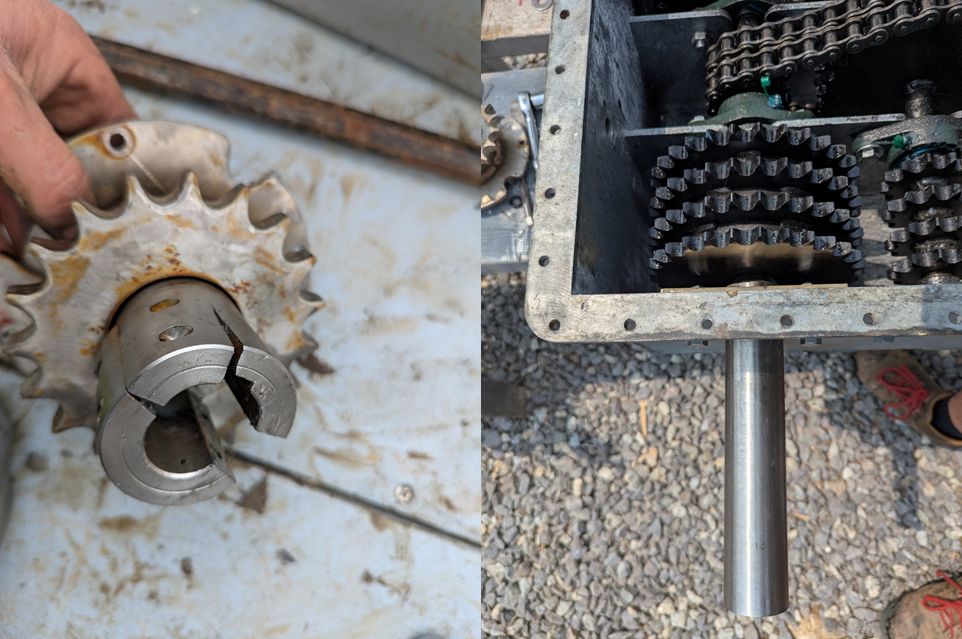
Another significant issue in 2024 that was fixed during this design revision was an upgraded gearbox design that used a higher quality DC motor to improve reliability related to poor brush contact, as well as a more rugged output shaft and bearing. Figure 14 shows the failed connection between the gearbox and the main driveshaft where the smaller 1” output shaft fractured the coupling dramatically due to the high torque being transmitted. On the right of Figure 14 an upgraded 2” shaft and bearing can be seen, which solved the issue permanently.
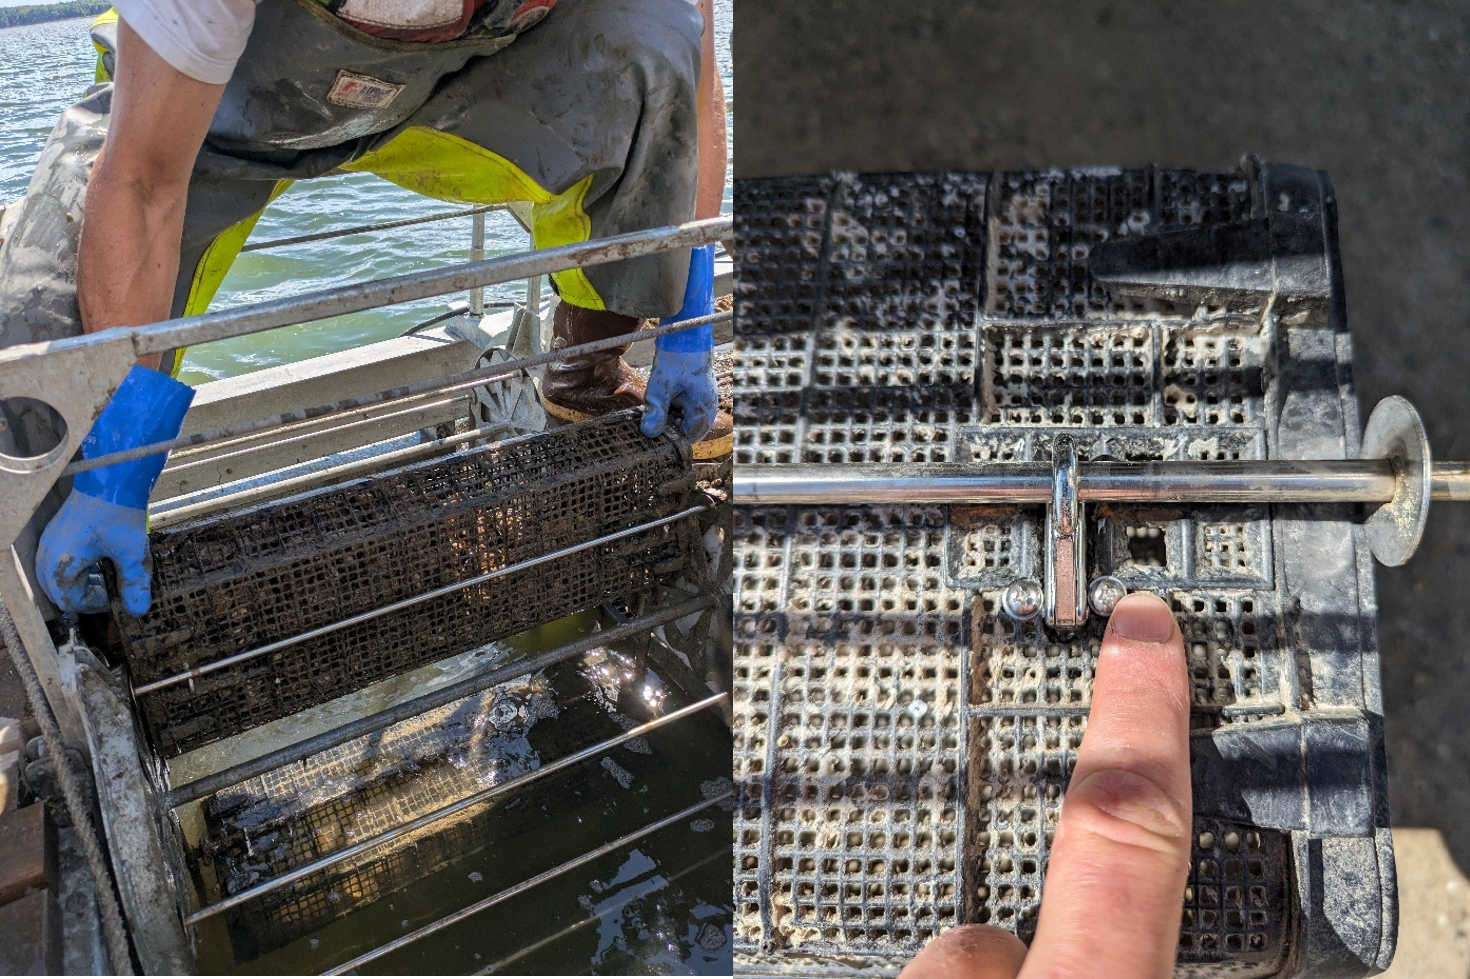
One of the smaller changes, yet highly impactful, was to modify the method of attaching the Hexcyl oyster baskets to the rungs of the solar rotators. Figure 15 shows how the baskets are clipped to the rungs using stainless steel snap hooks. In 2024 these hooks were installed on the same side of the Hexcyl baskets as the door latches, this turned out to cause major snagging and tangling. By switching which sides these hooks were installed the breakdown rate of the rafts more than halved.
3.2.2. Objective 2: Measure Reliability and Evaluate any New Issues
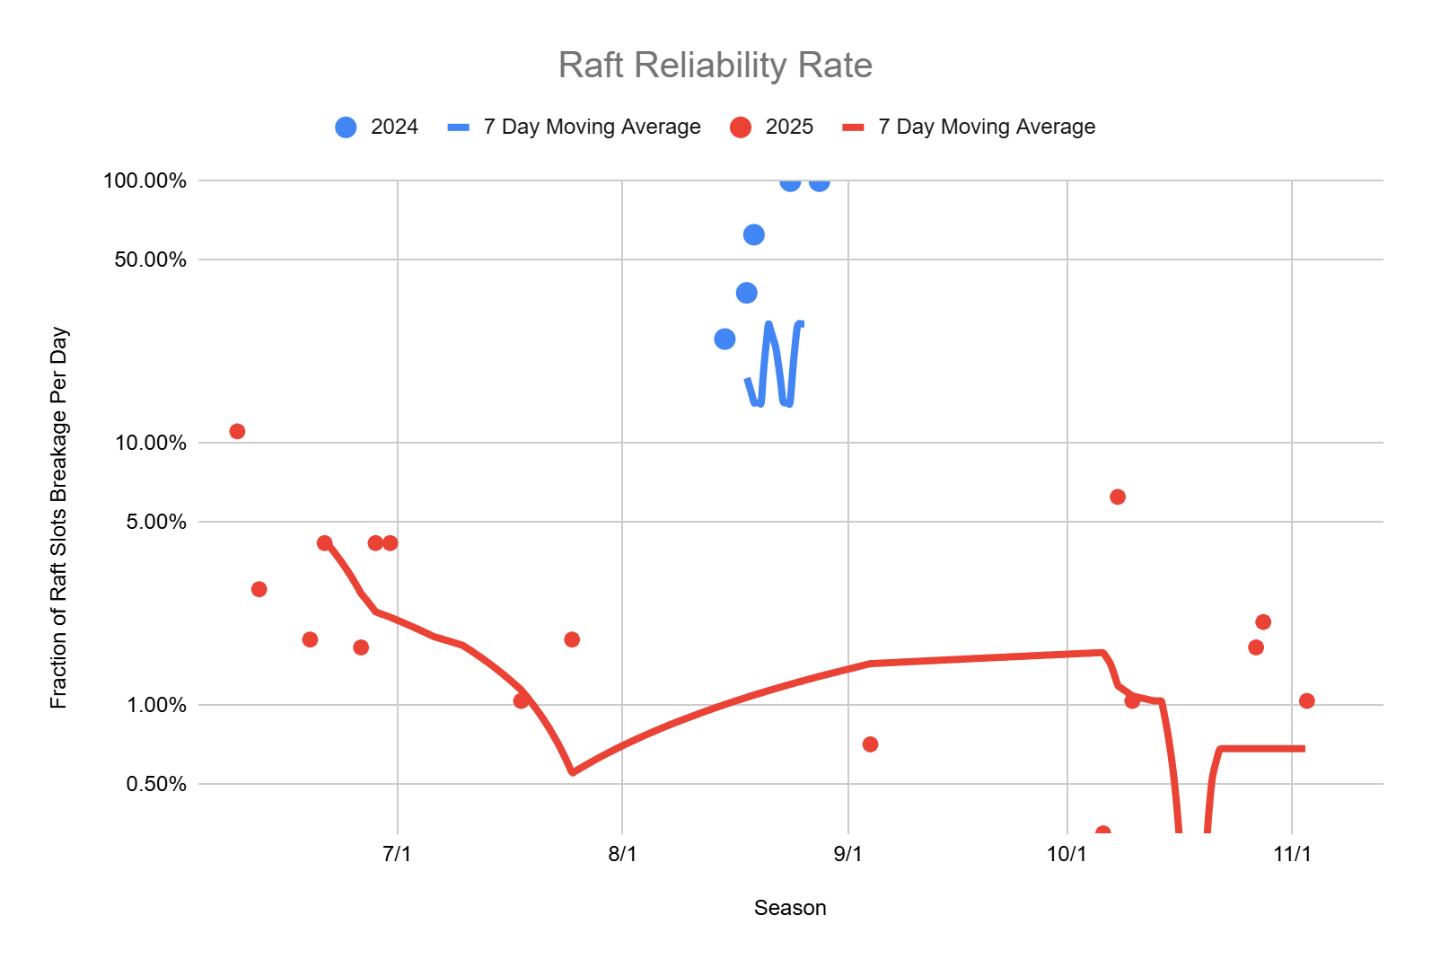
For this project TWIYO developed a system for tracking the raft reliability. The metric is based on how many of the solar rotators are “down” out of the total number operating. Using this measure TWIYO can track if the system is becoming more reliable over time as design changes are made. 2025 is the first year this was carefully tracked, but there is some data from 2024 that shows the new changes made a big difference (Figure 18).
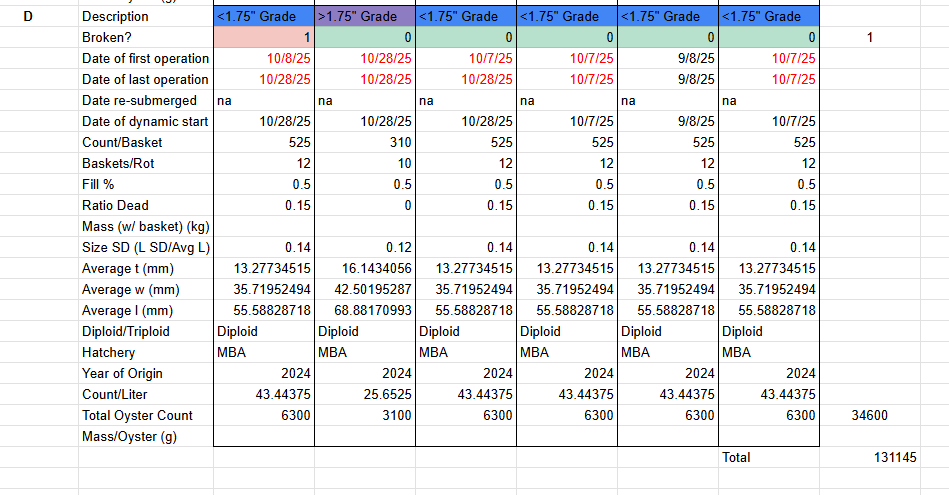
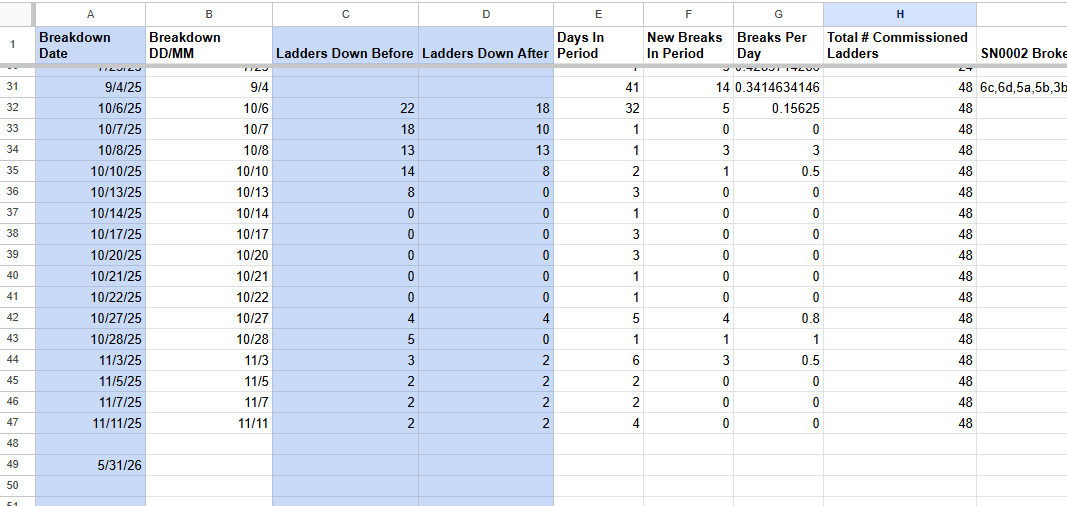
A spreadsheet that tracks every slot in the 3D-COAST rafts is maintained (a partial snippet is shown in Figure 16), one of the metrics is if the given rotator is currently broken or not. Each time the farm is visited this field is updated, allowing a tally of “breakdowns per week” to be tracked (Figure 17) and then plotted over time with a 7-day running average (Figure 18). This plot effectively shows what percentage of the raft is going down per day on average over a week. Two encouraging trends were shown: 1) Compared to 2024 the reliability of the roller chain drive and other changes cut breakdown rates by 10-20x. 2) Over the 2025 season as other improvements were made the reliability improved even more until it averaged at roughly 1% by the end of the season. 1% in this context means that each day roughly 1% of the raft capacity would need maintenance. This equates to roughly 1 out of the 48 solar rotators (2025 capacity) breaking every other day. Maintenance for one rotator was measured at approximately 20 minutes; therefore, an overall maintenance labor time can be extrapolated for different size farms. A farm using 8x 3D-COAST rafts to produce 800k-1M oysters per year could expect to spend approximately 5 hours per week on routine repairs (not including seasonal preventative maintenance). As development continues this number can be refined and tracked with additional data points to improve confidence.
During development of such systems as 3D-COAST it is expected that new issues will arise, several problems were identified during the 2025 season over the course of this project that will be addressed in 2026 and future scopes of work.
- Gearbox corrosion: Previously much of the raft structure has been made from hot-dipped galvanized steel. Over time many new stainless-steel parts were introduced into the design, often submerged near the galvanized parts. Having dissimilar metals in an electrolyte solution (salt water) caused severe galvanic corrosion of the less noble metal (the galvanized steel). This wasn’t an issue before the stainless parts were introduced, but in 2025 the quantity of stainless reached a critical point where the galvanized cases of the gearboxes began to corrode severely. The stainless parts cannot be easily replaced with galvanized steel, so the remaining submerged galvanized parts will be switched to stainless instead. This is only the gearbox cases at this time, and will add some cost to the product, but will add significant lifetime. In 2026 new gearboxes will be manufactured that will include several improvements, including new case material. The superstructure of the rafts that is above the surface of the water can remain galvanized steel and has shown good resistance to corrosion over the last 2 years of service.
- Loading solar rotators: The biggest usability issue currently facing the design is the process of loading baskets on and off each solar rotator. Currently each basket must be clipped to the rungs manually while the rotator is also manually rotated through its cycle (Figure 15). This works fairly well for someone familiar with the machine, but will present challenges for inexperienced users, and is slow. This process also involves walking out on the narrow beams that support the rotators, presenting a slip hazard. The best solution to this human-factors/usability problem has been the subject of debate for several years now. TWIYO believes that the best option to try in 2026 is the implementation of a gantry crane that can lift an entire solar rotator out of the water at once and bring it over the work platform to be unloaded. One complicating issue is that this crane will reduce stability and add enough weight that the floatation system on the raft will need to be upgraded in order to make it safe.
3.2.3. Objective 3: Integrate the 3D-COAST Raft into Existing Farm Workflows and Measure Labor Benchmarks for Farm Efficiency and Production Modelling
The work performed under this objective produced the primary “information product” for this project by generating a useful tool which TWIYO freely supplies to the public as a way of sharing the learning from this grant. The information gathered in this section provided the data for building a sophisticated production model in MATLAB that predicts a farm’s performance given certain inputs such as number of oysters seeded, harvesting curves, growth curves, and mortality rates. These inputs are pre-populated to match 3D-COAST performance in typical mid-coast Maine waters (as measured on TWIYO’s farm), however, the model algorithms would work well for any region if a farmer knew their own parameters to calibrate the model. As far as TWIYO understands this may be one of the more sophisticated models of shellfish growth on a farm, giving detailed insight on capacity need, product availability, and labor requirements over the course of a year. As a future project TWIYO is interested in collaborating with The University of Maine to generate the growth rate curves and other input data for our model that is region specific by utilizing satellite data as described in “Using dynamic energy budget modelling and high-resolution satellite products to predict eastern oyster growth at a farm scale” by Thomas Kiffney et al[1].
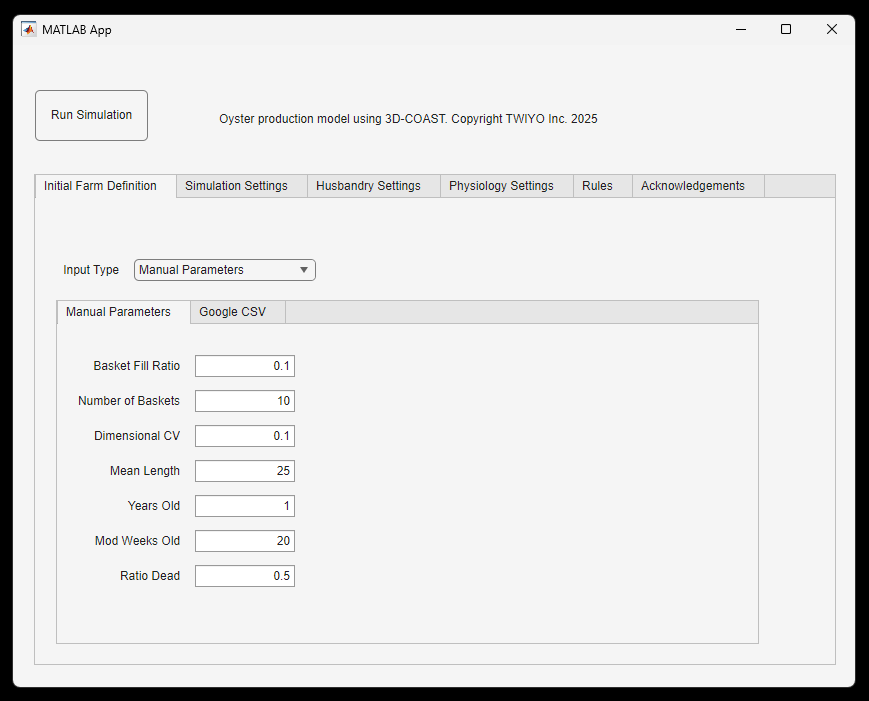
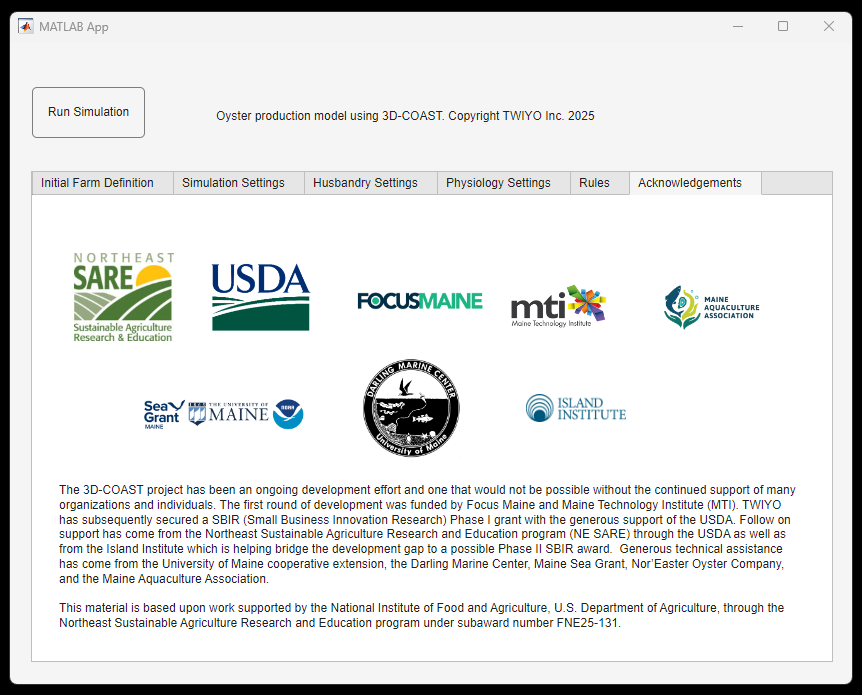
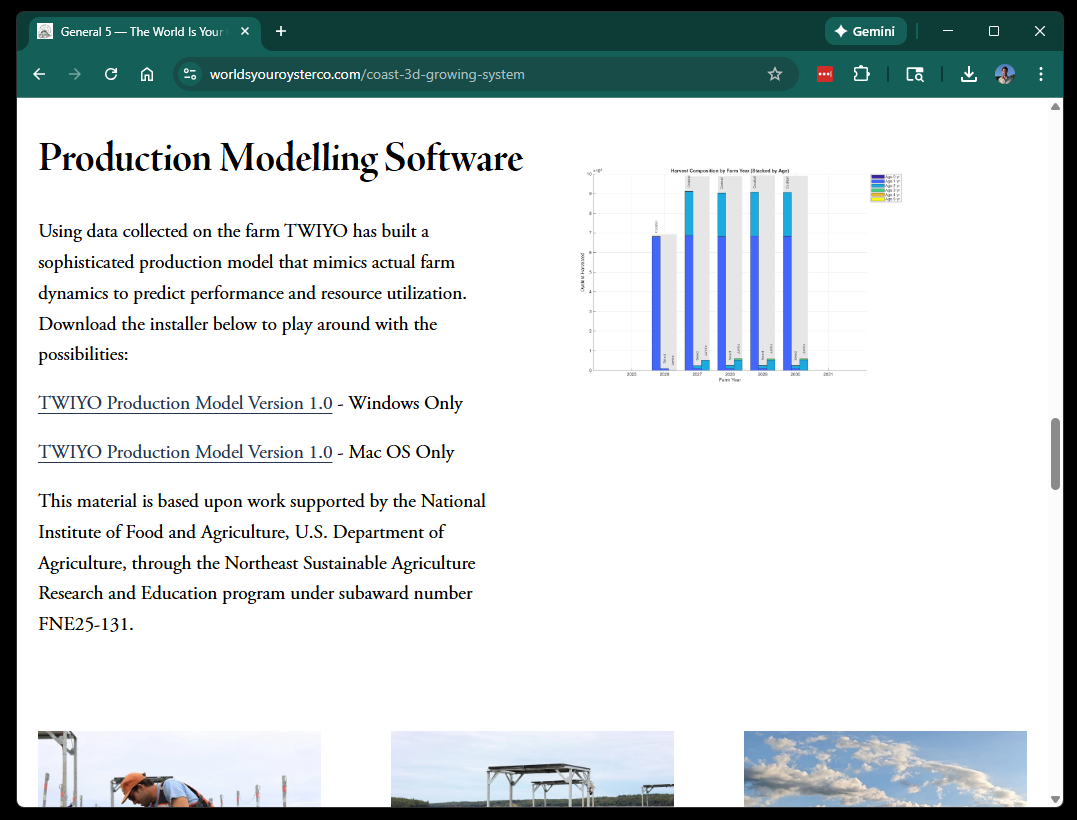
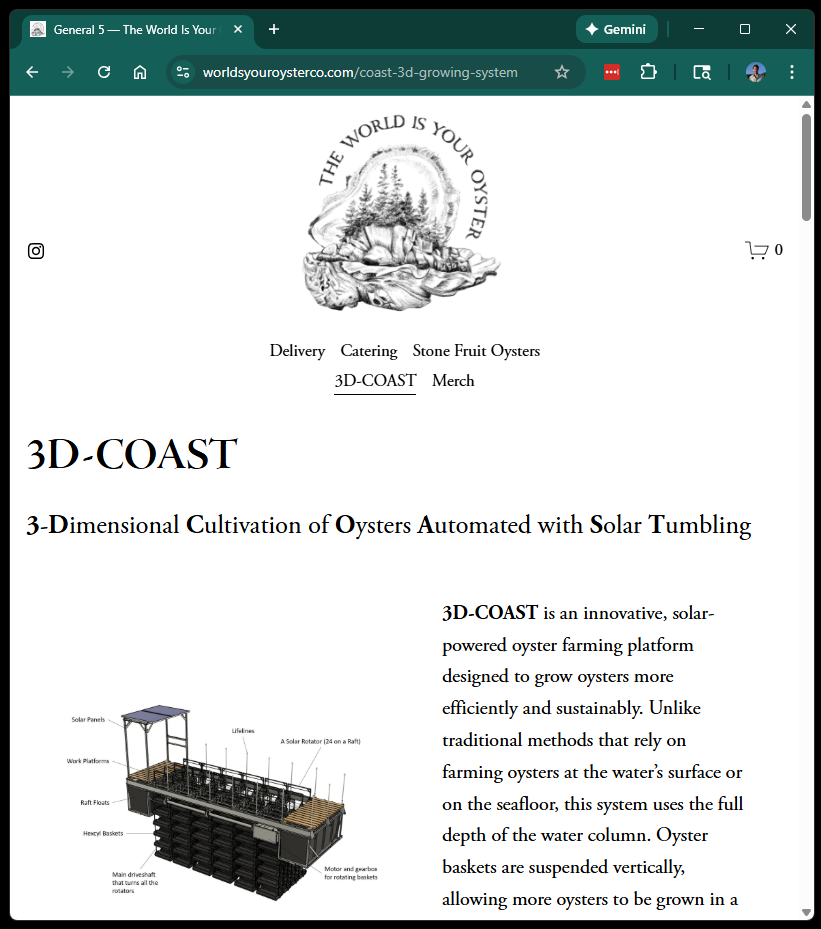
The production modelling tool is hosted on TWIYO’s website (Figure 23) for free download. Figure 20 and Figure 21 show examples of some of the inputs available to a user. USDA SARE and other grantors have been acknowledged in the application as shown in Figure 22.
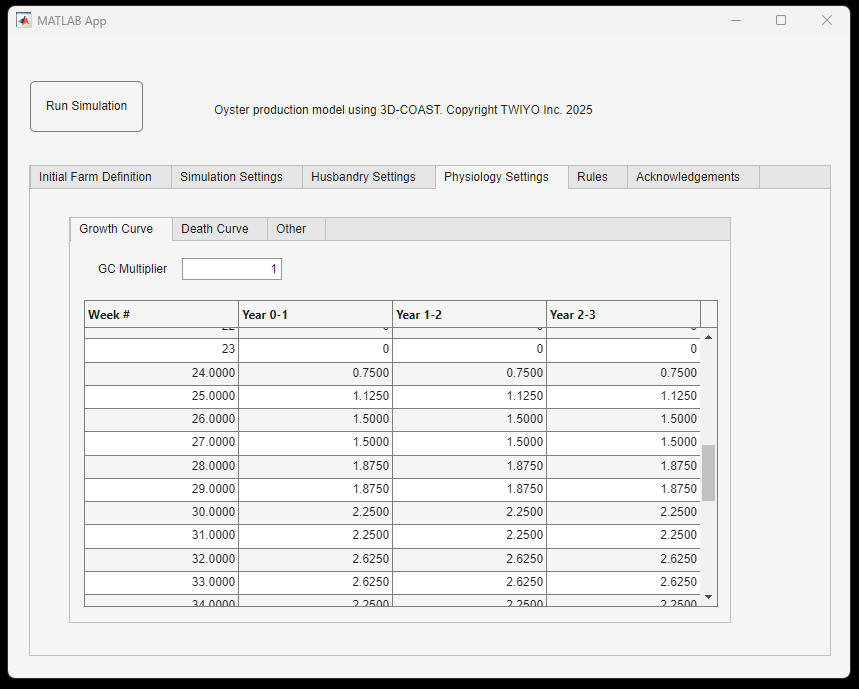
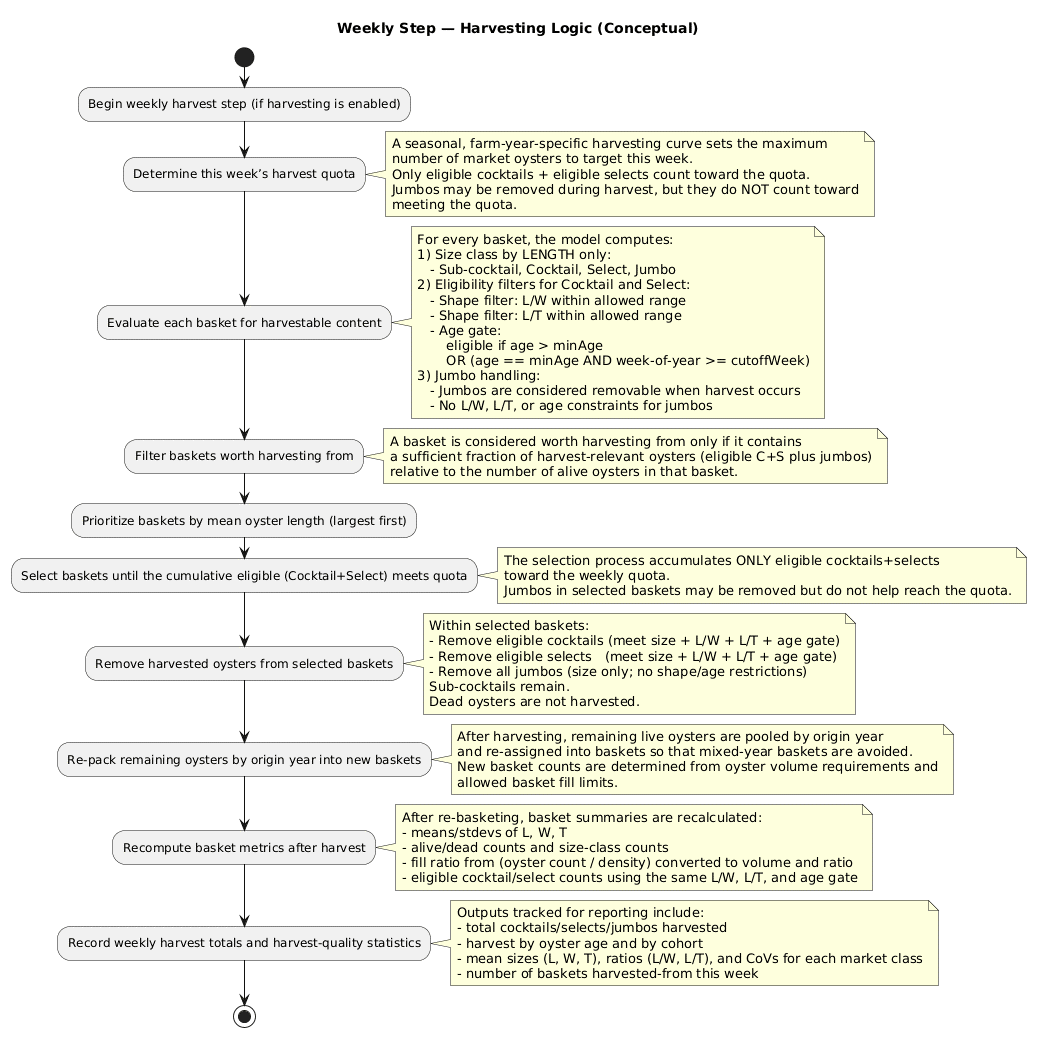
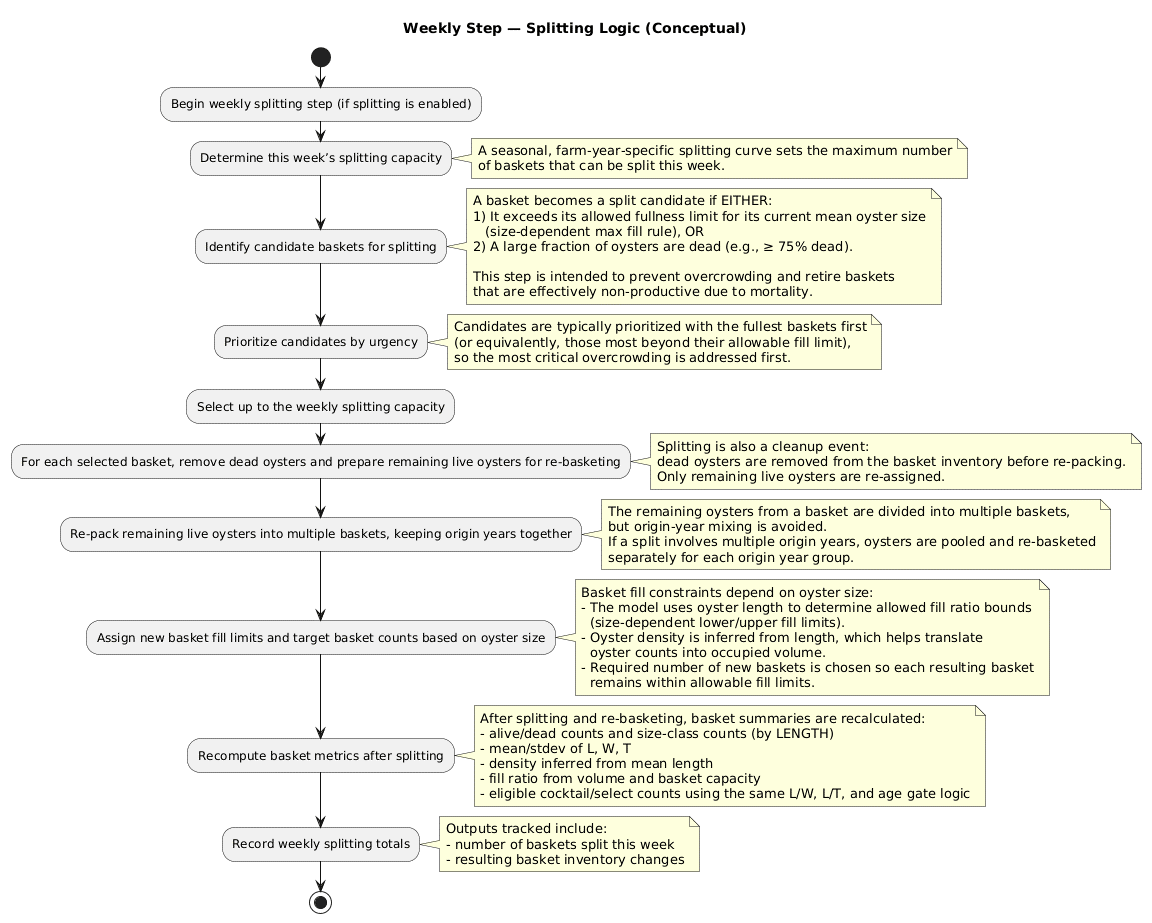
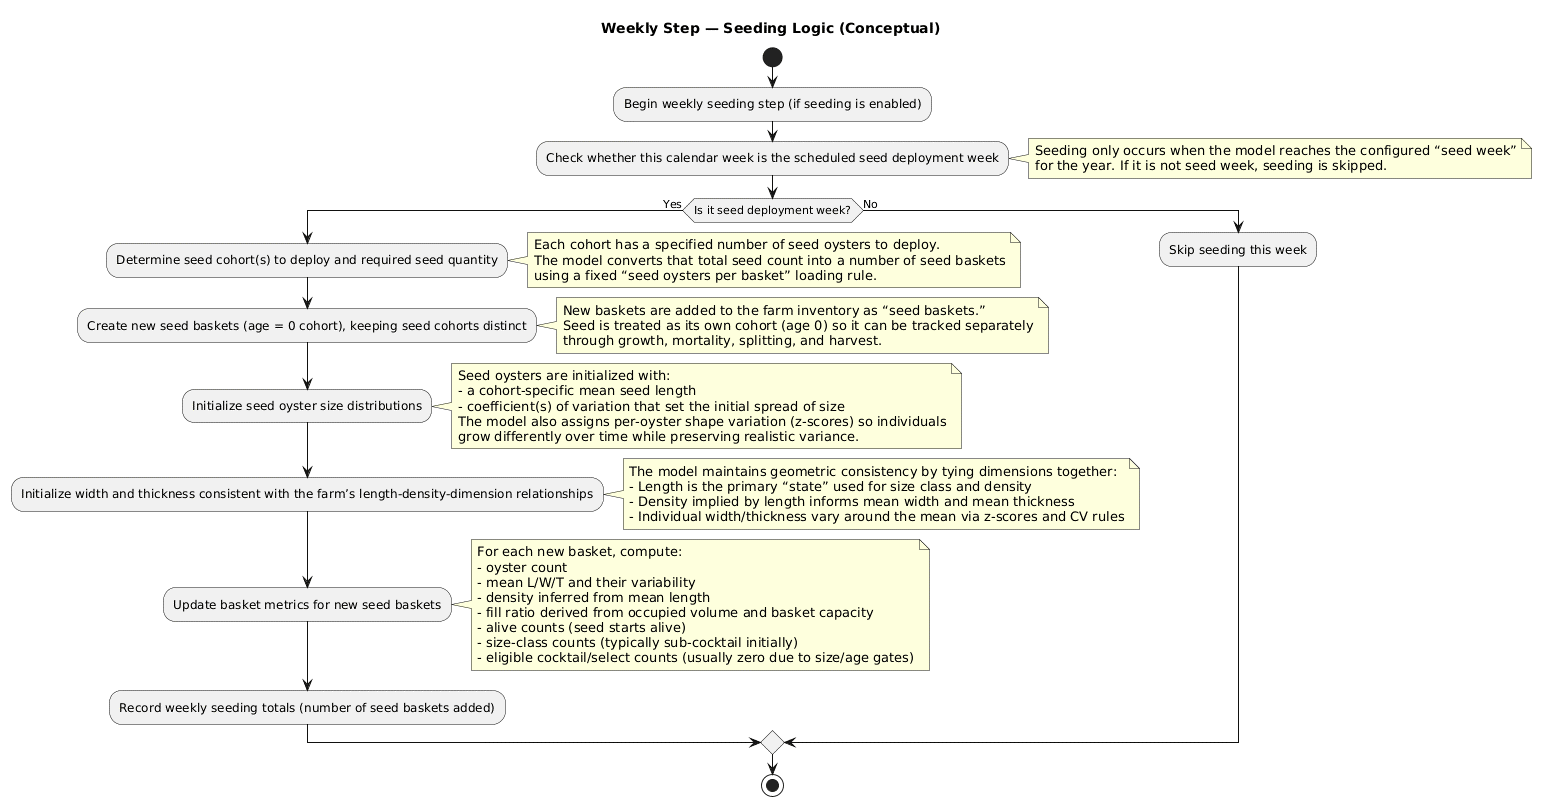
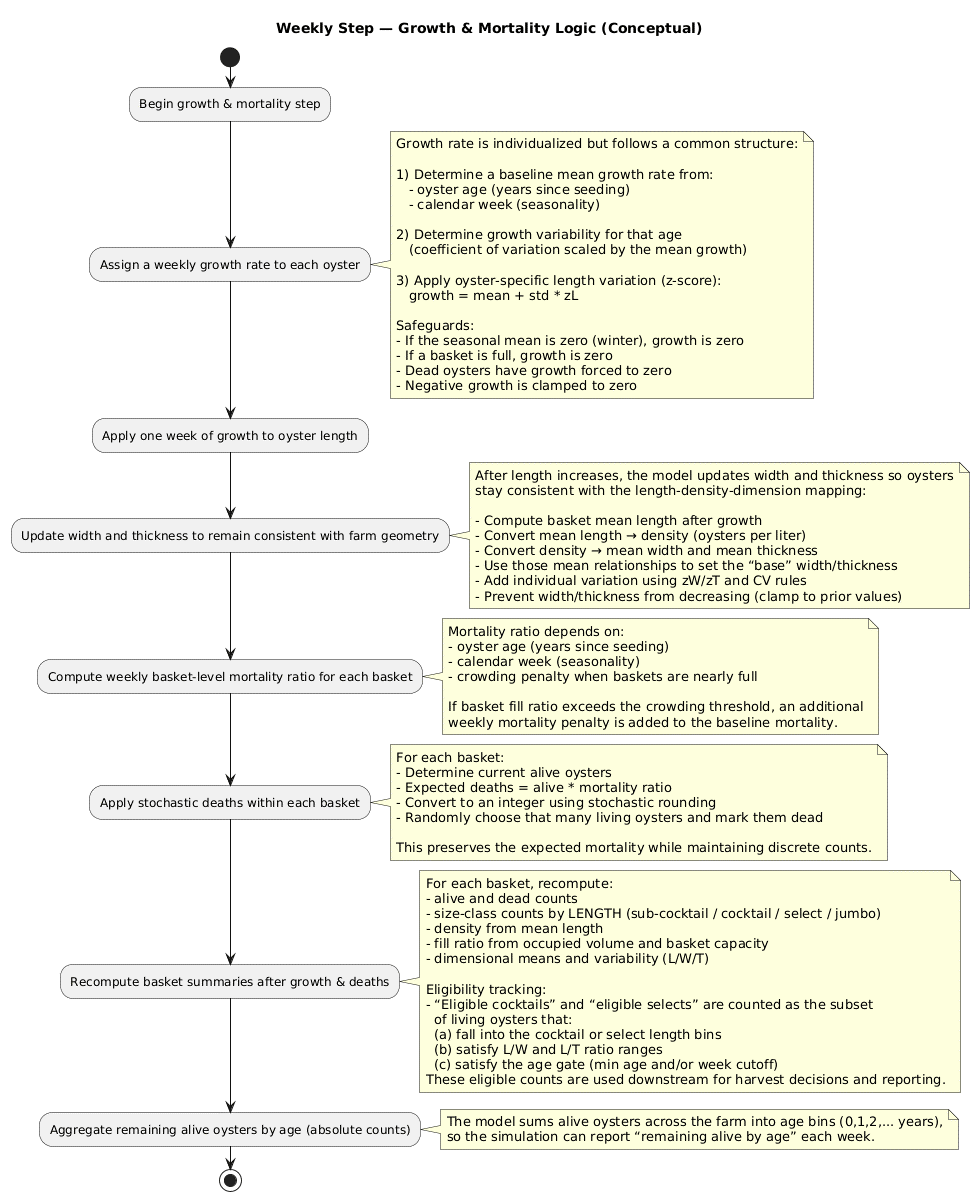
The following flow charts describe how the model algorithm works. Figure 24 shows the basic concept where the program loops through time by the week, each week performing all the basic farm functions: harvesting, splitting baskets, seeding oysters, and simulating new growth or death. Each of these functions vary with time, depending on the age of the oysters or seasons, for example new growth will be 0 during the winter weeks. The following charts show the details of the logic of each of the primary nodes.
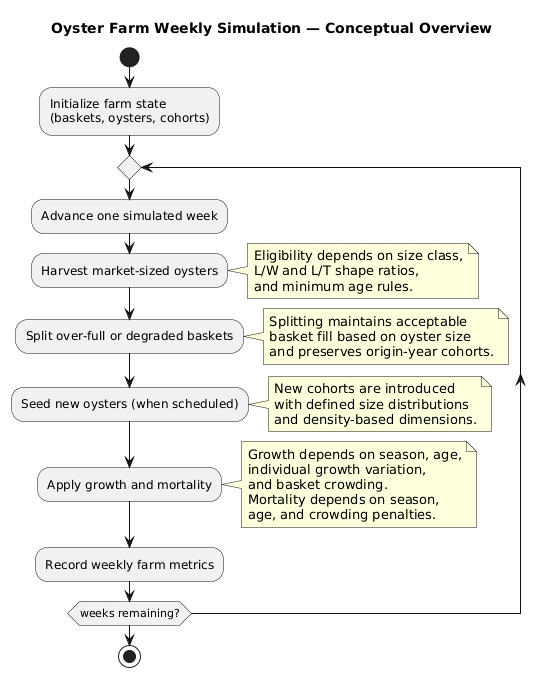
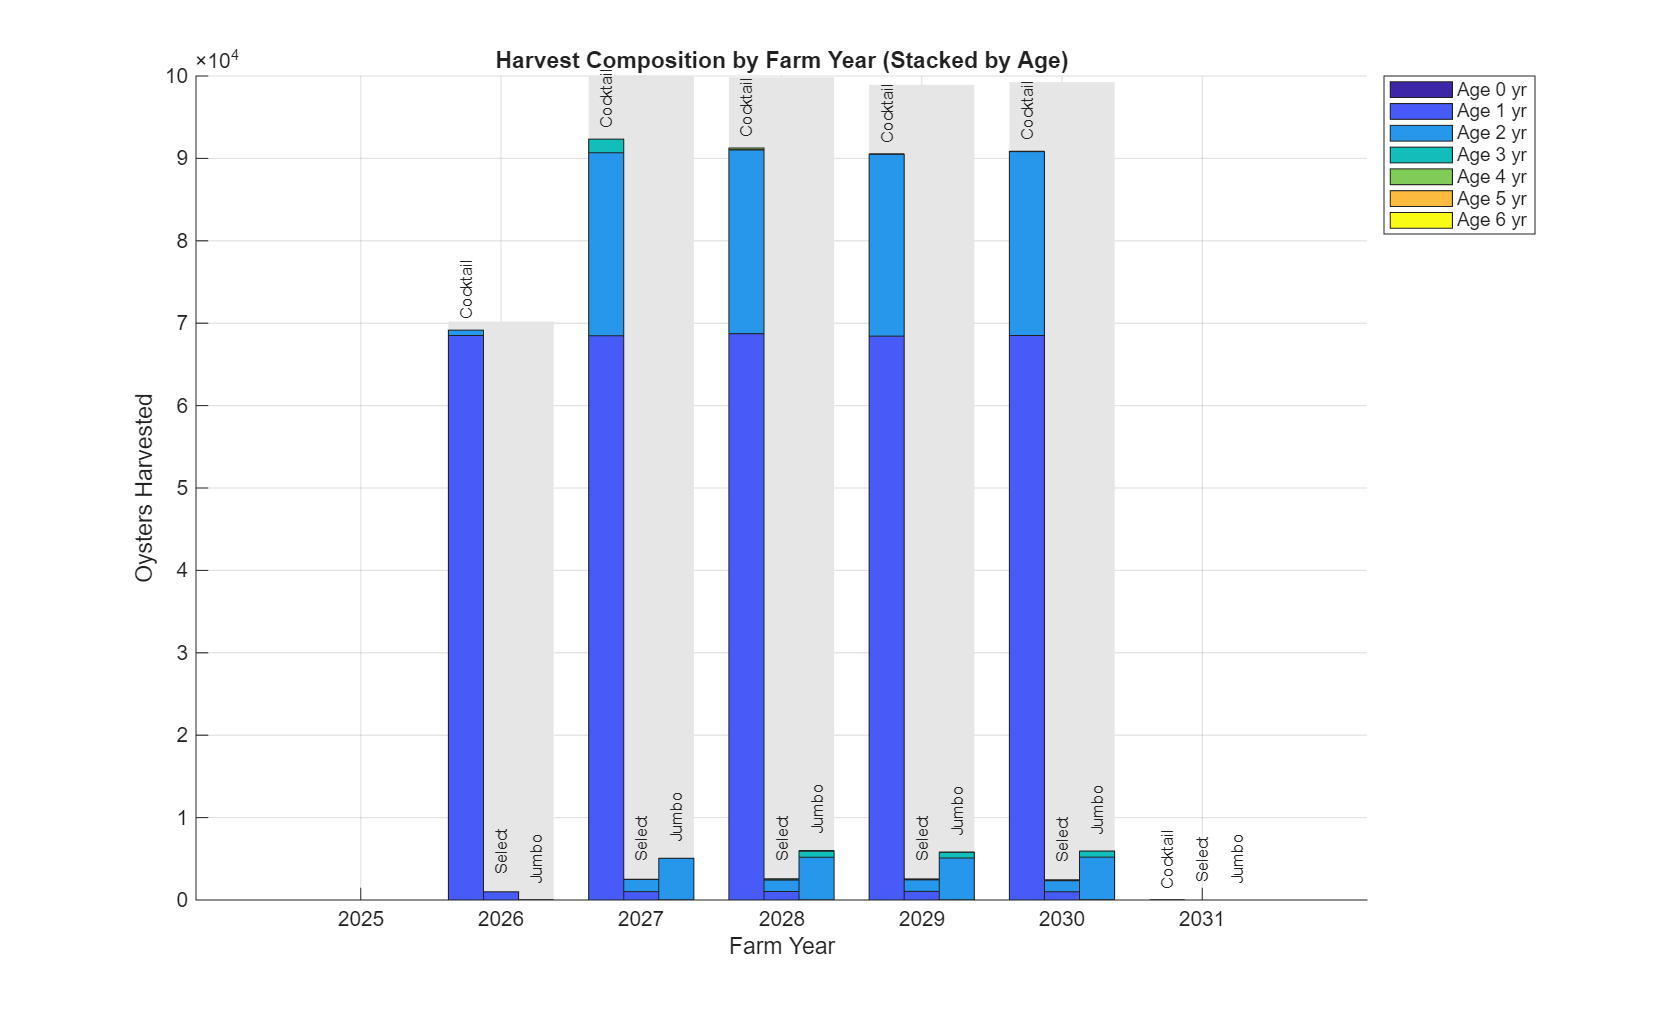
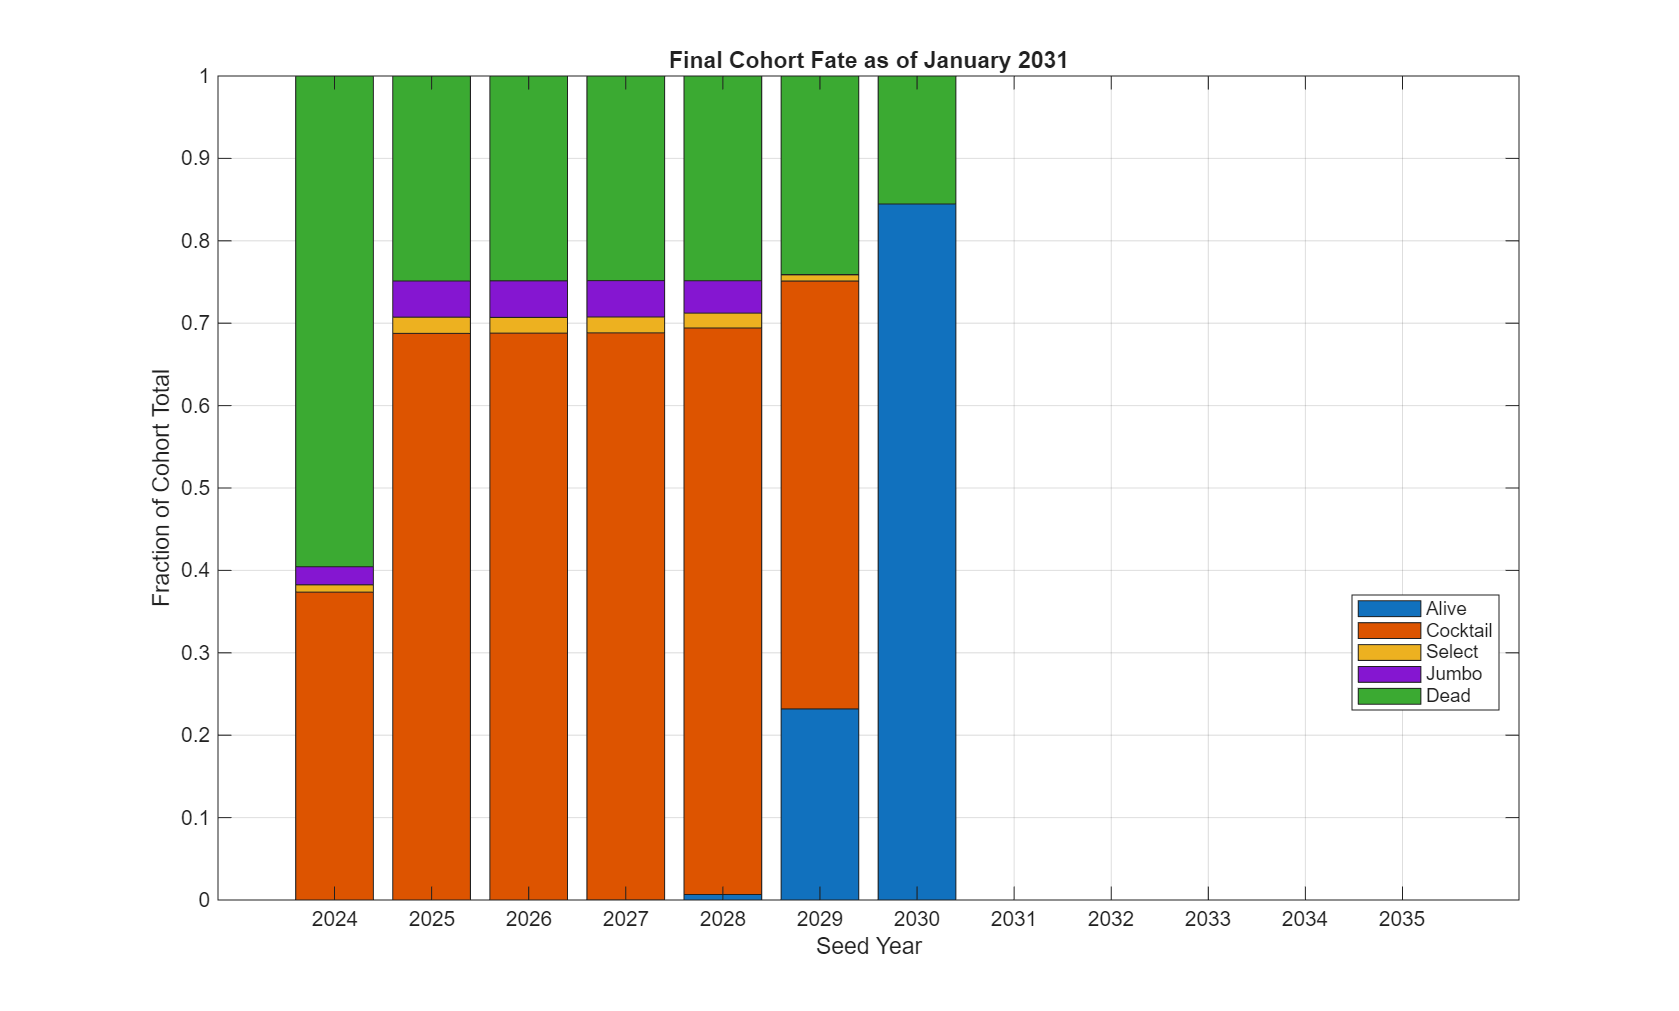
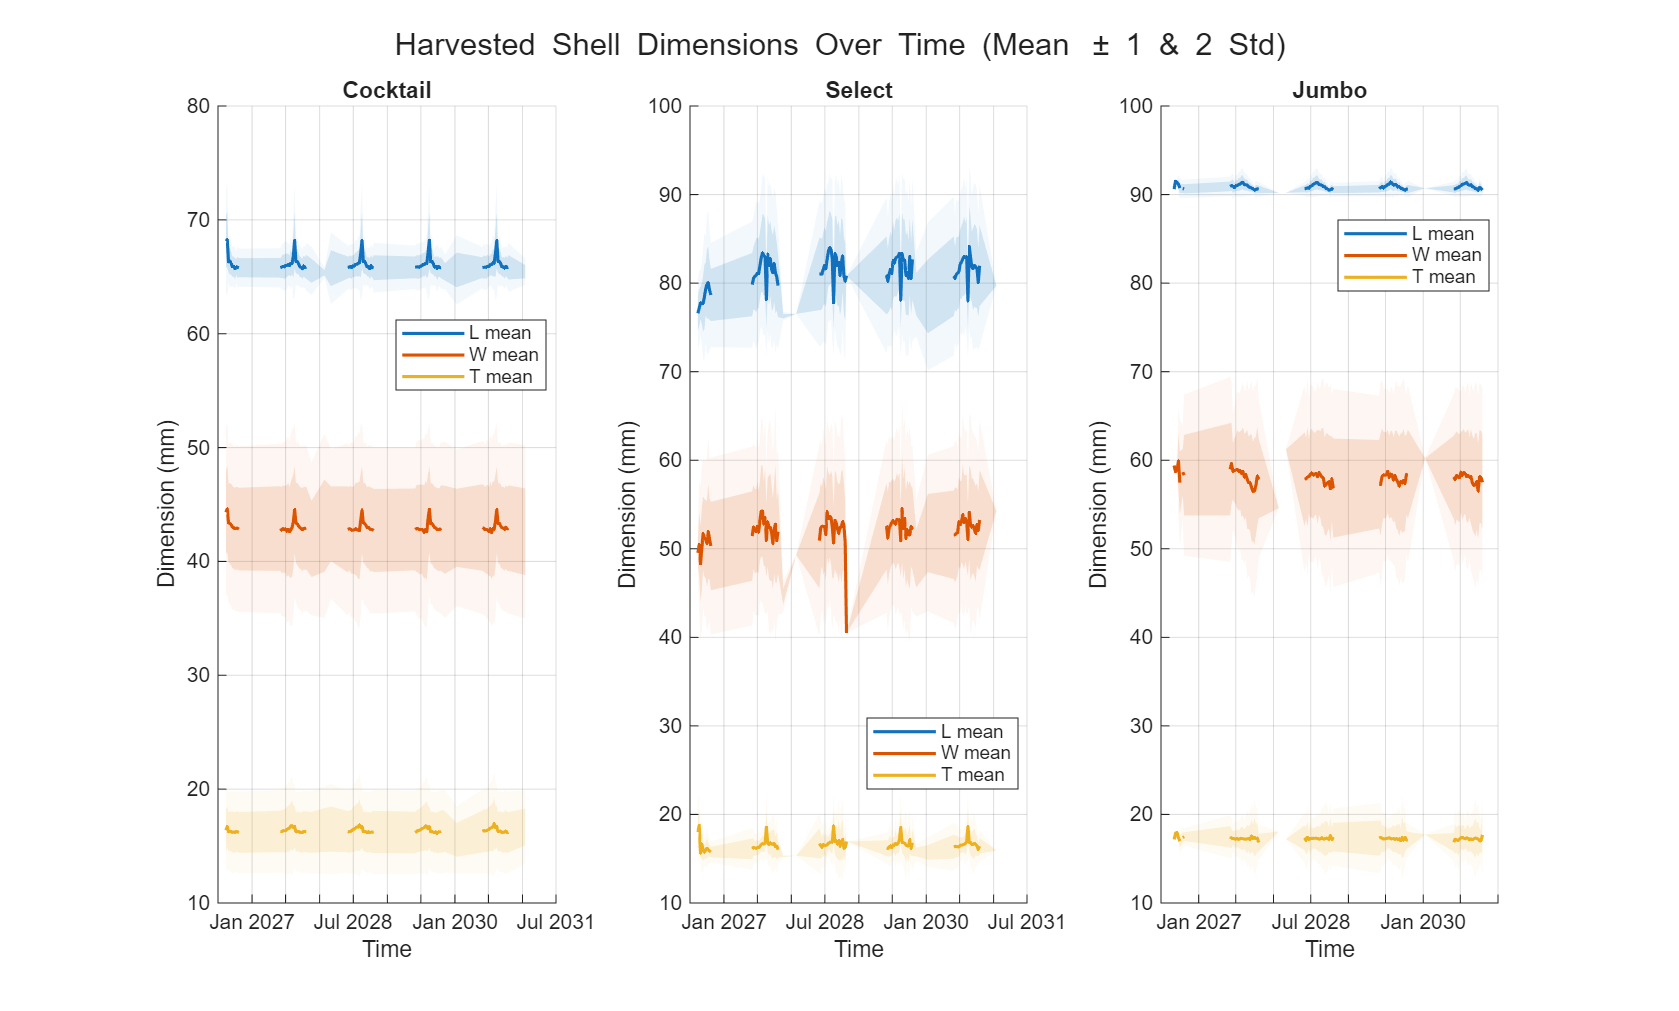
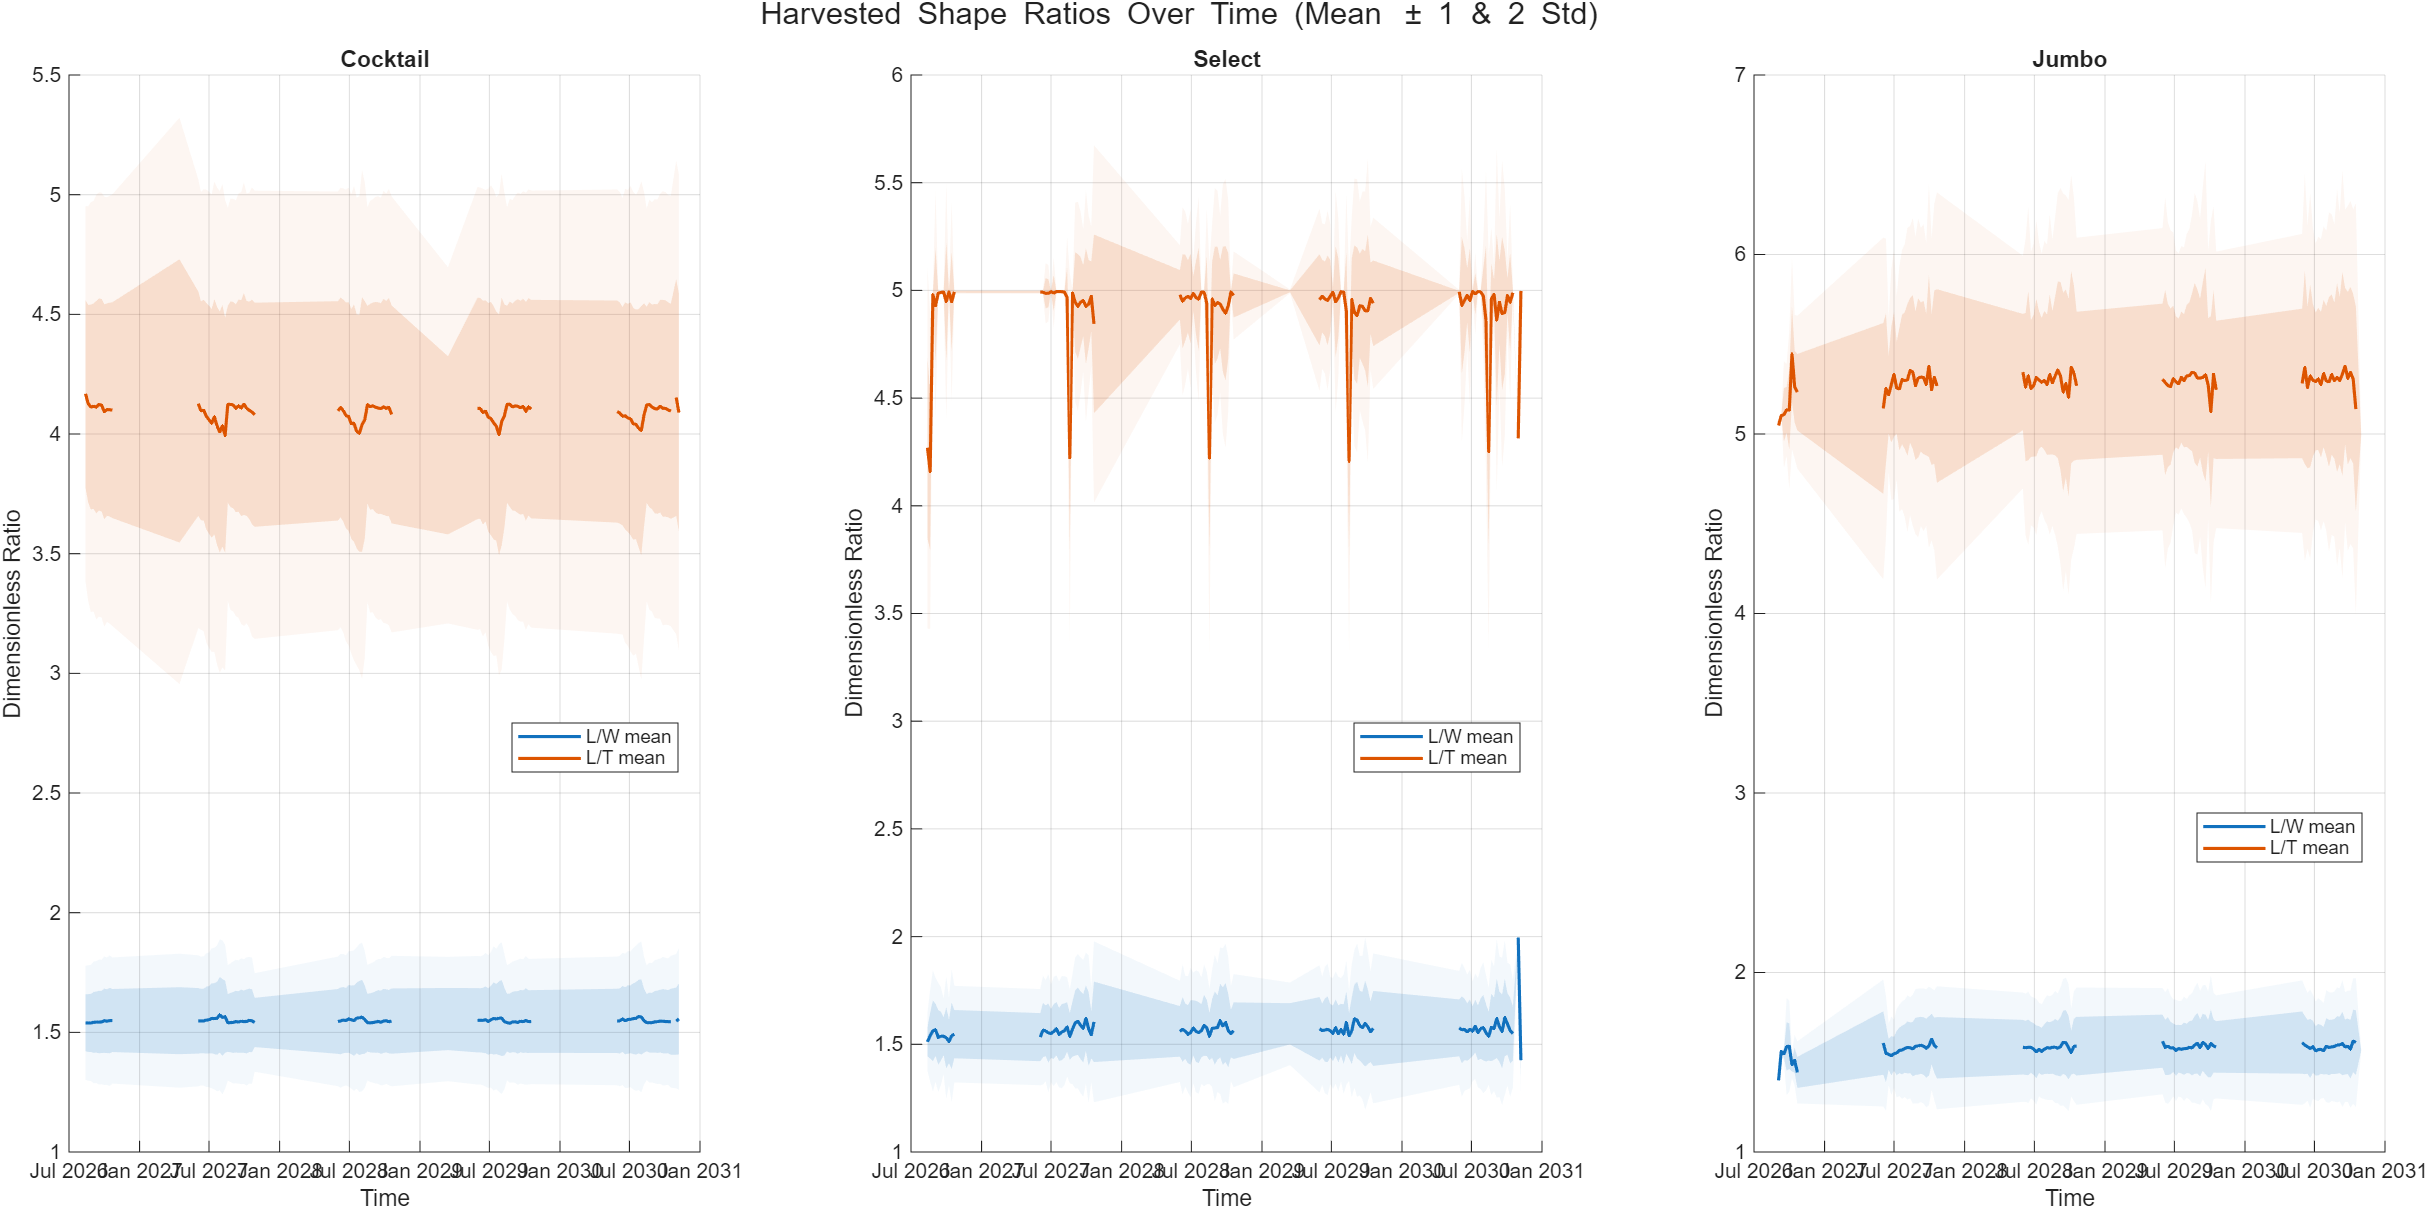
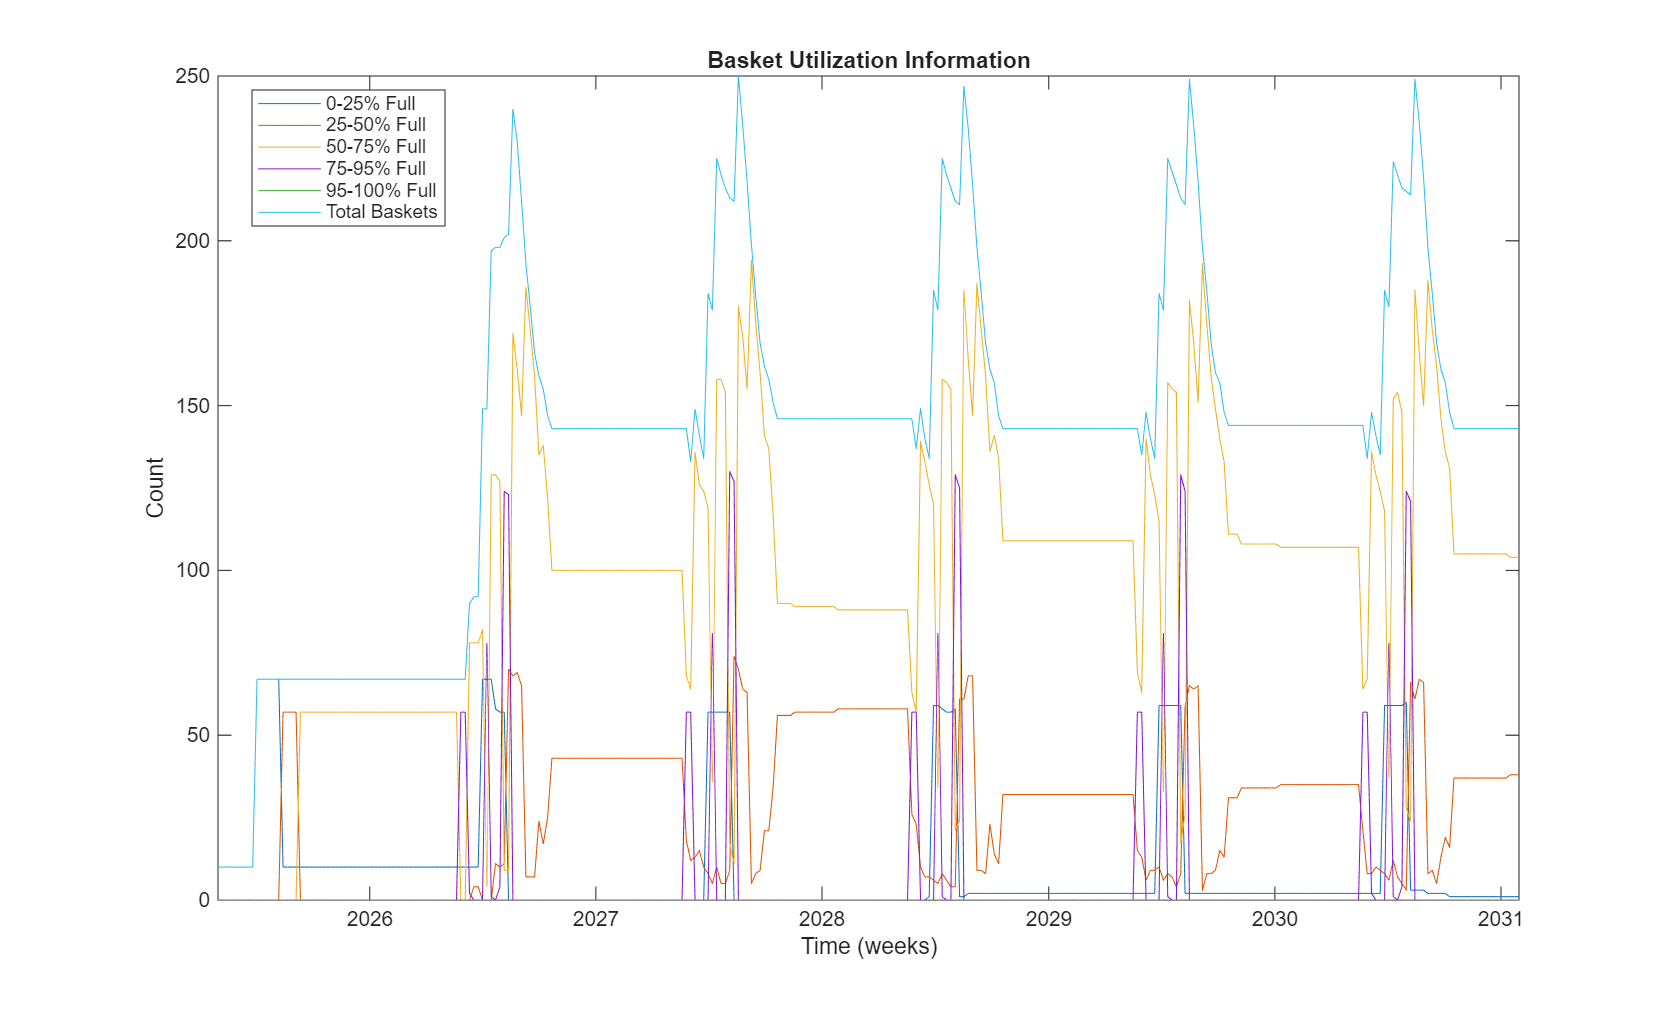
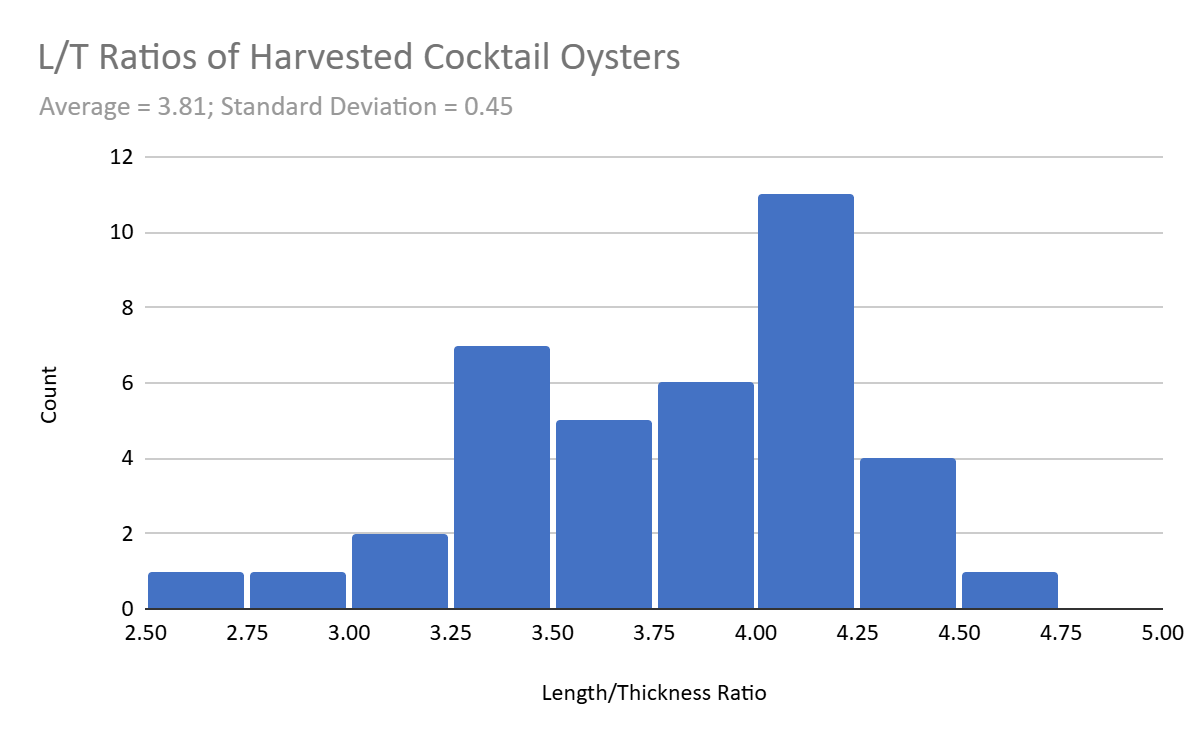
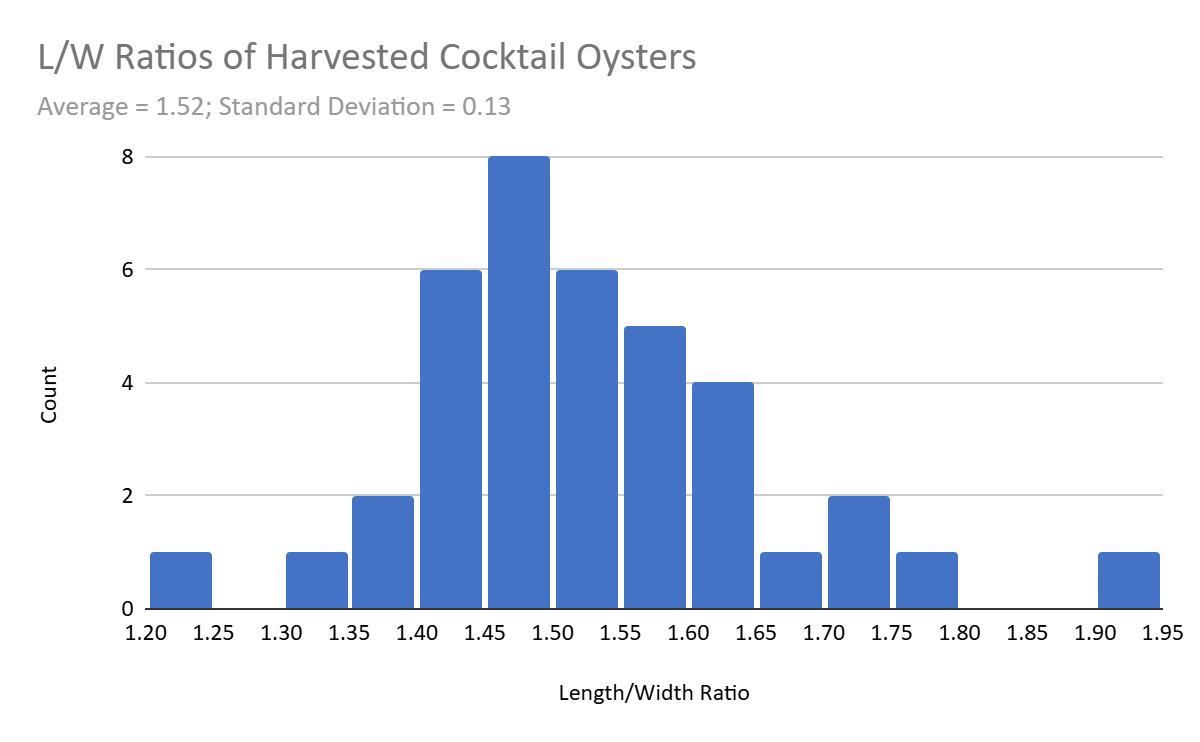
The program produces a large number of charts and graphs that can be used in a financial model or for other planning purposes. Examples (actual harvest numbers are not representative of the real TWIYO farm) include Figure 29, where the total number of oysters harvested each year is predicted and broken down into size class and age groups. Other outputs include the predicted fates of specific cohorts of oysters (Figure 30), so a farmer can see what ratio of their seed will become marketable oysters vs. mortality or misshapen jumbo oysters that are hard to sell. Additional predictions include information about the dimensions of harvested oysters (Figure 31 and Figure 32) so farmers can know what to expect in terms of length/width and length/thickness ratios. One of the most useful charts is Figure 34 which shows a farmer how many baskets they will need over the years, an important metric for sizing a farm and having enough resources on hand to deal with the planning seeding and harvesting curves.
As described in the materials and methods section regarding objective 3, TWIYO seeded the latest upgraded raft with fresh oyster seed in July 2025 and took regular measurements. This data was used to design the algorithm used in the production simulation/model, as well as create the input data such as growth rate, mortality rate, and variability in oyster shape. The following plots describe this collected data and show how it was used to create various correlations in the predictive model.
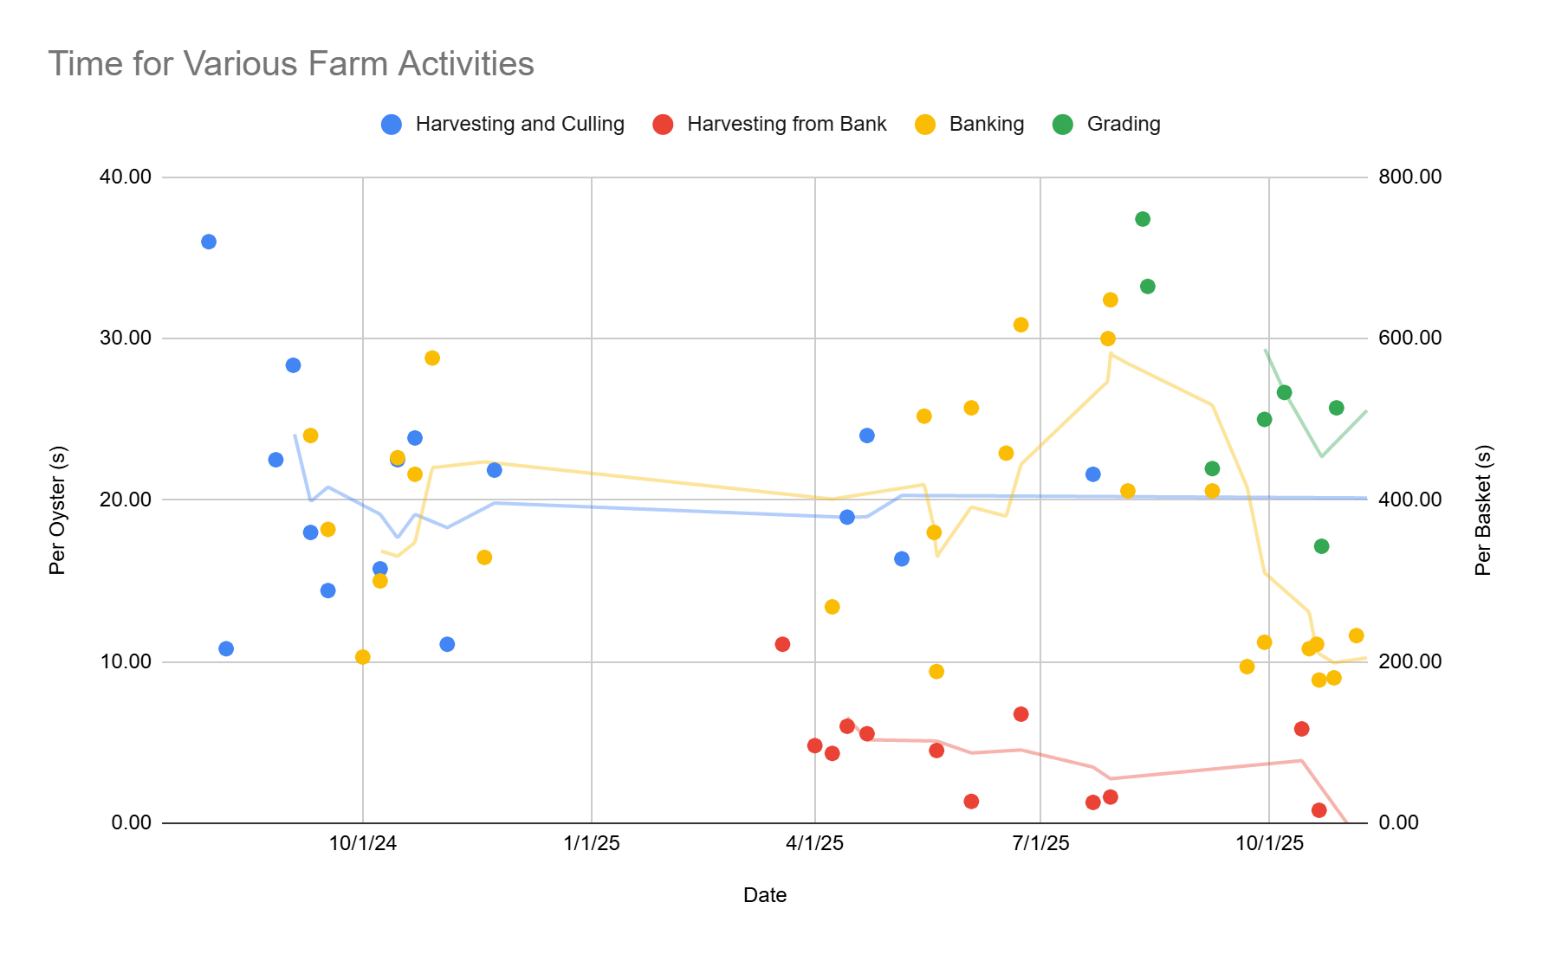
For the purposes of predicting the labor costs associated with various farm tasks TWIYO logged the times it took to perform various operations on the 3D-COAST rafts. This information was used to estimate the labor and operating costs of the 3D-COAST farm for comparisons such as Table 2. The measurements are shown in Figure 36.
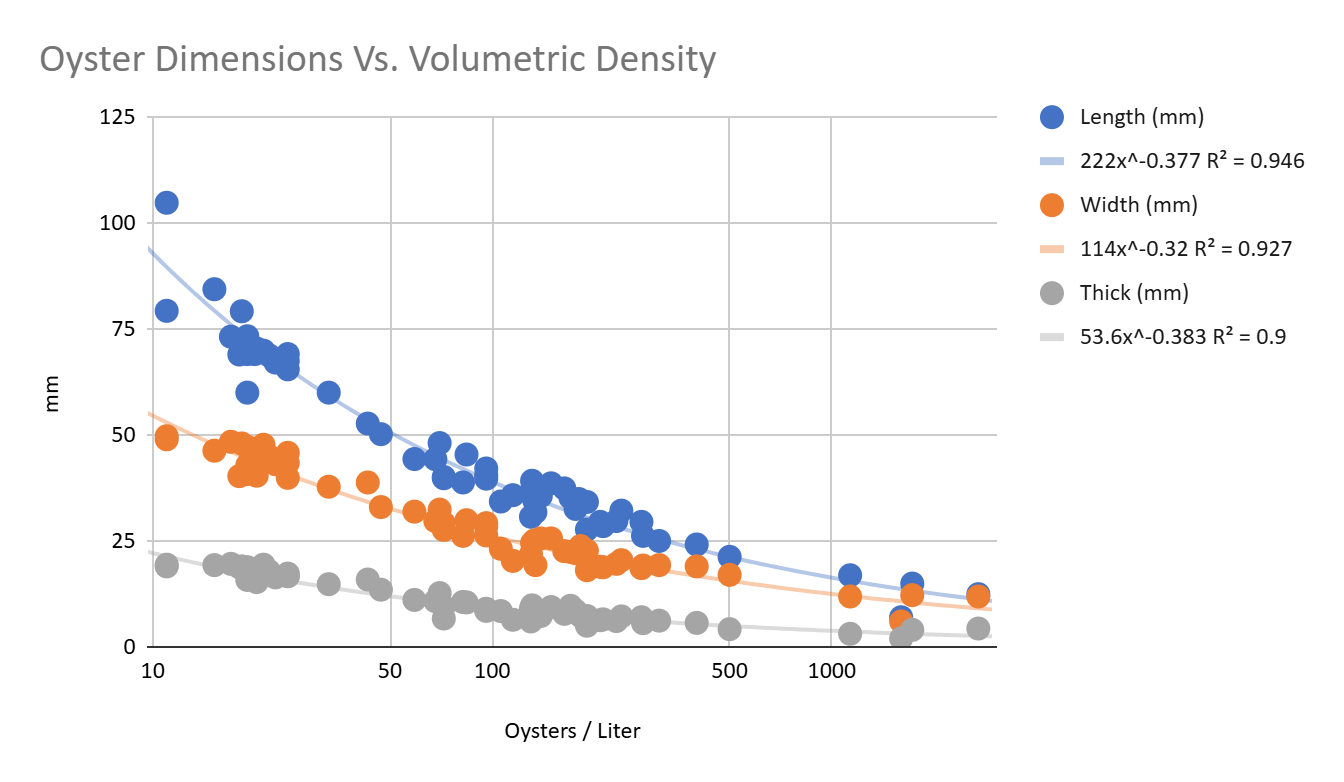
Examining the flow charts that describe the production modelling algorithm you can see that the conversion of basket density (oysters per liter) to oyster size (length, width, and thickness) is an important fundamental relationship to understand. This conversion is based on data collected on the TWIYO farm and is shown in Figure 37. This correlation is valid for specific growing conditions, in this case 3D-COAST, and therefore can give farmers actual information about what to expect for the dimensional shape of their oysters (as reported in Figure 31 and Figure 32). This includes important information about the quality such as cup ratio (deeper is generally considered a more desirable trait).
One of the most important pieces of data is the growth rate of the oysters. Many data points were taken as part of this project, but it remains one of the more difficult to accurately measure because several years of data is ideally needed. Over time TWIYO will be able to refine the growth curve for the 3D-COAST system and keep the inputs to the production model updated. The current dataset, thanks to this funding, provides reasonable accuracy and is validated by independent sources[2], when in doubt TWIYO has made conservative estimates that underpredict growth and performance.
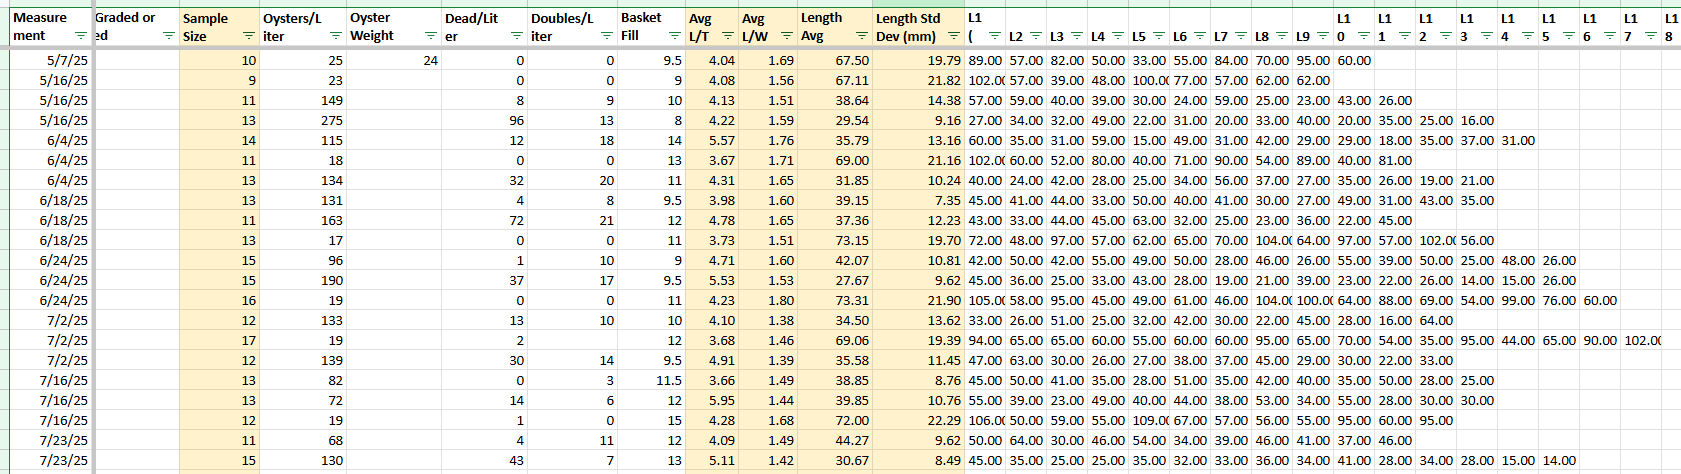
Each datapoint for the growth curve is made by measuring 12-40 oysters out of a basket, recording length, width, and thickness. The number of oysters per liter is also measured and recorded. This allows the average dimensions and estimated population variance to be calculated for each sample. Figure 38 shows a snippet from the spreadsheet used to make these recordings.
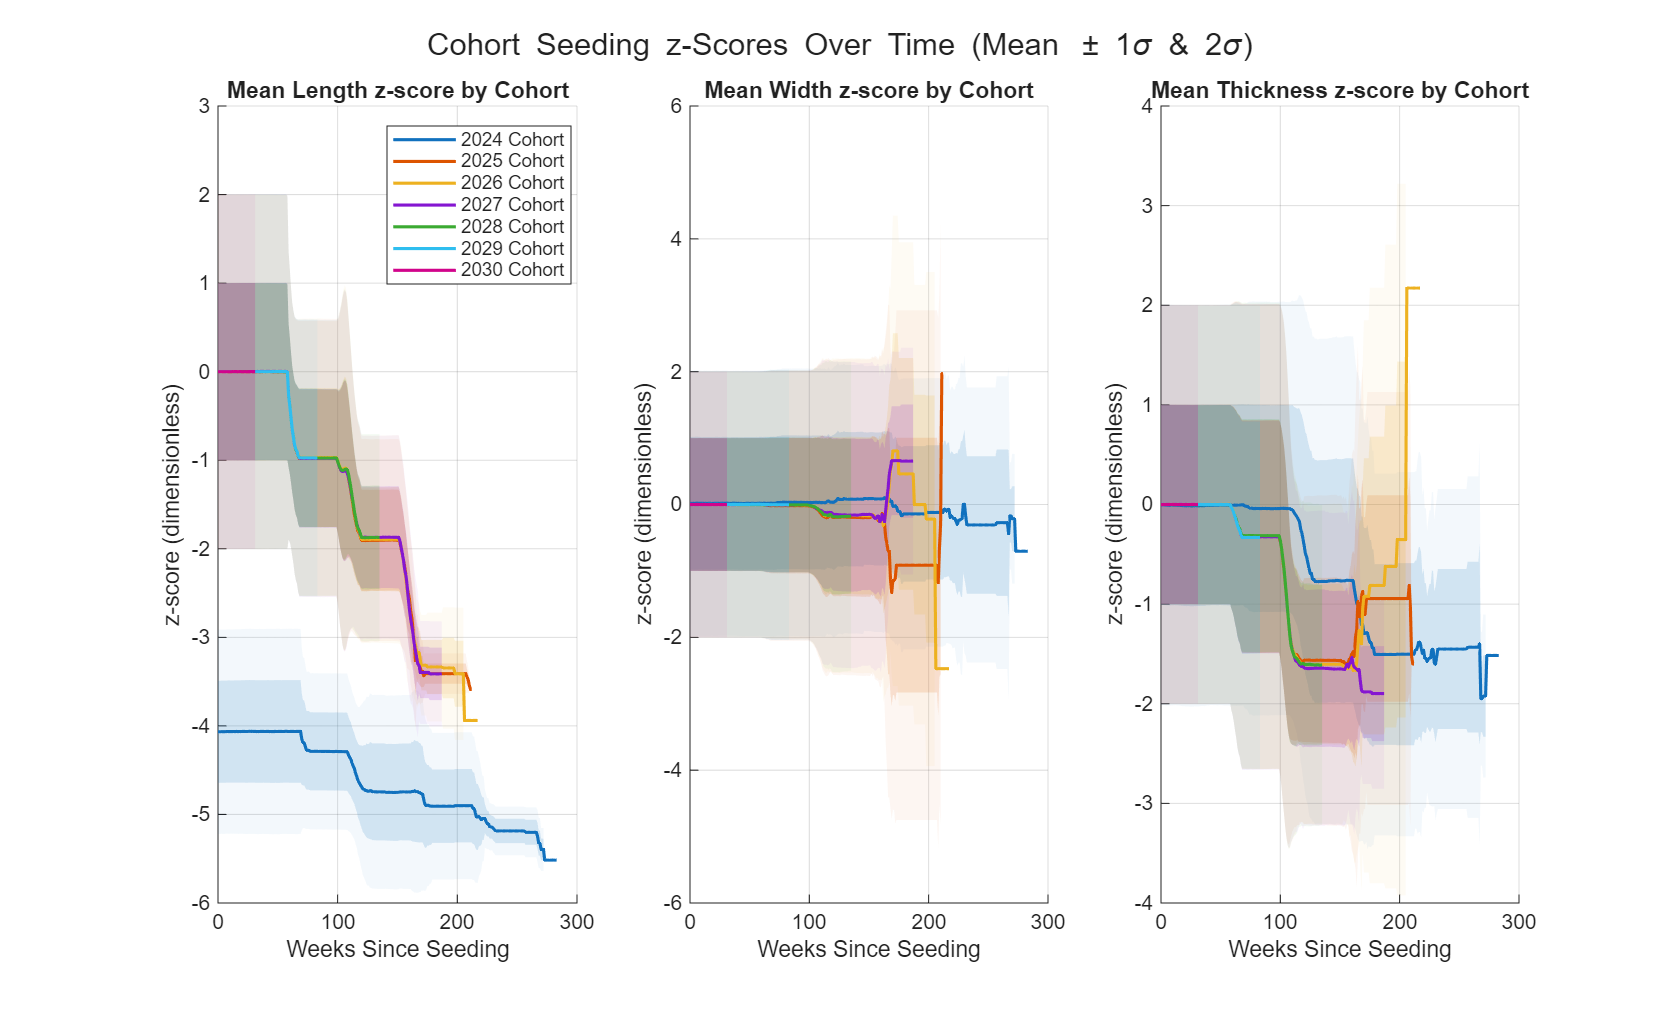
This data can then be put through a pivot table to record the length of oysters vs. their age, time of year, hatchery, growing methods or other parameters, as shown in Figure 39. One of the challenges that reduced the amount of valid data for growth rate modelling was that measurements can only be taken from baskets that have never been harvested from. This is because once some of the cohort in a basket have been harvested it statistically affects the population, usually in the form of skewing it toward the slow growers (only the fastest growing oysters are harvested first, leaving the slower individuals behind). Therefore, when the growth is measured the future the rate will be represented by the slower oysters and therefore overly conservative. This can be seen in Figure 33 where the average z-scores of the oysters decrease over time as the fastest growers are removed first. Oyster length growth can be converted to the other dimensions and density via the relationships of density and dimension shown in Figure 37.
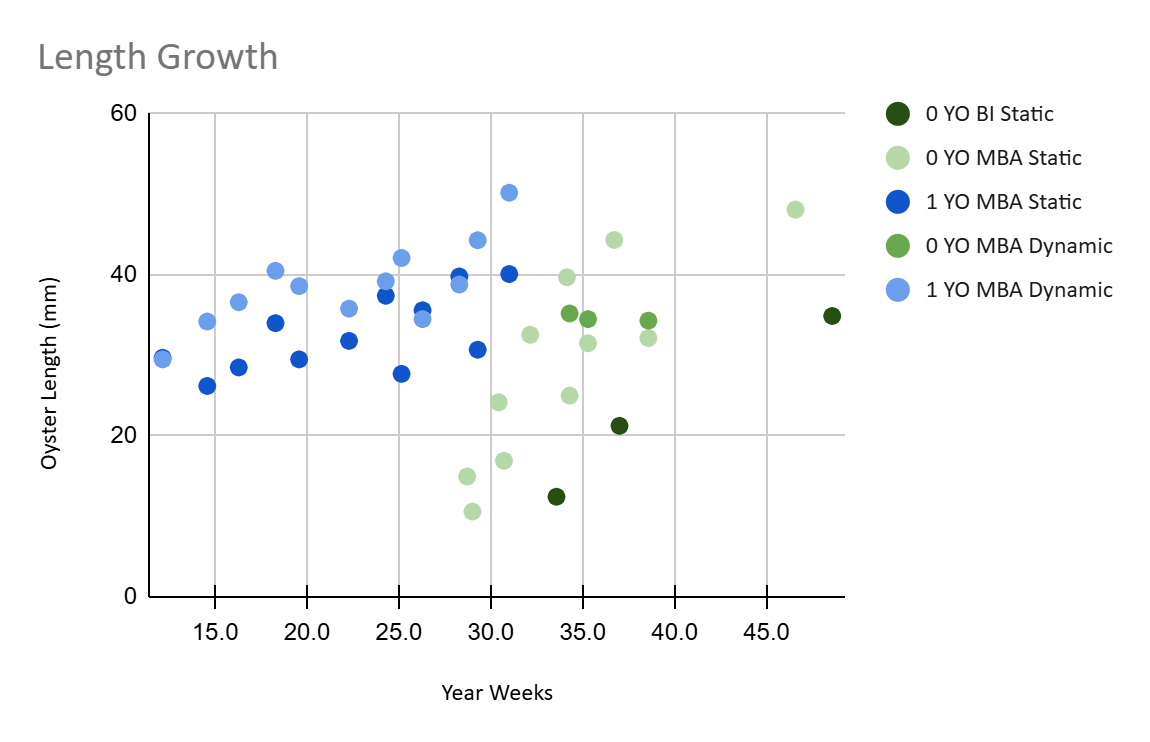
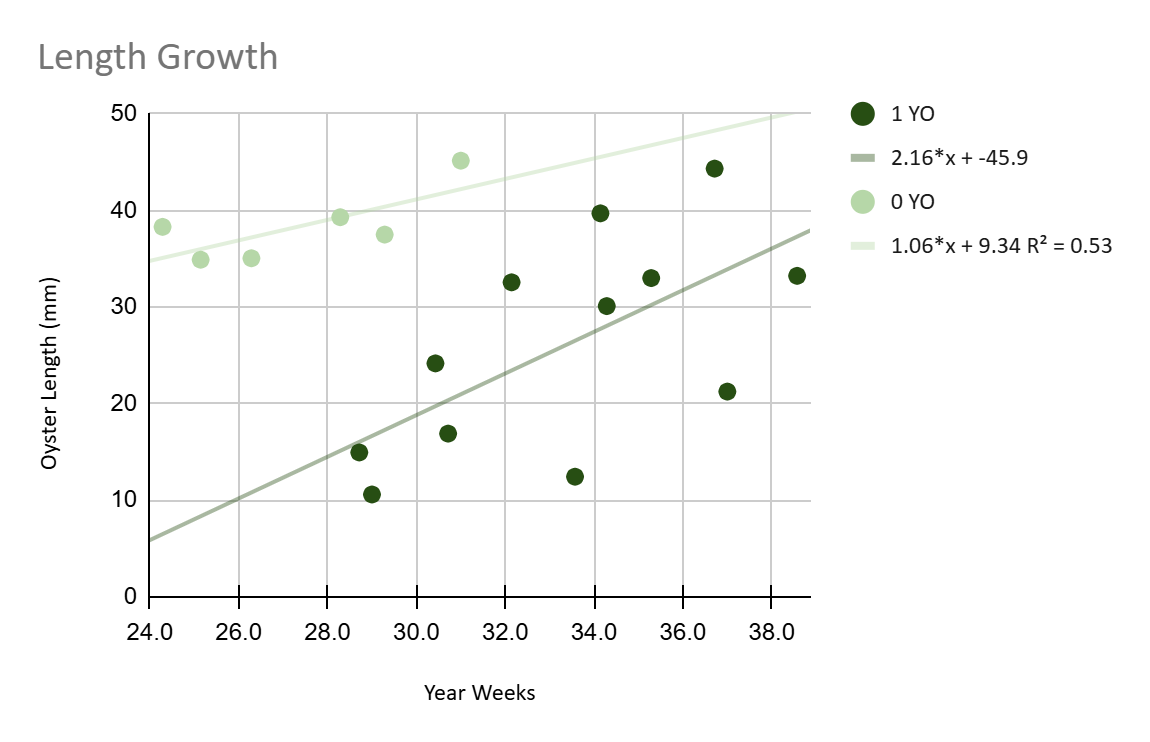
Figure 39 shows all data points available, including those from before and after the growing season really begins. You can also differentiate specific hatcheries and growing methods (static being non-3D-COAST, dynamic meaning 3D-COAST raised). In order to get a better idea of growth rates between ages during just the growing months Figure 40 was made, that crops the data to June-October and combines all points for a given age oyster. Fitting a linear line to each age-class of oyster gives 2.16 mm/week for 1-year-old oysters and 1.06 mm/week for 0-year-old oysters (seed). TWIYO believes that the 0-year-old data points are not necessarily accurate because some of the baskets got overly fouled before 3D-COAST was implemented and it skewed the rates slower than reality when properly maintained. Future year’s data will test this hypothesis. For purposes of this grant the growth rates in the production model were kept the same between age-classes, using the average of the classes at 1.6 mm/week (see Figure 41). Rather than using a linear growth curve TWIYO modified the rate to fit the shape of the growth measured in the paper by Kiffney et al[3] such that it tapered at the beginning and end of the season (Figure 42). However, on average, over a season the growth rate was made to match the nominal 1.6 mm/week measured on the 3D-COAST farm.
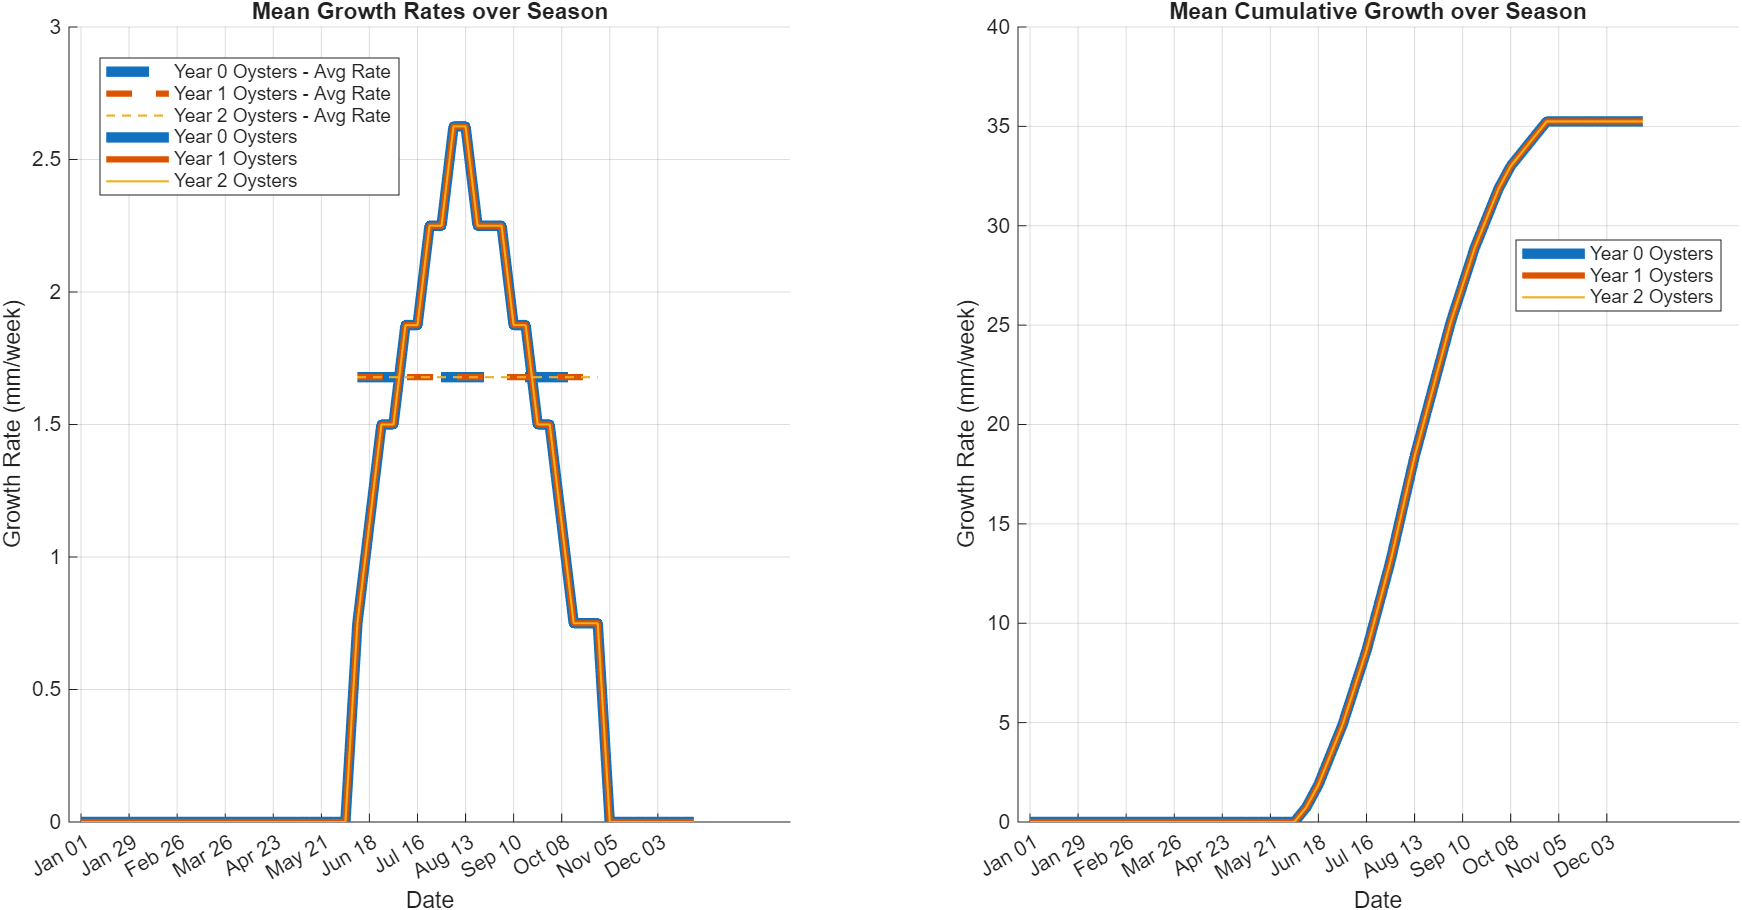
![Figure 42: Plots from Kiffney et al[4] regarding oyster growth predictions. The shape of these curves with a taper at the beginning and end of the season was used to modify the purely linear estimations to create the bell-shaped curve shown in Figure 41.](https://projects.sare.org/media/img/F/i/g/Figure-42-1.png)
The last big piece of information needed as input to the production model measured during this project is the expected variance in shape of the oysters (Figure 43 and Figure 44). This is controlled in the model by setting the initial variance of the seed dimensions as well as adjusting the variance in growth rate. The measured variance and mean of L/W and L/T (Figure 43 and Figure 44) can be compared to the predicted variance and mean of L/W and L/T (Figure 32) and the model inputs adjusted in a calibration process until these measures match.
[1] (Thomas Kiffney, 2026)
[2] (Thomas Kiffney, 2026)
[3] (Thomas Kiffney, 2026)
[4] (Thomas Kiffney, 2026)
3.3. Research Conclusions
The objectives of this project were to upgrade old revisions of the 3D-COAST rafts with the latest designs, deploy and test those rafts, measure reliability to determine if the improvements were effective, and then use data collected from the grown oysters to build and calibrate a production model that could accurately inform the business potential of the farm.
TWIYO was successful in meeting these objectives and is excited by the potential of the new 3D-COAST technology. From a practical point of view the upgrades to raft design were successfully manufactured and installed (Figure 9 - Figure 14), oyster seed was deployed to the rafts, and reliability was measured which showed a 10-20x improvement (Figure 18) indicating a successful R&D iteration of the technology. In a more abstract sense, the potential of the project was quantified by collecting data about oyster growth (Figure 37, Figure 39, and Figure 40) as well as labor requirements (Figure 36).
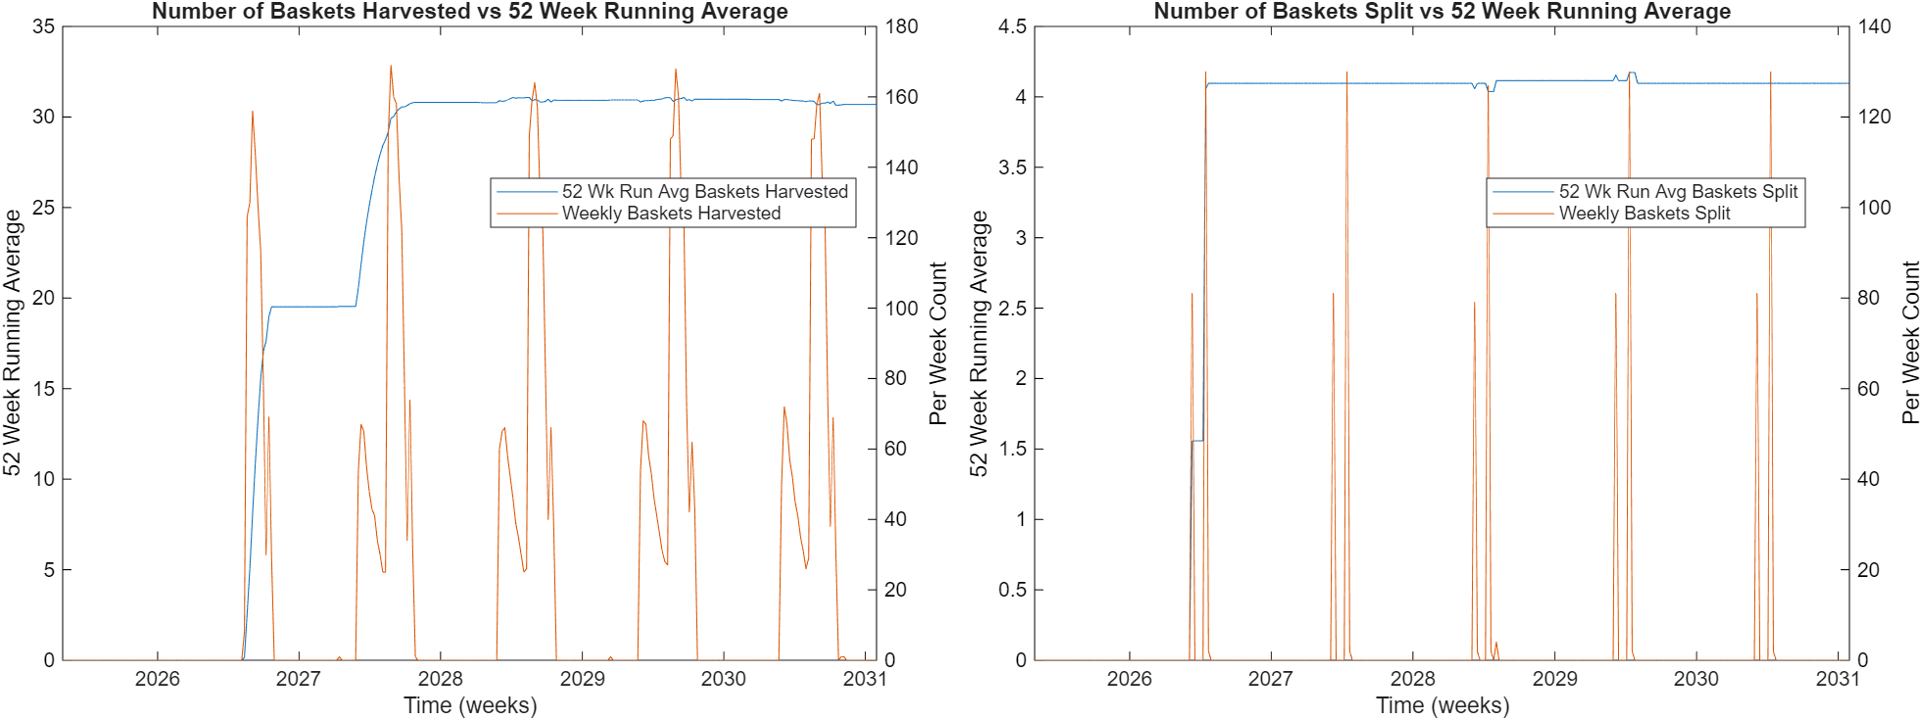
Together this data was used to summarize the possible farm performance shown in Table 2, demonstrating the potential increase in oyster production capacity for an oyster farm that adopts 3D-COAST. The table shows that for the same labor costs the farm could go from producing 5M oysters per year to 8M (60% increase) while being able to improve profit margins from 10% to 21%. Measured data from this project and earlier was used to predict the values shown in the table, for example, the measured labor times of Figure 36 were multiplied by the predicted task frequency (such as Figure 35) outputted from the production model to produce the estimated labor costs. These projections were then compared to a benchmarking report[1] produced by the Maine Aquaculture Association to create Table 2.
As can be seen in Table 2 the projections are very promising, both for the business potential of TWIYO’s own farm and the appeal of the equipment to other farms who may want to adopt it for their own operations. The 3D-COAST system could boost production capacity by 60% with our existing workforce while doubling profit margins. As such, TWIYO fully plans on continuing to use 3D-COAST and developing it further for distribution in the aquaculture community.
Table 2: A comparison of the operating costs of a traditional surface culture oyster farm with one using 3D-COAST equipment. The common thread between the two examples is TOTAL labor cost per year ($1.7M in this example), demonstrating how a farm could switch to 3D-COAST, maintain their original work crew, and increase their production capacity by 60% while also doubling profit margin.
|
|
Traditional Farm |
3D-COAST Farm |
|
Oyster Production/Year |
5M[2] |
$1.7M x 4.75 (Oysters/$) = 8M (Labor-spend kept constant) |
|
Labor Cost % |
62%[3] |
$1.7M / $3.78M = 45% |
|
Assumed Labor Pay ($/hr) |
$25.50[4] |
$25.50 (kept constant) |
|
Sale Price Per Oyster |
$0.60[5] |
$0.60 (kept constant) |
|
Production Cost per Oyster |
$0.54[6] |
$0.21 + $0.2125 + $0.05= $0.4725 (Other + Labor + Depreciation) |
|
Labor Cost per Oyster |
$0.54 x 0.62 = $0.33 |
$1.7M / 8M = $0.2125 (Same total labor spend by the same workforce) |
|
Other Costs per Oyster |
$0.54 - $0.33 = $0.21 |
$0.21 (Assume the “other” farm costs remain the same) |
|
Total Farm Labor Cost per Year |
5M x $0.33 = $1.7M |
$1.7M (Same workforce) |
|
How many oysters are produced with 1$ of labor |
5M / $1.7M = 2.94 Oysters/$ |
4.75 Oysters/$[7] |
|
Total Other Costs per Year |
5M x $0.21 = $1M |
8M x $0.21 = $1.68M |
|
3D-COAST Capital Costs Per Year (Factoring in Depreciation) |
$0 |
(((8M / 125k) x $50k) / 8) = $400k · 8M being annual production · 125k being annual production capacity of a raft · $50k being the cost of a raft · 8 being the lifespan of the raft |
|
3D-COAST Capital Costs Per Year (Factoring in Depreciation) per Oyster |
$0 |
$400k / 8M = $0.05 |
|
Total Costs Per Year |
$1.7M + $1M+ $0 = $2.7M |
$1.7M + $1.68M + $400k = $3.78M |
|
Revenue Per Year |
5M x $0.60 = $3M |
8M x $0.60 = $4.8M |
|
Profit Per Year |
$3M - $2.7M = $300k |
$4.8M - $3.78M = $1.02M |
|
Profit Margin |
$300k / $3M = 10% |
$1.02M / $4.8M = 21% |
[1] (Engle, van Senten, Schwarz, Brayden, & Belle, 2020)
[2] Considered a “large” farm by (Engle, van Senten, Schwarz, Brayden, & Belle, 2020) such that the labor cost ratio of 62% is true from that study
[3] (Engle, van Senten, Schwarz, Brayden, & Belle, 2020)
[4] Example rate, the trends between farms would remain similar at different rates
[5] Example price, based on experience, trends between farms would remain similar at different price points
[6] Based on baseline profit margin for traditional oyster farm (10% in this case). This baseline profit margin is backed up by the MAA benchmarking report (Engle, van Senten, Schwarz, Brayden, & Belle, 2020). Choosing different baseline profit margins would reveal similar trends between farms.
[7] Based on measured labor times on TWIYO’s farm using 3D-COAST
3.3.1. References
Do you know how much water was used to grow your food and to produce your clothes and the things you buy? (2010). Retrieved from Water Footprint Network: https://www.waterfootprint.org/time-for-action/what-can-consumers-do/
Engle, C., van Senten, J., Schwarz, M., Brayden, C., & Belle, S. (2020). Benchmarks for Mussel, Oyster, Scallop, and Seaweed Culture in Maine. The Maine Aquaculture Association.
Fry, J. P., Mailloux, N. A., Love, D. C., Milli, M. C., & Cao, L. (2018). Feed Conversion Efficiency in Aquaculture: Do we Measure it Correctly? Environmental Research Letters(13).
General Assembly GA/EF/3242. (2009, October 9). Meetings Coverage and Press Releases. Retrieved from United Nations: https://press.un.org/en/2009/gaef3242.doc.htm
Morse, D. (2023, September 5). Senior Extension Program Manager, Aquaculture Lead. (L. Saindon, Interviewer)
Rappaport, S. (2023, February 1). Towns fear, fight aquaculture expansion. Retrieved from Island Institute: https://www.islandinstitute.org/working-waterfront/towns-fear-fight-aquaculture-expansion/#:~:text=So%20far%2C%20at%20least%20eight,Penobscot%2C%20all%20in%20Hancock%20County.
Thomas Kiffney, R. L. (2026). Using dynamic energy budget modeling and high-resolution satellite products to predict eastern oyster growth at a farm scale. Aquaculture.
Education & outreach activities and participation summary
Participation summary:
4.1. Education and Outreach Description
- Presentation at NACE (Northeast Aquaculture Conference & Exposition) in 2026. Luke Saindon is registered to give a talk as part of the “Advances in Gear Technology II” discussion chaired by Chris Davis.
- Hosted a farm tour for members of the University of Maine Darling Marine Center and the Maine Aquaculture Innovation Center. The researchers brought measurement sondes that were used to collect data for this and other projects.
- Hosted a farm tour for the Maine Aquaculture Association.
- Hosted other farmers for visits, such as Sean Corcoran and Jacqueline Clarke from Nor’Easter Oyster Co, and Max Reinhold from Merrymeeting Shellfish Company.
- Created a webpage for posting information regarding 3D-COAST technology, including hosting the production modelling application. https://www.worldsyouroysterco.com/coast-3d-growing-system
Learning Outcomes
5.1. Key areas in which farmers reported changes in knowledge, attitude, skills and/or awareness
While no formal surveys were part of farm visits, qualitatively speaking, the primary sentiment shared with TWIYO from visiting farmers was excitement over the potential to boost production while also maintaining extremely high-quality oysters. In Maine there is growing concern over farms trying to increase scale for financial viability during a tighter market but are suffering from poor quality and reputation as a result, which can impact the whole industry. There was also shared concern over sustainability for farmers (in terms of the physical tole taken on bodies), and interest in 3D-COAST for those reasons. Areas where TWIYO has work to do include convincing through solid demonstration that the technology can be reliable and usable, 3D-COAST rafts can look complex and somewhat daunting. TWIYO acknowledges the risks from complexity and is trying to walk a line of introducing mechanization for real benefit while keeping the operating principals as simple and straightforward as possible.
Project Outcomes
6.1. Project Outcomes
Using the data collected in this project a pair of 3D-COAST rafts is projected to produce 250,000 oysters per year on a Maine LPA plot (400 square feet). This equates to roughly 10M-20M oysters/acre of planted space. Typically, oyster farms need to produce 200-300,000 oysters/year to break even[1], therefore a farm in Maine could produce that quantity of product with 1 LPA site. This is a much smaller space than typically required. In comparison, the average established oyster farm in Maine grows with a density of up to 67,000 oysters/acre on bottom culture sites and 144,000 oysters/acre on suspended surface culture farms[2]. Even doubling these density numbers would have a huge impact, and the 3D-COAST system realistically increases them by an order of magnitude (allowing farmers to run much more compact farms on easier to license lease sites). The elimination of manual de-biofouling and oyster tumbling labor drastically increases a farm’s production potential and efficiency, reducing the labor cost share from 62% to 45%, allowing a farm to increase their production volume by 60% using their existing labor force while also doubling their profit margin (Table 2). Not only will this make oyster farms more efficient it eliminates some of the most dangerous and disliked tasks such as manually scraping fouled oyster cages and manually tumbling oysters, allowing farmers to have longer and more sustainable careers. These smaller more productive farms will also reduce tension between farmers and neighbors on the water and nearby shores who are concerned about existing farm operations.
[1] (Engle, van Senten, Schwarz, Brayden, & Belle, 2020)
[2] (Engle, van Senten, Schwarz, Brayden, & Belle, 2020)
6.2. Assessment of Project Approach / Area of Further Study Needed
6.2.1. Keys to Success or Challenges
The key to this project’s success, one that has been learned from previous challenges, was keeping the collected data very organized, and thinking backwards from the desired product (production model in this case) and determining what information was needed in order to make that possible rather than just randomly listing a bunch of measurements that sounded cool. From the physical hardware side what was helpful was building in small steps on existing learning and prototypes rather than trying to take overly large development steps that tear down too much previous work.
Challenges that persisted were dealing with the imperfections of real living systems when trying to flatten them into statistics. For example, realizing that measuring growth from baskets of oysters that had already been harvested from will skew the data. Also dealing with all the additional variables that are hard to anticipate and which make comparing apples to apples difficult. In reality changing only one variable at a time is harder than it sounds.
6.2.2. Revisions in Methodology
The primary revision in methodology is planning which baskets to measure from ahead of time such that they do not get harvested from or messed with before data can be measured. Overall, the accuracy of the growth curve data must be improved before full there is full confidence in the results. However, having some independent data[1] to compare with was very helpful and filled some gaps.
6.2.3. Were Your Questions Answered?
Overall, very much yes. The goal was to gain confidence in a new technology that had showed a glimpse of promise before this project, but needed more concrete evidence as well as confidence in reliability and practicality. The project resulted in a practical and usable tool that quantifies the performance of the 3D-COAST farm, but uses an algorithm that can be loaded with growth data and husbandry practices from any surface culture farm for broader application.
6.2.4. Plans for the Future of the Technology
TWIYO plans to continue developing 3D-COAST, both to use it on our own farm and for distribution to other farms if there is interest. Making oyster farms work financially is a huge challenge, and any advantage that can be realized is worth some risk. In the introduction, four problems 3D-COAST seeks to solve were listed:
- High rates of injury and labor-intensive processes
- Difficulty scaling
- Achieving social license
- Inconsistent product quality and profit margins
Supportive evidence of varying degrees was uncovered for all of these points, but reviewing them also leads to the future needed work. In particular, solving the high rates of injury and labor-intensive processes. While the system definitely shows promise in reducing the overall labor costs of producing oysters (by eliminating manual tumbling and cleaning) the system still needs improvement on various human factor points. For example, loading and unloading baskets from the rotators more efficiently, and improving a crane system for lifting an entire rotator at once. Maintenance tasks, while significantly reduced in quantity with this summer’s R&D are still somewhat difficult to perform and could benefit from development of specialized tools and processes that are easy to train new users on.
6.2.5. Other Possible Beneficiaries
Generally, TWIYO hopes that 3D-COAST could be used in most sheltered coastal waters where aquaculture is permitted. There could be particular promise in communities where there is a lot of conflict between larger farms and landowners, where 3D-COAST could boost production while decreasing footprint and visual impact. Additionally, new or potential farmers could benefit from the system because it provides a livable production volume without the need for large complex lease processes.
[1] (Thomas Kiffney, 2026)