Final report for FS19-313
Project Information
This project seeks to reconcile the juxtaposition of two experiences that I have had in my beekeeping career:
First:
I met a beekeeper many years ago who made his living by selling bee pollen to a pharmaceutical company who was owned by a family that I knew well. The pollen being sold had to be 95% pure to the designated source to pass quality control. My friend that performed quality control for the pharmaceutical company shared that this beekeeper's pollen never failed their purity standards. This beekeeper, who has since passed away, is a folk legend in our corner of Appalachia. As such, accounts of how he accomplished this without any formal education or training is often anecdotal rather than scientific.
Second:
Much of my work as a commercial beekeeper has been focused on nutrition. Beekeepers have long enjoyed a range of options for supplementing carbohydrates in their colonies when resources are scarce, but the same cannot be said for protein. Pollen supplements until relatively recently were not commercially available and widely regarded to be inferior to natural pollen. Even with the improvements that have been made, pollen substitutes are expensive, involve a labor input to apply, exasperate hive beetle-related problems, and are still thought to be inferior to natural pollen. Accordingly, I have long been interested in better understanding the pollens that are coming into our colonies. This interest led me to the late Dr. Vaughn Bryant at Texas A&M University who was widely regarded as the leading pollen identification expert in the land-grant university realm.
The objective of this project was to determine if pollen analysis was achievable in-house. The motivation to do so would include the benefits of improving our colonies' access to nutrition as well as the possibility of creating an additional revenue stream by selling bee pollen to pharmaceutical companies.
The likelihood of achieving this objective was in sharp contrast depending on who I was consulting. My contacts at a pharmaceutical company were optimistic and referenced the before mentioned beekeeper with no formal education as an example of success; meanwhile, Dr. Bryant argued that acheiving a standard of 95% purity was not possible without a commercial lab such as the one that he operated at Texas A&M.
Cooperators
Research
Bee Pollen was collected from a number of colonies as outlined in our Proposal. These 29 samples were each divided in two identical groups. One set of samples was sent off to be processed into slides by a private lab in Canada recommended by Louisiana State University who then used the slides to identify the pollens in the sample in their lab. The second set of identical samples was used in-house to prepare slides per the protocol used by a pharmaceutical company. These slides were then analyzed using the same equipment used by the pharmaceutical company to identify the various pollens.
Dr. Warny summed it up this way: "Palynology is so difficult because you are dealing with literally hundreds of thousands of possible plants." Our project was structured to reduce these possibilities down to a manageable subset by understanding what pollens are coming into our colonies at a given time and then relying on what Dr. Bryant referred to as "the relative high fidelity of bee pellets" that could be separated by color. The best example of our success can be seen in comparing Figure 1, showing our in-house slide, to Figure 2, showing Dr. Warny's slide of Magnolia. Our sample is uniform and exhibits the same structure as the sample prepared at LSU. However, rarely were we able to achieve these types of results for the following reasons:
First, despite separating the bee pellets by color, more than one pollen source would appear in the sample. This pollen diversity within a sample is evident in Figure 3. Based on the shapes of the pollens alone, one can recognize multiple pollens. This was also the case in the samples processed at LSU (Figure 4), and speaks to Dr. Bryant's point that bee pellets are not always as homogenous as one may assume which further complicates the identification process.
The second problem that we encountered was stated this way by Dr. Warny: "pollen is seen in 2d on slides in a variety of position(s) that can be confusing if you don't have the 3d image in your brain." This phenomenon is clearly apparent in Figure 5, a 2d image of goldenrod using a compound microscope, and Figure 6, a 3d image of goldenrod using a scanning electron microscope. The skillset that Dr. Warny and Dr. Bryant have honed through the experience of identifying thousands of pollens is remarkable and not readily replicated by those dabbling in palynology.
Finally, the most significant obstruction to our success was due to our inability to see enough detail within our samples. This is evident in Figure 7 which shows two images of dandelion: one collected by hand from the flower and the second from a bee pellet. Compare this with LSU's slide of dandelion (Figure 8), as well as the SEM image of dandelion in Figure 9. Clearly our in-house slide is lacking in detail, making identification all but impossible. In contrast, the LSU sample underwent acetolysis--a chemical treatment that requires a centrifuge and a fume hood (lab equipment beyond the reach of a beekeeper). As Dr. Warny put it, "you have to do a chemical treatment of your sample....to see the wall structure." Dr. Bryant shared this same insistence with me repeatedly before his passing, and he was absolutely right based on our experiences. Figure 10 and Figure 11 both show in-house samples that may or may not be blackberry (Figure12) or locust (Figure 13). There just is not enough detail--due to the lack of acetolysis--to know with any certainty.
The unanswered question of my project is how does the pharmaceutical industry validate the samples since, as Dr. Warny claimed, "most allergists do not do that (acetolysis)....and can't see the structure for ID." Accordingly, my contact in the industry verified that they do not use acetolysis to validate samples. The difference can be seen in the slide of ragweed supplied by the pharmaceutical industry (Figure 14), compared with the slide provided by LSU (Figure 15).
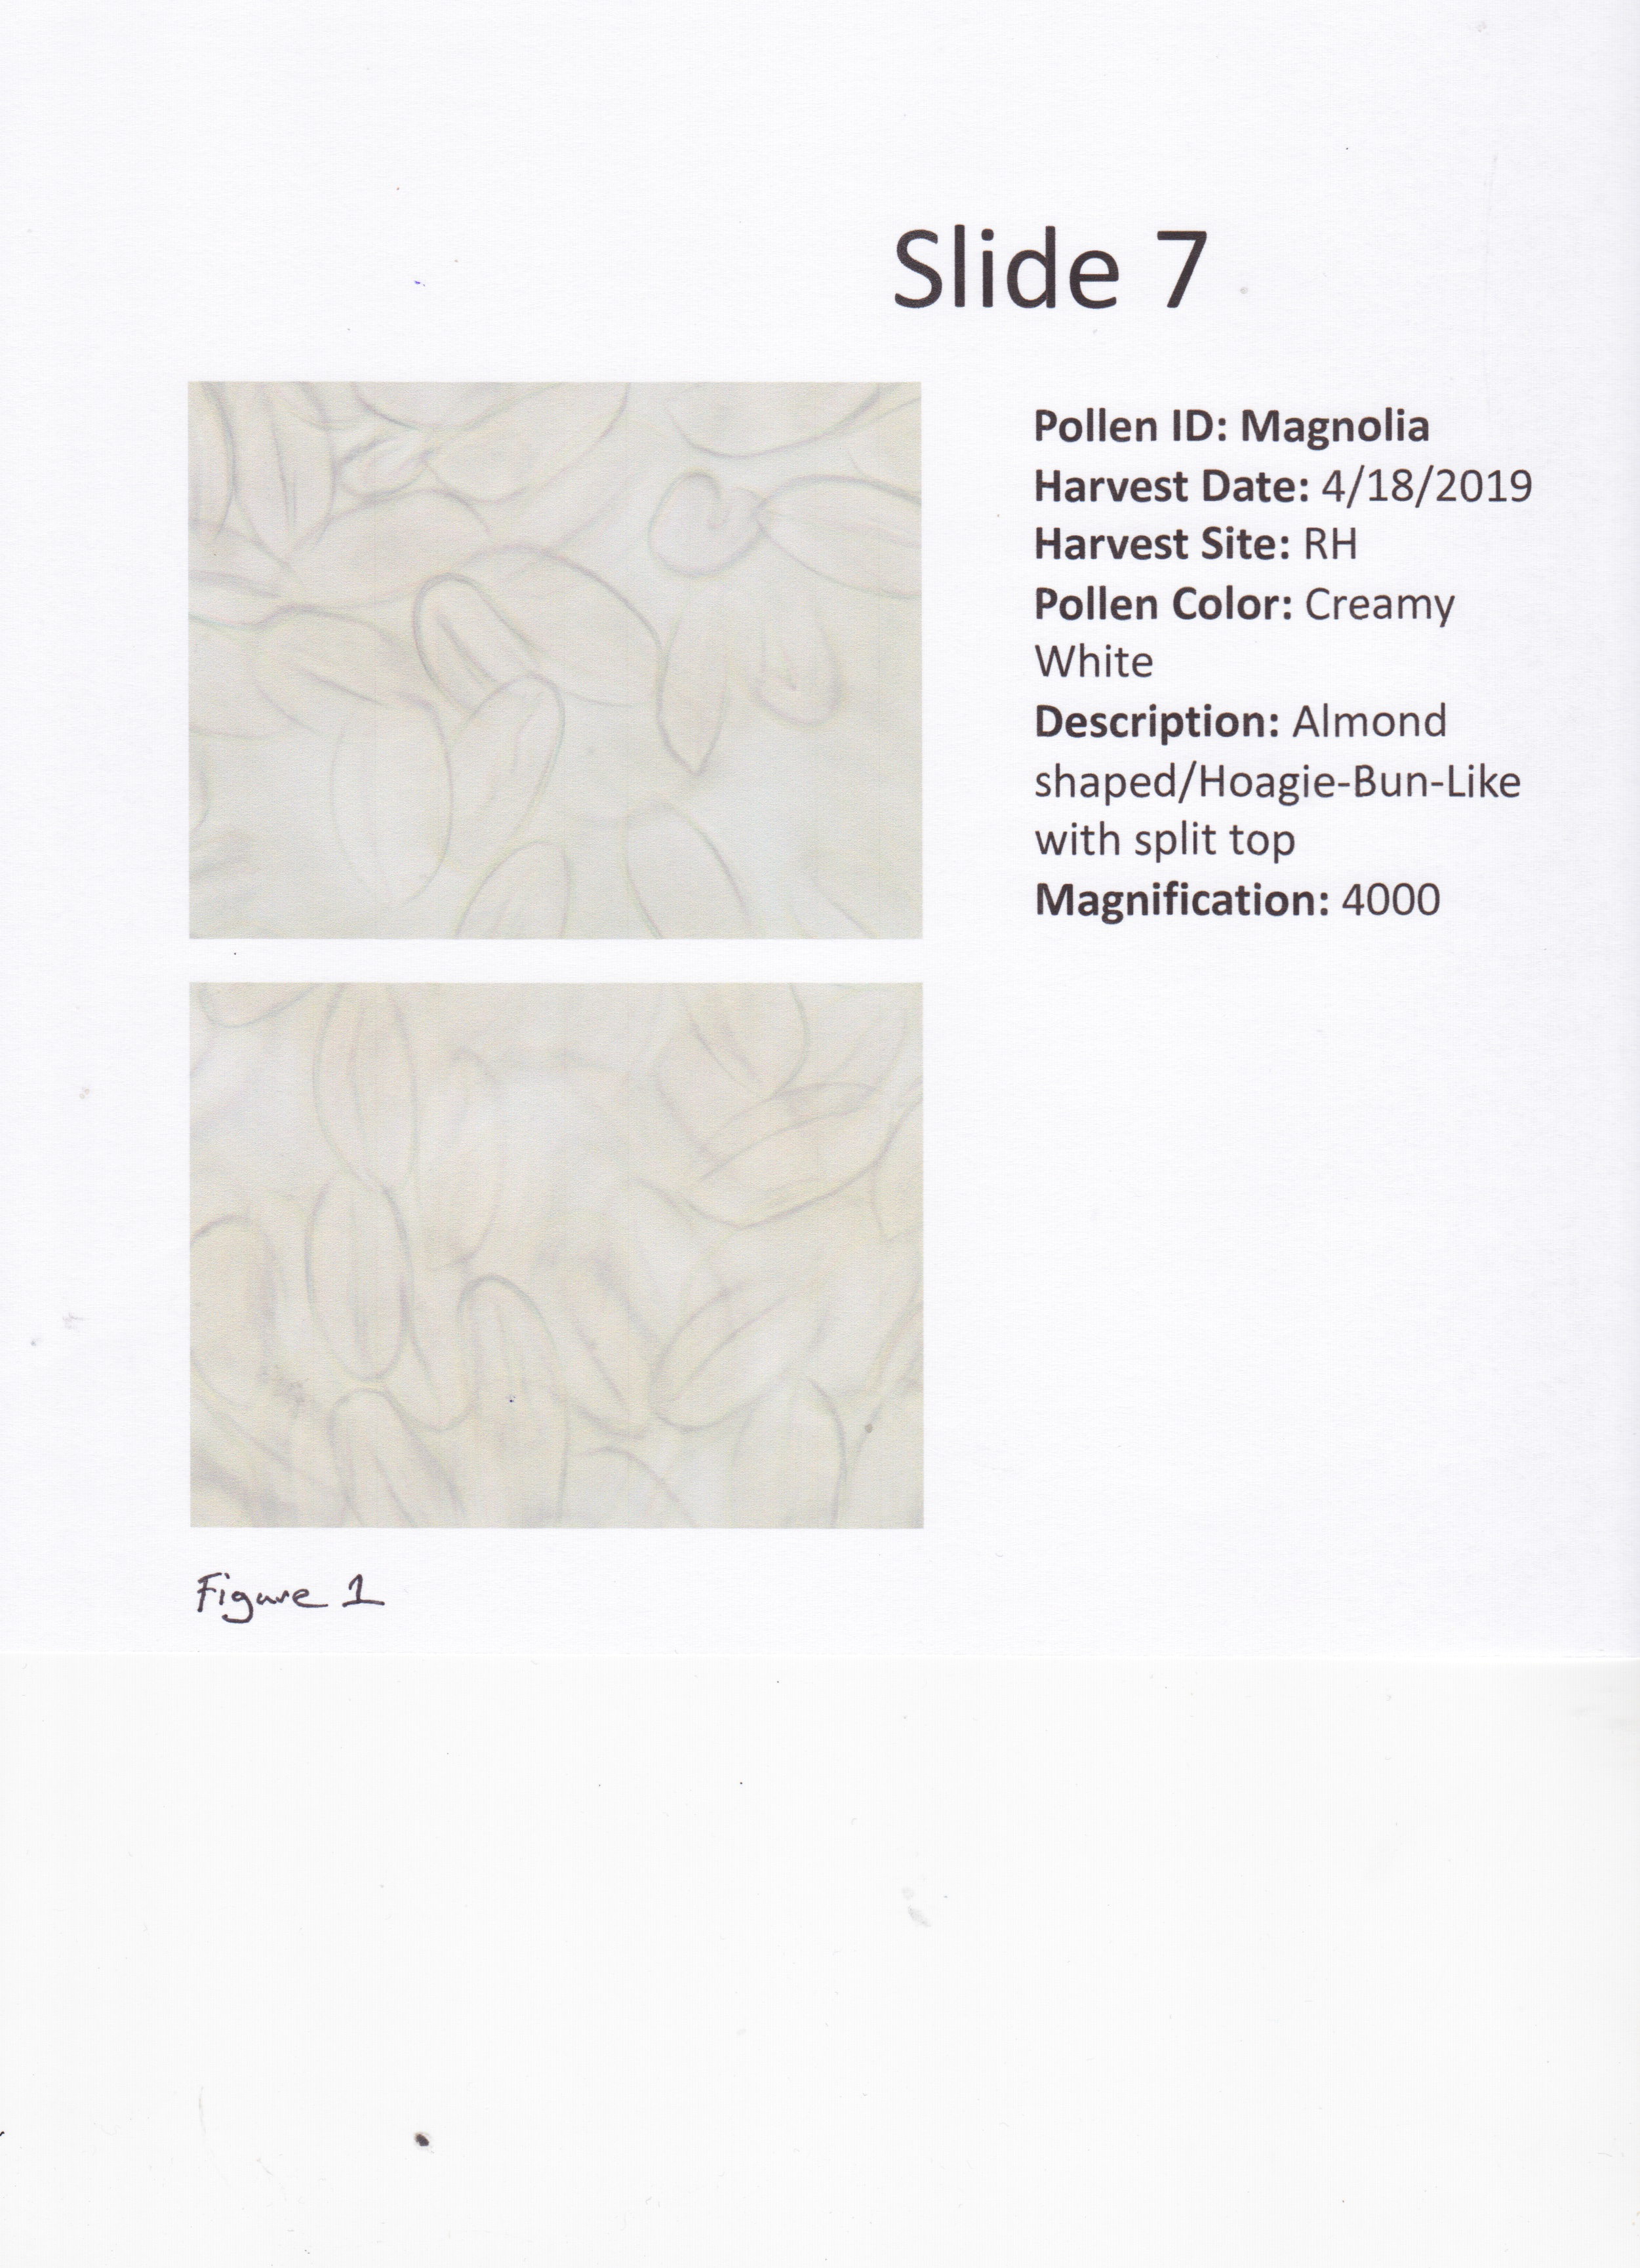
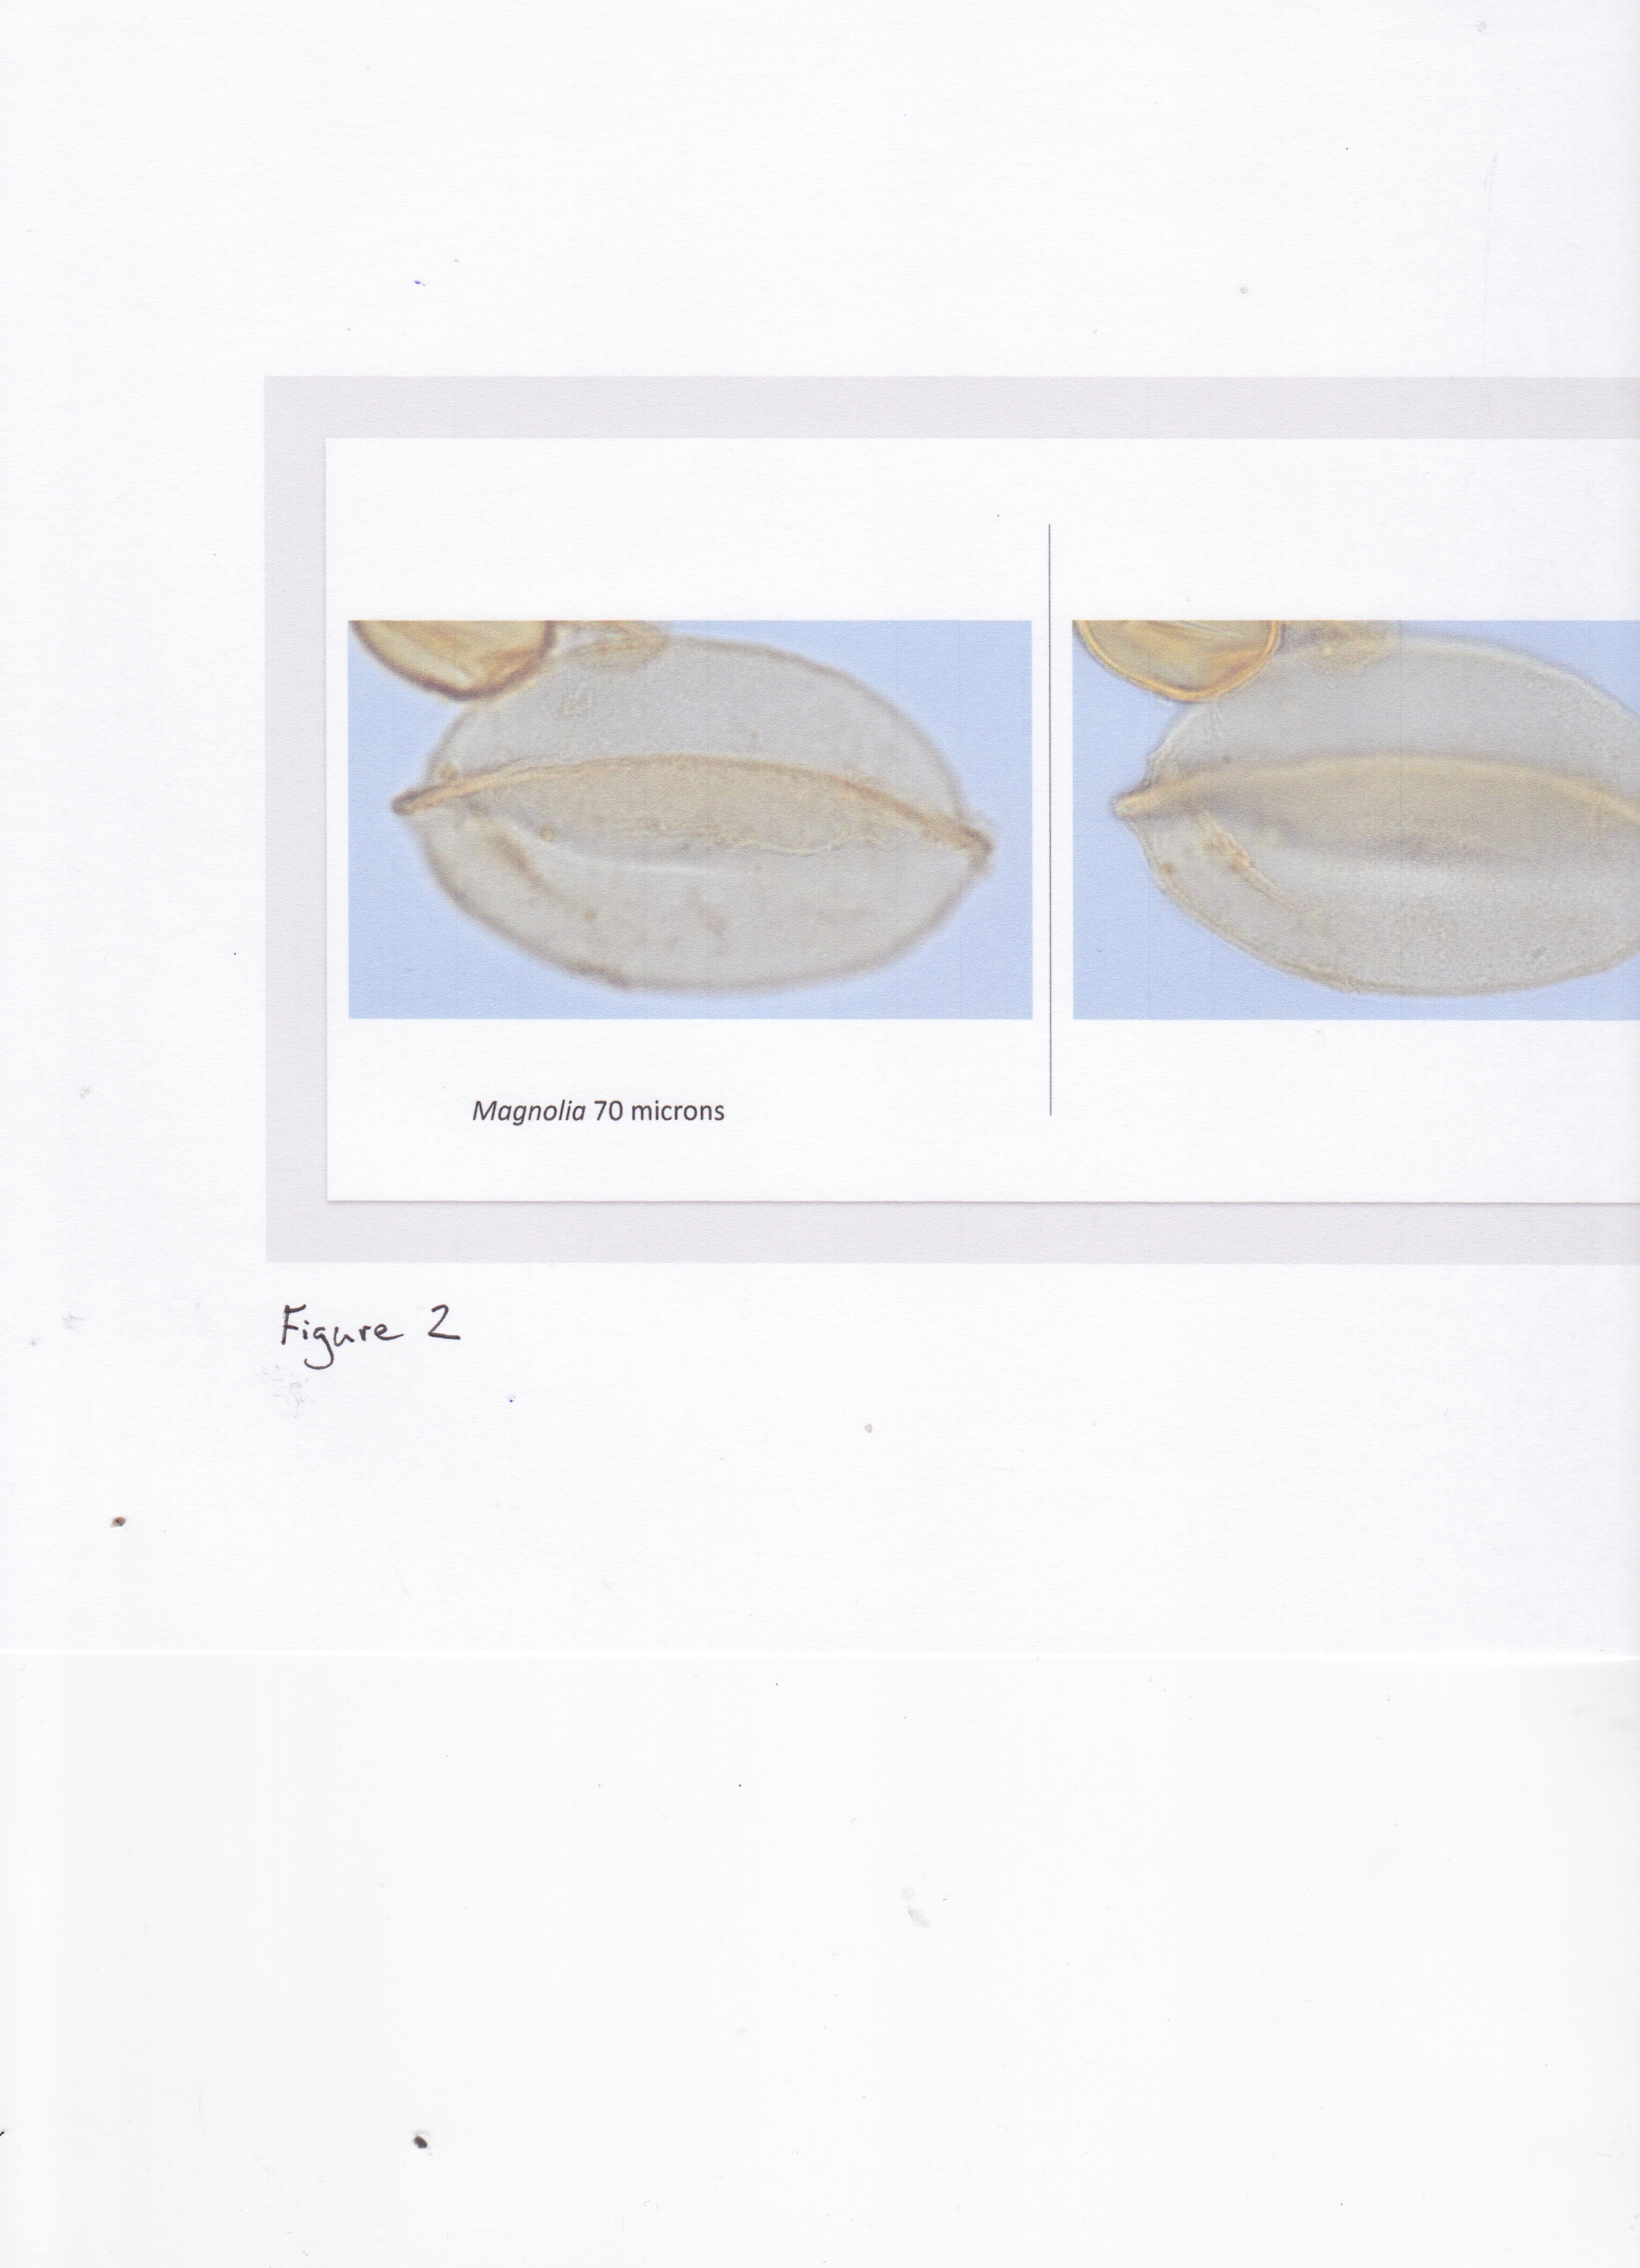
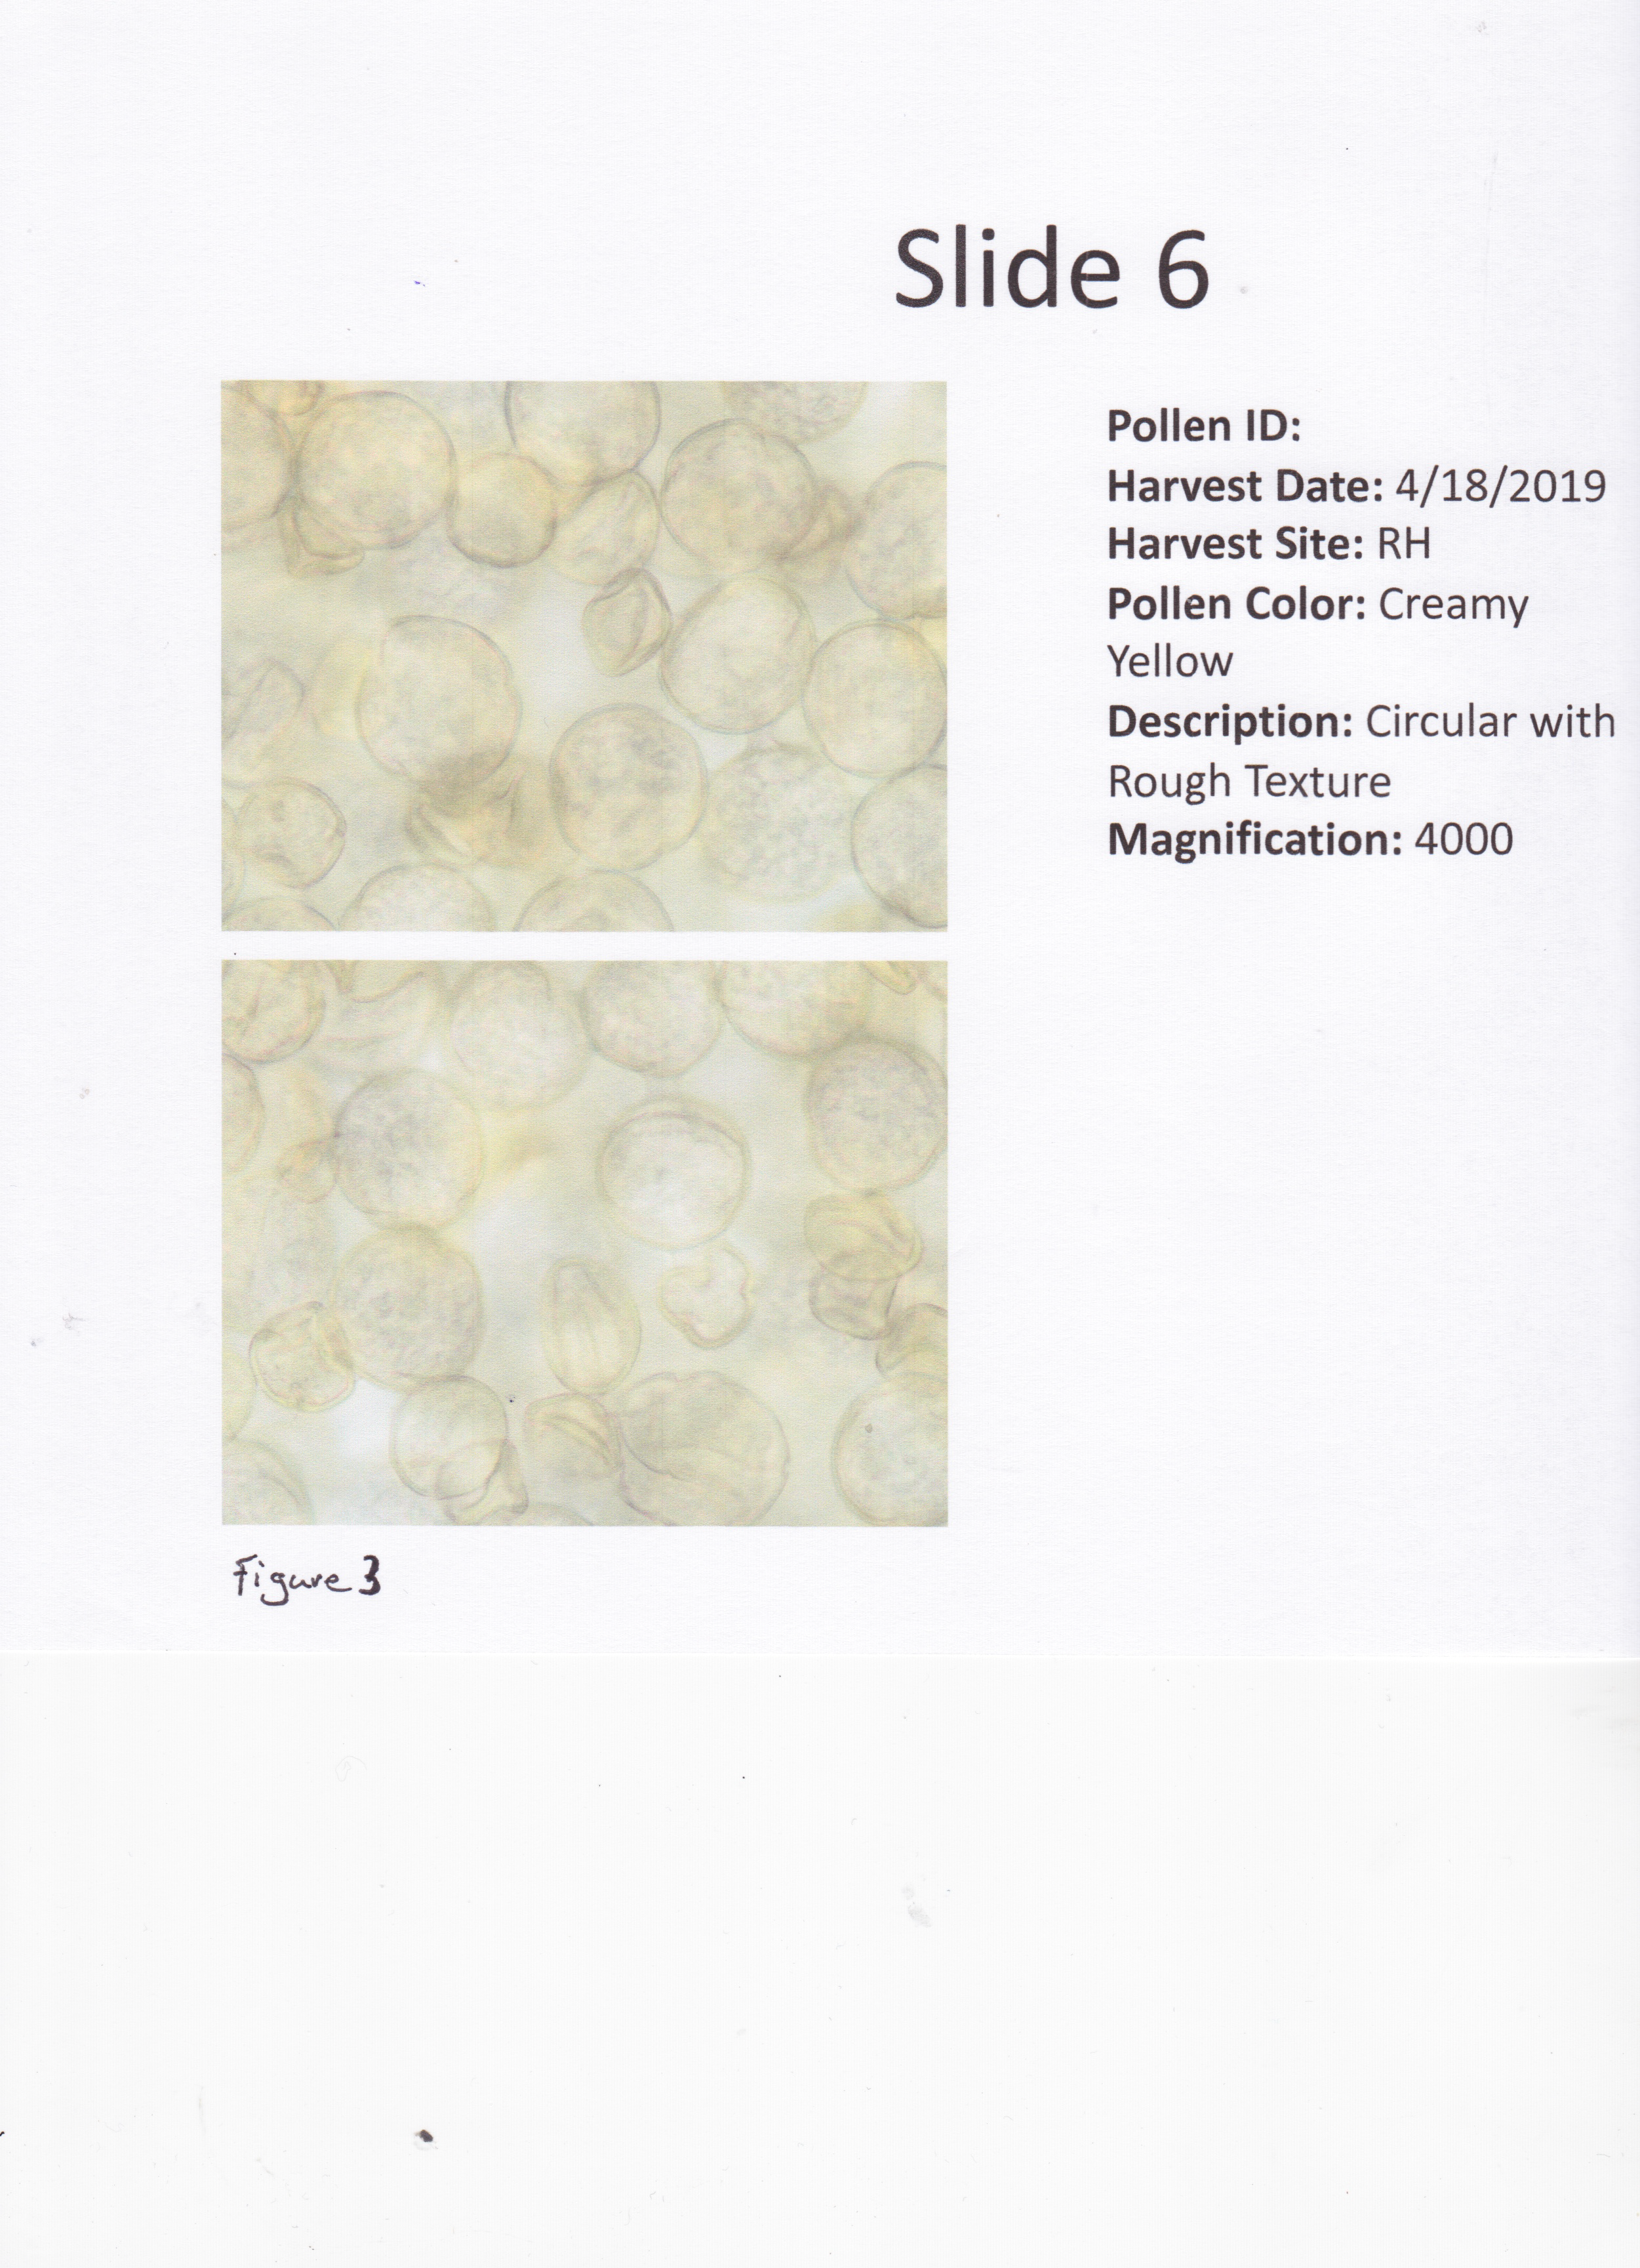
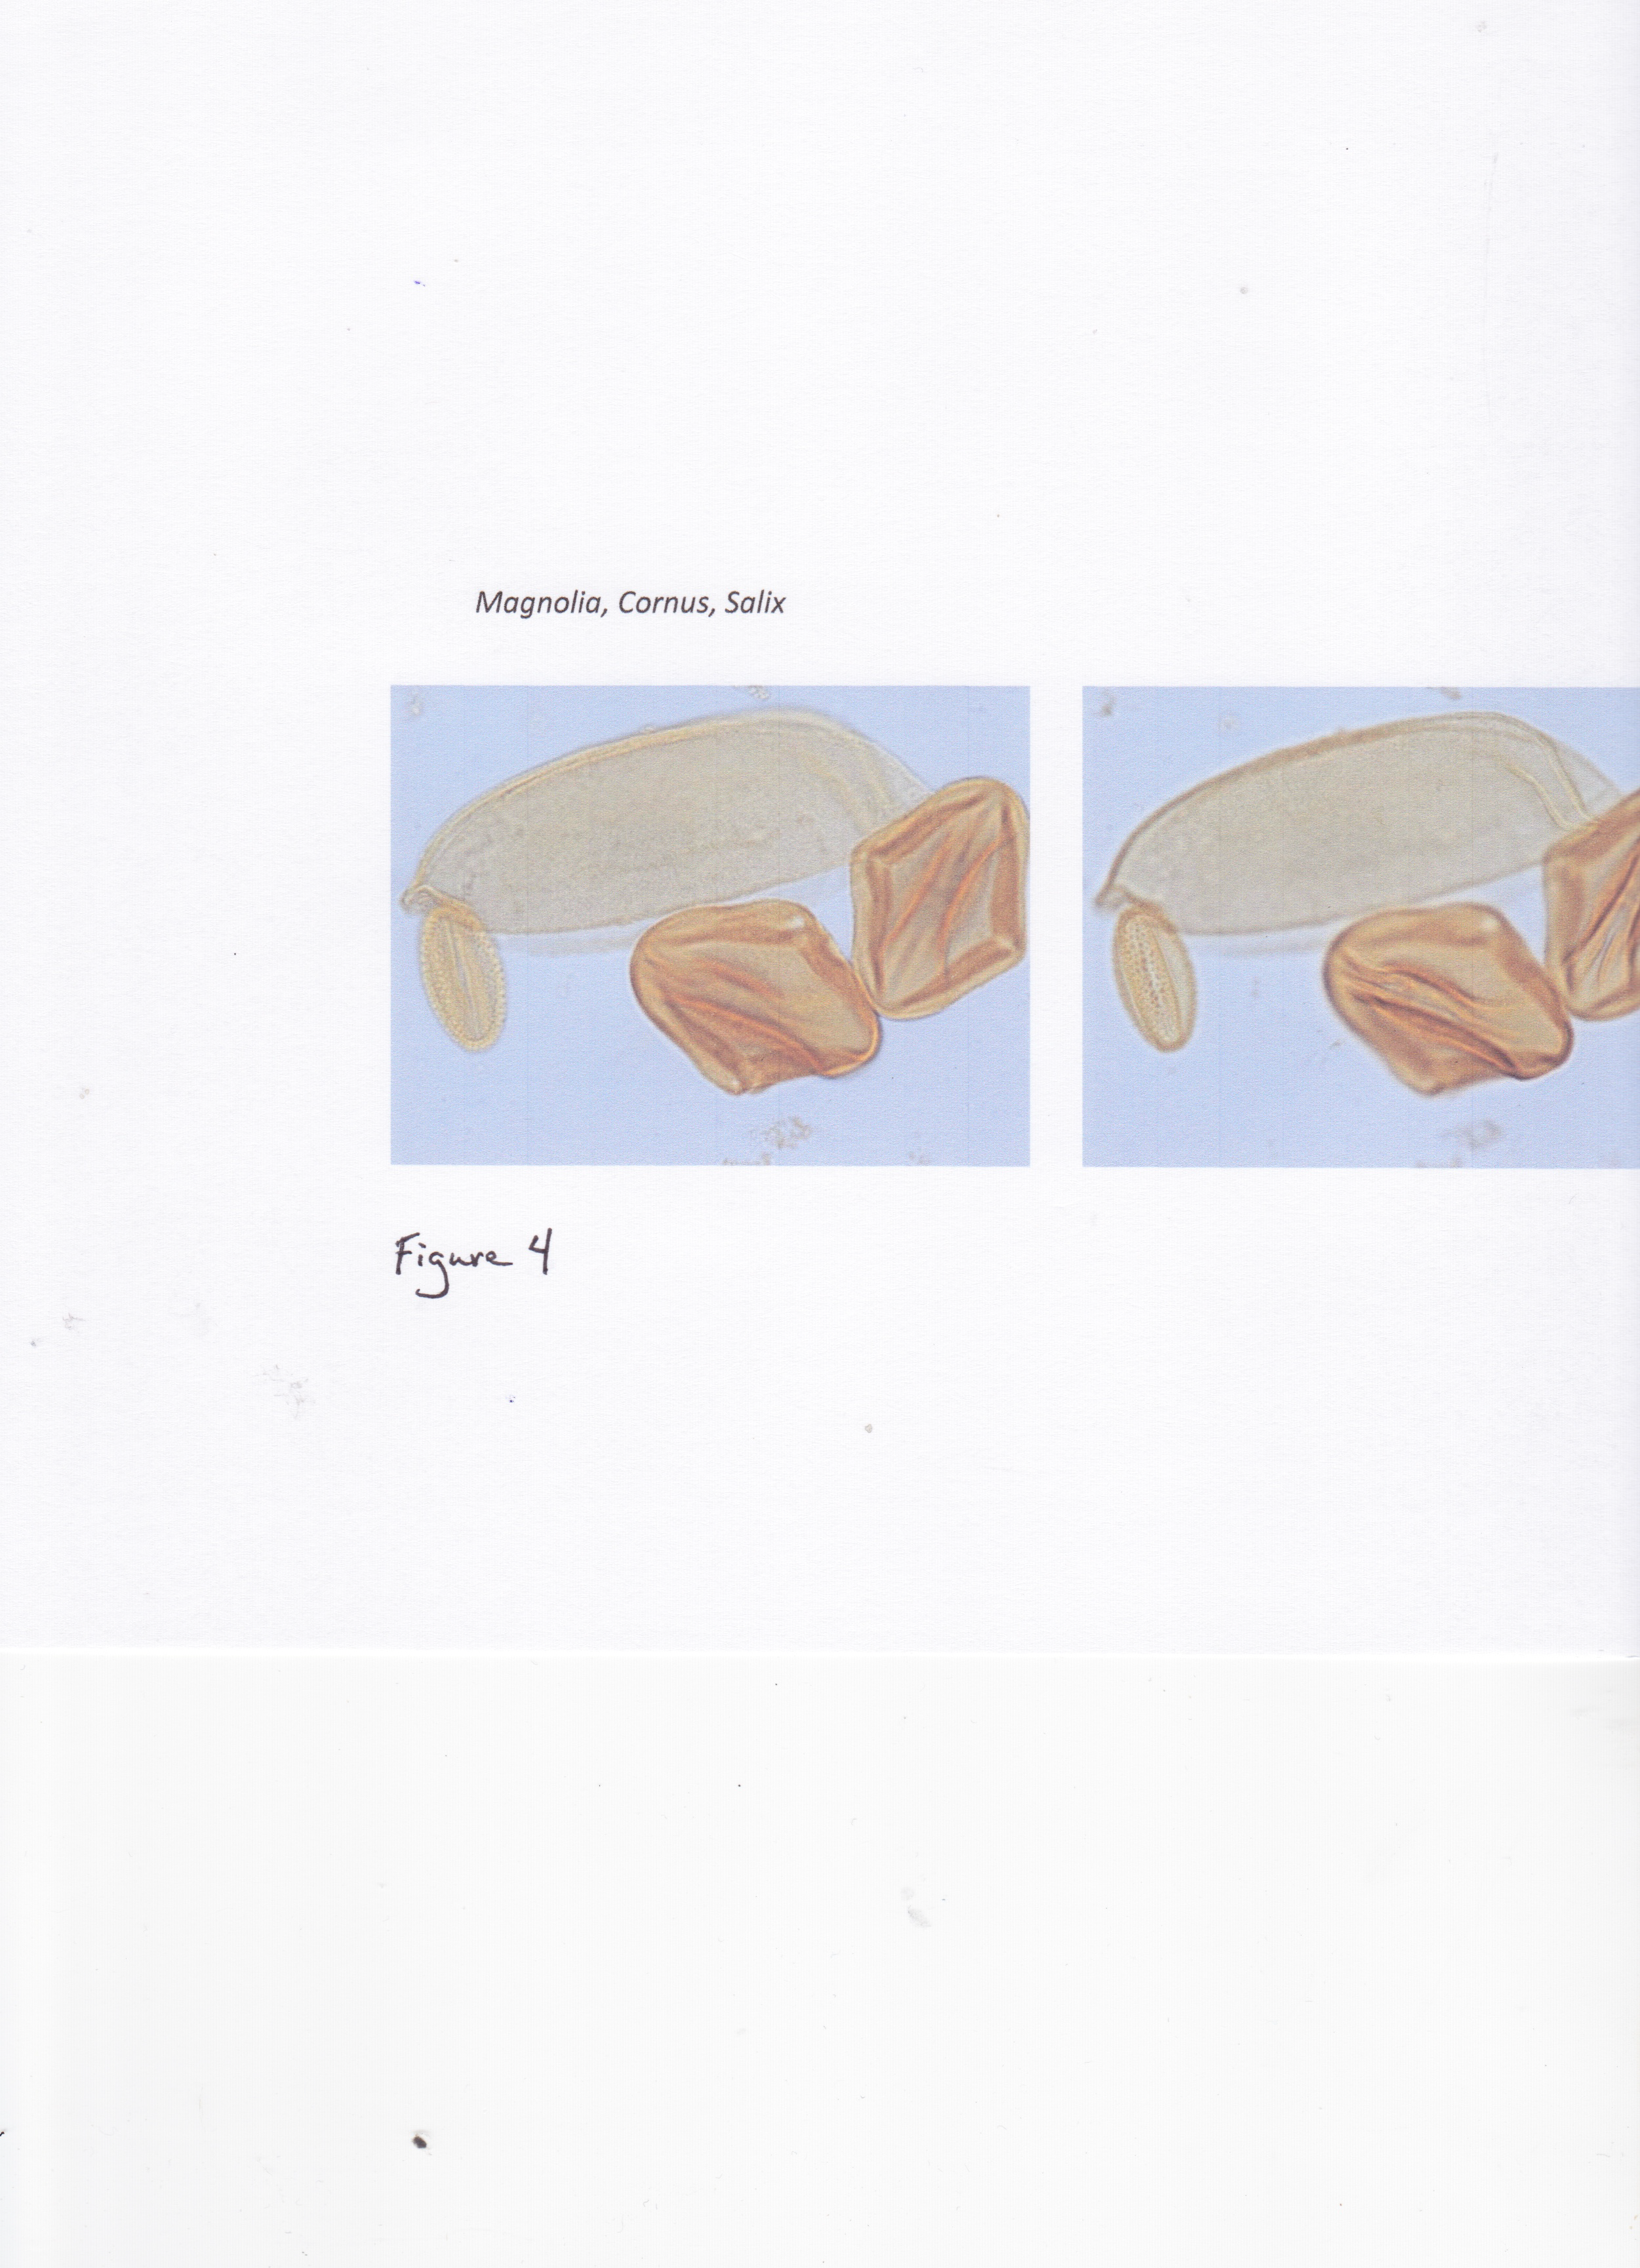
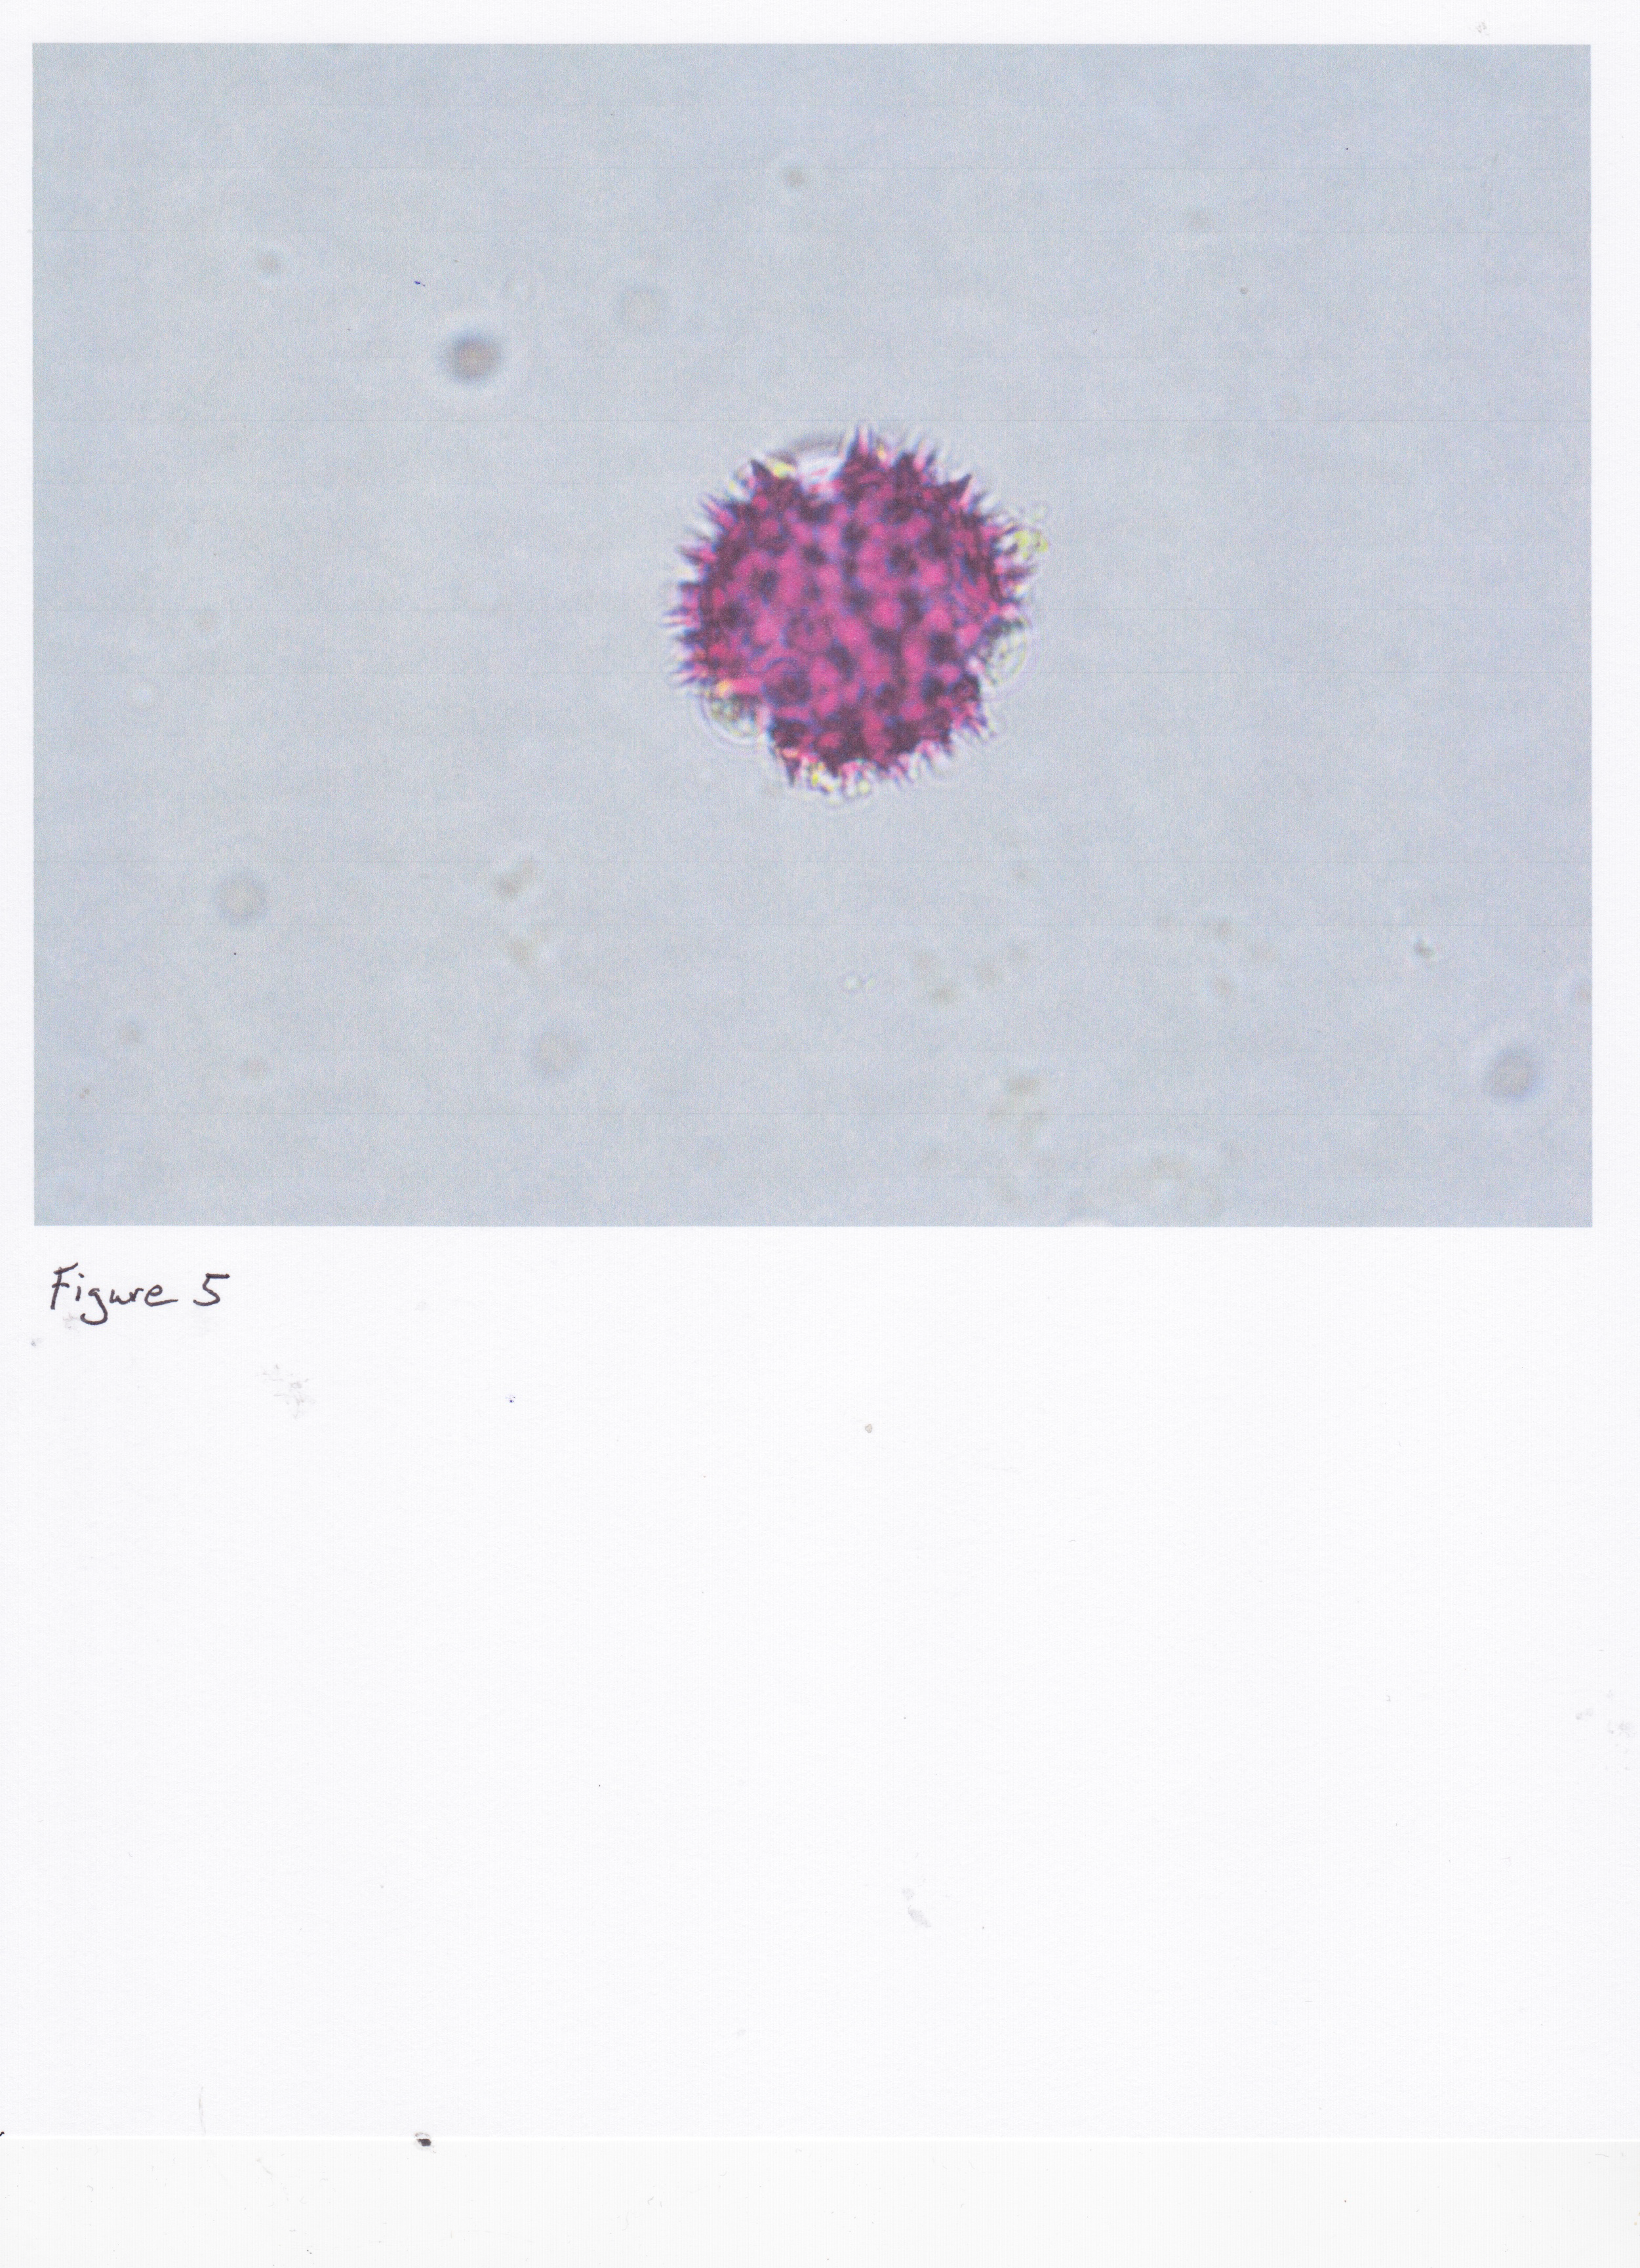
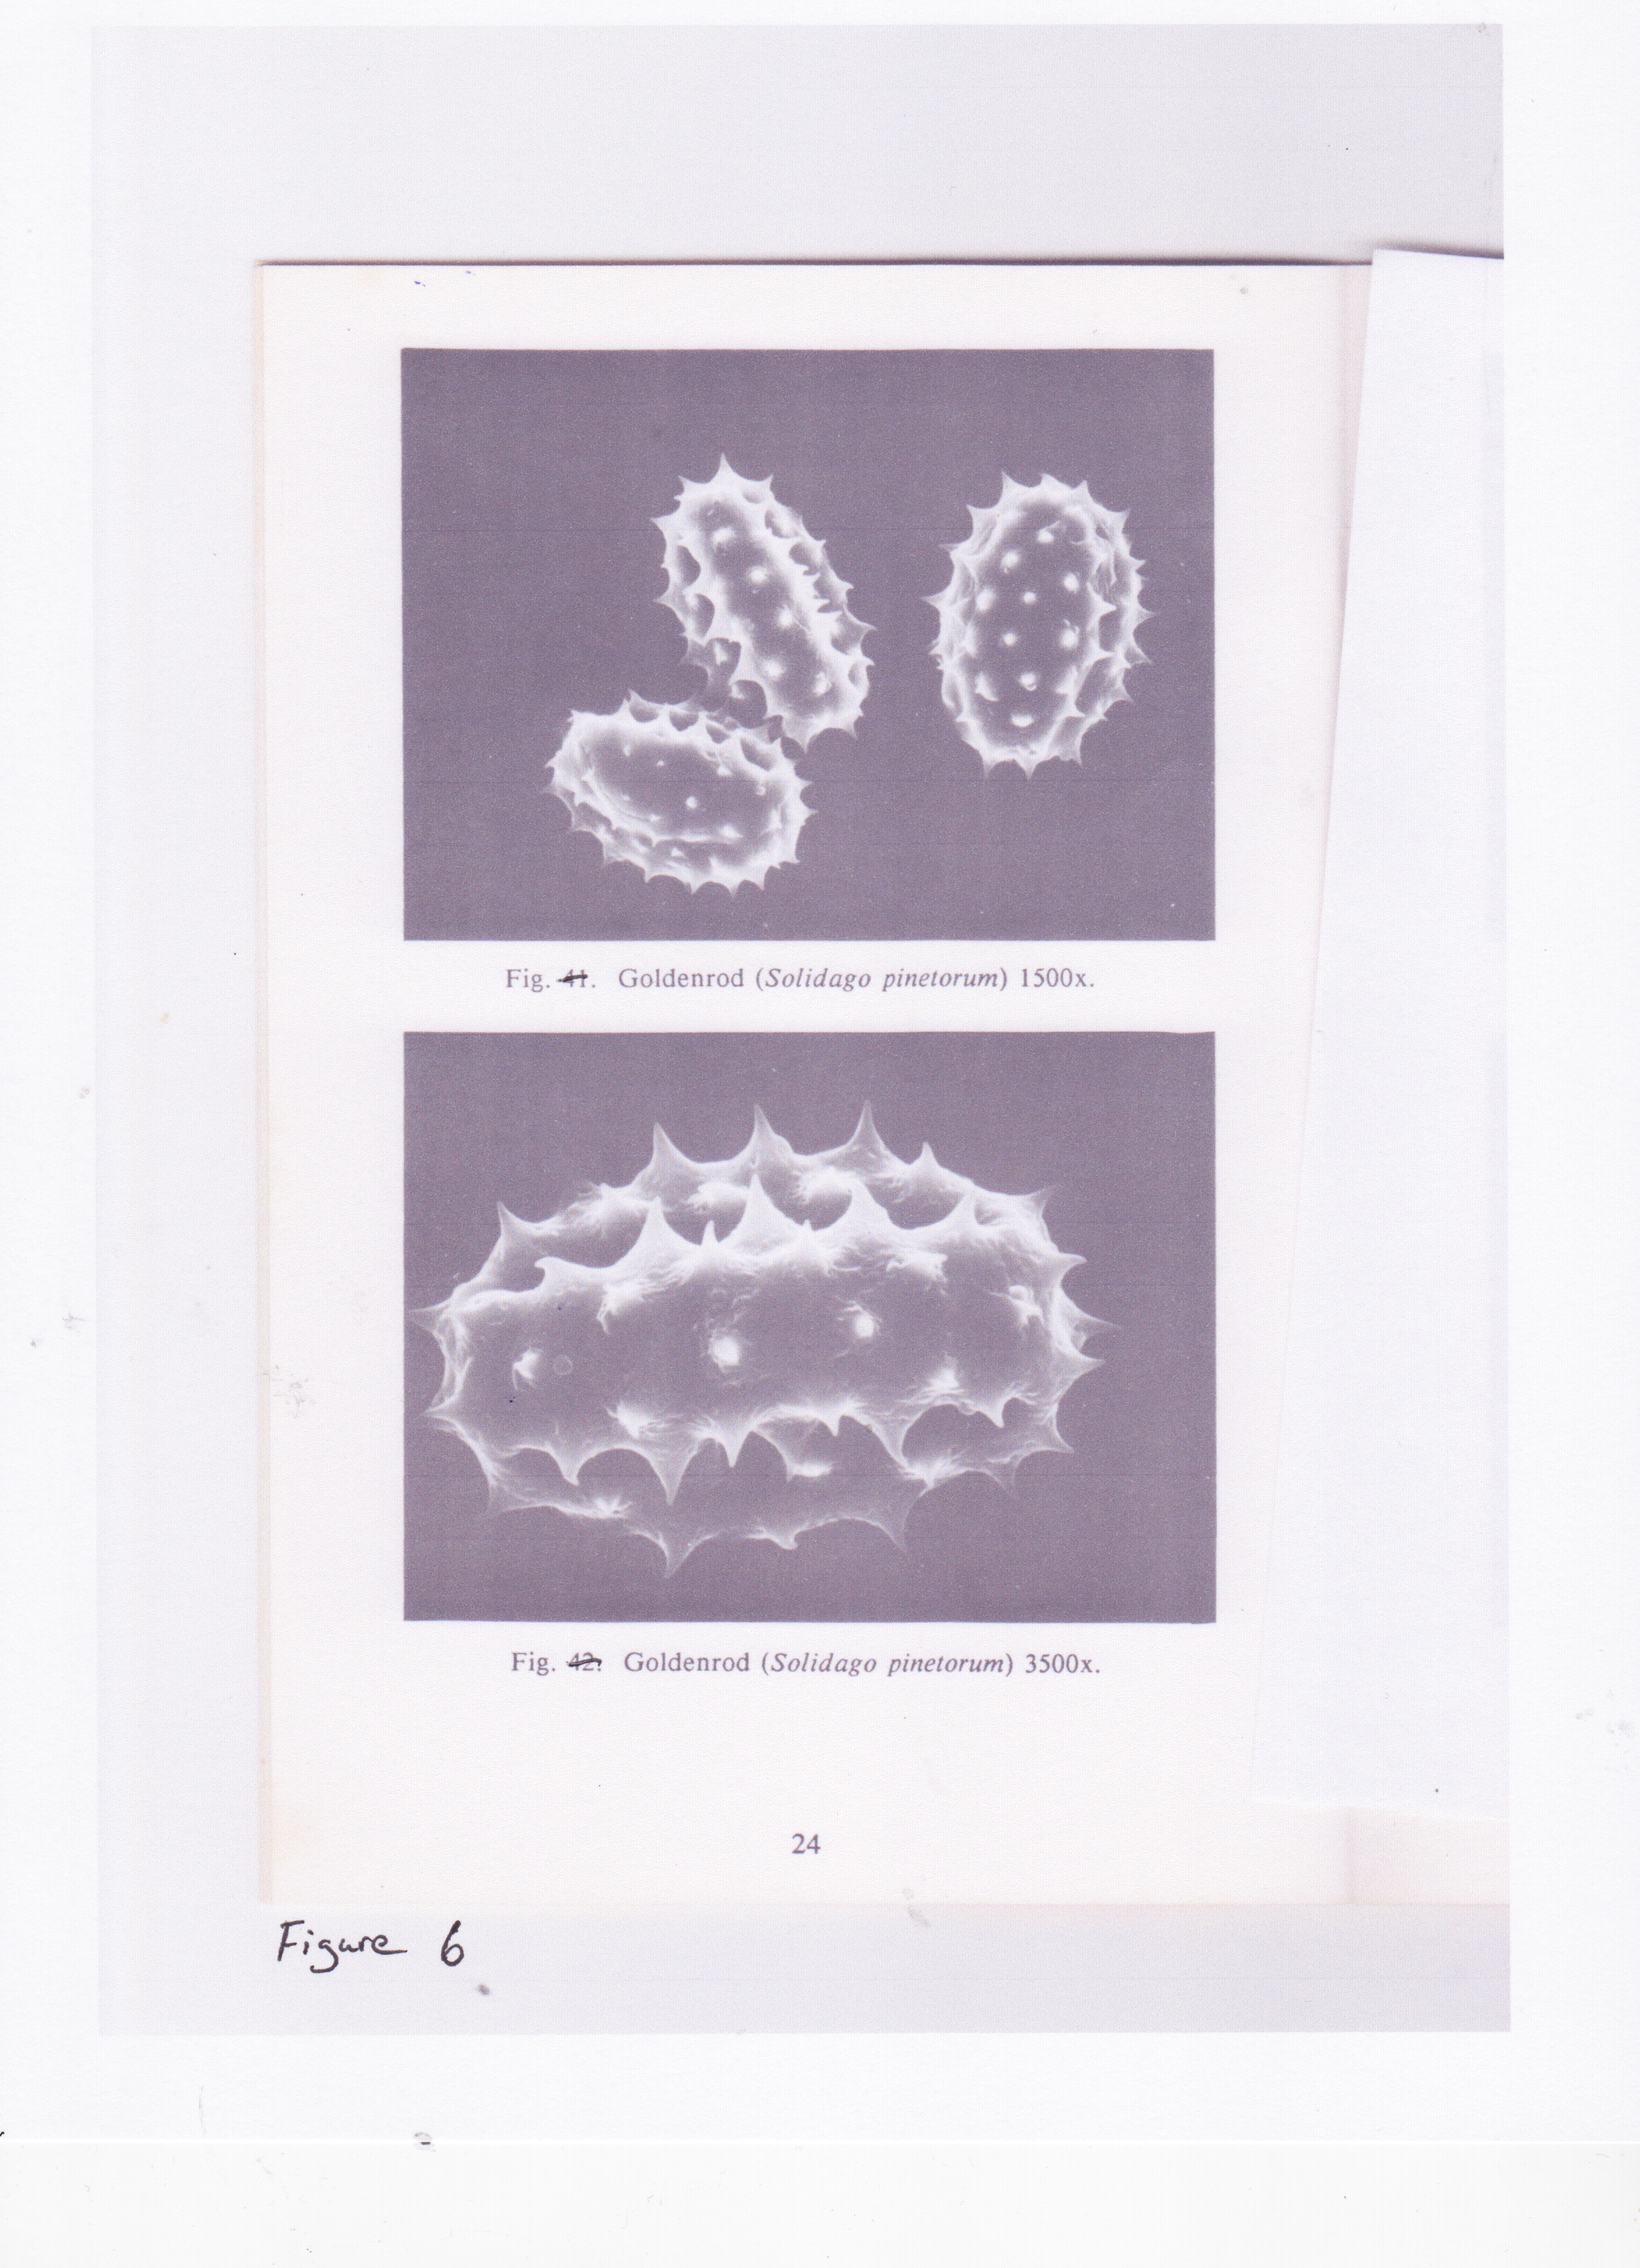
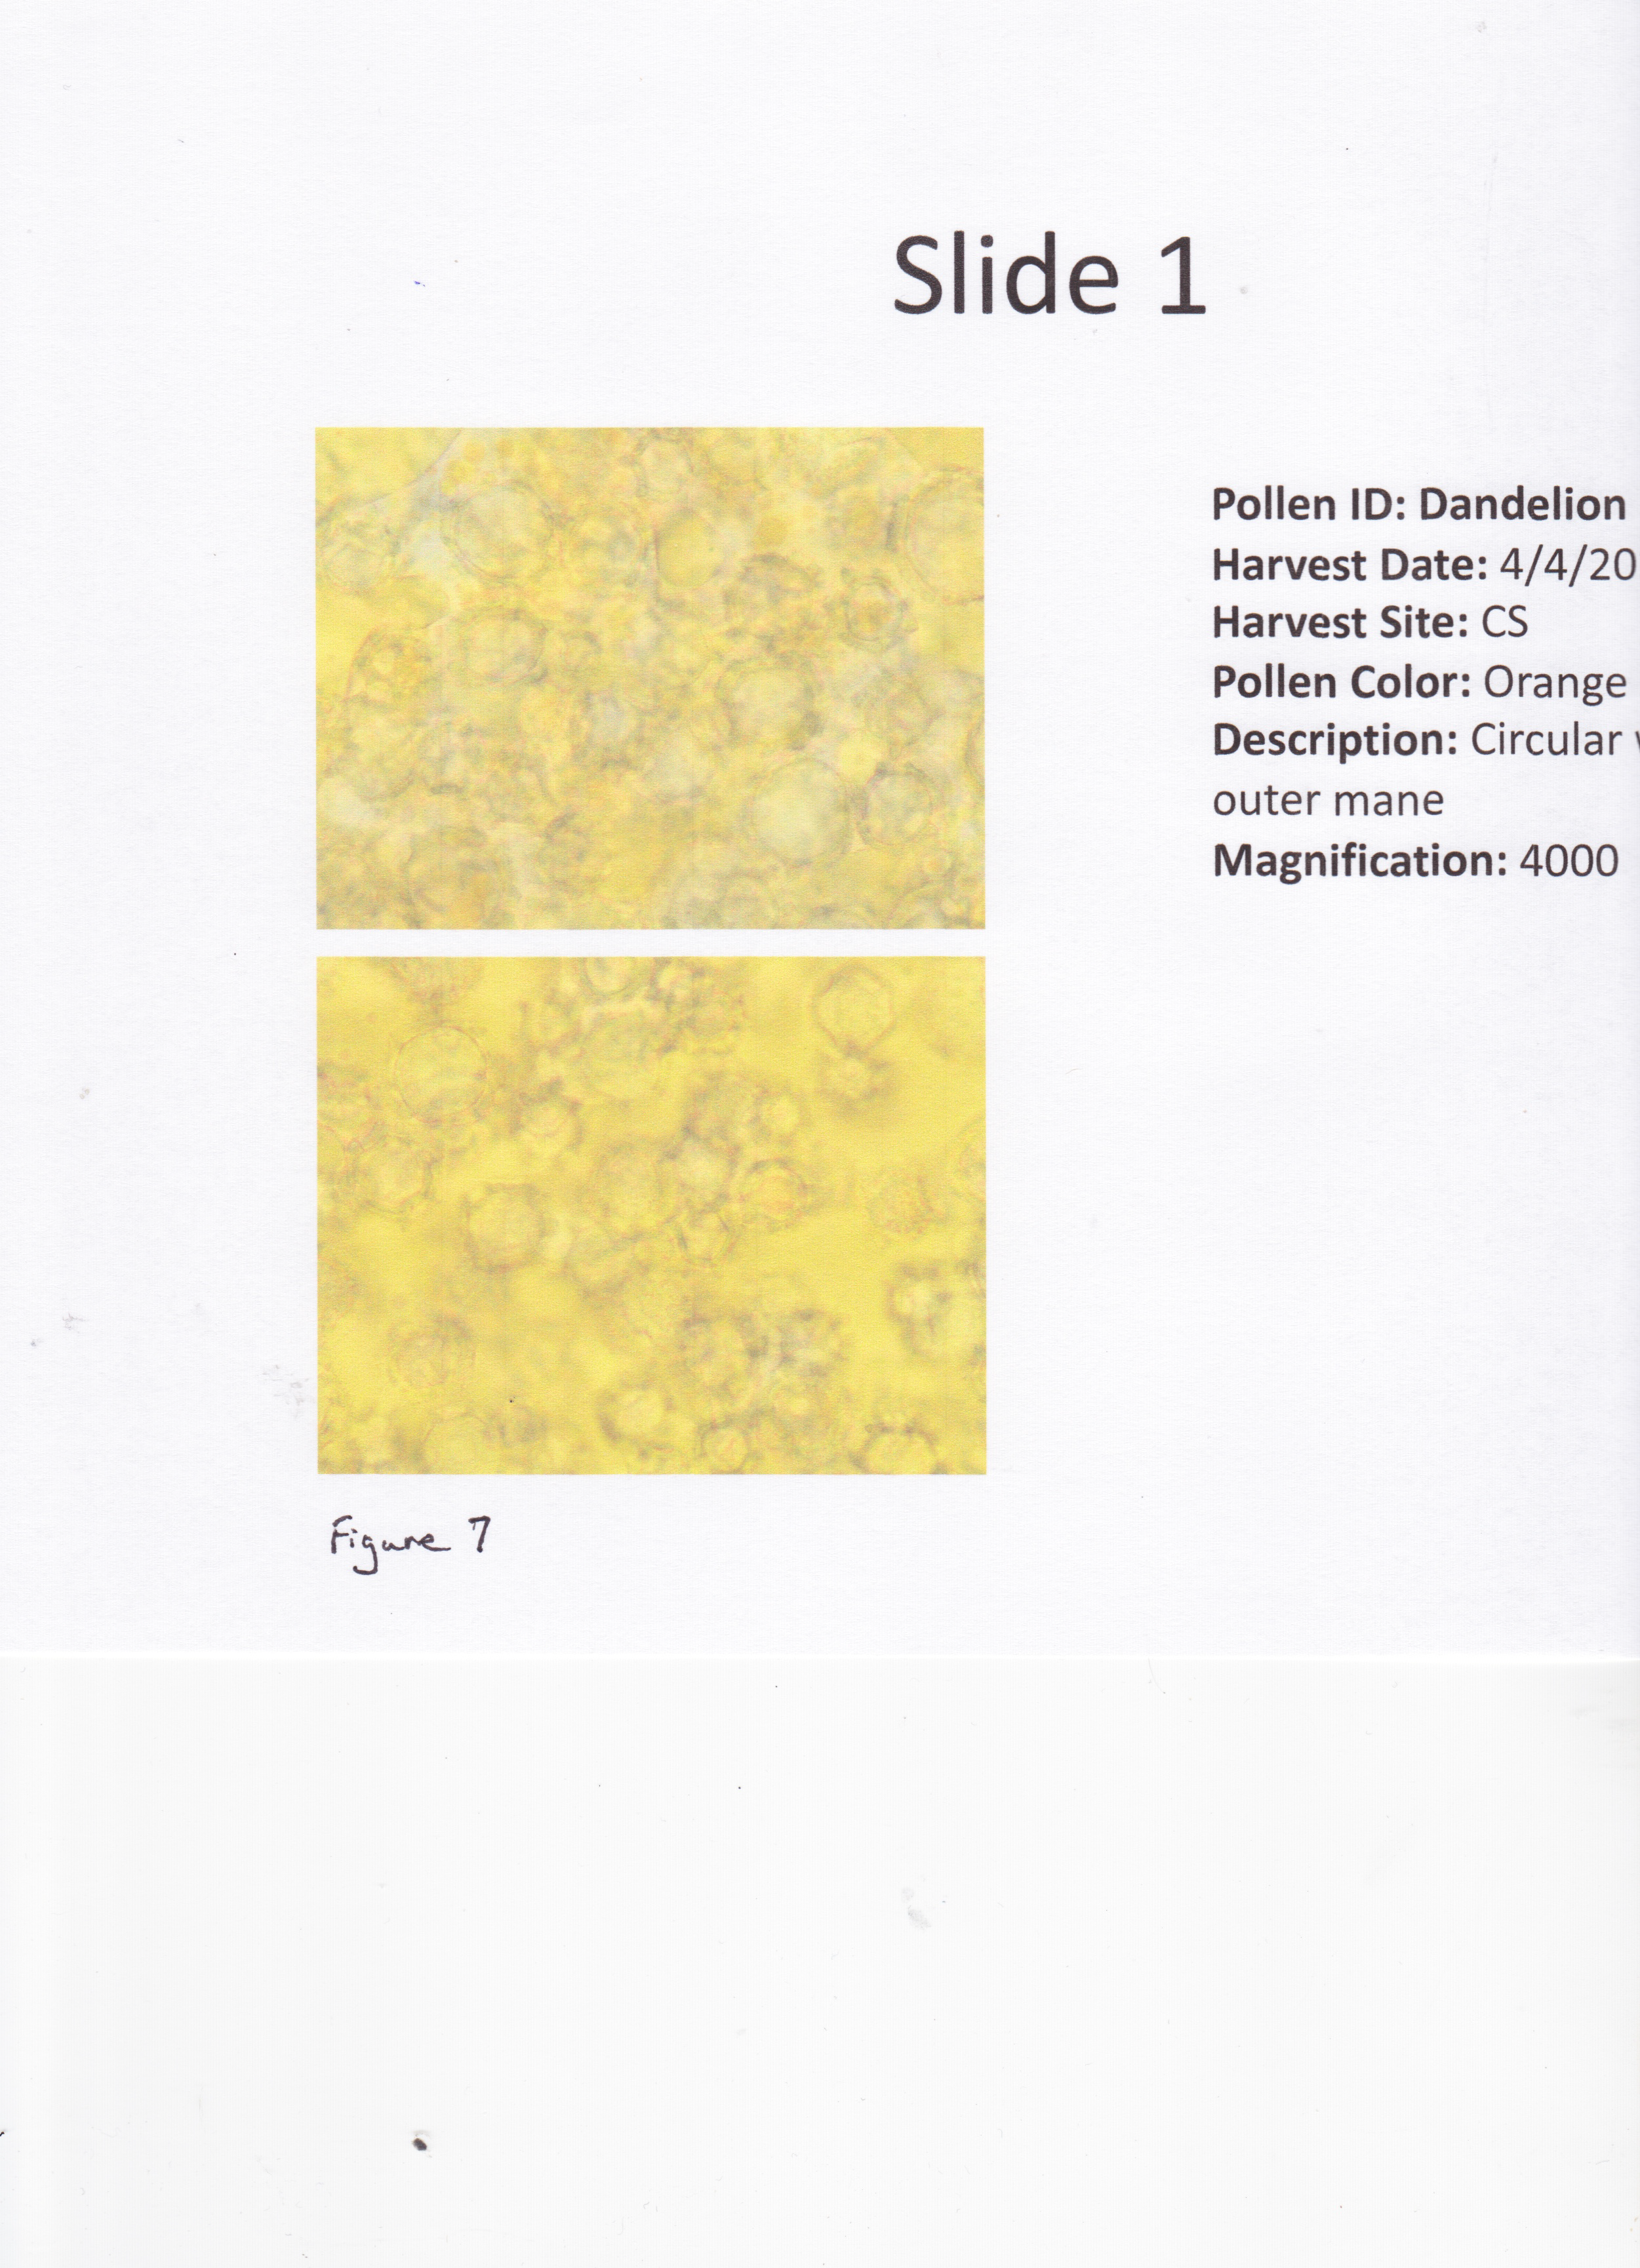
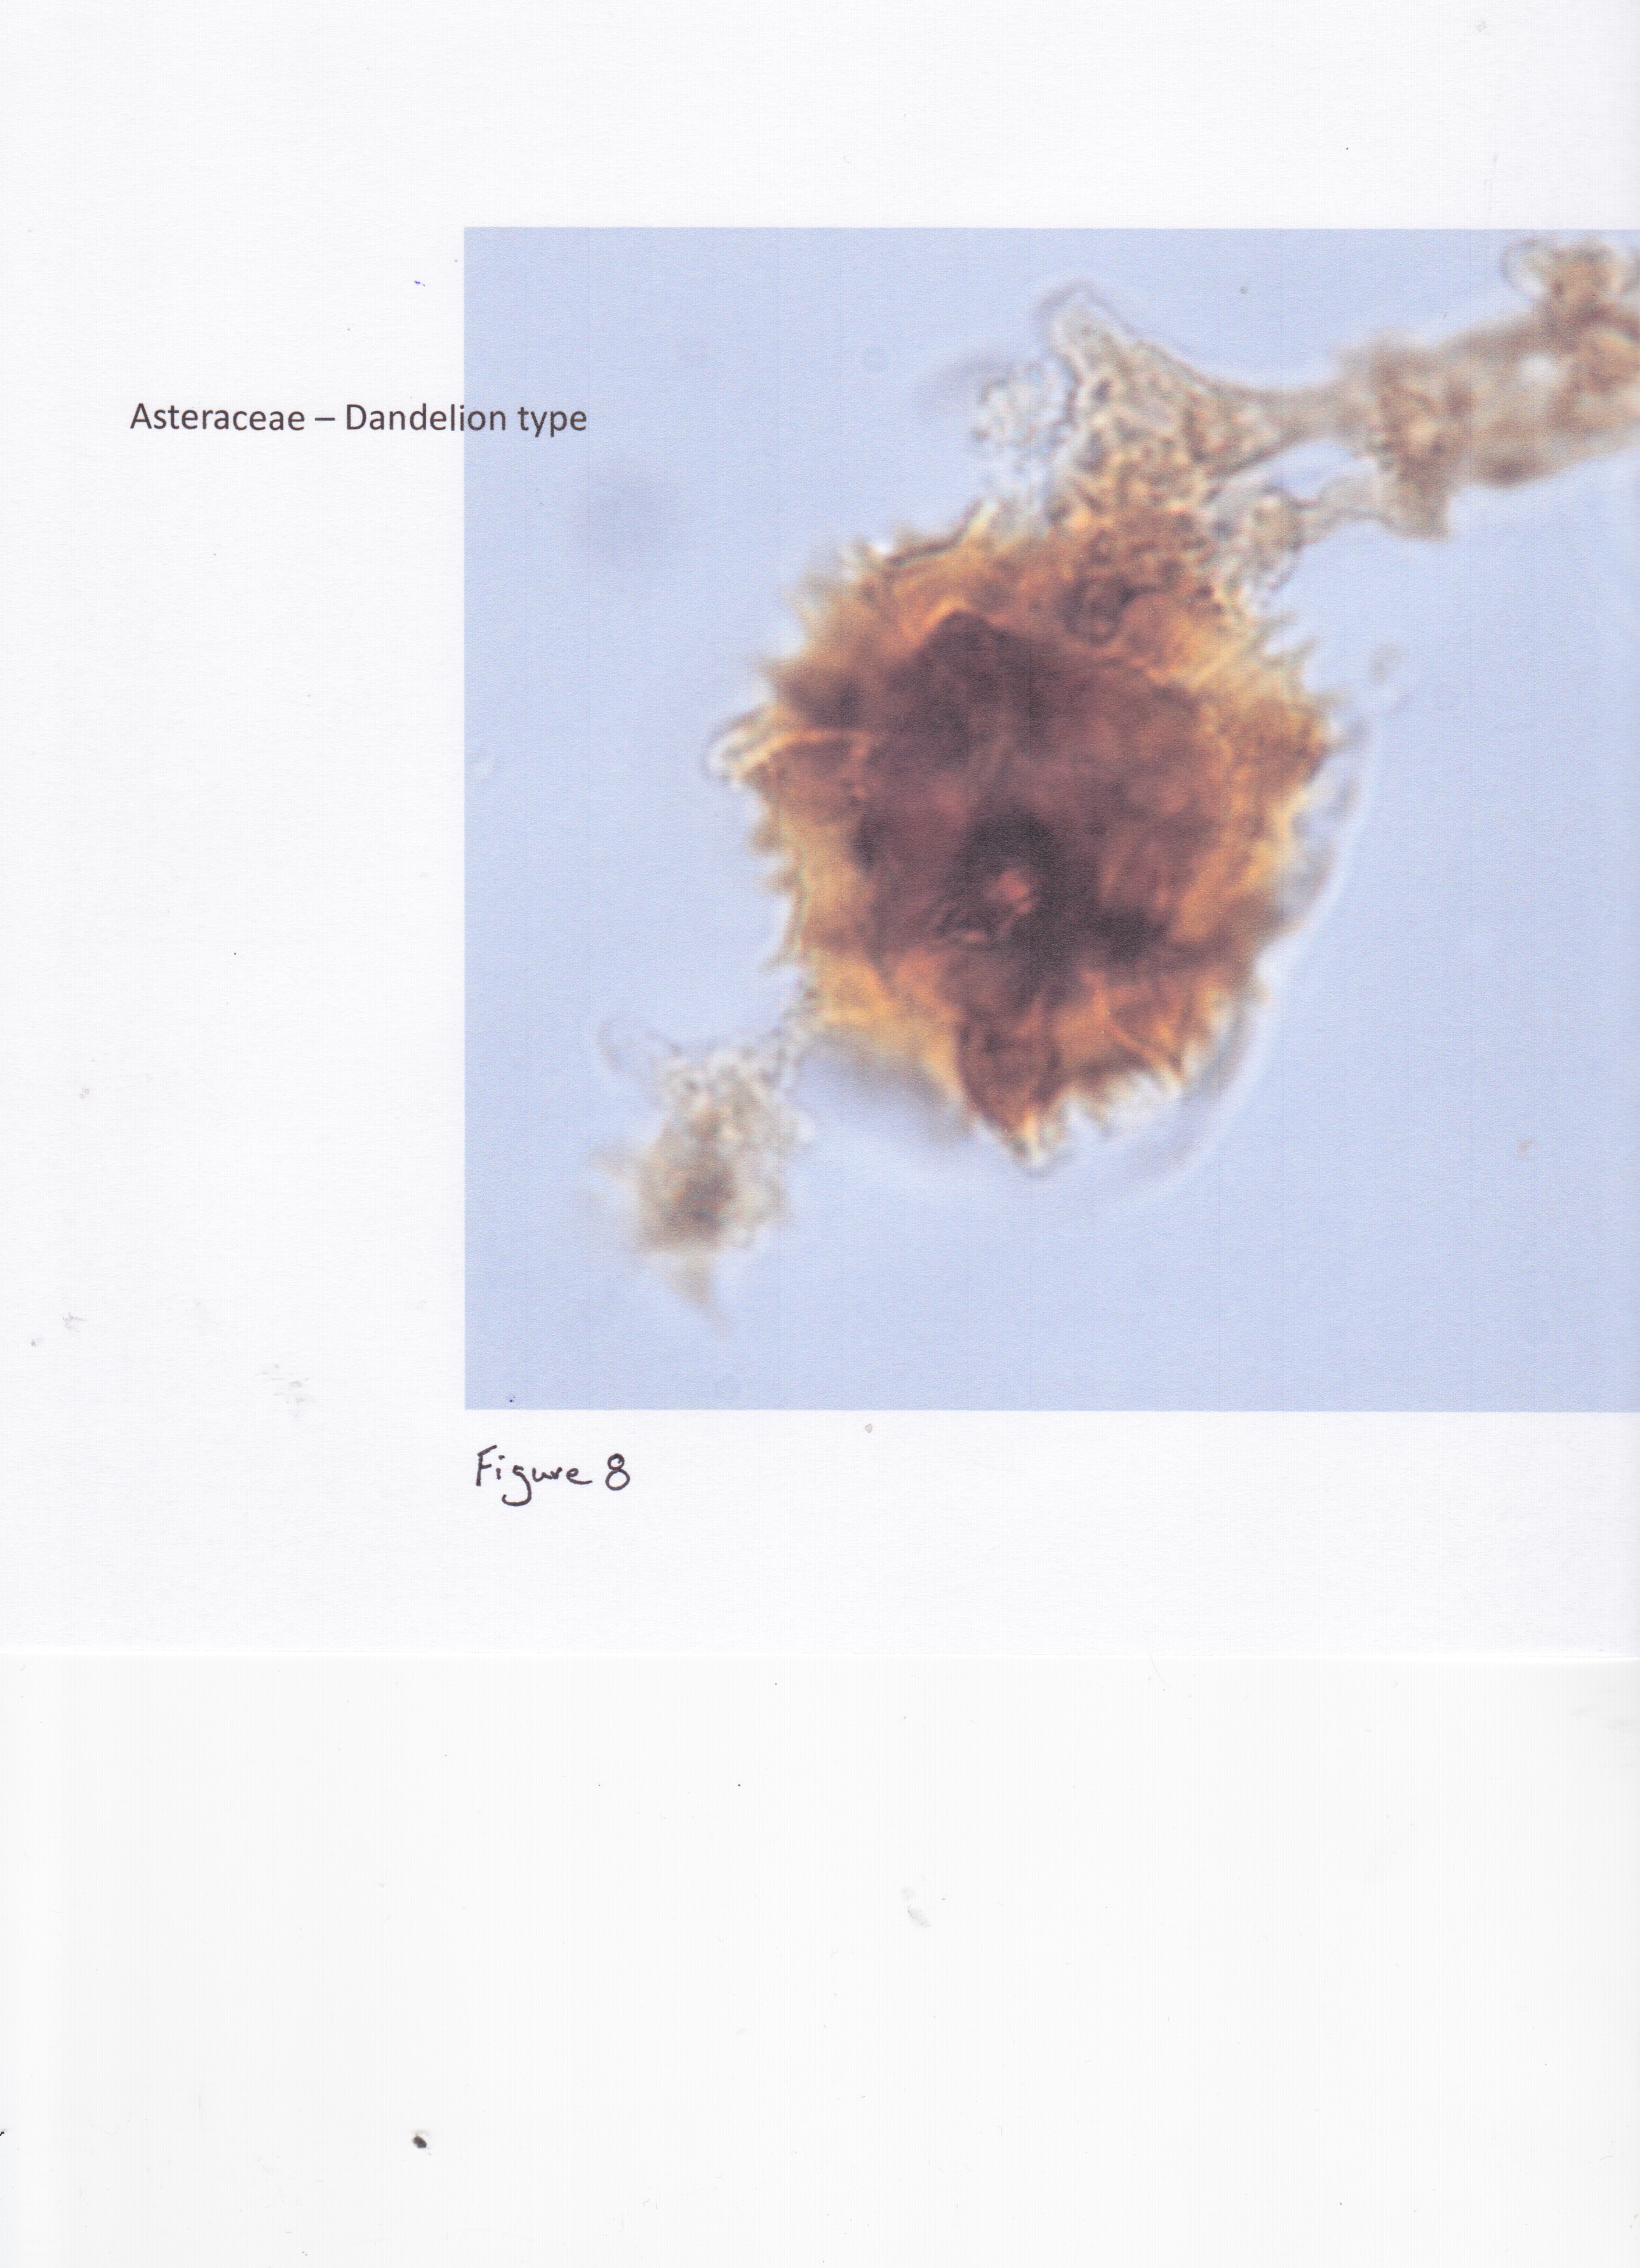
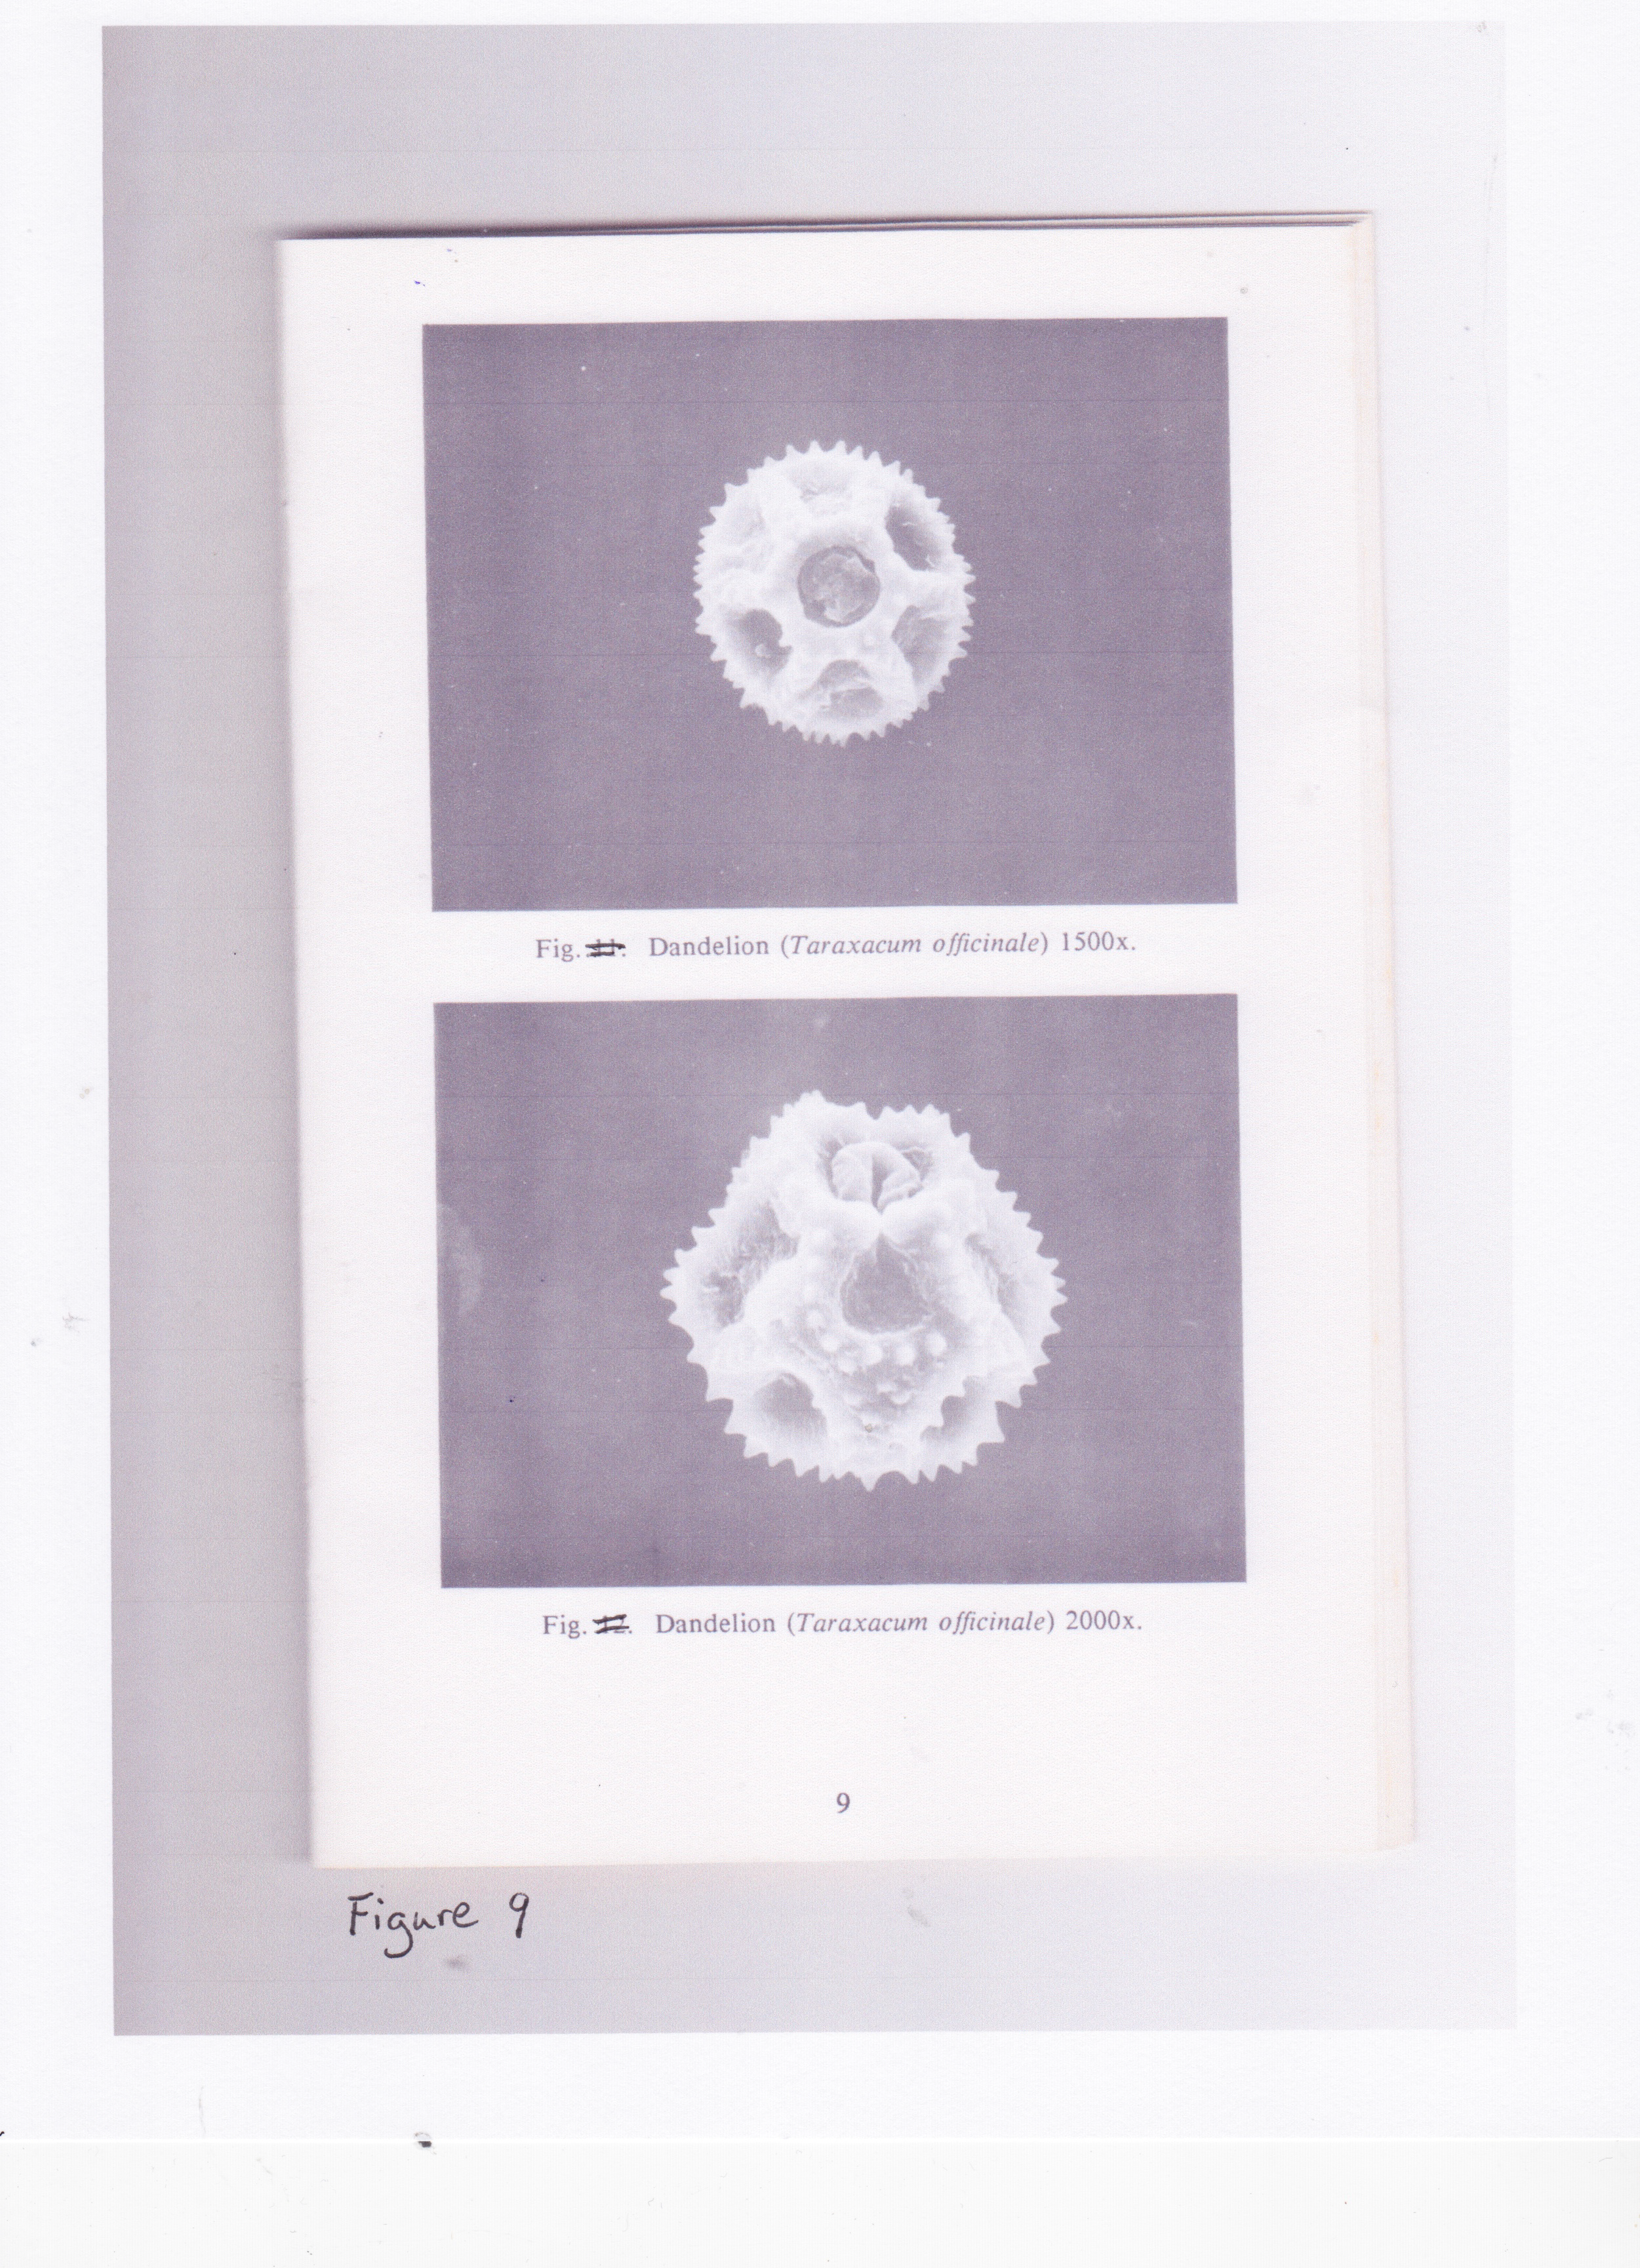
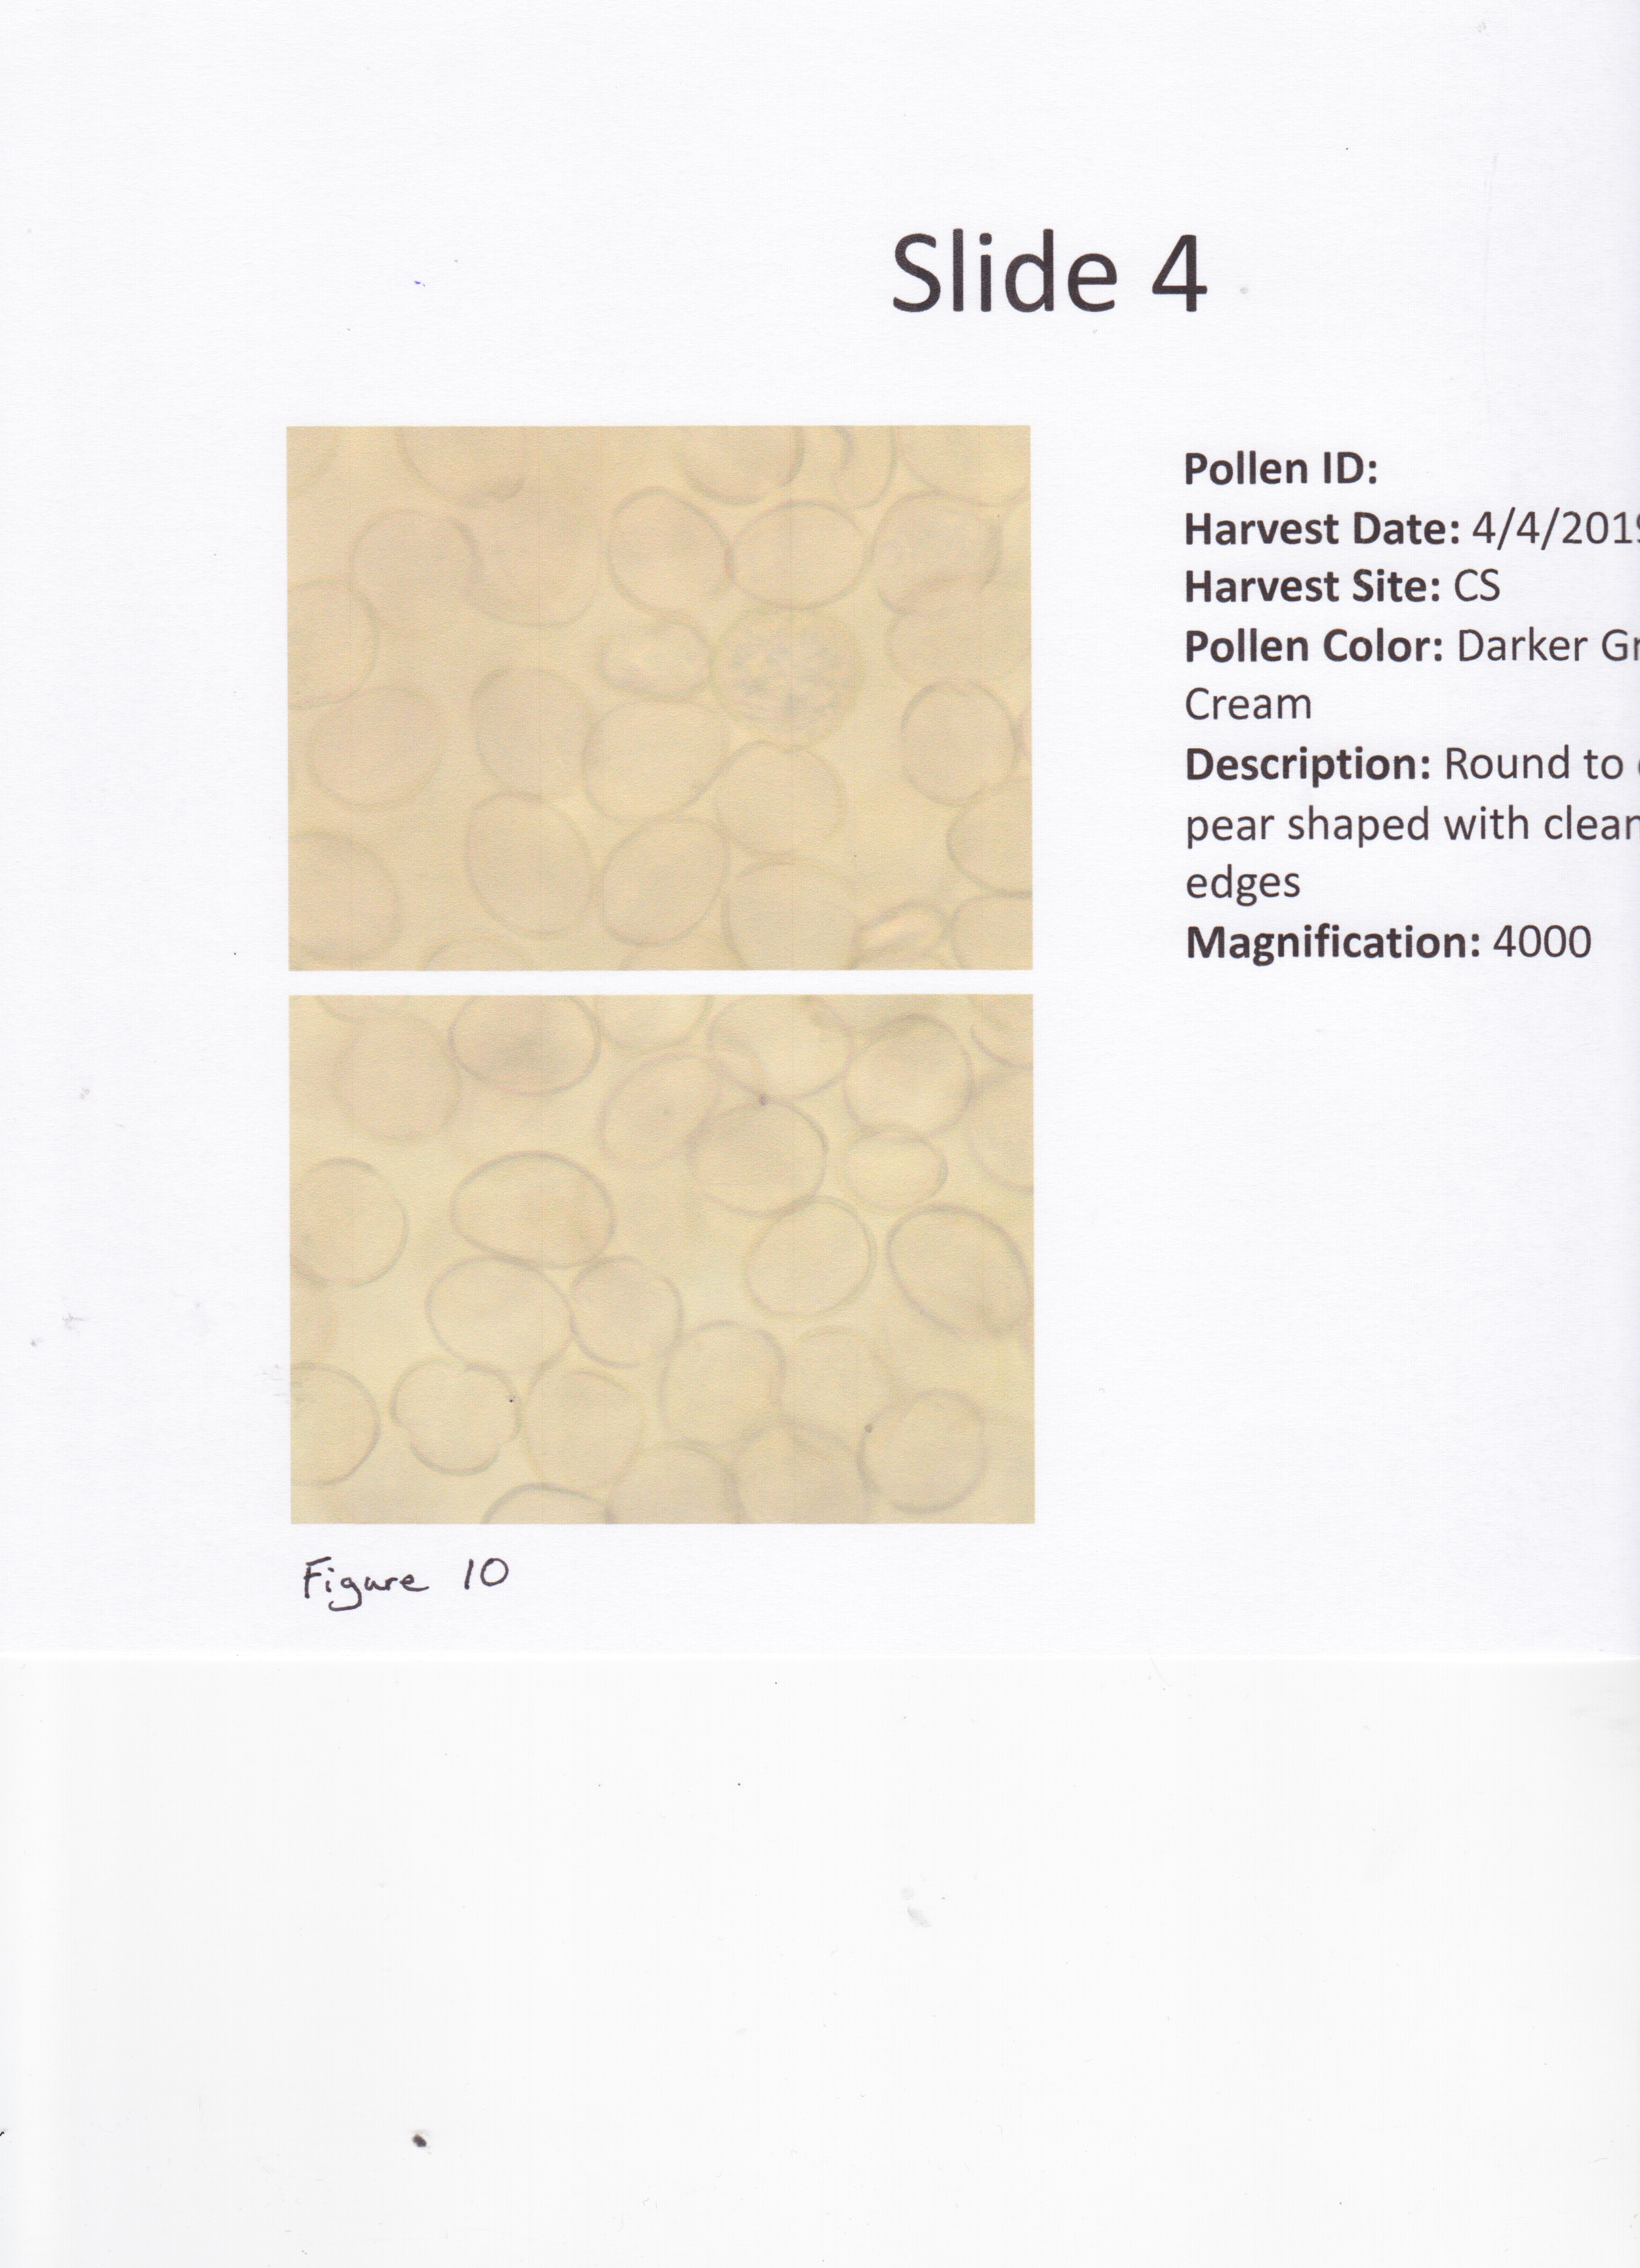
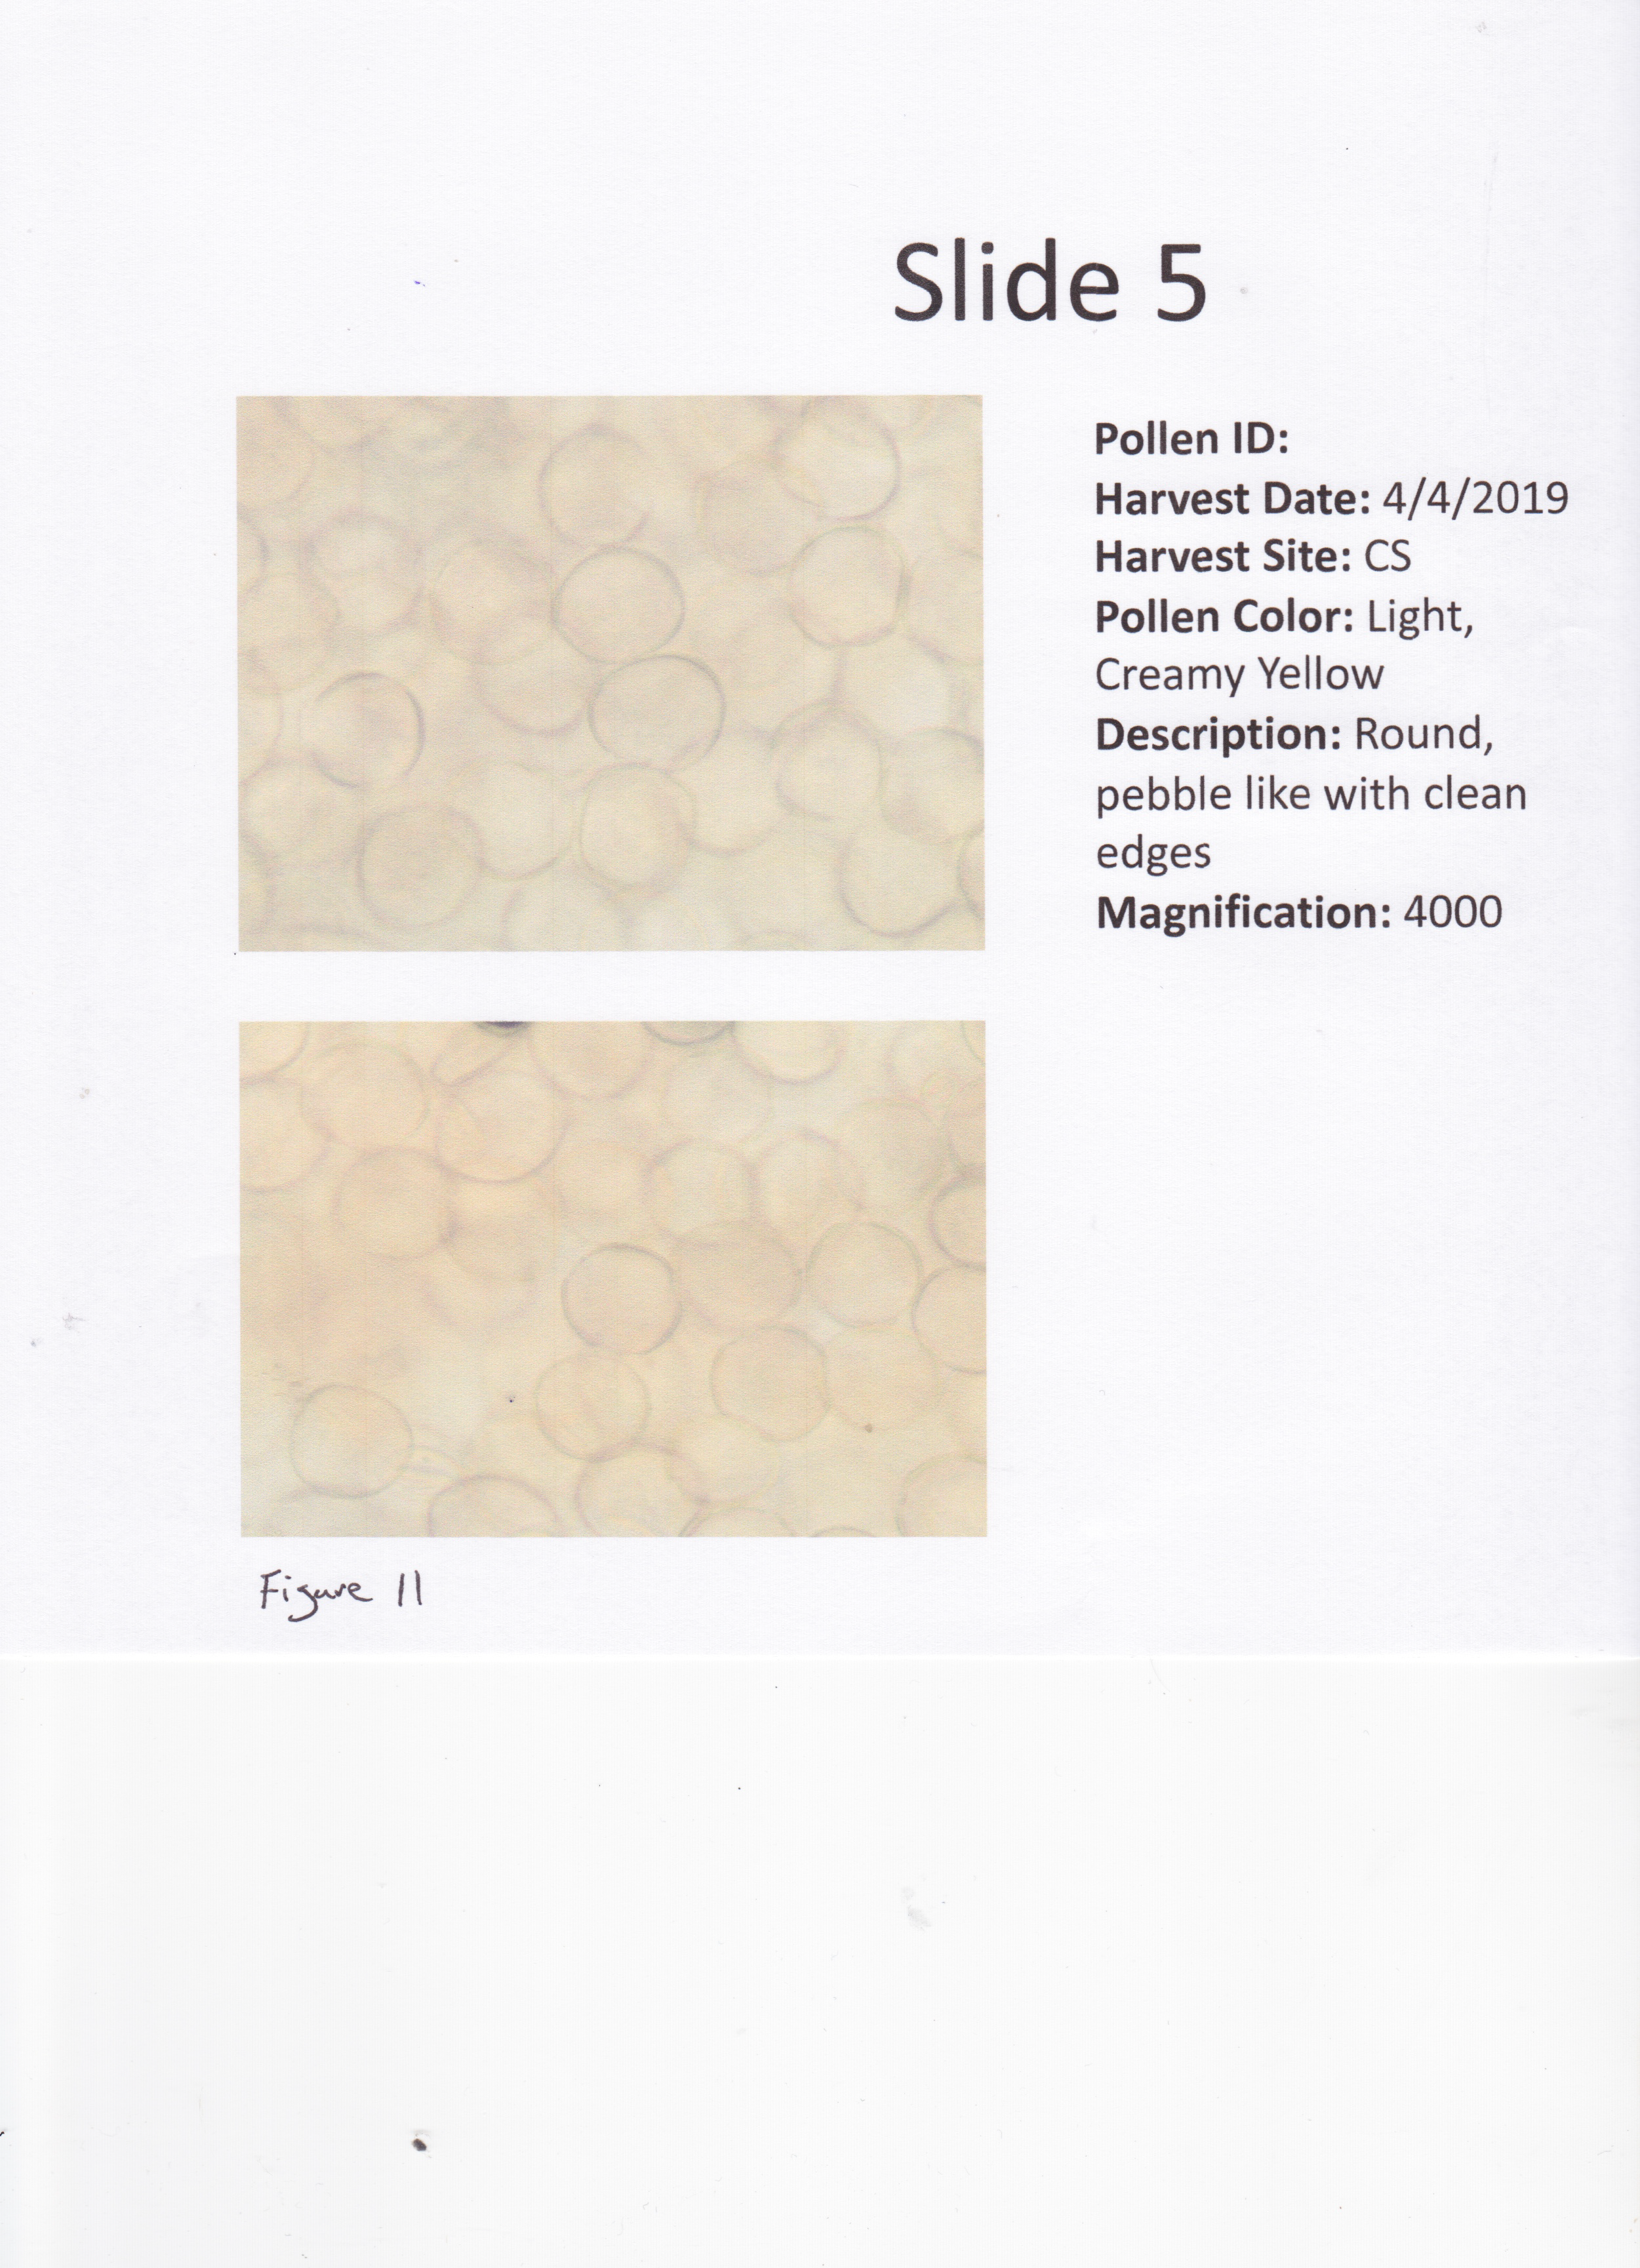
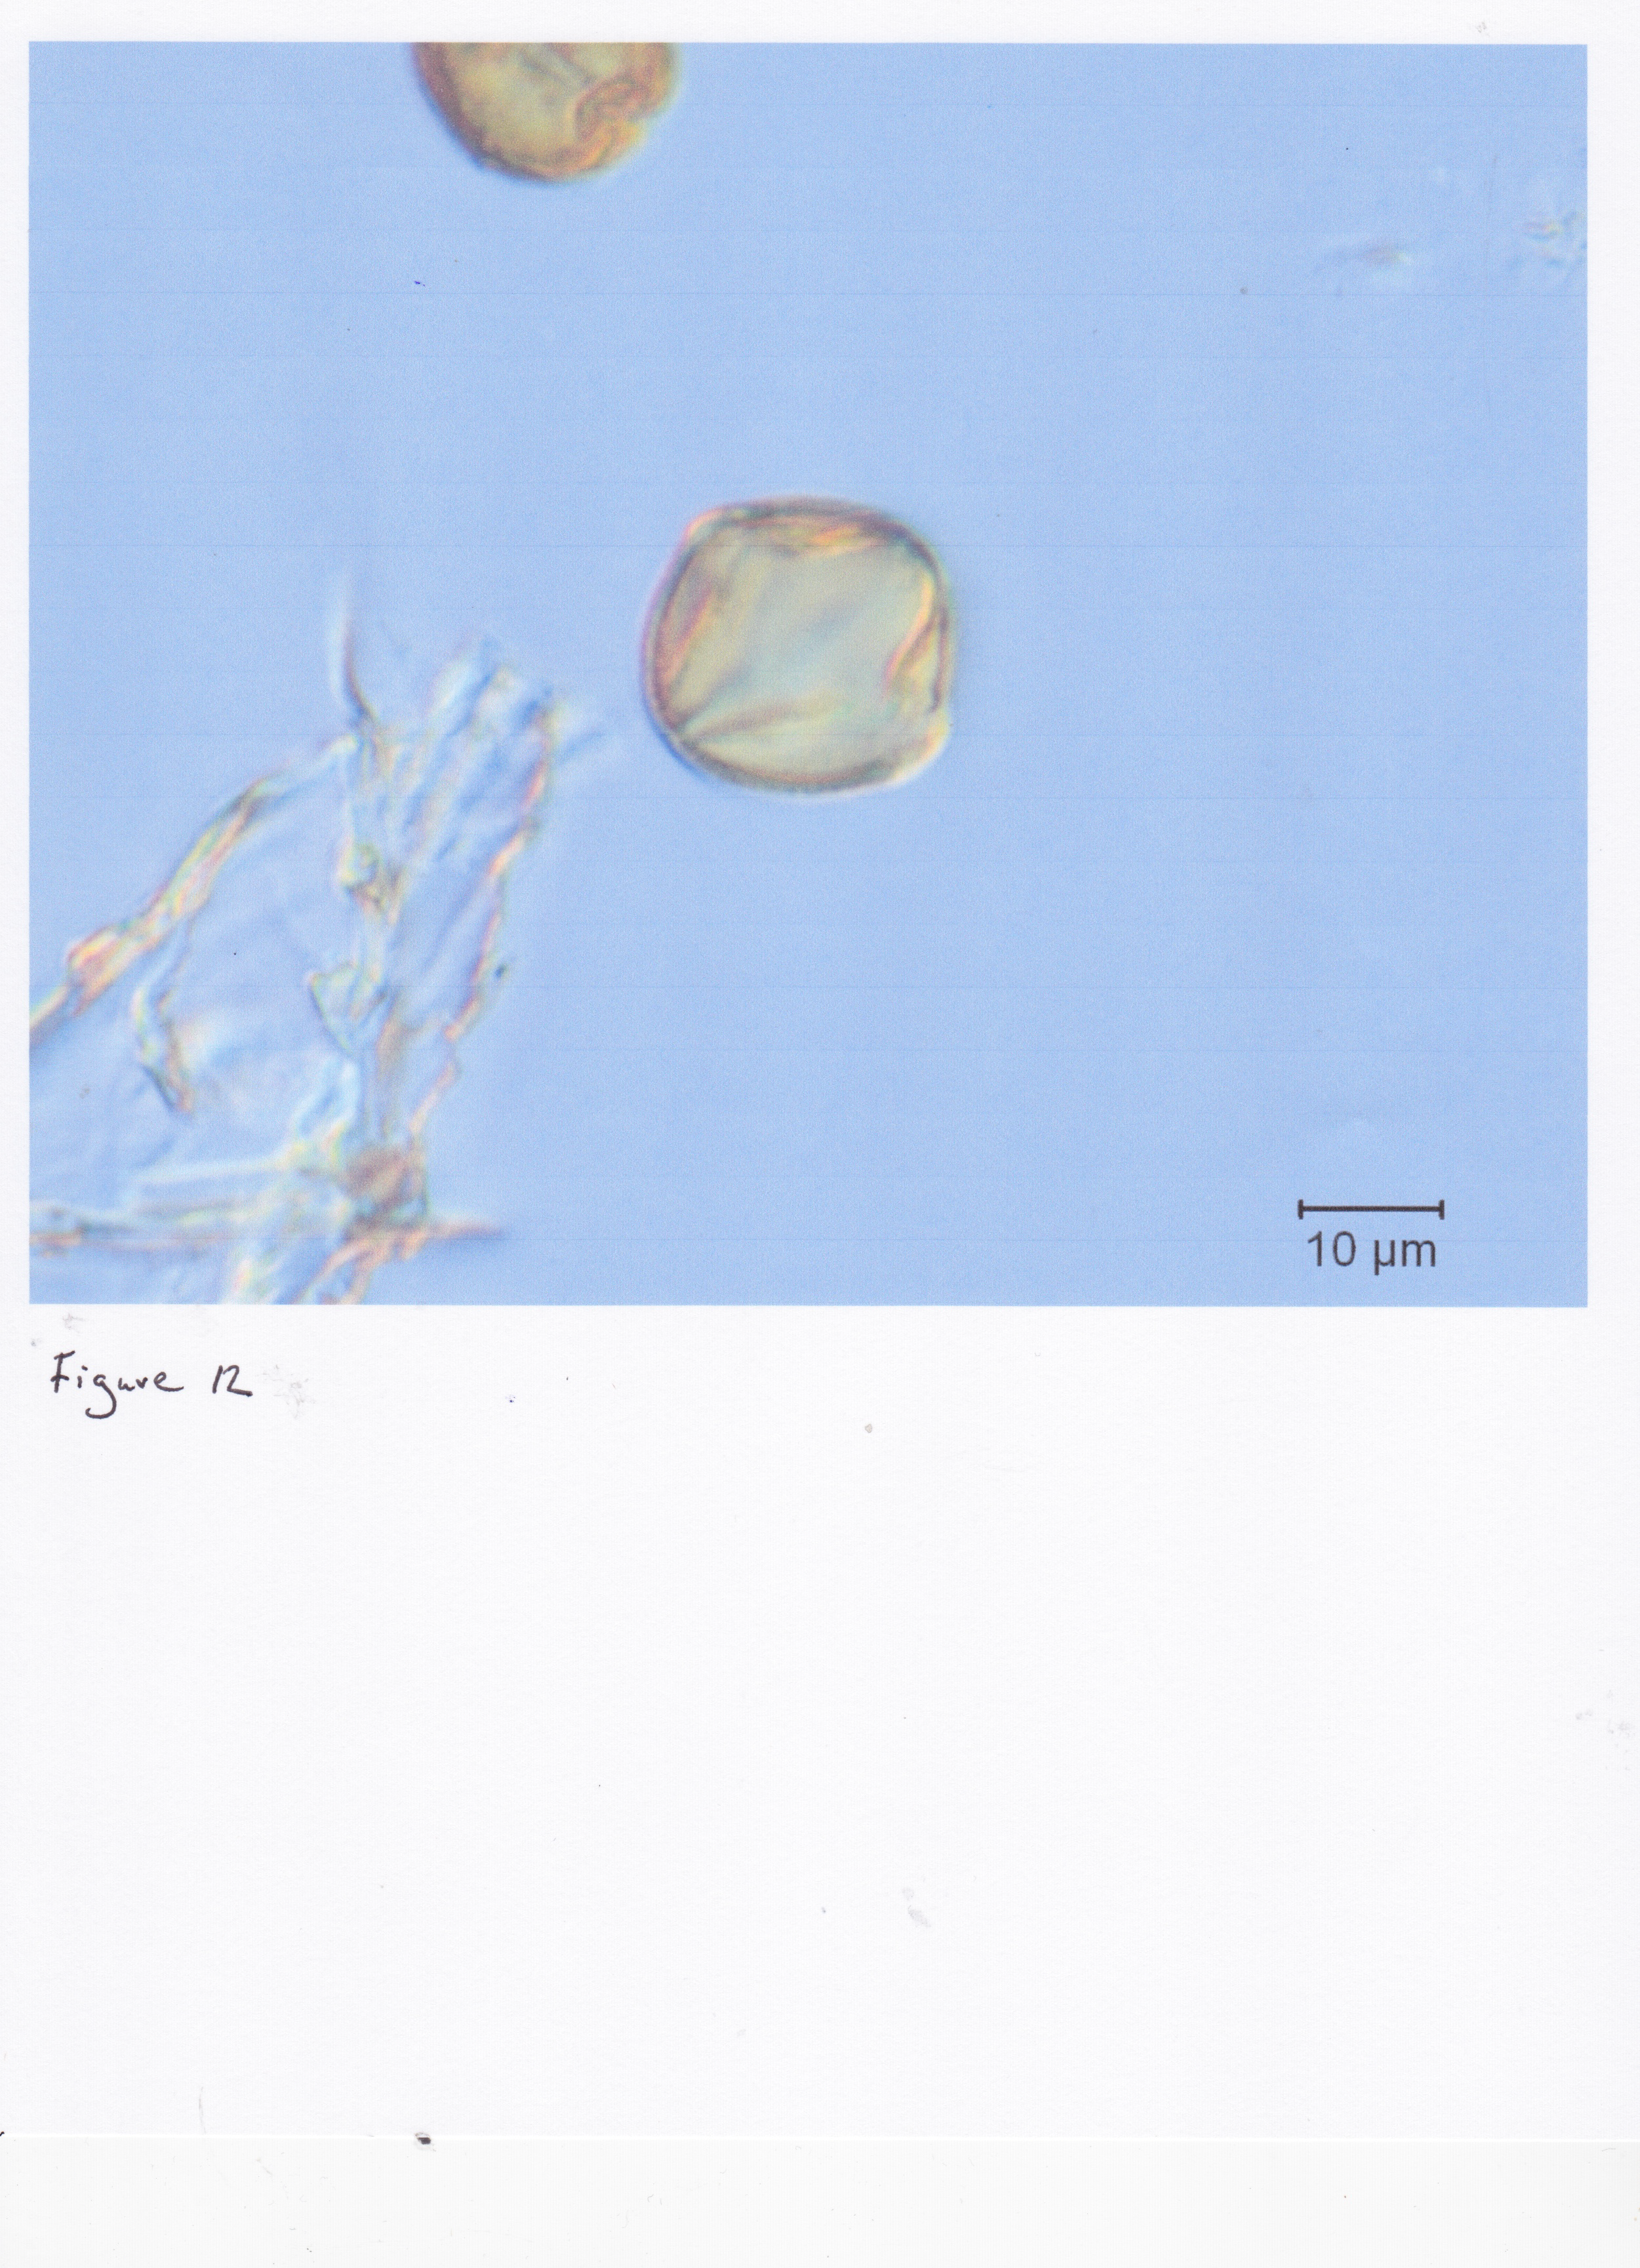
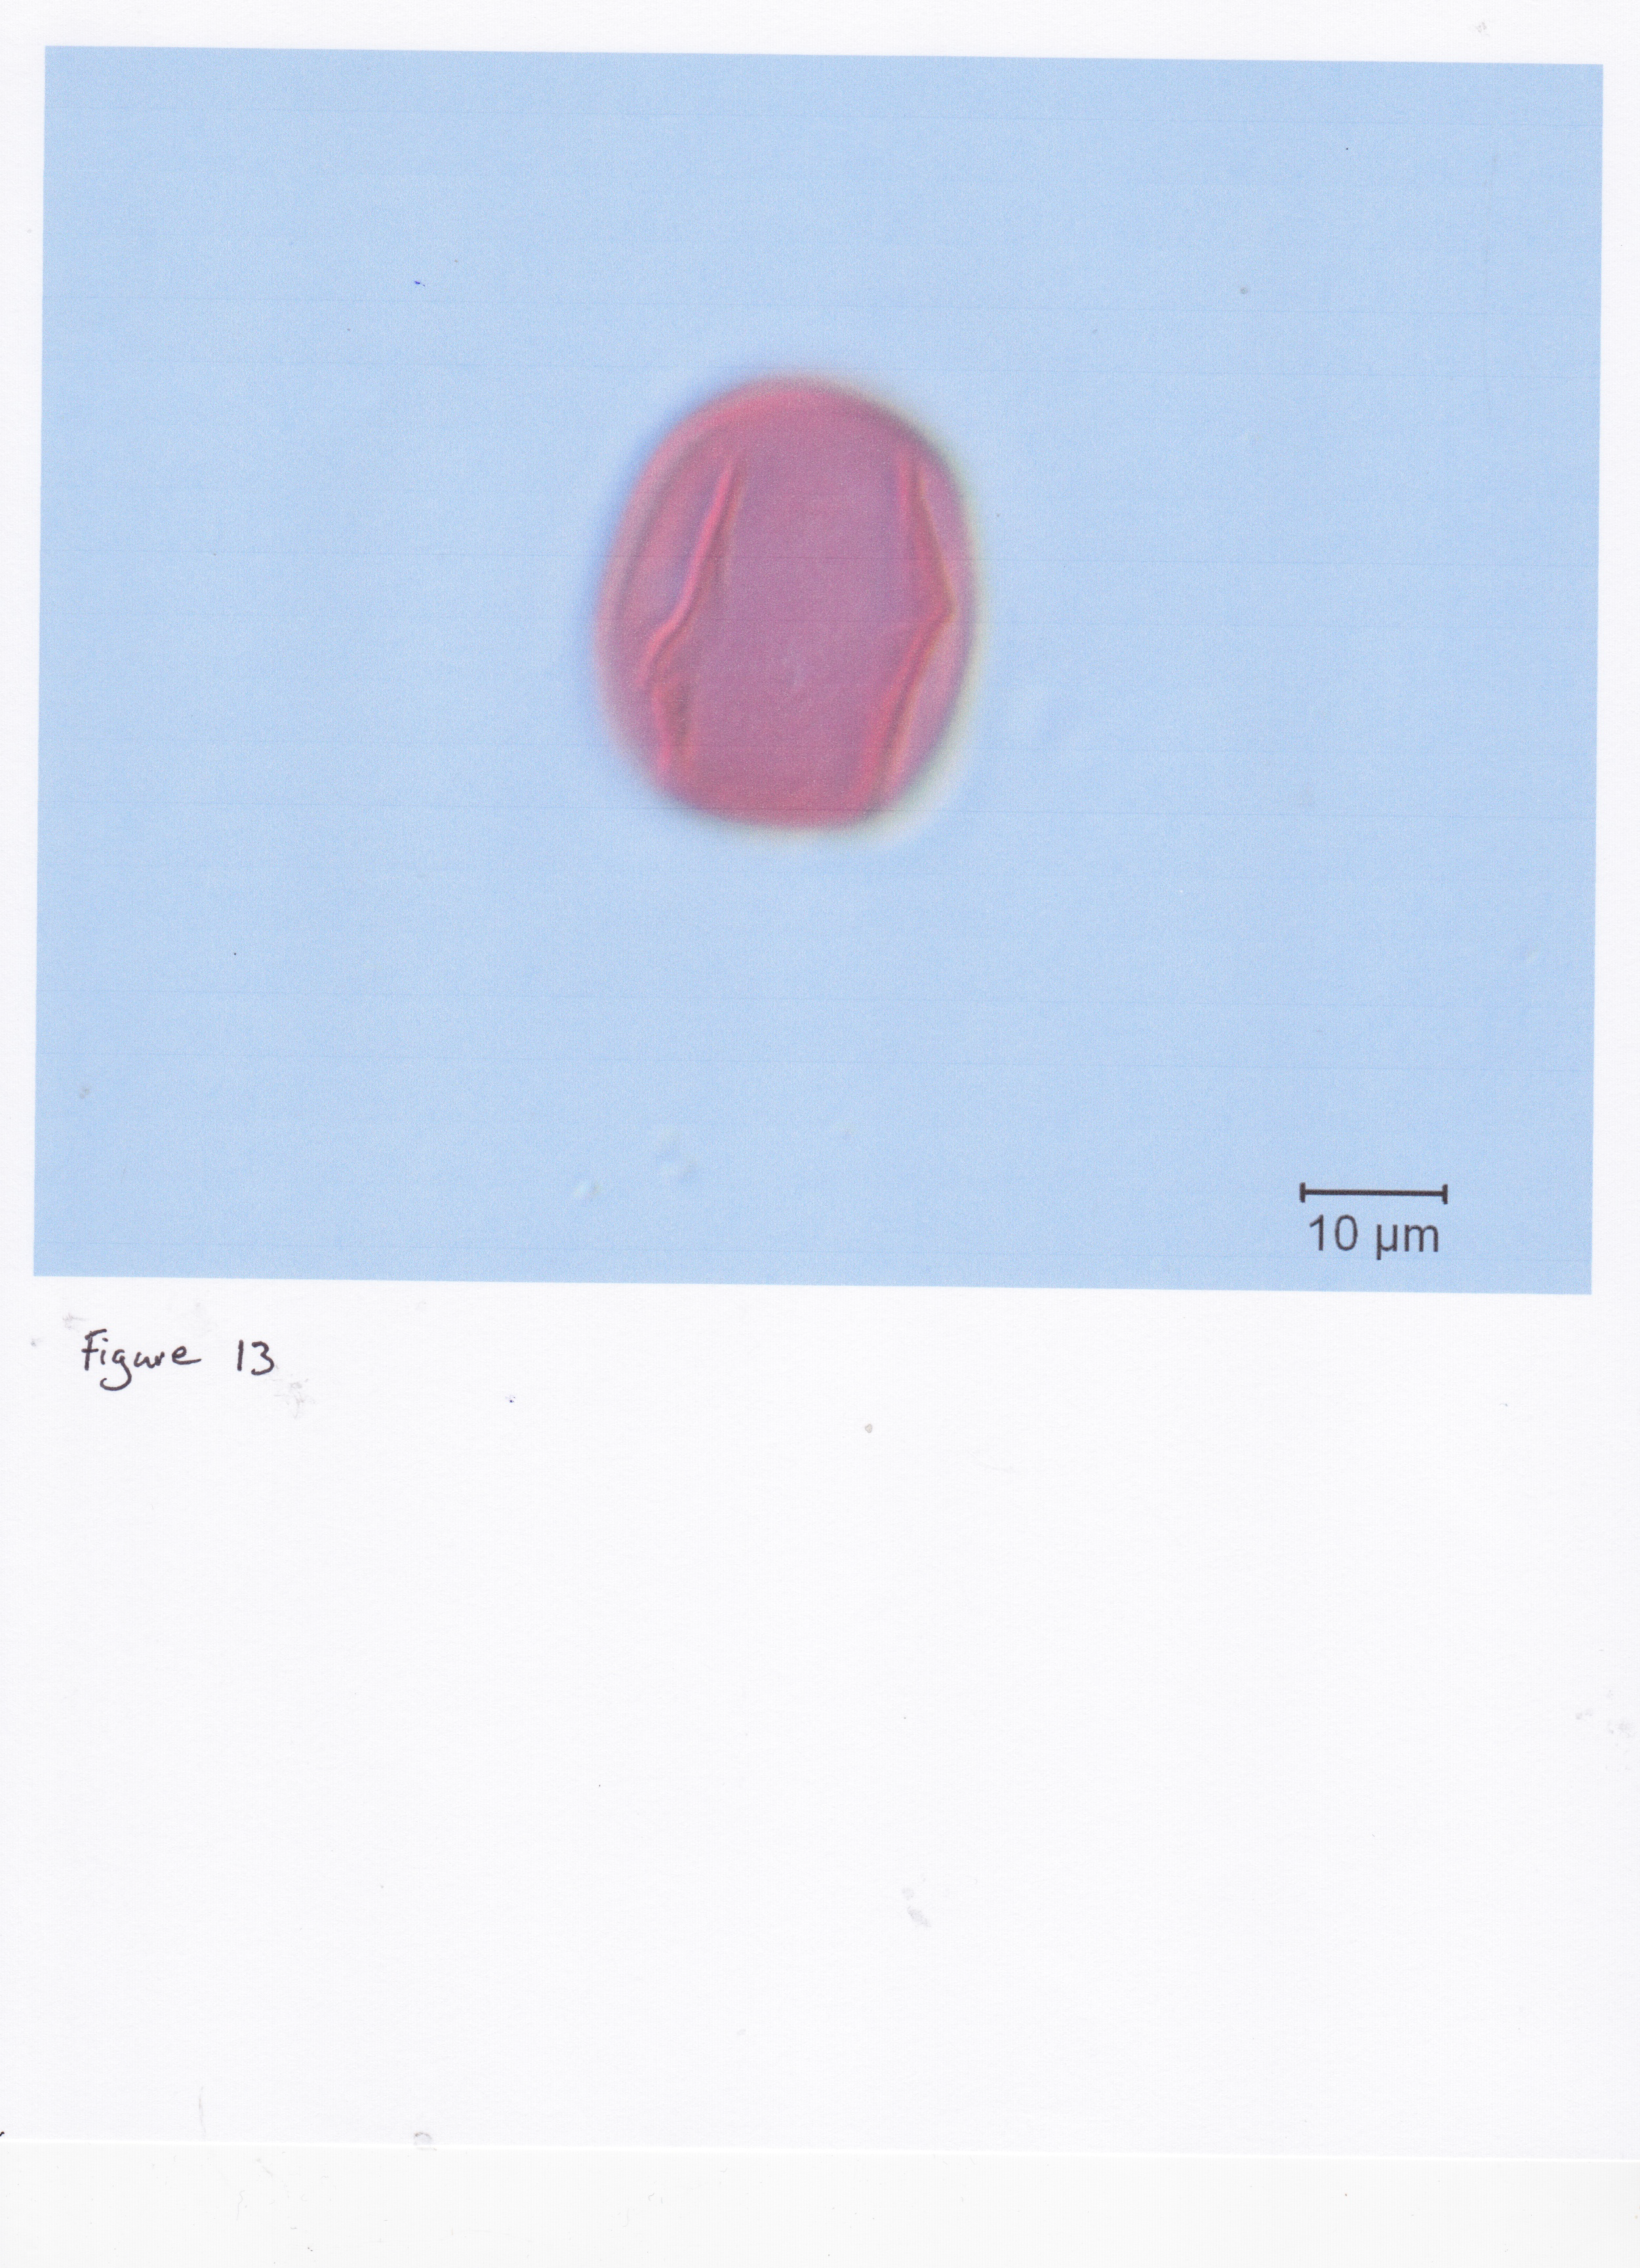
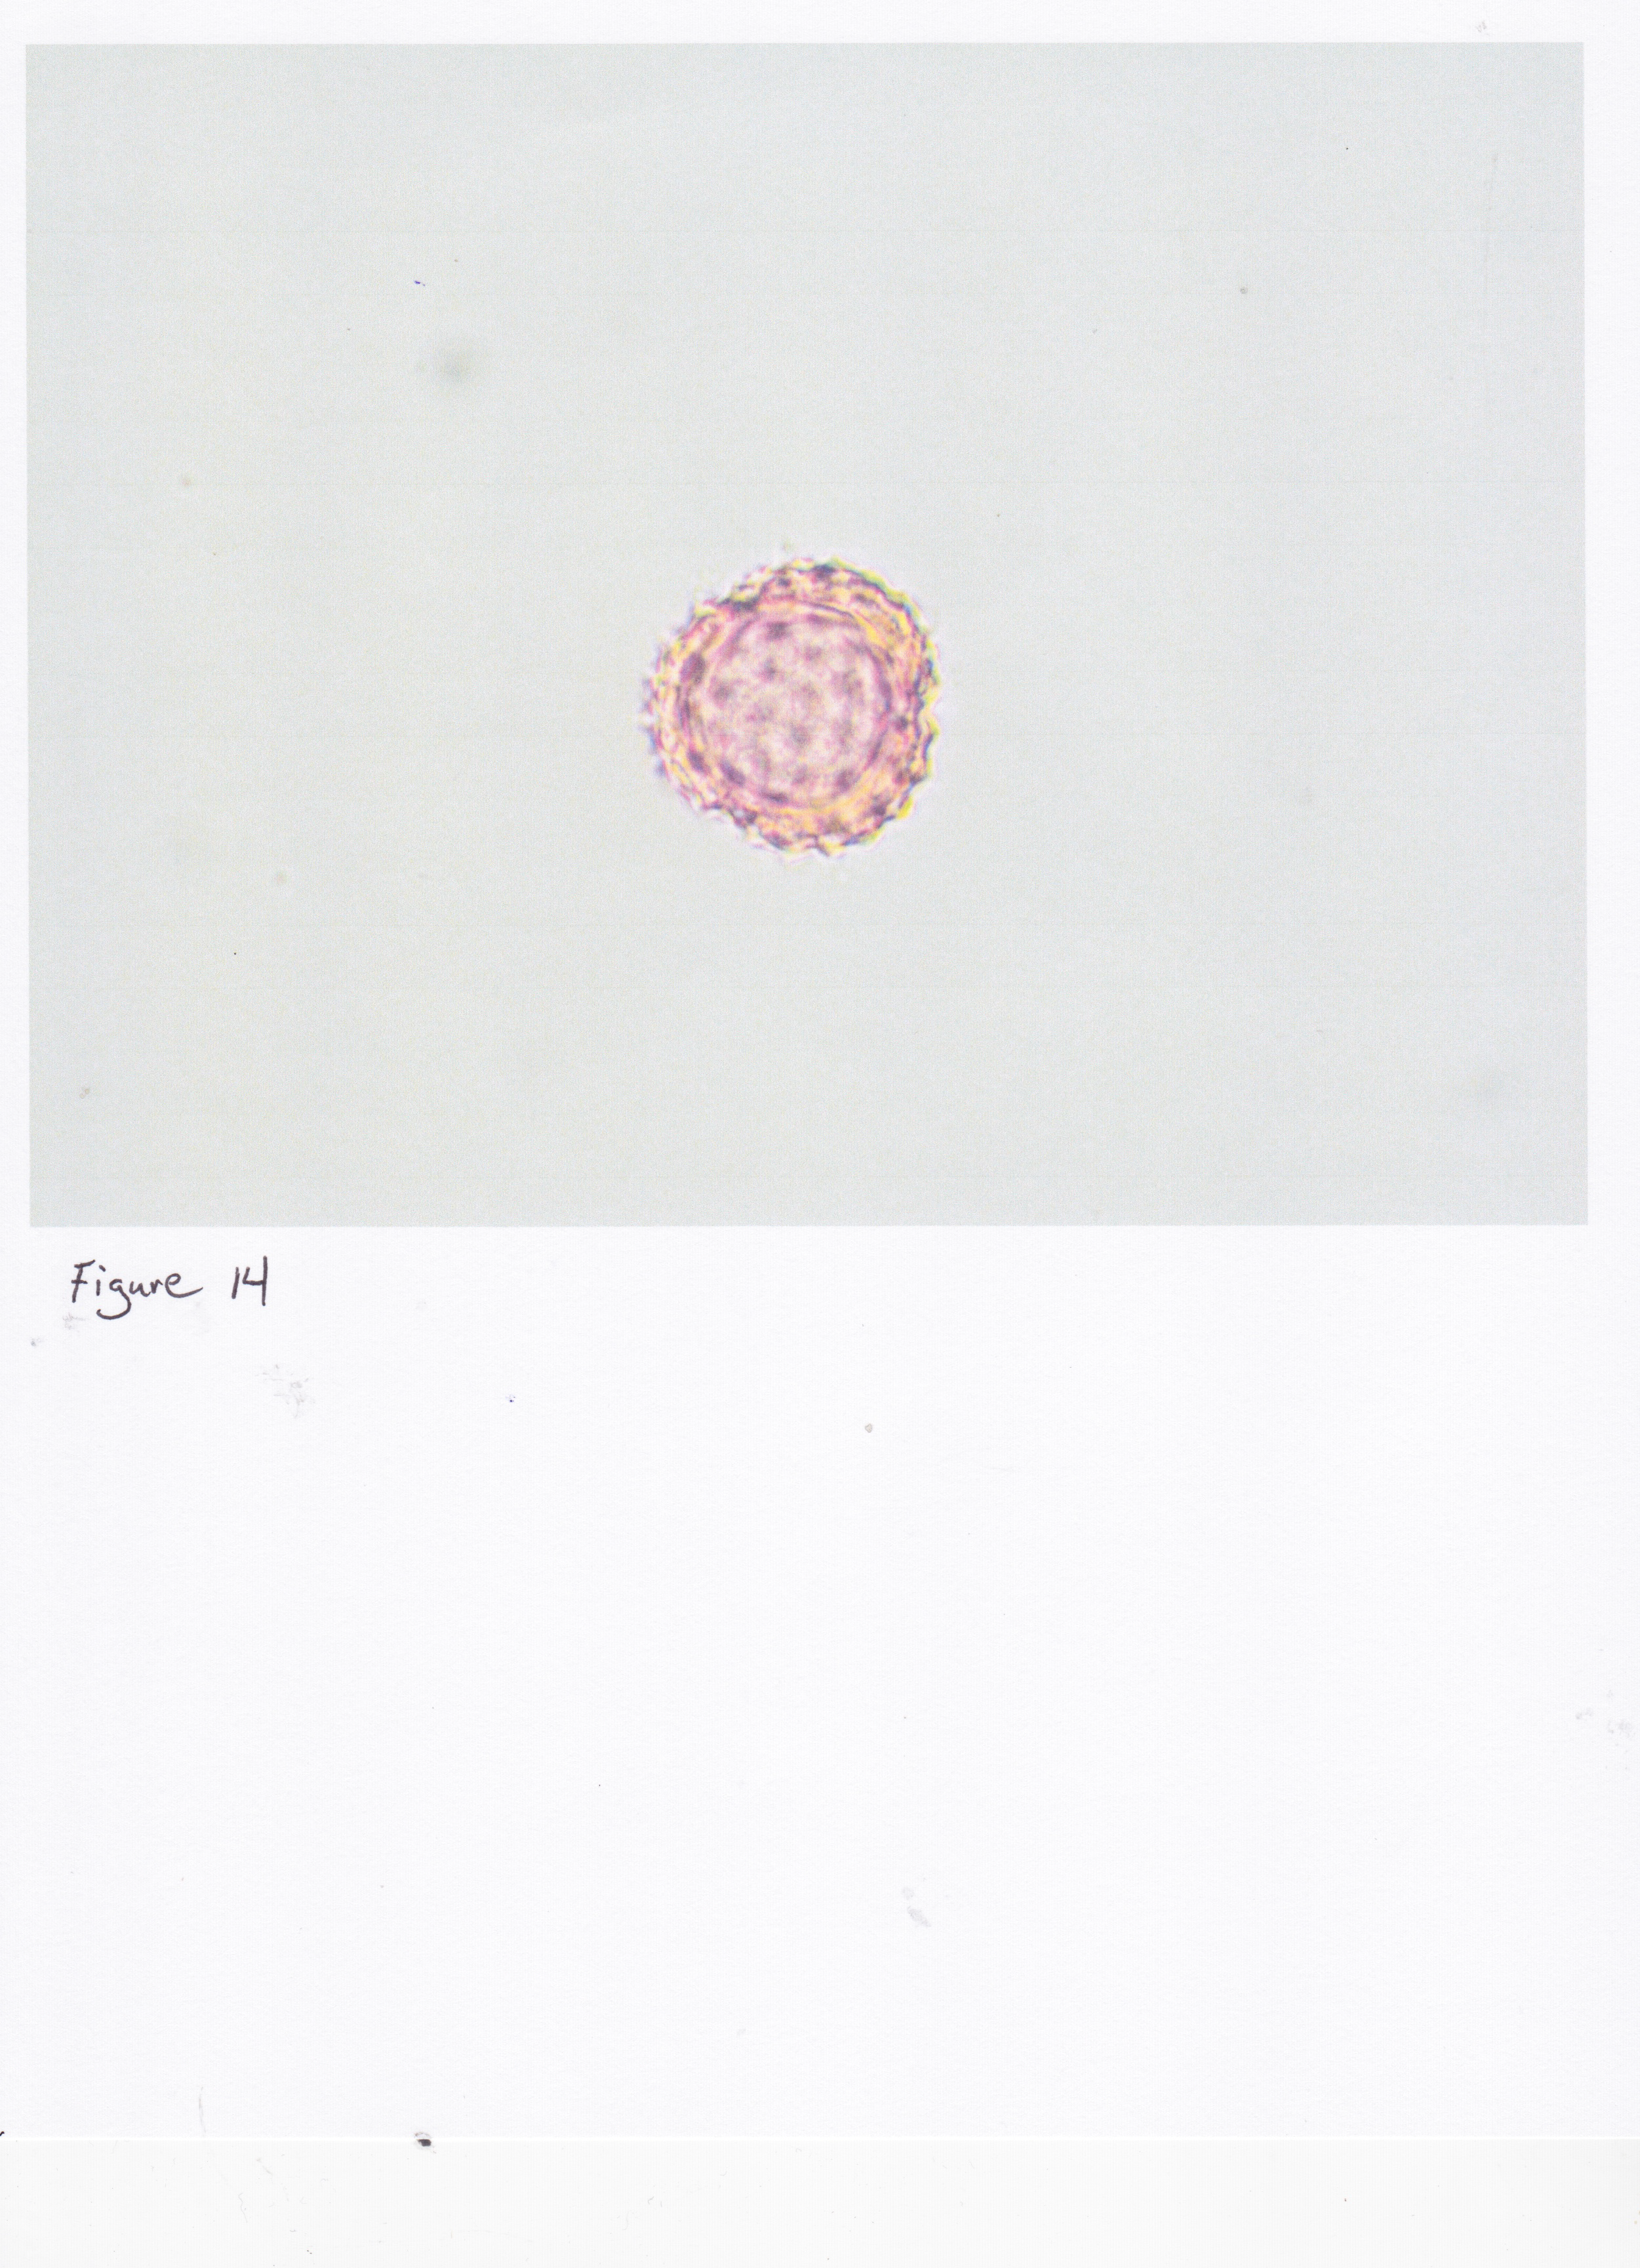
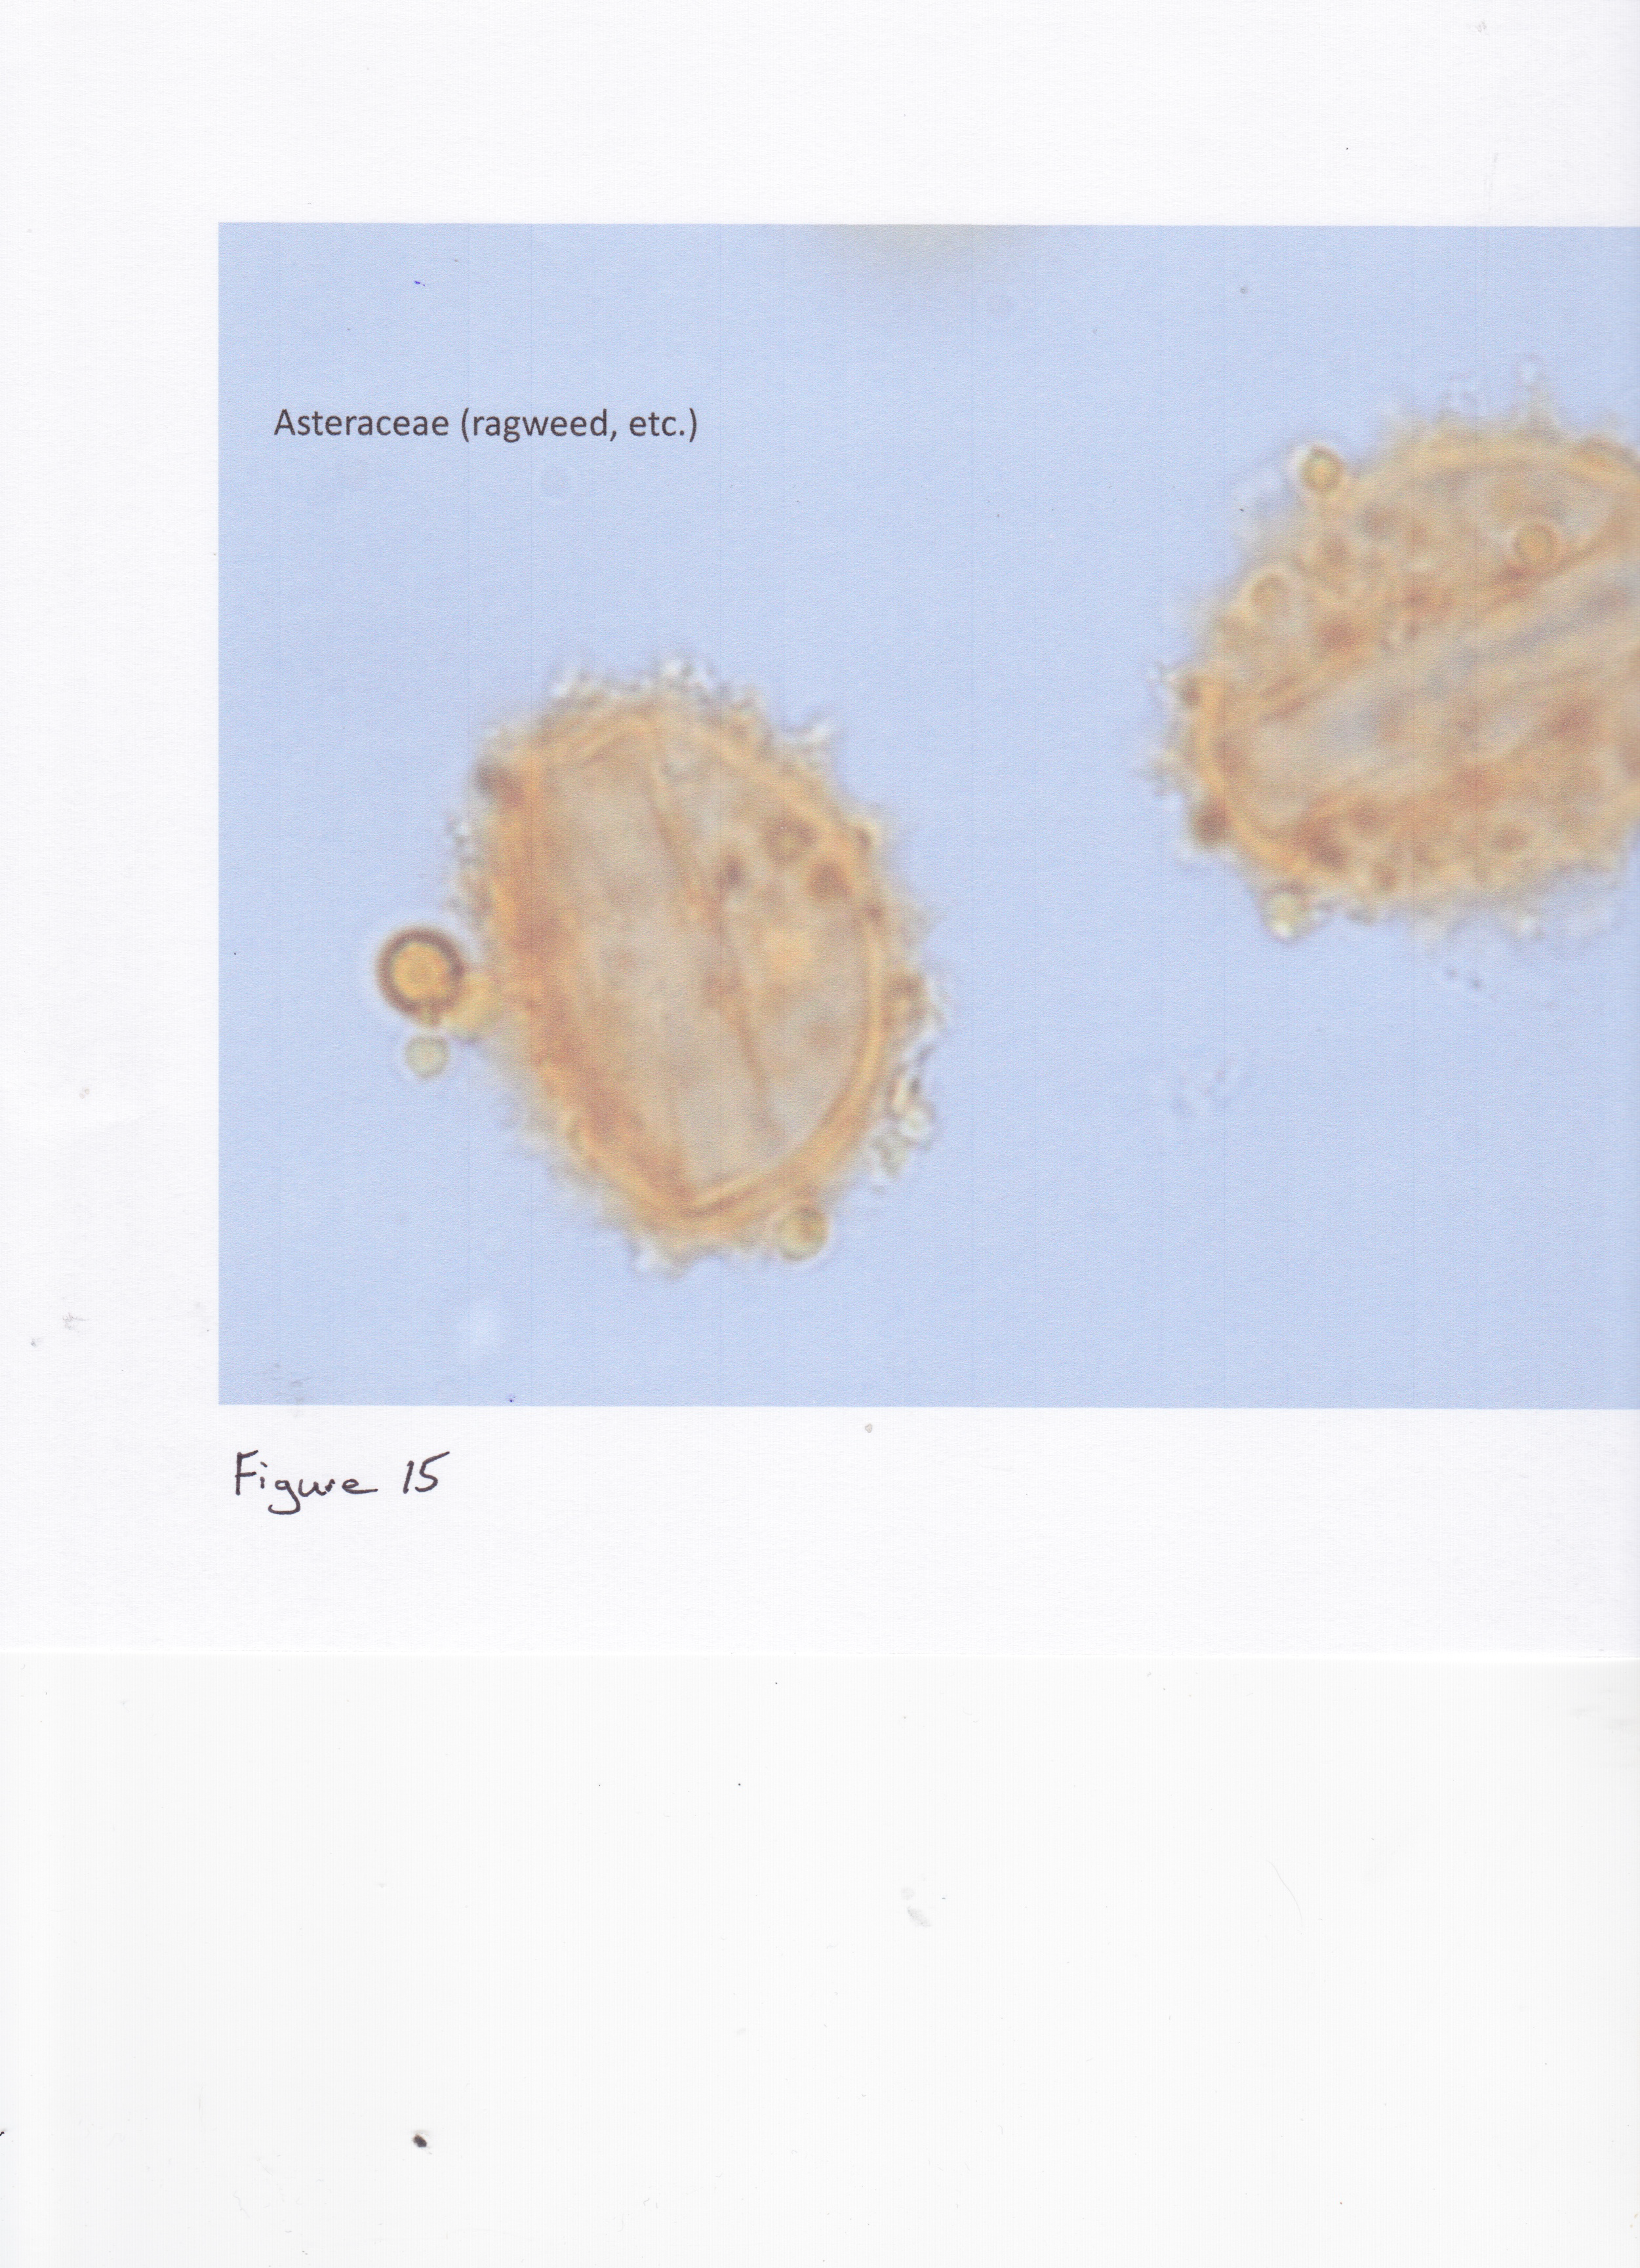
Image Credits:
Figures 2,4,8,12,13,15 courtesy of Dr. Sophie Warny
Figures 5,14 courtesy of Summer Lail
Figures 6,9 From: Bambara, Stephen B. & Leidy, Nancy. 1991. An Atlas of Selected Pollen Important to Honey Bees in the Eastern United States. NC State Beekeepers Assn. Raleigh, NC
Educational & Outreach Activities
Participation summary:
Our project's outreach was dealt a double blow: first by Covid, that eliminated the in-person events that we had hoped to share our findings, and second with the passing of Dr. Vaughn Bryant. Dr. Bryant was regarded as the foremost figure in the realm of pollen identification. It was an honor to have had the opportunity to work with him on the front-end of our project. It should be noted that it would not have been possible to complete our project without the help of his friend and colleague, Dr. Sophie Warny at LSU.
Learning Outcomes
Project Outcomes
Our project followed basic scientific method only to arrive at a conclusion that was incongruent with our hypothesis. In-house pollen identification on par with achieving a standard suitable for the pharmaceutical industry does not appear to be attainable by the methods that we tested. It remains inconclusive how this was achieved in the anecdote above, but to quote Dr. Bryant, "I am skeptical that this really worked."
Nonetheless, there is a side note to our project that could be useful to beekeepers. The data received from palynology labs after processing samples primarily includes pollen counts. For each of our samples (correlating to a specific date and location), we received raw pollen counts which were most helpful when expressed in terms of the percent of relative abundance. For example, the sample correlating to Figure 7 above contained the following:
43% Locust
18% Maple
16% Blackberry
9% Dogwood
6% Unknown
4% Mustard
There are several surprises in this data for a producer who has stocked this location for well over a decade. The predominance of Locust--this is not a location that I would have thought there to be many black locust trees. Maple generally begins blooming the first week of February at this location, so it is interesting that on April 4th--2 months later--there is still a significant amount of Maple available. The blackberry bloom I usually associate with the nectar flow that occurs at this location in late April, yet it is the third most significant pollen source according to the data, three weeks before the nectar flow.
As such, much can be learned from these pollen counts and it is certainly a service that beekeepers could benefit from being aware of. Is it cost effective? Not likely from a commercial standpoint because it provides only one small snapshot (one day, one location) when there are so many variables (i.e. weather) affecting the results from year to year. In any case, it is very interesting, if not useful data.