Final report for FS20-321
Project Information
I’m about to become a graduate student in Mississippi State University’s (MSU) agronomy program. Last year, I became an FAA certified remote pilot and am now working with a team of researchers who use sUAS technology to create variable rate prescription nitrogen (N) maps. Previous research in Arkansas showed a reduced N requirement in cotton (from 110 lbs/acre to 89 lbs/acre) with a 3 lbs/acre increase in lint yield for every 1 lb/acre reduction in total N. This algorithm needs to be tested in both cotton and corn.
My father, Tap Parker CEO of Parker Farms, agrees that our Lake Providence, LA, farm site is ideally suited to test these tools. Our farm operation aims to be environmental stewards and cooperates with environmental programs aimed at increasing N-use efficiency. However, we are still applying N at rates that are, most likely, higher than optimal. I would also like to test a new means of sensing early crop N status using emerging unmanned aerial technologies.
My graduate program director supports my research effort in giving me access to an unmanned flight system that carries a state-of-the-art vegetation sensor; valued at $10,000. I train under an unmanned flight specialist in autonomous quad-copter technology and I fly fixed-wing unmanned aircraft, but have not yet gained full command of unmanned, autonomous fixed-wing flight systems. The quad system is available to me, as a student, at no charge from the University. Due to a contractor failure, I was approved by SARE to purchase a fixed wing flight platform to perform my 2021 research. I will be assisted by Austin Wingo of Raspet Flight Research Laboratory.
Because there is no research to validate quad- vs. fixed-wing technology for VRN mapping in early crops, I believe my research will be ground-breaking and may elucidate a means to sense much larger areas than can currently be achieved using common quad-copter technology.
The purpose of this grant request is to secure funds to: 1) test novel algorithm for improving N-use efficiency in corn and cotton, and 2) test two different flight systems for best use practices. It is unknown which unmanned system will provide the most accurate data for this project. Previously, the research used quad-copters but their battery life is limited to about 30 acres or less. I would like to test the difference between quad-copter technology and fixed-wing technology, which we believe can fly five times longer than the quad-copters. The results of this research will demonstrate how accessible and affordable this technology is to producers, and this research will also demonstrate sustainable, N-reducing techniques.
This study will be conducted for two years on corn and cotton in Lake Providence, LA, between 2020-2021. The fields are five miles west of the Mississippi River and managed under the Mississippi River Basin Initiative (MRBI) Environmental Quality Incentives Program (EQIP), administered by the National Resources Conservation Service.
Prior to planting, soil sample cores will be taken at 0-15 and 15-30 cm, and sent to Waypoint Analytical (Jackson, MS) for total N percent (NO3-N and NH4-N) composition. The resulting soil N map will be derived through IDW interpolation. This will aid establish the difference between optimal crop performance occurring from the variable rate N application and/or residual soil N resources.
Both corn and cotton will be planted according to the timetable provided. Approximately half the total required crop N [URAN®-32 (32-0-0)] will be knifed in at planting. At peak early corn and cotton growth stages (V4-V6 and pinhead square, respectively) sUAS missions will be flown at 400 ft above ground level with MicaSense RedEdge® (Seattle, WA) sensor technology. Both the quad-copter (flown at 20 mph) and fixed-wing (flown at 40 mph) platforms will be used to compare efficiency in each method. Time trials on acres flown will be documented to establish sensing efficacy of each flight system.
The VRN treatments will be established on 24-row plots, Randomized Complete Block Design, with a full fixed rate as a control and two different VRN applications (from two different aircraft imaging missions) as treatments. Four reps of the three treatments will be established on 60 acres for each crop.
The imagery data returns estimate early crop N status, which supports the calculation of variable rate N sidedress recommendations. Immediately after flying these missions, leaf tissue samples will be taken to relate leaf N% to the VRN map and validate imaging efficiency. The leaf N% samples will aid in validating the research method of assessing early crop N status.
Once the sensing missions are completed, the data is process and the maps are created, the VRN maps will be delivered to the equipment operator to be applied. Throughout the growing season, crops will be managed in accordance to recommendations for irrigation scheduling, pest and weed control.
Harvest data will be collected in digital format for relating yield to VRN prescription. This will aid in determining the efficacy of the VRN mapping operations from unmanned systems.. Also, the yield data will be compared to total N calculation (residual soil N + VRN prescription) to find the full N amount used throughout the growing season. Linear statistics will be used to model the optimal yield rates against total N fertilizer applied. Data outliers will be determined using Cook’s D statistics. Yield points that exceed or fall below the expected range will be examined in a separate study in order to not skew data results. N-use efficiency will be reported as Yield per unit N applied. Comprehensive N-use efficiency will be reported as Yield per unit N applied including residual soil N observed prior to planting.
Cooperators
- (Educator)
- - Producer
- (Educator)
- (Researcher)
- (Educator)
Research
Materials & Methods
2020 Cotton
The first 2020 cotton research site was located in a field (-91.200889, 32.847611) in Lake Providence, LA, USA. The soils for the 2020 cotton plot were identified as 50% Bruin silt (loam coarse-silty, mixed, superactive, thermic, Oxyaquic Eutrudepts), 35% Newellton complex (Clayey over loamy, smectitic over mixed, superactive, nonacid, thermic, Fluvaquentic Epiaquepts), and 10% Tunica clay (Clayey over loamy, smectitic over mixed, superactive, nonacid, thermic, Vertic Epiaquepts). The 8.1 ha (20 ac) plot was situated in the northern end of a 16.2 ha (40 ac) field. Upon completion of the 2019 corn harvest, the stalks were shredded, and the field was hipper-rolled (hipped and rolled with a combination implement). After hipper-rolling, a cover crop of cereal rye, black oats, crimson clover, and hairy vetch was planted. During the spring of 2020, the cover crop was terminated before planting. A mid to full maturity Deltapine 1646 B2XF was planted at a rate of 103,530 seeds ha-1 (41,898 seeds ac-1). An overhead pivot irrigated the plot in accordance with grower recommendation.
The second plot for the 2020 cotton crop was in a field (-91.200972, 32.833028) in Lake Providence, LA, USA. The soils for the 2020 cotton location were mapped as 60% Bruin silt loam (Coarse-silty, mixed, superactive, thermic, Oxyaquic Eutrudepts) and 40% Newellton-Tunica complex (Clayey over loamy, smectitic over mixed, superactive, nonacid, thermic, Fluvaquentic Epiaquepts). The 8.1 ha (20 ac) study plot was located in the southern portion of a 48.6 ha (120 ac) field. After the 2019 cotton crop was harvested, the stalks were shredded, and a cover crop was planted consisting of cereal rye, black oats, crimson clover, and hairy vetch. During the spring of 2020, the cover crop was terminated, harrowed, and hipped to prepare for planting. A mid-maturity Phytogen 440W3FE was planted at 103,660 seeds ha-1 (41,950 seeds ac-1). The plot was furrow irrigated with poly pipe according to grower recommendation.
2021 Corn
The 2021 Corn research plot was grown in a field (-91.200889, 32.847611) in Lake Providence, LA, USA. The soils for the 2021 corn plot were identified as 50% Bruin silt loam (Coarse-silty, mixed, superactive, thermic, Oxyaquic Eutrudepts), 35% Newellton complex (Clayey over loamy, smectitic over mixed, superactive, nonacid, thermic, Fluvaquentic Epiaquepts), and 10% Tunica clay (Clayey over loamy, smectitic over mixed, superactive, nonacid, thermic, Vertic Epiaquepts). The 8.1 ha (20 ac) plot was situated in the northern end of a 16.2 ha (40 ac) field. Upon harvest of the 2020 cotton crop, the stalks were shredded, and a cover crop of black oat, cereal rye, and Austrian winter pea were planted. During the spring of 2020, the cover crop was terminated, harrowed, and hipped to prepare for planting. A 116-day Syngenta NK1677 corn hybrid was planted at 78,686 seeds ha-1 (31,843 seeds ac-1). The plot was irrigated with an overhead pivot in accordance with grower recommendation.
2021 Cotton
The 2021 Cotton research plot was located in a field in Lake Providence (-91.200503, 32.845759), LA, USA. The 8.1 ha (20 ac) plot was located in the north end of a 31.5 ha (78 ac) field. The soils for the 2021 cotton plot consisted of 26% Bruin silt loam (Coarse-silty, mixed, superactive, thermic, Oxyaquic Eutrudepts), 71% Commerce silt loam (Fine-silty, mixed, superactive, nonacid, thermic Fluvaquentic Endoaquepts), and 3% Newellton-Tunica complex (Clayey over loamy, smectitic over mixed, superactive, nonacid, thermic, Fluvaquentic Epiaquepts). A mid-maturity DeltaPine 20r734 cotton variety was planted at 103,455 seeds ha-1 (41,868 seeds ac-1). The plot was furrow irrigated with poly pipe according to grower recommendation.
Sampling and Nitrogen Treatments
Soil Sampling
Prior to planting, soil sample cores were taken in each plot at 0-15 cm (1-6 in) on a 1 ha (2.5 ac) grid. Soil samples were sent to Waypoint Analytical (Ridgeland, MS) for S3M package testing which includes pH, buffer pH, P, K, Mg, Ca, OM, CEC, percent cation saturations, B, S, Fe, Mn, Cu, Zn, and Na. Separate soil sample cores were taken at 0-30 cm (1-12 in) on a 1 ha (2.5 ac) grid, and sent to Waypoint Analytical for extractable N testing which includes NO3- and NH4+. The resulting soil N map was derived through IDW (Inverse Distance Weighting) interpolation, thus aiding in establishing the difference between optimal crop performance occurring from the variable rate N application and residual soil N resources.
Starter Nitrogen Applications
At corn planting during the 2020 growing season, an initial application of 44.83 kg ha-1 (40 lb ac-1) of N was spread using Urea. When the corn was at V1 stage, a second application of 53.8 kg ha-1 (48 lb ac-1) of N was knifed in using a blend of Diammonium Phosphate (DAP) and Urea. The third N application was a prescribed variable rate of liquid UAN 32% (32-0-0) calculated by sUAS sensing data with a low of 114.33 kg ha-1 (102 lb ac-1) of N and a high of 170.37 kg ha-1 (152 lb ac-1) of N. The final application was a tassel shot of DAP applied by airplane at 44.83 kg ha-1 (40 lb ac-1) of N. The method used for unit conversion was lb ac-1 multiplied by 1.121 resulted in kg ha-1.
Multiple sources of N were used in this study based on grower recommendation. Varying cost of fertilizer sources were noted as the primary reason for multiple sources across applications. Soil fertility needs were also a consideration when choosing N sources. Sources other than UAN 32% can fulfill multiple nutrient needs.
The 2021 corn crop received an initial application of DAP at 33.6 kg ha-1 (30 lb ac-1) of N after planting. A second application of liquid UAN 32% was applied at 134.5 kg ha-1 (120 lb ac-1) of N. When the corn was at V8 stage, a prescribed variable rate of liquid UAN 32% was applied with a low of 78.5 kg ha-1 (70 lb ac-1) of N and a high of 134.5 kg ha-1 (120 lb ac-1) of N. A tassel shot was not applied for the 2021 corn crop.
Following cotton planting in 2020, an initial application of 89.67 kg ha-1 (80 lb ac-1) of N was spread using a blend of DAP and Urea. The final application of N was a prescribed rate of liquid UAN 32% (32-0-0) based on sUAS sensing data. The 2021 cotton crop received the same N rates and applications.
Sensing Missions, VRN Treatments, and Leaf N% Sampling
At early corn and cotton growth stages (V4-V8 and pinhead square, respectively) sUAS missions were flown at 121m (400 ft) above ground level with MicaSense RedEdge® (Seattle, WA) sensor technology. A quad-copter mission flown at 32 km h-1 (20 mi h-1) was used for calculating the VRN application map.
Upon the completion of flight missions, leaf tissue samples were shipped to Waypoint Analytical. Leaf samples allowed for relation of leaf N percentage to the VRN map and validation of imaging efficiency. Imaged datasets from all missions were processed and calibrated with a SCCCI (Fox, 2015) to estimate sensed canopy leaf N percentage. Optimal sensing method was described through a comparison of calibrated imagery to actual, sampled corn canopy leaf N percentage. Within 24 hours after the sensing missions, MicaSense imagery datasets from the conventional quad-copter flights were used to calculate the variable rate N sidedress prescription. VariRite™ (Mississippi State University, MS) geospatial technology was used to generate the prescription N maps. VariRite is a proprietary copyrighted remote sensing algorithm used to estimate crop canopy N both off nadir and on nadir at distances of 4.6 – 121 m (15-400 ft), respectively. To estimate crop canopy N status and create a final, relational side-dress VRN prescription map, the crop reflectance is sampled at some critical stage that best exemplifies future crop fertilizer N requirements. Resultant imagery outputs, created in Pix4D Mapper® (Prilly, Switzerland) and converted to VIs, are used to calibrate the remainder N fertilizer rate for the season, which equals the total maximum rate (or ‘producer’s preferred maximum rate’). The crop remainder fertilizer N balance was estimated by linearly stretching VI values from low to high over a normally distributed fertilizer N rate. The VRN rate map was calculated in gallons Urea using ArcGIS Desktop software, after which maps were delivered to the equipment operator for application in WGS84 projection format.
Harvest and Aircraft Data Analysis
Harvest Data Analysis
Harvested yield data was collected in digital format for relating yield to VRN prescription. The yield data aided in determining the efficacy of the VRN mapping operations from unmanned systems. Yield data was compared to total N calculation (residual soil N + VRN prescription) to find the full N amount used throughout the growing season. The unit bu ac-1 was multiplied by 0.0673 to achieve yield in Mt ha-1.
Measuring Aircraft Efficiency
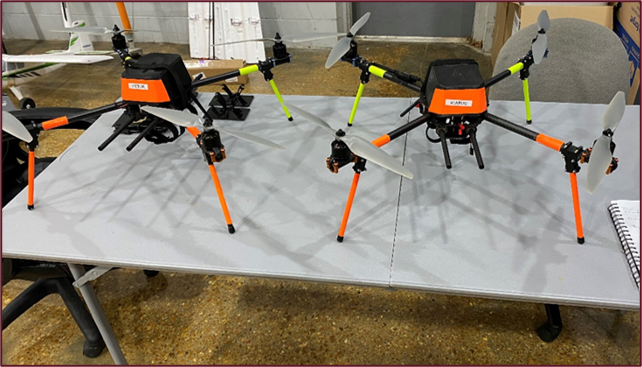
The quad-copter platform used during year one (2020) was a 650 commercial class copter with a 10,000 mAh 4S battery capable of 15 minutes sustained flight custom designed by Dennis Lott (UASSolutions, Clinton, MS). A MicaSense RedEdge sensor was employed for the missions. The quad-copter platform has the capability to fly approximately 40 ha h-1 (100 ac h-1). Quad-copter missions (flown at 16 km h-1 (10 mi h-1), 24 km h-1 (15 mi h-1), 32 km h-1 (20 mi h-1), 40 km h-1 (25 mi h-1)) were used to determine flight data accuracy at multiple speeds.
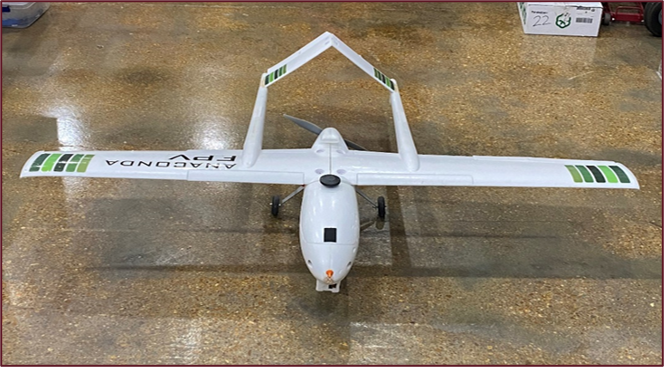
Year two (2021) of this study included flight missions with the quad-copter from the year one, and a fixed-wing platform. The fixed-wing platform was a custom-built Anaconda designed by Kevin Garland at KG Aviation (Oro Valley, AZ). A MicaSense RedEdge was employed aboard the Anaconda for data collection. The quad-copter was flown at 32 km h-1 (20 mi h-1), and the Anaconda was flown at 64.37 km-1 (40 mi h-1). Sensitivity Equivalents were calculated for each VI at both speeds.
Statistical Analysis of Data Sets
The statistical analysis of the data sets was performed in SAS® ver 9.4 (SAS Institute, Cary, NC). The analysis employed statistical classification methods to relate the factors to the outcomes for comparison of data returns. Statistical methods found if there are outliers that exist and determine data fitness. The commands “PROC REG” and “PROC GPLOT” in SAS coupled with r2 modeling in Microsoft Excel (Microsoft Inc., Redmond, WA) were used to identify outliers within the leaf N point data.
Descriptive statistics were used to describe the different flight speeds. The command “PROC REG” in SAS was used to run a linear regression to determine the sensitivity equivalents (SEq) for all VIs (Table 3.3). Calculations were performed by dividing the slope of the equation by the corresponding root-mean-square-error (Raper and Varco, 2014; Solari et al., 2008; Vina and Gitelson, 2005). The PROC REG diagnostics tests (DFFITS and DFBetas) were employed to locate influential datasets when relating leaf N to the VIs. Yield was modeled in Microsoft Excel for comparison to both variable and fixed N rates. Yield means, as they relate to categorized VRN prescription rates, were separated using LSD Means protocol in SAS PROC GLM.
Parker_Presentation_Spring2022
Please see presentation for yield maps and graphs.
Crop Canopy Sensing to Detect Early N Status
Results from crop canopy sensing missions, conducted between 2020-21 in corn and cotton, are discussed in relationship to flight speed trials, biophysical parameters relating crop canopy N status to imagery outputs, and the fitting of vegetation indices (VIs) to sensitivity equivalents (SEqs). Data are presented in tabular format detailing the statistical outcomes that comprise the resulting quotient (linear regression slope divided by the root mean square error) from relating a biophysical parameter to extracted imagery VIs. It is worth noting the canopy sensing missions featured both corn (erectophile) and cotton (planophile) canopy types. Variations in canopy reflectance across many other crops may be strategically related to the data discussed herein.
Because of the unique nature of weather and technical events affecting mission quality during each year of this study, data will be presented by year instead of by crop variety. The crop canopy section concludes with a synopsis of the general findings and assumptions.
Cotton 2020
The 2020 cotton sensing mission was flown on July 11, 2020. A quad-copter was employed to fly four separate flights at speeds of 16 km h-1 (10 mi h-1), 24 km h-1 (15 mi h-1), 32 km h-1 (20 mi h-1) and 40 km h-1 (25 mi h-1). From the July 11 sensing mission, both fixed-rate N and VRN applications were made on July 15, 2020.
There was no consistently high-performing VIs among speeds 16 km h-1 (10 mi h-1) and 24 km h-1 (15 mi h-1) in the 2020 North Cotton plot. FENDVI produced the highest sensitivity equivalents for the 16 km h-1 (10 mi h-1) when modeled with SPAD. SPAD sensor do not sample for green (550 nm) reflectance as is incorporated into the FENDVI but, instead, measures the absorbance in red and NIR wavelengths. Therefore, it is not possible to state FENDVI and SPAD are highly relatable other than through SEq modeling. The FENDVI algorithm incorporates NDRE, NDVI, and green bands of a sensor. Opposite of red-edge detection and shift relating to canopy N status, green band reflectance is indirectly related with canopy N status during photosynthesis and, therefore, inadvertently detectable by SPAD meters (Mutanga and Skidmore, 2004). However, research is needed to decouple green, red, red-edge, and NIR band reflectance behavior from other phenomenon especially considering SPAD does not account for red-colored soil albedo detected with the above-canopy sensing tools. Development of a SPAD tool that includes the green (550 nm) band may increase understanding of individual band reflectance’s and improve canopy N detection through proximal and sUAS sensing methods.
The highest sensitivity equivalents for 16 km h-1 (10 mi h-1) when modeled with Leaf N was achieved by BENDVI, a VI that incorporates NIR, blue, and green bands. For the 24 km h-1 (15 mi h-1) speed, SCCCI had the highest sensitivity equivalents when modeled with SPAD. The 24 km h-1 (15 mi h-1) speed for VIs modeled with leaf N resulted in FENDVI, a VI incorporating a modified green band with SCCCI, having the highest sensitivity equivalents.
When canopy N status was assessed using SPAD, SCCCI attained the highest sensitivity equivalents value for the 32 km h-1 (20 mi h-1) speed. The highest sensitivity equivalents result for the 32 km h-1 (20 mi h-1) speed was FENDVI when modeled with Leaf N. SCCCI modeled with SPAD achieved the highest sensitivity equivalents for 40 km h-1 (25 mi h-1). An increase of 0.13081 was noted in SCCCI with SPAD sensitivity equivalents among speed increase from 32 km h-1 (20 mi h-1) to 40 km h-1 (25 mi h-1). Inconsistent with the 32 km h-1 (20 mi h-1) speed, BENDVI modeled with Leaf N outperformed other VIs in terms of sensitivity equivalents.
Sensitivity Equivalents results across all speeds did not reveal a consistent ideal VI for modeling with SPAD or Leaf N. A probable cause for the inconsistent results is related to the previously mentioned “tilt” of the quad-copter coupled with the inability to remove outliers due to small sample count.
The 2020 south cotton plot results imply that NDVI modeled with SPAD produce the highest sensitivity equivalents value at a speed of 16 km h-1 (10 mi h-1). Both SPAD and NDVI employ red and NIR bands to estimate chlorophyll (and thus, related N status). BENDVI modeled with Leaf N sensitivity equivalents results revealed that BENDVI may be preferred to other VIs at the 16 km h-1 (10 mi h-1) speed. 24 km h-1 (15 mi h-1) results indicated that BENDVI modeled with SPAD may be favored compared to alternative VIs.
At a value of 0.03267, NDVI modeled with Leaf N sensitivity equivalents results achieved a higher value than comparable VIs. One single VI sensitivity equivalents value was not identified as consistently higher at speeds of 16 km h-1 (10 mi h-1) and 24 km h-1 (15 mi h-1). Subsequent studies using sUAS and sensing technologies necessitate an increase in sample size collection that will likely mitigate sampling errors related to on-farm topographic changes. Moreover, a highly consistent and uniform off-farm research methodology made up of similar small-plot research sites on limited soil substrate may also improve VI sensitivity.
NDVI modeled with SPAD produced a higher sensitivity equivalents value than other VIs at a speed of 32 km h-1 (20 mi h-1). A value of 2.27549 was produced by BENDVI modeled with SPAD, thus, implying that BENDVI is optimal to other VIs at a speed of 32 km h-1 (20 mi h-1). For the 40 km h-1 (25 mi h-1) speed, FENDVI had the highest sensitivity equivalents when modeled with SPAD. NDVI modeled with Leaf N sensitivity equivalents resulted in higher values than compared VIs for the 40 km h-1 (25 mi h-1) speed.
Consistent with the 2020 cotton plot north results, the 2020 cotton plot south results did not have a persistent VI that ranked above other VI sensitivity equivalents. The quad-copter tilt and small sample count may factor into inconsistent results.
Corn 2021
The sensing mission for the 2021 corn crop was flown on May 1, 2021. Two separate flights at speeds of 32 km h-1 (20 mi h-1) and 64 km h-1 (40 mi h-1) were conducted using both quad-copter and fixed-wing flight platforms, respectively.
From the May 1 sensing mission, both fixed-rate N and VRN applications were made on May 8, 2021, utilizing quad-copter data.
The 2021 corn plot revealed that SCCCI, when modeled with SPAD, produced the highest sensitivity equivalents value at a speed of 32 km h-1 (20 mi h-1). FENDVI, a modified green band divided by the SCCCI, performed best when modeled with Leaf N at the 32 km h-1 (20 mi h-1) speed. A decrease of 0.0813 was noted in SCCCI modeled with SPAD sensitivity equivalents among an increase of speed from 32 km h-1 (20 mi h-1) to 64 km h-1 (40 mi h-1). FENDVI modeled with Leaf N experienced a slight increase in sensitivity equivalents of 0.04157 when speed increased from 32 km h-1 (20 mi h-1) to 64 km h-1 (40 mi h-1).
Among both quad-copter (32 km h-1 (20 mi h-1)) and fixed-wing platforms (64 km h-1 (40 mi h-1)), SCCCI modeled with SPAD experienced a decrease. The 0.0813 decrease in SCCCI modeled with SPAD sensitivity equivalence is likely due to the unreliability of SPAD. SPAD requires an elevated level of precision and consistency when collecting samples that is not typically present when conducting on-farm sampling. Xiong et al. (2015) found that SPAD readings are highly variable depending upon leaf and environmental characteristics.
When performing on-farm research, SPAD is not a preferred biophysical parameter by which to assay canopy leaf N status. The physically demanding and time-consuming effort required to sample using SPAD are, in themselves, tremendously limiting factors. Added effects of end-user subjectivity and inconsistent sampling method necessitates the development of objective on-the-fly field measurements techniques that can, in almost real time, determine crop canopy status. Moreover, a SPAD lacking green band assessment may also reduce its overall efficacy for use on-farm. A reduction in green band reflectance is highly and indirectly relatable to increasing canopy N status.
FENDVI modeled with Leaf N produced an increase of 0.04157 in sensitivity equivalents with an increase in speed from quad-copter (32 km h-1 (20 mi h-1)) to fixed-wing platforms (64 km h-1 (40 mi h-1)). The 0.04157 increase expresses that fixed-wing flight may produce higher sensitivity equivalents than quad-copter flight.
Cotton 2021
On June 18, 2021, the first sensing mission was completed for the 2021 cotton crop during pinhead square development stage. Due to a fixed-wing platform malfunction, only a quad-copter flight was executed at a speed of 32 km h-1 (20 mi h-1) on June 18. From the June 18 quad-copter only sensing mission, both fixed-rate N and VRN applications were made on June 20, 2021, utilizing quad-copter data. A second sensing mission was accomplished on July 28, 2021, at mid-bloom development stage, employing both quad-copter (32 km h-1 (20 mi h-1)) and fixed-wing (64 km h-1 (40 mi h-1)) flight systems. The July 28 mission was necessary for comparison of quad-copter and fixed-wing flight data in similar environmental conditions.
The VRN quad-copter flight for the 2021 cotton crop resulted in the NDRE modeled with SPAD sensitivity equivalents value rising above compared VIs. NDRE may be ideal when modeled with SPAD at a speed of 32 km h-1 (20 mi h-1). When modeled with leaf N, SCCCI contained a higher sensitivity equivalents value higher than other VIs. At a speed of 32 km h-1 (20 mi h-1), SCCCI modeled with SPAD may be preferred in terms of sensitivity equivalents.
When modeled with SPAD, SCCCI possessed a higher sensitivity equivalents value than other VIs at a speed of 32 km h-1 (20 mi h-1). Consistent with SCCCI modeled with SPAD at 32 km h-1 (20 mi h-1), SCCCI modeled with Leaf N attained a higher sensitivity equivalents value than compared VIs at 32 km h-1 (20 mi h-1). An increase of 0.07259 was noted in SCCCI modeled with SPAD when speed was increased from 32 km h-1 (20 mi h-1) to 64 km h-1 (40 mi h-1). Inconsistent with Leaf N sensitivity equivalents results at 32 km h-1 (20 mi h-1), NDRE achieved the highest sensitivity equivalents value when modeled with SPAD for the 64 km h-1 (40 mi h-1) speed.
The mid-bloom sensing mission resulted in SCCCI earning the highest sensitivity equivalents when modeled with SPAD. The increase in speed from quad-copter (32 km h-1 (20 mi h-1)) to fixed-wing (64 km h-1 (40 mi h-1)) led to an increase in SCCCI modeled with SPAD sensitivity equivalents of 0.07259. The increase of 0.07259 may infer that fixed-wing is ideal to quad-copter for sensitivity equivalents in VIs modeled with SPAD. When speed increased from 32 km h-1 (20 mi h-1) to 64 km h-1 (40 mi h-1), VIs modeled with Leaf N’s sensitivity equivalents values resulted in the higher values for SCCCI and NDRE, respectively.
Concluding Remarks on Crop Canopy Sensing
Sensing missions for this study resulted in numerous novel findings. The first being that NDRE-based indices performed well in comparison to other VIs in all individual studies. Multiple studies support similar findings revealing NDRE-based VIs produced the strongest relationship with leaf N content (Varco et al., 2013; Raper and Varco, 2014; Fox, 2015; Sumner et al., 2021). Among all VIs, NDRE-based VIs may yield the highest relation to crop canopy N levels. This study does not suggest there is verifiable causation between canopy N status and VI efficiency without further study into the complex relationship of lateral, right red-edge shift and accompanying reduction in green reflectance with increasing canopy N status. However, noted to date herein, no SPAD canopy analysis tools have successfully incorporated the green band, which may further elucidate canopy N status in-field.
A loss in VI efficiency was not evident among an increase in speed from quad-copter (32 km h-1 (20 mi h-1)) to fixed-wing (64 km h-1 (40 mi h-1)). In select cases, faster sensing speeds may result in a higher level of accuracy. Fixed-wing sensing platforms provided more efficacy than quad-copter platforms in these studies, but further studies are needed. Overall, fixed-wing platforms may provide a faster alternative to quad-copter platforms without a loss of data accuracy. However, the results from this study suggest the sensor attitude onboard the aircraft may affect sensing results, but relevant research is needed to decouple speed and attitude effects.
2020 Cotton Plot North
The 2020 cotton crop sensing flight was performed on July 11, 2020. A quad-copter was employed at a speed of 32 km h-1 (20 mi hr-1) and altitude of 121.92 m (400 ft) for the flight. Multispectral sensing was conducted by a MSRE aboard the quad-copter. Both fixed- and variable-rate nitrogen applications were made on July 15, 2020, using data from the 32 km h-1 (20 mi hr-1) flight on July 11.
The mean N rate was 13.45 kg ha-1 (12 lb ac-1) for the VRN application dataset. The mode for the VRN dataset was 15.69 kg ha-1 (14 lb ac-1). A rate of 14.57 kg ha-1 (13 lb ac-1) was found to be the median of the VRN dataset. The total season variable-rate N section of the plot ranged from 89.67 kg ha-1 (80 lb ac-1) to 123.29 kg ha-1 (110 lb ac-1).
The overall mean yield for the 2020 cotton plot north was 1,445.89 kg ha-1 (1,290 lb ac-1). An average yield of 1,448.14 kg ha-1 (1292 lb ac-1) was observed for the VRN application area of the plot. The fixed-rate application portion of the plot resulted in an average yield of 1,440.29 kg ha-1 (1,285 lb ac-1).
2020 cotton plot North NUE by N rate class
|
N Rate Class |
N Rate by Class (kg ha-1) |
Yield by N Rate (kg ha-1) |
N Rate NUE |
Total Available NUE |
|
VRN Low |
0-9 |
1,419.70 |
3.03 |
6.51 |
|
VRN Mod Low |
10-17 |
1,444.73 |
4.64 |
6.57 |
|
VRN Mod High |
18-26 |
1,422.63 |
4.68 |
7.03 |
|
VRN High |
27-34 |
1,377.65 |
4.76 |
6.35 |
|
Fixed Rate |
34 |
1,439.36 |
4.28 |
6.74 |
Refer to Materials and Methods for unit conversions
An increase in yield was evident among an increase in VRN application from 0 kg ha-1 (0 lb ac-1) to 17 kg ha-1 (15 lb ac-1). Once yield peaked at the 10 kg ha-1 (9 lb ac-1) to 17 kg ha-1 (15 lb ac-1) stage, yield experienced a decrease as VRN application increased from 18 kg ha-1 (16 lb ac-1) to 34 kg ha-1 (30 lb ac-1). The high yield at the 10 kg ha-1 to 17 kg ha-1 class may suggest that 10 kg ha-1 to 17 kg ha-1 class is the optimal rate for cotton N application. Both VRN and total available NUE experienced an increase when VRN application increased from 0 kg ha-1 (0 lb ac-1) to 26 kg ha-1 (23 lb ac-1). VRN NUE continued to rise as VRN application rates increased to 34 kg ha-1 (30 lb ac-1) while total available NUE decreased by 0.68.
2020 cotton plot North Tukey Studentized range of yield means by treatment class
|
|
Yield LSMEAN |
Treatment Class |
|
A |
1443.9 |
2 |
|
A |
|
|
|
A |
1439.4 |
5 |
|
A |
|
|
|
A |
1422.8 |
1 |
|
A |
|
|
|
A |
1422.6 |
3 |
|
A |
|
|
|
A |
1377.7 |
4 |
LSMeans with same letter are not significantly different
Yield units are kg ha-1
Classes are as follows: 1,2,3,4 VRN Treatments = 1-4. Fixed-rate Treatment = 5
Tukey’s studentized range test revealed the yield for treatment class 1,2,3,4, and 5 were not significantly different. According to this test, treatment class one may be preferred to classes 2,3,4, and 5 due to lower input of N without a significant loss in yield.
The final, high rate, VRN class resulted in a 61.71 kg ha-1 (55 lb ac-1) lower yield than the fixed-rate N application. Edge-effect is a probable cause for the decrease in yield since all locations for the high rate VRN applications were located on the outer edge of the plot. Future on-farm research should integrate the edge-effect and spatial dynamics related to outer rows and consider possible removal of marginal edge production from results.
2020 Cotton Plot South
The 2020 cotton plot south employed the same platform and payload as the 2020 cotton plot north did. Fertilizer date and rates for the 2020 cotton plot south are consistent with 2020 cotton plot north.
A season total of 123.29 kg ha-1 (110 lb ac-1) was applied for the fixed-rate N amount. A rate of 21.29 kg ha-1 (19 lb ac-1) was the mean for the VRN application dataset. The mode for the VRN dataset was calculated to be 26.90 kg ha-1 (24 lb ac-1). A rate of 23.54 kg ha-1 (21 lb ac-1) was found to be the median of the VRN dataset. The variable-rate N section of the plot received a total season amount ranging from 89.67 kg ha-1 (80 lb ac-1) to 123.29 kg ha-1 (110 lb ac-1).
The 2020 cotton plot south attained an overall average yield of 1,173.53 kg ha-1 (1,047 lb ac-1). A mean yield of 1,185.86 kg ha-1 (1,058 lb ac-1) was noted for the fixed-rate portion of the plot. The VRN applicated portion of the plot achieved an average yield of 1,163.92 kg ha-1 (1,038 lb ac-1).
2020 cotton plot South NUE by N rate class
|
N Rate Class |
N Rate by Class (kg ha-1) |
Yield by N Rate (kg ha-1) |
N Rate NUE |
Total Available NUE |
|
VRN Low |
0-9 |
1,350.86 |
2.15 |
5.97 |
|
VRN Mod Low |
9-16 |
1,343.71 |
4.90 |
6.67 |
|
VRN Mod High |
17-24 |
1,203.72 |
5.68 |
6.01 |
|
VRN High |
25-34 |
1,149.32 |
4.46 |
5.64 |
|
Fixed Rate |
34 |
1,185.86 |
3.53 |
5.59 |
Refer to Materials and Methods for unit conversions
As VRN application increased from 0 kg ha-1 (0 lb ac-1) to 34 kg ha-1 (30 lb ac-1), yield decreased from 1350.86 kg ha-1 (1205 lb ac-1) to 1149.32 kg ha-1 (1025 lb ac-1). The reason for the decrease in yield was due to heavy rain from Hurricane Laura. The heavier bolls loaded with N were shed from the plant during the heavy wind and rain. The NUE for both VRN and total available sections increased as VRN application increased from 0 kg ha-1 (0 lb ac-1) to 16 kg ha-1 (14 lb ac-1). The VRN NUE increase corresponded with a decrease in N rate applied as VRN application progressed from 17 kg ha-1 (15 lb ac-1) to 34 kg ha-1 (30 lb ac-1).
2020 cotton plot South Tukey Studentized range of yield means by treatment class
|
|
|
Yield LSMEAN |
Treatment Class |
|
A |
|
1350.9 |
1 |
|
A |
|
|
|
|
A |
|
1334.5 |
2 |
|
A |
|
|
|
|
A |
|
1223.9 |
3 |
|
A |
|
|
|
|
A |
|
1215.8 |
5 |
|
A |
|
|
|
|
A |
|
1184.3 |
4 |
LSMeans with same letter are not significantly different
Yield units are kg ha-1
Classes are as follows: 1,2,3,4 VRN Treatments = 1-4. Fixed-rate Treatment = 5
Yield means for treatment classes 1,2,3,4, and 5 were not significantly different based on Tukey’s studentized range test. Treatment class 4 may be preferred due to the decrease in N input without significantly decreasing yield.
As fertilizer N rates progressed, yield encountered a drastic decrease for both the VRN applications and the fixed-rate application. Hurricane Laura produced a unique scenario where the fixed-rate N application performed poor. The heavy bolls possessed by the plants that received the high N application rate were too cumbersome to remain attached to the plant amidst high winds and heavy rain.
2021 Corn
The 2021 corn crop sensing mission was conducted on May 1, 2021. A quad-copter platform was equipped with a MicaSense RedEdge multispectral camera and flown at 32 km h-1 (20 mi h-1).
An overall average and fixed-rate average yield of 14.66 Mt ha-1 (217 bu ac-1) was observed for the 2021 corn plot. The VRN application portion of the plot exceeded the overall average with a yield of 14.69 Mt ha-1 (218 bu ac-1).
2021 corn plot NUE by N rate class
|
N Rate Class |
N Rate by Class (kg ha-1) |
Yield by N Rate (Mt ha-1) |
N Rate NUE |
Total Available NUE |
|
VRN Low |
85-98 |
14.90 |
2.63 |
0.71 |
|
VRN Mod Low |
99-110 |
14.98 |
2.42 |
0.71 |
|
VRN Mod High |
111-122 |
15.23 |
2.22 |
0.7 |
|
VRN High |
123-134 |
15.16 |
1.96 |
0.68 |
|
Fixed Rate |
34 |
15.11 |
1.81 |
0.63 |
Refer to Materials and Methods for unit conversions
Corn yield increased from 14.90 Mt ha-1 (221 bu ac-1) to 15.23 Mt ha-1 (226 bu ac-1) as VRN application increased from 85 kg ha-1 (75 lb ac-1) to 122 kg ha-1 (108 lb ac-1). The peak in yield at 15.23 Mt ha-1 (226 bu ac-1) may suggest that the VRN application range of 111 kg ha-1 (99 lb ac-1) to 122 kg ha-1 (108 lb ac-1) is the optimal rate. Furthermore, corn yield decreased as VRN application reached the 123 kg ha-1 (110 lb ac-1) to 134 kg ha-1 (120 lb ac-1) range. The VRN NUE exhibited a decrease as VRN application increased. The total available N exhibited a linear decrease as VRN application increased.
2021 Corn plot Tukey Studentized range of yield means by treatment class
|
|
|
Yield LSMEAN |
Treatment Class |
|
A |
|
15.23 |
3 |
|
A |
|
|
|
|
A |
|
15.16 |
4 |
|
A |
|
|
|
|
A |
|
15.10 |
5 |
|
A |
|
|
|
|
A |
|
14.98 |
2 |
|
A |
|
|
|
|
A |
|
14.90 |
1 |
LSMeans with same letter are not significantly different
Yield units are Mt ha-1
Classes are as follows: 1,2,3,4 VRN Treatments = 1-4. Fixed-rate Treatment = 5
Tukey’s studentized range test discovered that the yield of treatments 1,2,3,4, and 5 were not significantly different. A gap of 0.33 Mt ha-1 separated treatment 1 from treatment 3. Treatment 1 may be favored to treatments 2,3,4, and 5 due to reduced N input without significant decrease in yield.
Yield peaked at 15.23 Mt ha-1 (226 bu ac-1) followed by a decline to 15.16 Mt ha-1 (225 bu ac-1). The fixed-rate portion of the plot performed lower than the highest VRN application rate at a yield of 15.11 (224 bu ac-1). Edge-effect may be a likely culprit to the decline of yield among the highest VRN application and the fixed-rate application.
2021 Cotton
The crop sensing mission for the 2021 cotton crop was conducted on June 18, 2021. A quad-copter platform was equipped with a MicaSense RedEdge multispectral camera and flown at 32 km h-1 (20 mi h-1).
The fixed-rate total season N application that the crop received was 89.67 kg ha-1 (80 lb ac-1). A rate of 84.87 kg ha-1 (75 lb ac-1) served as the mean for the VRN application dataset. The mode and median for the VRN application dataset were 85.34 kg ha-1 (76 lb ac-1). Total season range of the VRN applicated portion of the plot was 56 kg ha-1 (50 lb ac-1) to 89.67 kg ha-1 (80 lb ac-1).
For the 2020 season, a heavier, early season N treatment of 89.67 kg ha-1 (80 lb ac-1) was applied as the starter N rate. The 2021 cotton crop only received a starter N rate of 33.63 kg ha-1 (30 lb ac-1). The decrease in VRN application variability for the 2021 season may be linked to a reduced need for N at pinhead square as a result of the heavier starter N rate.
An overall average yield of 91.93 Mt ha-1 (1,366 bu ac-1) was noted for the 2021 cotton plot. The fixed-rate only portion of the plot achieved a mean yield of 92.66 Mt ha-1 (1,377 bu ac-1). Plants that received the VRN application achieved an average yield of 91.01 Mt ha-1 (1,352 bu ac-1). Low topographic field areas are noted to have a significantly reduced yield.
2021 cotton plot NUE by N rate classes
|
N Rate Class |
N Rate by Class (kg ha-1) |
Yield by N Rate (kg ha-1) |
N Rate NUE |
Total Available NUE |
|
VRN Low |
73-76 |
1,586.50 |
21.41 |
8.31 |
|
VRN Mod Low |
77-81 |
1,645.63 |
20.61 |
8.62 |
|
VRN Mod High |
82-84 |
1,663.44 |
19.98 |
8.08 |
|
VRN High |
85-89 |
1,559.24 |
18.09 |
8.31 |
|
Fixed Rate |
89 |
1,542.29 |
17.21 |
7.28 |
Yield increased from 1586.50 kg ha-1 (1415 lb ac-1) to 1663.44 kg ha-1 (1483 lb ac-1) as VRN application rate increased from 73 kg ha-1 (65 lb ac-1) to 84 kg ha-1 (75 lb ac-1). A decrease in yield was found as VRN application rate increased from 85 kg ha-1 (76 lb ac-1) to 89 kg ha-1 (79 lb ac-1). Total available NUE increased from 8.31 to 8.62 with transition from the first VRN application class to the second. After peaking at 8.62, total available NUE decreased to 7.41 as VRN application increased. VRN NUE consistently decreased as VRN application increased from 73 kg ha-1 (65 lb ac-1) to 89 kg ha-1 (79 lb ac-1).
2021 cotton plot Tukey Studentized range of yield means by treatment class.
|
|
|
Yield LSMEAN |
Treatment Class |
|
A |
|
1662.65 |
3 |
|
A |
|
|
|
|
A |
|
1644.55 |
2 |
|
A |
|
|
|
|
A |
|
1641.24 |
5 |
|
A |
|
|
|
|
A |
|
1586.50 |
1 |
|
A |
|
|
|
|
A |
|
1565.04 |
4 |
LSMeans with same letter are not significantly different
Yield units are kg ha-1
Classes are as follows: 1,2,3,4 VRN Treatments = 1-4. Fixed-rate Treatment = 5
According to Tukey’s studentized range test, treatment classes 1,2,3,4, and 5 are not significantly different. A yield range of 97 kg ha-1 exists between treatment class 3 and treatment class 4. Treatment class 1 may be the preferred rate due to decreased input N without a significant yield loss. 2021 cotton yield modeled against variable- and fixed-rate application rate and is noted.
Yield increased as fertilizer rate increased from 73 kg ha-1 (65 lb ac-1) to 84 kg ha-1 (75 lb ac-1). A decrease in yield occurred as fertilizer rate increased from 85 kg ha-1 (76 lb ac-1) to 89 kg ha-1 (79 lb ac-1). The highest VRN application (89 kg ha-1 (79 lb ac-1)) resulted in an 83 kg ha-1 (74 lb ac-1) lower yield than the fixed-rate applied area. The low yield of the final VRN application point may be due to limited sample locations that fell within the highest VRN applied area.
Discussion on Variable Rate N Demonstration Using sUAS
The variable rate N demonstration using sUAS provided insightful results. Variable rate N demonstration data from 2020 and 2021 found that farmers may reduce N input without a significant reduction in yield. Reduced N input would improve sustainability for the future of our crop land and the wildlife that surrounds the land. This study confirmed that sUAS can successfully be used to implement variable rate N practices in an on-farm situation.
Results Conclusions
Through the results of this study, the following is inferred:
- sUAS sensing mission data provided sufficient evidence suggesting that fixed-wing flight platforms may be successfully deployed to estimate crop canopy N status most effectively, and the results of fixed-wing missions were not significantly different than that of the slower, quad-copter missions.
- The SCCCI and FENDVI VIs most often were highly related by SEq to early corn and cotton canopy N status. In general, compound red-edge VIs outperformed simple slope-based VIs in most cases.
- The VariRite™ technology was successfully implemented in a producer’s field using VI calibrated imagery captured on an sUAS. Deployment of a VRN prescription across corn and cotton provided evidence for reduction of fertilizer N inputs towards the mutual goals of N redistribution and sustained yield.
Educational & Outreach Activities
Participation summary:
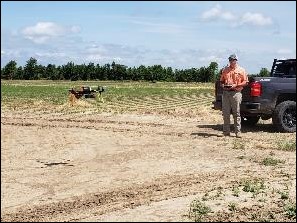
Individual consultations were had with local farmers to discuss my research. On farm demonstration was performed during the 2021 corn sensing mission. Also, I presented this research at the 2020 ASA (American Society of Agronomy) conference. Plans to publish journal articles have begun, but will not be completed until summer of 2022.
Learning Outcomes
Project Outcomes
Through the results of this study, the following is inferred:
- sUAS sensing mission data provided sufficient evidence suggesting that fixed-wing flight platforms may be successfully deployed to estimate crop canopy N status most effectively, and the results of fixed-wing missions were not significantly different than that of the slower, quad-copter missions.
- The SCCCI and FENDVI VIs most often were highly related by SEq to early corn and cotton canopy N status. In general, compound red-edge VIs outperformed simple slope-based VIs in most cases.
- The VariRite™ technology was successfully implemented in a producer’s field using VI calibrated imagery captured on an sUAS. Deployment of a VRN prescription across corn and cotton provided evidence for reduction of fertilizer N inputs towards the mutual goals of N redistribution and sustained yield.
Overall, this study resulted in increased sustainability through reduction of Nitrogen input.
This study was conducted in a highly variable, on-farm theater in lieu of a highly-constrained and limited-variability research plot array. A primary and limiting issue exposed during the 2020 research was the limited number of soil and in situ sample locations. Ample soil and biophysical data sample count should be taken into consideration for future research. Too few of soil sample locations will increase the likelihood of outlying statistical samples being integrated into the soil N dataset. SPAD data collection is problematic and, therefore, necessitates increased sampling to improve relationships with objective leaf N% sample datasets. Noted in this research are outliers occurring in the highly variable on-farm research and must be excluded to ensure accuracy. Increasing sample number may also lead to a better understanding of phenomenon actually occurring in the soil beneath the surface.
Quad-copter “tilt” was also noted as a prominent issue in this research. Tilting of the quad-copter, thus skewing the camera angle, resulted in variable sensitivity equivalents values as speed increased. The implementation of a gimble on a quad-copter platform is proposed for use in future research scenarios. A gimble would allow the sensor to maintain a constant perspective of the ground regardless of quad-copter attitude. Gimble implementation is necessary in future research to resolve data variability due to inconsistent camera angles.
Vegetation indices testing also encountered hurtles that should be addressed in future research. Needed is a SPAD sensor that incorporates the green (550 nm) reflectance band. Currently, SPAD measures the absorbance in red and NIR wavelengths. Vegetation indices in this study, such as FENDVI stated previously, require a green band incorporated testing tool to determine efficacy of VIs that incorporate the green band. Green band reflectance is indirectly related with canopy N status during photosynthesis, thus, coextended in detectable by SPAD meters (Mutanga and Skidmore, 2004). SPAD, in addition, does not account for red-colored soil albedo detected with sensors above canopy level. SPAD developed with a green band may increase understanding of individual band reflectance’s and improve canopy N detection through proximal and sUAS sensing methods.
The red-edge shift relation to canopy leaf N% is an important connection that must be discussed in future research. A ‘rubberbanding’ effect occurs as reflective bands stretch within the red to NIR region. The stretch among the reflective bands may be linked to increase and decrease of canopy reflectance that correlate canopy N levels. A biochemical phenomenon has not been linked to the lateral red-edge shift that may occur with increased N status and/or availability. Gitelson et al. (1999) proposed the ratio of F737/F700 nm detectable florescence is directly correlated to canopy chlorophyll, and thus, highly relatable to canopy N status. Laboratory research is necessary to decouple red-edge shift from red-to-NIR reflectance decrease and increase. Moreover, research is needed to discover why red-edge is superior in detecting canopy N status. Little, if any, research has been done to dissect the true cause of success among red-edge based indices in canopy N related research.
Final recommendations for this research are to expand the study beyond small plot canopy N status assessment to larger, broader field landscapes using fixed-wing sUAS parallel with continued deployment of the VariRite VRN algorithm. The stated purpose of this research was to reduce N fertilization by redistributing resources to field areas of greater need and maintaining sustainable yields, although likely not highest attainable yields. Future research is needed to expand the results of the study herein and advance the technologies to ensure the safety of our environment parallel to profitable, sustainable farm production.