Final report for FS24-366
Project Information
Introduction
Brewing aerated compost tea (ACT) is an increasingly popular practice among farmers and gardeners seeking to improve soil fertility using biologically active inputs.
However, a persistent concern is the potential proliferation of human or plant pathogens, such as Enterobacter, Citrobacter, and Klebsiella, especially when ACT is fed with high-sugar microbial foods like molasses.
Balancing the need for a microbially rich and effective compost tea with safety is critical.
Objective
This study aimed to identify microbial food sources that support the growth of beneficial microorganisms, particularly plant growth-promoting bacteria (PGPB), while minimizing the proliferation of potentially pathogenic microbes in aerated compost tea.
A second objective was to test whether the safest and most effective tea improved yield, disease resistance, and nutrient density in field-grown tomatoes.
Background and Preliminary Research

The image above is data from a study conducted by a biological amendments company in Switzerland called EdaPro.
Recent data from a Swiss biological amendments company, EdaPro, indicate that microbial foods significantly influence compost tea's bacterial profile. Their 2019 study ("Appendix2_2019-032_Bioinfo") examined three ACT brews:
- Molasses-fed tea showed a spike in both beneficial and pathogenic bacteria, including Enterobacter species.
- An alfalfa and kelp blend promoted beneficial microbes with minimal pathogenic bacteria presence.
In a separate DNA analysis of my own vermicompost tea, fed with a blend of fish hydrolysate, humic acids, and kelp, I observed a similar dual outcome: elevated levels of both beneficial PGPBs and potentially harmful Enterobacter.
These findings emphasized the need to isolate the effects of specific microbial foods to determine which additives offer a favorable risk-benefit profile for ACT brewers and farmers.
Methodology

Using the EdaPro study as a starting point, we determined the biological richness and identification of the microbiome of 16 compost tea treatments fed with the following microbial foods and their pairwise combinations: alfalfa meal, kelp meal, fish hydrolysate, humic acids, and molasses, plus an unfed control. All brews used the same base vermicompost and brewing conditions (aeration, water source, brew time, temperature, and equipment) to isolate the variable of microbial feed. Each treatment was sampled at 12 and 24 hours, plus one sample of the unbrewed vermicompost, for a total of 33 samples analyzed by 16S rRNA gene sequencing for:
- Presence and relative abundance of PGPBs
- Presence and relative abundance of potentially pathogenic genera (Enterobacter, Citrobacter, Klebsiella)
- Overall microbial richness and evenness
Humic acid-fed ACT, chosen for keeping the community that had many different beneficial bacteria and among the lowest Enterobacteriaceae, was then applied to tomatoes in two field seasons.
In 2025 it was compared against an unfed control and a nitrogen treatment, with leaf sap analyzed by Apical Ag.
In 2026 it was compared against a water-only control and an organic fertilizer (Espoma Tomato-tone, 3-4-6) in nine randomized beds, with every fruit weighed at harvest and fruit analyzed for nutrient density by Apical Ag's Crop Nutrient Analysis (CNA).
Expected Outcomes
This study set out to:
- Identify microbial inputs that enhance compost tea efficacy while maintaining safety
- Provide actionable guidance to growers on microbial food selection
- Contribute to the ongoing development of standards for compost tea use in sustainable agriculture
- See if ACT can be used to grow tomatoes with higher yields and higher nutrient densities
Conclusion
1. Compost Tea Microbiome Conclusions:
Through DNA-based microbial profiling, this project found that feed choice shapes the compost tea microbiome more than brew time within the 12 to 24 hour window.
Because no plate counts were run, we rated each tea with DNA-based definitions reviewed by our technical advisor, Dr. Zack Jones of AggregoData.
A safe tea is one that is non-pathogen-promoting, meaning the family Enterobacteriaceae (which includes E. coli and Salmonella) stays at or below 0.1% of reads, and effective when plant growth promoting bacteria make up 30% or more.
Molasses alone and molasses with humic acid were the only feeds rated non-pathogen-promoting and effective at both 12 and 24 hours, driven by a bloom of Fictibacillus.
Humic acid alone stayed closest to the starting vermicompost with among the lowest Enterobacteriaceae, but added few beneficial bacteria.
Every kelp tea was pathogen-promoting by 24 hours,
and molasses plus fish hydrolysate was the least safe tea in the study.
2. Tomato Trials Conclusions:
In the tomato trials, humic-fed ACT did not produce a statistically significant difference in yield.
In 2026, ACT plots produced 103 lb 12.5 oz against 90 lb 14 oz for the water-only control and 118 lb 11.5 oz for the fertilized plots (ANOVA p = 0.597).
ACT-treated fruit scored highest on our Nutrient Adequacy Score and was highest in calcium, potassium, magnesium, iron, zinc, sulfur and boron, but with one pooled sample per treatment this is descriptive only.
Recommendations:
Our recommendation to growers is to:
- Avoid kelp and fish hydrolysate blends
- Keep brews short
- Choose molasses or humic acid depending on whether the goal is more beneficial bacteria or a tea closest to the original compost,
- And treat compost tea as one part of a system that also includes polyculture, mulch, fertilization and soil cover.
Defining Terminology
The proposal defined safety using E. coli and enterococci plate counts (CFU/100ml). No plate counts were run, so the definitions below were rebuilt on the 16S DNA sequencing results and reviewed by our technical advisor, Dr. Zack Jones of AggregoData. Because no study has yet linked 16S results to plate counts, "safe," as used in this project's title and proposal, means non-pathogen-promoting as defined below, not a plate-count result. Each definition uses the unfed compost tea (vermicompost, water and air only) as the reference point.
Potential pathogens - bacteria in the family Enterobacteriaceae. This family contains the organisms typically tested for in organic certification (Salmonella and fecal coliforms such as E. coli), along with Enterobacter, Klebsiella, Citrobacter and Shigella. Salmonella was not detected in any sample. Enterococcus was also searched for as the DNA counterpart of the enterococci test and was not detected.
PGPBs (Plant Growth Promoting Bacteria) - genera widely documented as plant growth promoters that were present in our samples: Pseudomonas, Bacillus, Paenibacillus, Lysinibacillus, Fictibacillus, Azotobacter, Azospirillum, Rhizobium group, Ensifer, Mesorhizobium, Bradyrhizobium, Acinetobacter, Flavobacterium, Streptomyces, Microbacterium, Arthrobacter, Sphingomonas, and Burkholderia-Paraburkholderia.
Acinetobacter is included because it is only an opportunistic pathogen, is not part of agricultural pathogen testing, and long-read sequencing of one of our samples found beneficial species such as A. johnsonii (unpublished data, AggregoData).
Fictibacillus is included based on recent work identifying it as a potential plant growth promoter (El Chater, 2025).
Aeromonas and all Enterobacteriaceae were left out.
Non-Pathogen-Promoting Tea - Compost tea that is brewed with an additive and found to have Enterobacteriaceae making up 0.1% of DNA reads or less (no more than 1 in 1,000). The starting vermicompost had none, and the unfed tea measured 0.06% at 12 hours and 0.08% at 24 hours, so this limit allows only what brewing in water contributes on its own.
Pathogen-Promoting Tea - Compost tea that is brewed with an additive and found to have Enterobacteriaceae making up more than 0.1% of DNA reads.
Non-Pathogen-Promoting & Effective Tea - Compost tea that meets the Non-Pathogen-Promoting limit and in which PGPBs make up 30% or more of DNA reads. For comparison, PGPBs made up 3.9 to 4.5% of the unfed tea.
These are relative (percent of reads) measures, not live cell counts, and 16S sequencing cannot always tell a harmful strain from a harmless one in the same genus. A plate count on at least one tea would be needed before calling a tea "safe" in the regulatory sense.
Compost extract = no aeration, no feed.
Aerated compost tea (ACT) = aerated, with or without feed.
Research Question and Objectives
In this study, I aimed to first and foremost answer the question, "Can we brew a safe and effective compost tea from vermicompost with the addition of microbial food?"
Through the course of the research I also aimed to answer several sub-questions:
- What is the safest and most effective microbial starter to use for brewing compost tea?
- What is the optimal brewing time to produce the safest and most effective compost tea?
- If Enterobacters (to which pathogenic bacteria such as E. coli and Salmonella belong) are present in my vermicompost, can proper brewing methods decrease their populations? What methods would those be?
- Do the safest and most effective ACT treatments increase yields, disease resistance, and nutrient density in tomatoes?
In this study, the presence, absence, and relative abundance of bacteria, including potentially pathogenic genera were measured, in 15 fed compost tea treatments from vermicompost and one unfed control (16 treatments in total), brewed for 12 and 24 hours.
Relative abundance and identification were determined using DNA sequencing and microbial analysis from AggregoData.
The compost tea treatments were fed five different microbial starters separately and combined in pairs:
| # | Treatment | # | Treatment |
| 1 |
No Feed (Control) |
9 |
Alfalfa + Molasses |
| 2 |
Alfalfa Meal |
10 |
Alfalfa + Fish Hydrolysate |
| 3 |
Kelp Meal |
11 |
Kelp + Humic Acids |
| 4 |
Humic Acids |
12 |
Kelp + Molasses |
| 5 |
Molasses |
13 |
Kelp + Fish Hydrolysate |
| 6 |
Fish Hydrolysate |
14 |
Humic Acids + Molasses |
| 7 |
Alfalfa + Kelp |
15 |
Humic Acids + Fish Hydrolysate |
| 8 |
Alfalfa + Humic Acids |
16 |
Molasses + Fish Hydrolysate |
The control was not fed a microbial additive. Results were returned as Krona graphs, barplots, and microbiome reports, biological richness which revealed bacteria quantities and classifications.
The analysis of these reports was used to rate each tea for safety and effectiveness.
The study then tested the effects of regular applications of the safest and most effective compost tea on tomato:
- Yield
- Disease resistance
- Nutrient density
Research Hypothesis
I hypothesized that it is possible to consistently brew a safe and effective batch of aerated compost tea using specific microbial foods.
Current research suggested that molasses would prove to be the most unsafe additive to use as a compost tea feed, and that humic acids, alfalfa, and kelp, or a combination of these, may prove to be potentially safe and effective additives to use in brewing ACT.
A secondary hypothesis was that regular application of the safest and most effective ACT treatment would deter disease and improve yields and nutrient density in tomatoes.
Data Collection & Measurements
Findings of compost tea treatments' microbiome identification and relative abundance for 33 samples (16 treatments at 12 and 24 hours, plus the unbrewed vermicompost) can be found here.
Variables: relative abundance of Enterobacters, relative abundance of PGPBs, and alpha differentiators (Observed and Shannon).
Findings of the effects of the safest and most effective ACT treatment were logged in a second tracking workbook (Tomato Trial Tracker).
Variables: yield, disease and pest pressure, and nutrient density.
- Yield: every fruit harvested was weighed individually, or in labeled bulk batches for very small fruit, and logged by date, plot and treatment across 18 harvest dates from August 16 to September 25, 2026. Fruit set was counted per plant on August 11, 2026.
- Disease and pest pressure: onset of disease and pest damage (hornworm, stink bug, blossom end rot, leaf curl) was noted by plot and date in a plot observation log.
- Nutrient density: samples were sent to Apical Ag (Apical Crop Science LLC) for Leaf Extract Analysis (new and old leaf, September 2, 2025) and Crop Nutrient Analysis of fruit (August 24, 2026).
- Weather: daily high and low temperature and precipitation from NWS weather reports for Dulles Airport (KIAD) were overlaid on harvest and application dates.

Water testing
All teas in this project were brewed with water from the farm well, which was tested twice.
A Culligan Micro Special analysis (June 7, 2023) found E. coli not detected and total coliform detected.
A Virginia Household Water Quality Program analysis (sample #36885, March 25, 2026) found E. coli absent (non-detect) and total coliform present at 26.2 MPN/100ml, with nitrate at 3.4 mg/L, pH 6.4, and all health-based metals within limits except first-draw copper (1.3 mg/L; 0.7 mg/L after flushing).
The water met the E. coli standard both times. The coliform result means the well is not sterile, and coliform bacteria from the water may contribute to the low levels of Enterobacteriaceae DNA seen in the unfed tea.
Water test results can be found here.
Measuring Nutrient Density in Crops
The original plan was to send tomato samples to the Bionutrient Institute (Bionutrient Food Association) for nutrient-density analysis. When the Bionutrient Institute could not accept our tomato samples, they referred us to Apical Crop Science as a comparable lab. Apical extracts sap from the tissue, dilutes it, and measures each analyte on an automated spectrophotometer against calibration curves.
Their CNA (crop nutrient analysis) report compares each value against a crop-specific "value desired" built from USDA FoodData Central, the UK CoFID database, and Apical's own internal data.
Location and Choice and Map Plotting
The research was conducted in the production garden on our farm, Bethany Farm, 41558 Stumptown Rd., Leesburg, VA 20176, using nine 6 x 4 ft beds (24 sq ft each).
In 2026 the nine beds were arranged in a 3 x 3 grid (row A at the bottom near the entrance and lowest elevation, row B in the middle, row C at the top), with each of three treatments assigned to one bed in every row:
| Row | Column 1 | Column 2 | Column 3 |
|
C (top) |
C1 Control |
C2 Compost Tea |
C3 Fertilized |
|
B (middle) |
B1 Compost Tea |
B2 Control |
B3 Fertilized |
|
A (bottom) |
A1 Control |
A2 Fertilized |
A3 Compost Tea |
- Compost Tea (ACT): humic acid-fed ACT, 10 gallons per application from a watering can as a combined foliar spray and root drench.
- Fertilized: Espoma Tomato-tone (3-4-6, organic), 3 tbsp per bed plus 10 gallons of water, applied on the same dates as ACT.
- Control: 10 gallons of plain well water on the same dates.
Variables: crop yield, pest and disease incidence, nutrient density.
Cooperators
- - Technical Advisor (Researcher)
- - Producer (Educator and Researcher)
- - Technical Advisor (Educator and Researcher)
- - Technical Advisor (Researcher)
- - Technical Advisor (Researcher)
Research
Compost Tea Microbiology
-
Feed type, not brew time, was the main driver of the compost tea microbiome. Molasses alone and molasses with humic acid were the only feeds rated non-pathogen-promoting and effective at both 12 and 24 hours, while every kelp-containing tea was pathogen-promoting by 24 hours.
We sent 33 compost tea samples to the lab. Each tea came from the same base compost, but we fed the brews different things (alfalfa, molasses, kelp meal, fish hydrolysate, humic acid, and combinations of these). Samples were taken at 12 hours and 24 hours of brewing, plus one sample of the starting compost before brewing. AggregoData returned 2,280,904 DNA reads in total (38,239 to 77,760 per sample), classified down to genus.
1. Big picture of "who's there"
The lab looked at the bacteria by reading their DNA. In every tea, most of the bacteria belonged to a few big groups (phyla): Proteobacteria, Firmicutes, Bacteroidota, and Actinobacteriota.
These groups showed up in all the teas, no matter what we fed them. The unbrewed compost (time 0) already had a mix of these groups, with Proteobacteria making up only about a fifth of it. Once we started bubbling and feeding the teas, the balance shifted toward Proteobacteria, but the same major groups stayed present.
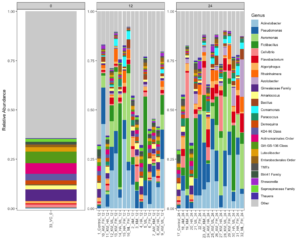
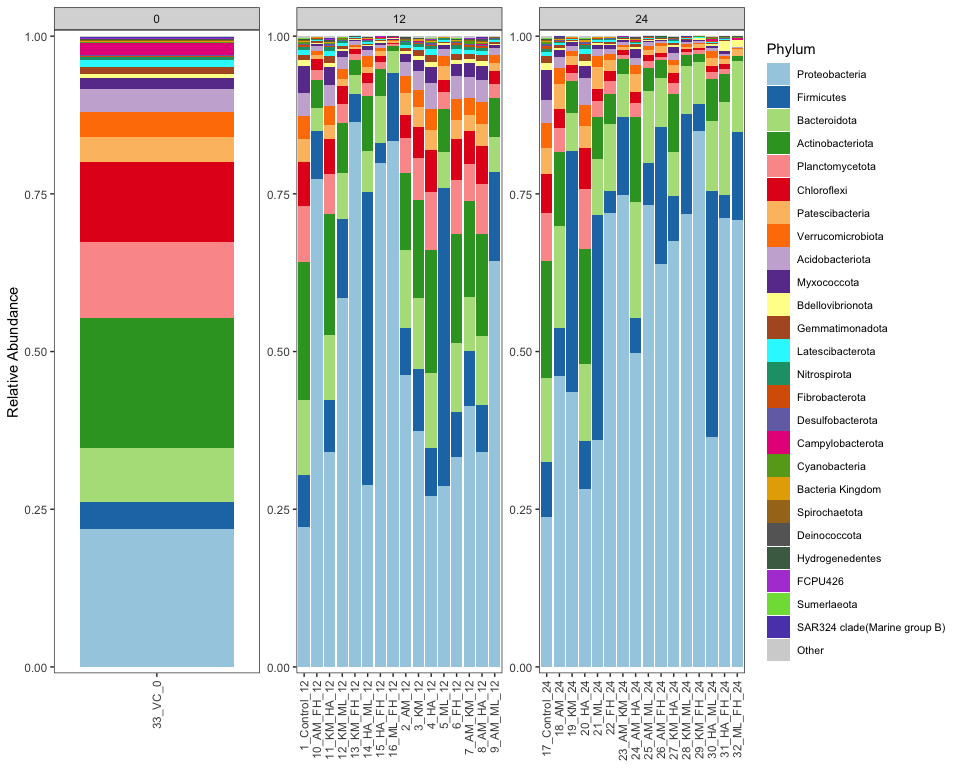
Figure 1. Relative abundance by phylum, grouped by brew time (0, 12 and 24 hours). Proteobacteria (light blue) rose from about 22% of the unbrewed vermicompost to as much as 85% in some fed teas. The unfed and humic acid teas stayed closest to the starting compost.
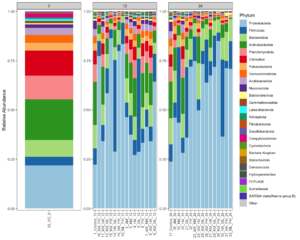
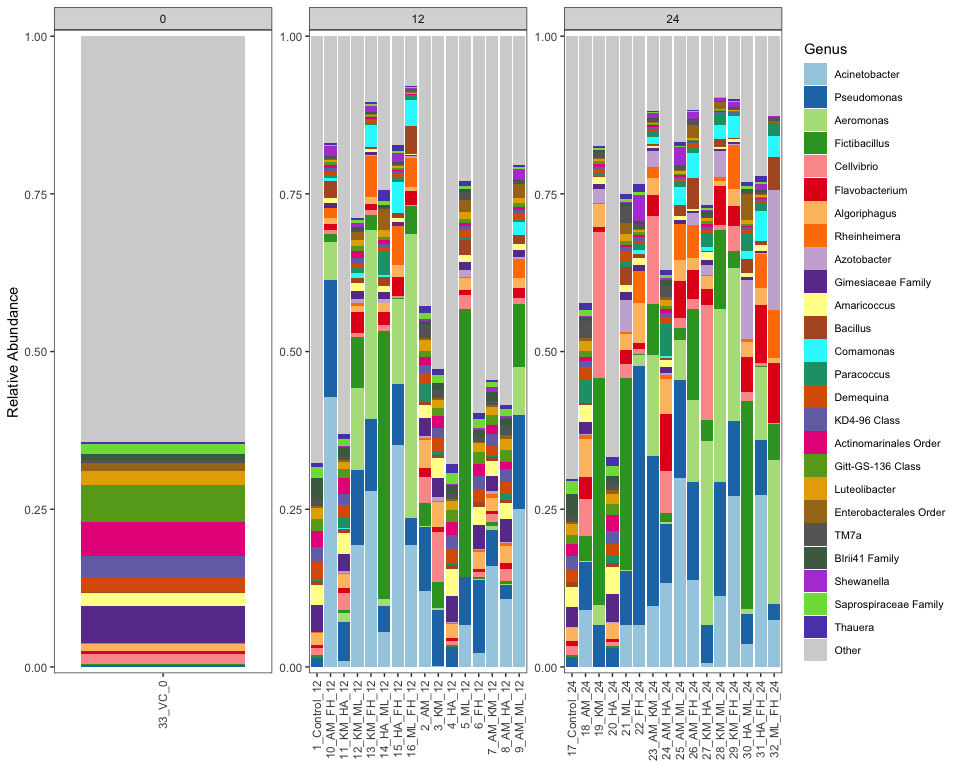
Figure 2. Relative abundance by genus. In the unbrewed vermicompost, about 64% of reads fall in "Other", meaning many small genera. Fed teas are dominated by a handful of named genera, chiefly Acinetobacter, Pseudomonas, Aeromonas and Fictibacillus.
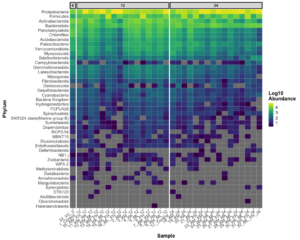
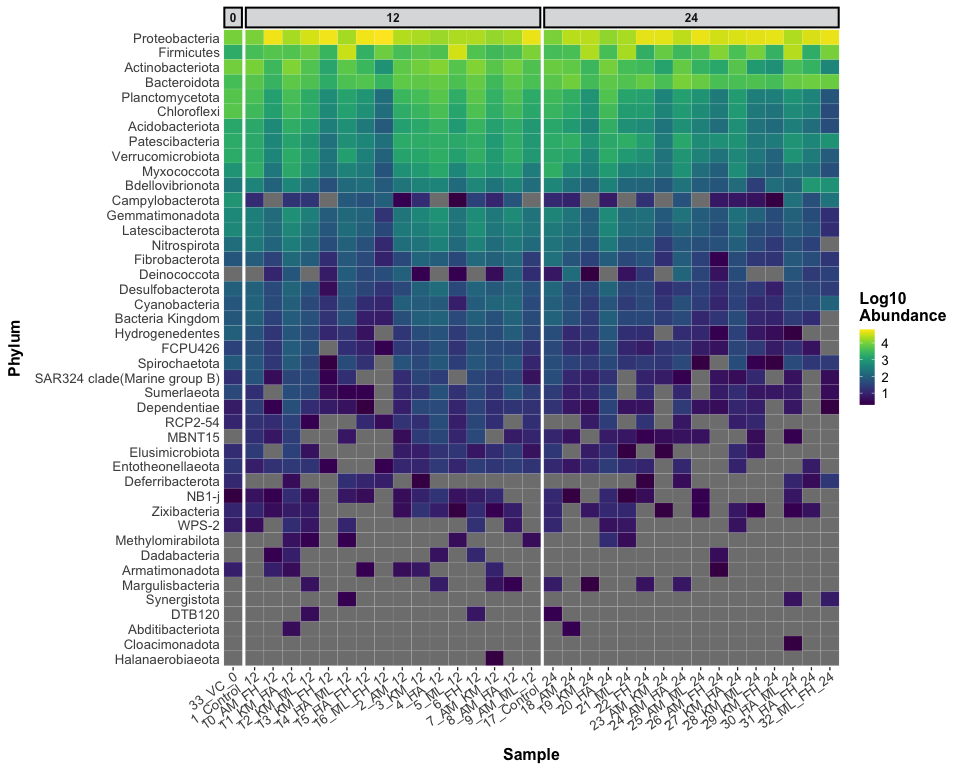
Figure 3. Heatmap of phylum abundance (log10 read counts; grey = not detected). Rare phyla present in the vermicompost disappear from many of the brews, most often at 24 hours.
2. Safety and effectiveness rating of every tea
Each tea was rated with the DNA-based definitions under Defining Terminology.
Values are the percent of DNA reads in each sample, shown as 12 hr / 24 hr.
NPP = non-pathogen-promoting or "safe" as per our definition above
PP = pathogen-promoting.
|
Treatment |
Enterobacteriaceae (%) |
PGPBs (%) |
Shannon index |
Rating 12 hr / 24 hr |
|---|---|---|---|---|
|
Vermicompost, unbrewed |
0.00 |
1.7 |
6.06 |
Baseline |
|
No Feed (Control) |
0.06 / 0.08 |
3.9 / 4.5 |
5.22 / 5.54 |
Reference |
|
Molasses |
0.04 / 0.00 |
61.4 / 56.8 |
4.28 / 4.54 |
NPP & Effective / NPP & Effective |
|
Humic Acids + Molasses |
0.04 / 0.02 |
56.7 / 59.4 |
4.33 / 4.43 |
NPP & Effective / NPP & Effective |
|
Fish Hydrolysate |
0.02 / 0.04 |
16.3 / 50.6 |
5.95 / 4.69 |
NPP / NPP & Effective |
|
Alfalfa + Humic Acids |
0.04 / 0.02 |
15.8 / 34.8 |
5.72 / 5.26 |
NPP / NPP & Effective |
|
Alfalfa + Fish Hydrolysate |
0.07 / 0.14 |
67.5 / 56.2 |
4.52 / 4.61 |
NPP & Effective / PP |
|
Alfalfa + Molasses |
0.06 / 0.11 |
53.9 / 56.6 |
4.97 / 4.81 |
NPP & Effective / PP |
|
Humic Acids + Fish Hydrolysate |
0.10 / 0.07 |
50.1 / 47.6 |
4.88 / 5.07 |
PP (0.1004%, borderline) / NPP & Effective |
|
Alfalfa Meal |
0.03 / 0.04 |
29.0 / 25.9 |
5.54 / 5.60 |
NPP / NPP |
|
Humic Acids |
0.03 / 0.03 |
5.8 / 5.8 |
5.87 / 5.96 |
NPP / NPP |
|
Kelp + Humic Acids |
0.08 / 0.34 |
10.7 / 14.9 |
5.81 / 4.78 |
NPP / PP |
|
Alfalfa + Kelp |
0.08 / 0.44 |
25.4 / 49.3 |
4.75 / 4.48 |
NPP / PP |
|
Kelp Meal |
0.12 / 0.44 |
15.9 / 47.2 |
5.32 / 3.99 |
PP / PP |
|
Kelp + Molasses |
0.17 / 0.24 |
44.6 / 54.0 |
5.18 / 4.34 |
PP / PP |
|
Kelp + Fish Hydrolysate |
0.49 / 0.69 |
43.8 / 45.9 |
4.47 / 4.53 |
PP / PP |
|
Molasses + Fish Hydrolysate |
1.38 / 2.01 |
35.6 / 50.2 |
4.09 / 4.32 |
PP / PP |
Source: AggregoData Bacterial Microbiome Report (October 2024) and genus-level Krona data. Salmonella and Enterococcus were not detected in any sample.
- 9 of 30 fed tea samples were non-pathogen-promoting and effective.
Only molasses alone and humic acid + molasses qualified at both brew times.
Their PGPB share (57 to 61%) came mostly from Fictibacillus (30 to 42% of reads),
with Enterobacteriaceae at or below the unfed tea. - 13 of 30 fed tea samples were pathogen-promoting.
Kelp was in 8 of them and fish hydrolysate in 6.
Every kelp-containing tea was pathogen-promoting by 24 hours, driven mostly by Klebsiella and Enterobacter. - Molasses plus fish hydrolysate was the worst tea in the study, at 1.38% and 2.01% Enterobacteriaceae, 22 to 26 times the unfed tea, and was dominated by Aeromonas (45% of reads at 12 hours).
- Humic acid alone kept Enterobacteriaceae among the lowest and the community closest to the starting compost,
but it lifted PGPBs only to 5.8%, well short of the 30% effectiveness line.
Alfalfa alone came closest to the line without crossing it (26 to 29%).
3. What changed with different feeds
When we zoomed in to the genus level:
- Common names that showed up across samples included the following:
- Acinetobacter
- Pseudomonas
- Aeromonas
- Fictibacillus, and others. Their amounts changed from treatment to treatment, but they kept showing up across the board.
- Humic acid teas looked most like the unfed tea and the starting compost.
Their top genera were the same as the control (Gimesiaceae, Amaricoccus), with a modest lift in Pseudomonas. On the PCoA(Principal Coordinates Analysis) plot Fig. 11 below, their dot markings are shown close together, meaning they have very similar mixes of bacteria. - Molasses teas were taken over by Fictibacillus, a spore-forming genus identified as a potential plant growth promoter, which made up 30 to 42% of the bacterial reads in molasses alone and humic acid + molasses.
These 5-gallon buckets were strongly enriched in beneficial bacteria while staying low in Enterobacteriaceae. - Fish hydrolysate and kelp combinations were taken over by Aeromonas (up to 45% of reads) and Acinetobacter (up to 43%). Acinetobacter is counted as beneficial; Aeromonas is not, since some of its species are opportunistic pathogens.
These tea mixes also carried the most Enterobacteriaceae.
What the main beneficial bacteria do. Three genera made up most of the PGPB share in our teas. In each, helpful and harmful species share the same genus, and our sequencing identified bacteria only to genus, so these are what the genus can do, not proof of what our teas contained.
|
Genus |
Highest share of reads |
What helpful species do |
|---|---|---|
|
Pseudomonas |
41% (Fish Hydrolysate, 24 hr) |
Root-colonizing species such as P. fluorescens make siderophores (small molecules that bacteria release to grab iron from the soil) that lock up iron from disease organisms, produce the antibiotic 2,4-DAPG against fungal root diseases, and solubilize phosphorus |
|
Acinetobacter |
43% (Alfalfa + Fish Hydrolysate, 12 hr) |
Soil and root isolates solubilize phosphate and zinc, make the growth hormone IAA (an auxin which tells roots to stretch and grow) and siderophores, and increased root and shoot growth in pot trials; a strain from tomato also showed strong phosphate solubilization |
|
Fictibacillus |
43% (Humic Acids + Molasses, 12 hr) |
Spore-forming relative of Bacillus, separated as its own genus in 2013. F. barbaricus produced ammonia and raised tomato seed germination to 80% in one study. Note: Spore-forming in bacteria is different than spores from fungi. When conditions turn bad (drying out, heat, lack of food), spore-forming bacterium like Bacillus or Fictibacillus builds a tough, dormant shell inside itself. That spore can survive drought, heat, freezing, UV light and many chemicals for years. When moisture and food come back, it "wakes up" and becomes an active cell again. |
Because the molasses result rests mostly on Fictibacillus, it is the least certain of our effectiveness findings. AggregoData's new species-level pipeline could settle which species were present.
The Krona plots below show each sample's community from phylum (inner ring) to genus (outer ring). A balanced tea looks like a wheel of many thin slices; a tea that one group has taken over shows one or two wide wedges.

Figure 4. Unbrewed vermicompost (time 0). The most even wheel of any sample, no genus above about 6%, and no Enterobacteriaceae detected. Shannon 6.06.
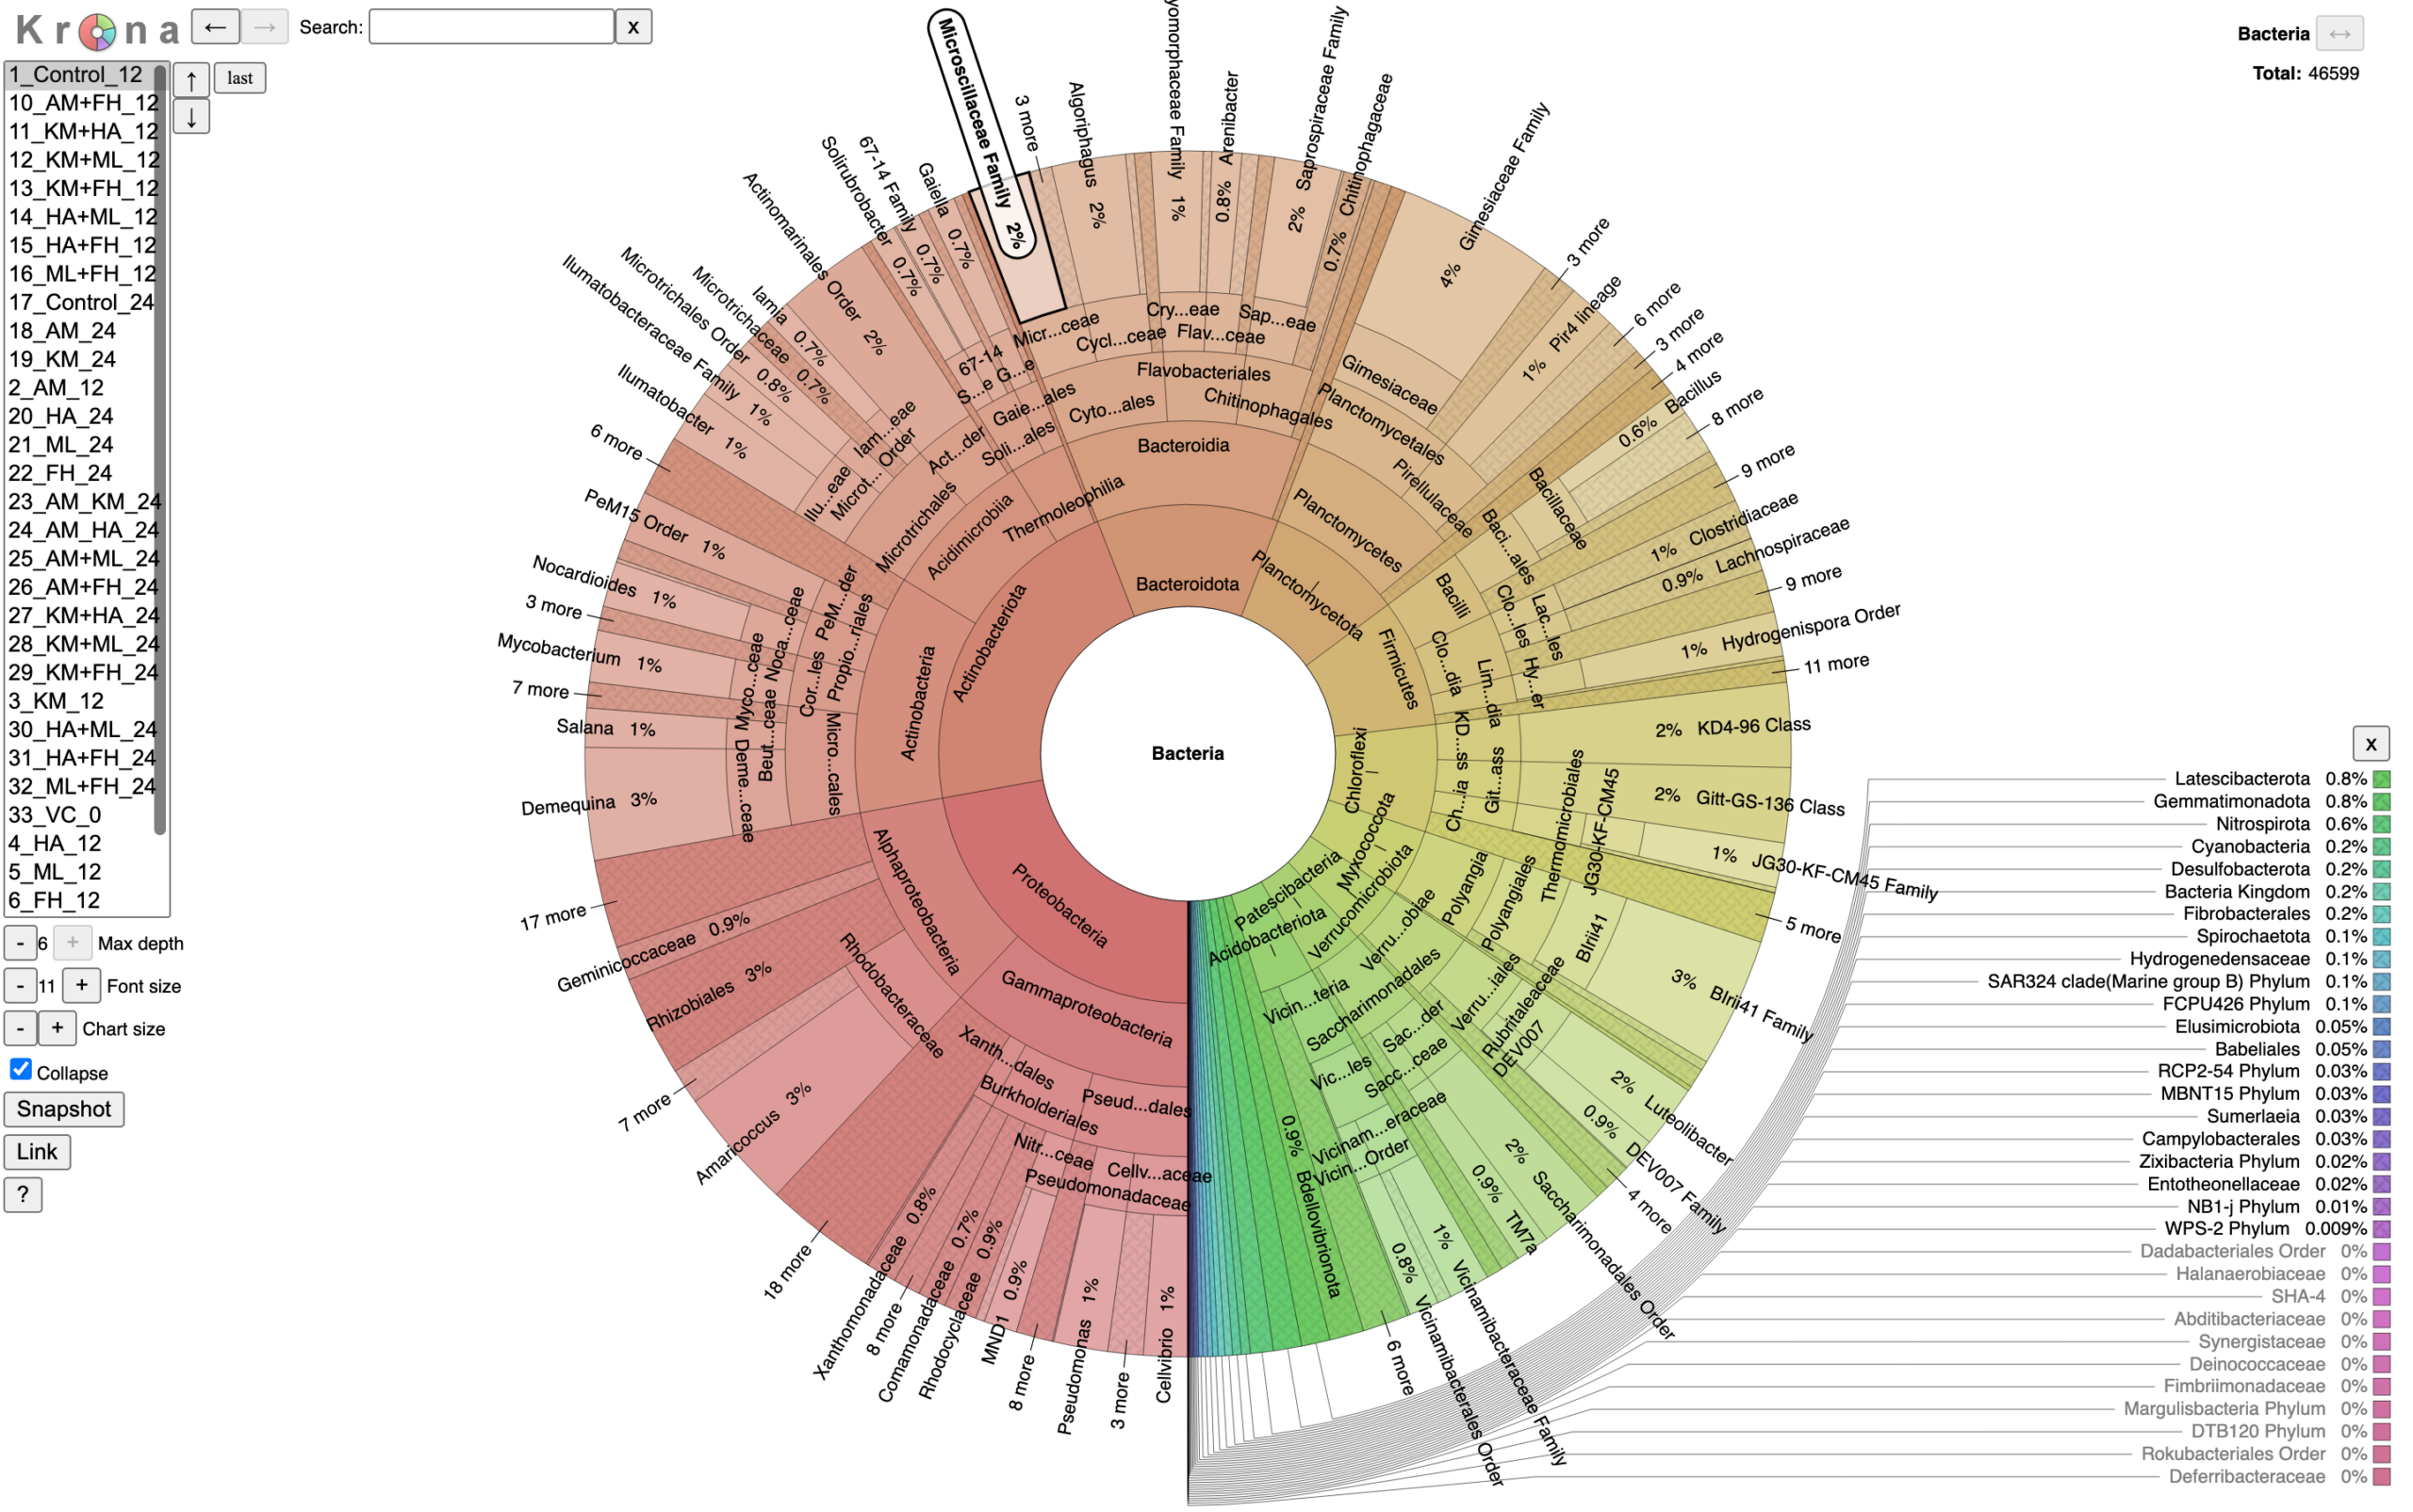
Figure 5. Unfed tea (No Feed Control), 12 hours.
The reference community: many small slices, no genus above about 4% (Gimesiaceae, Blrii41, Amaricoccus). Enterobacteriaceae 0.06%, PGPBs 3.9%, Shannon 5.22.
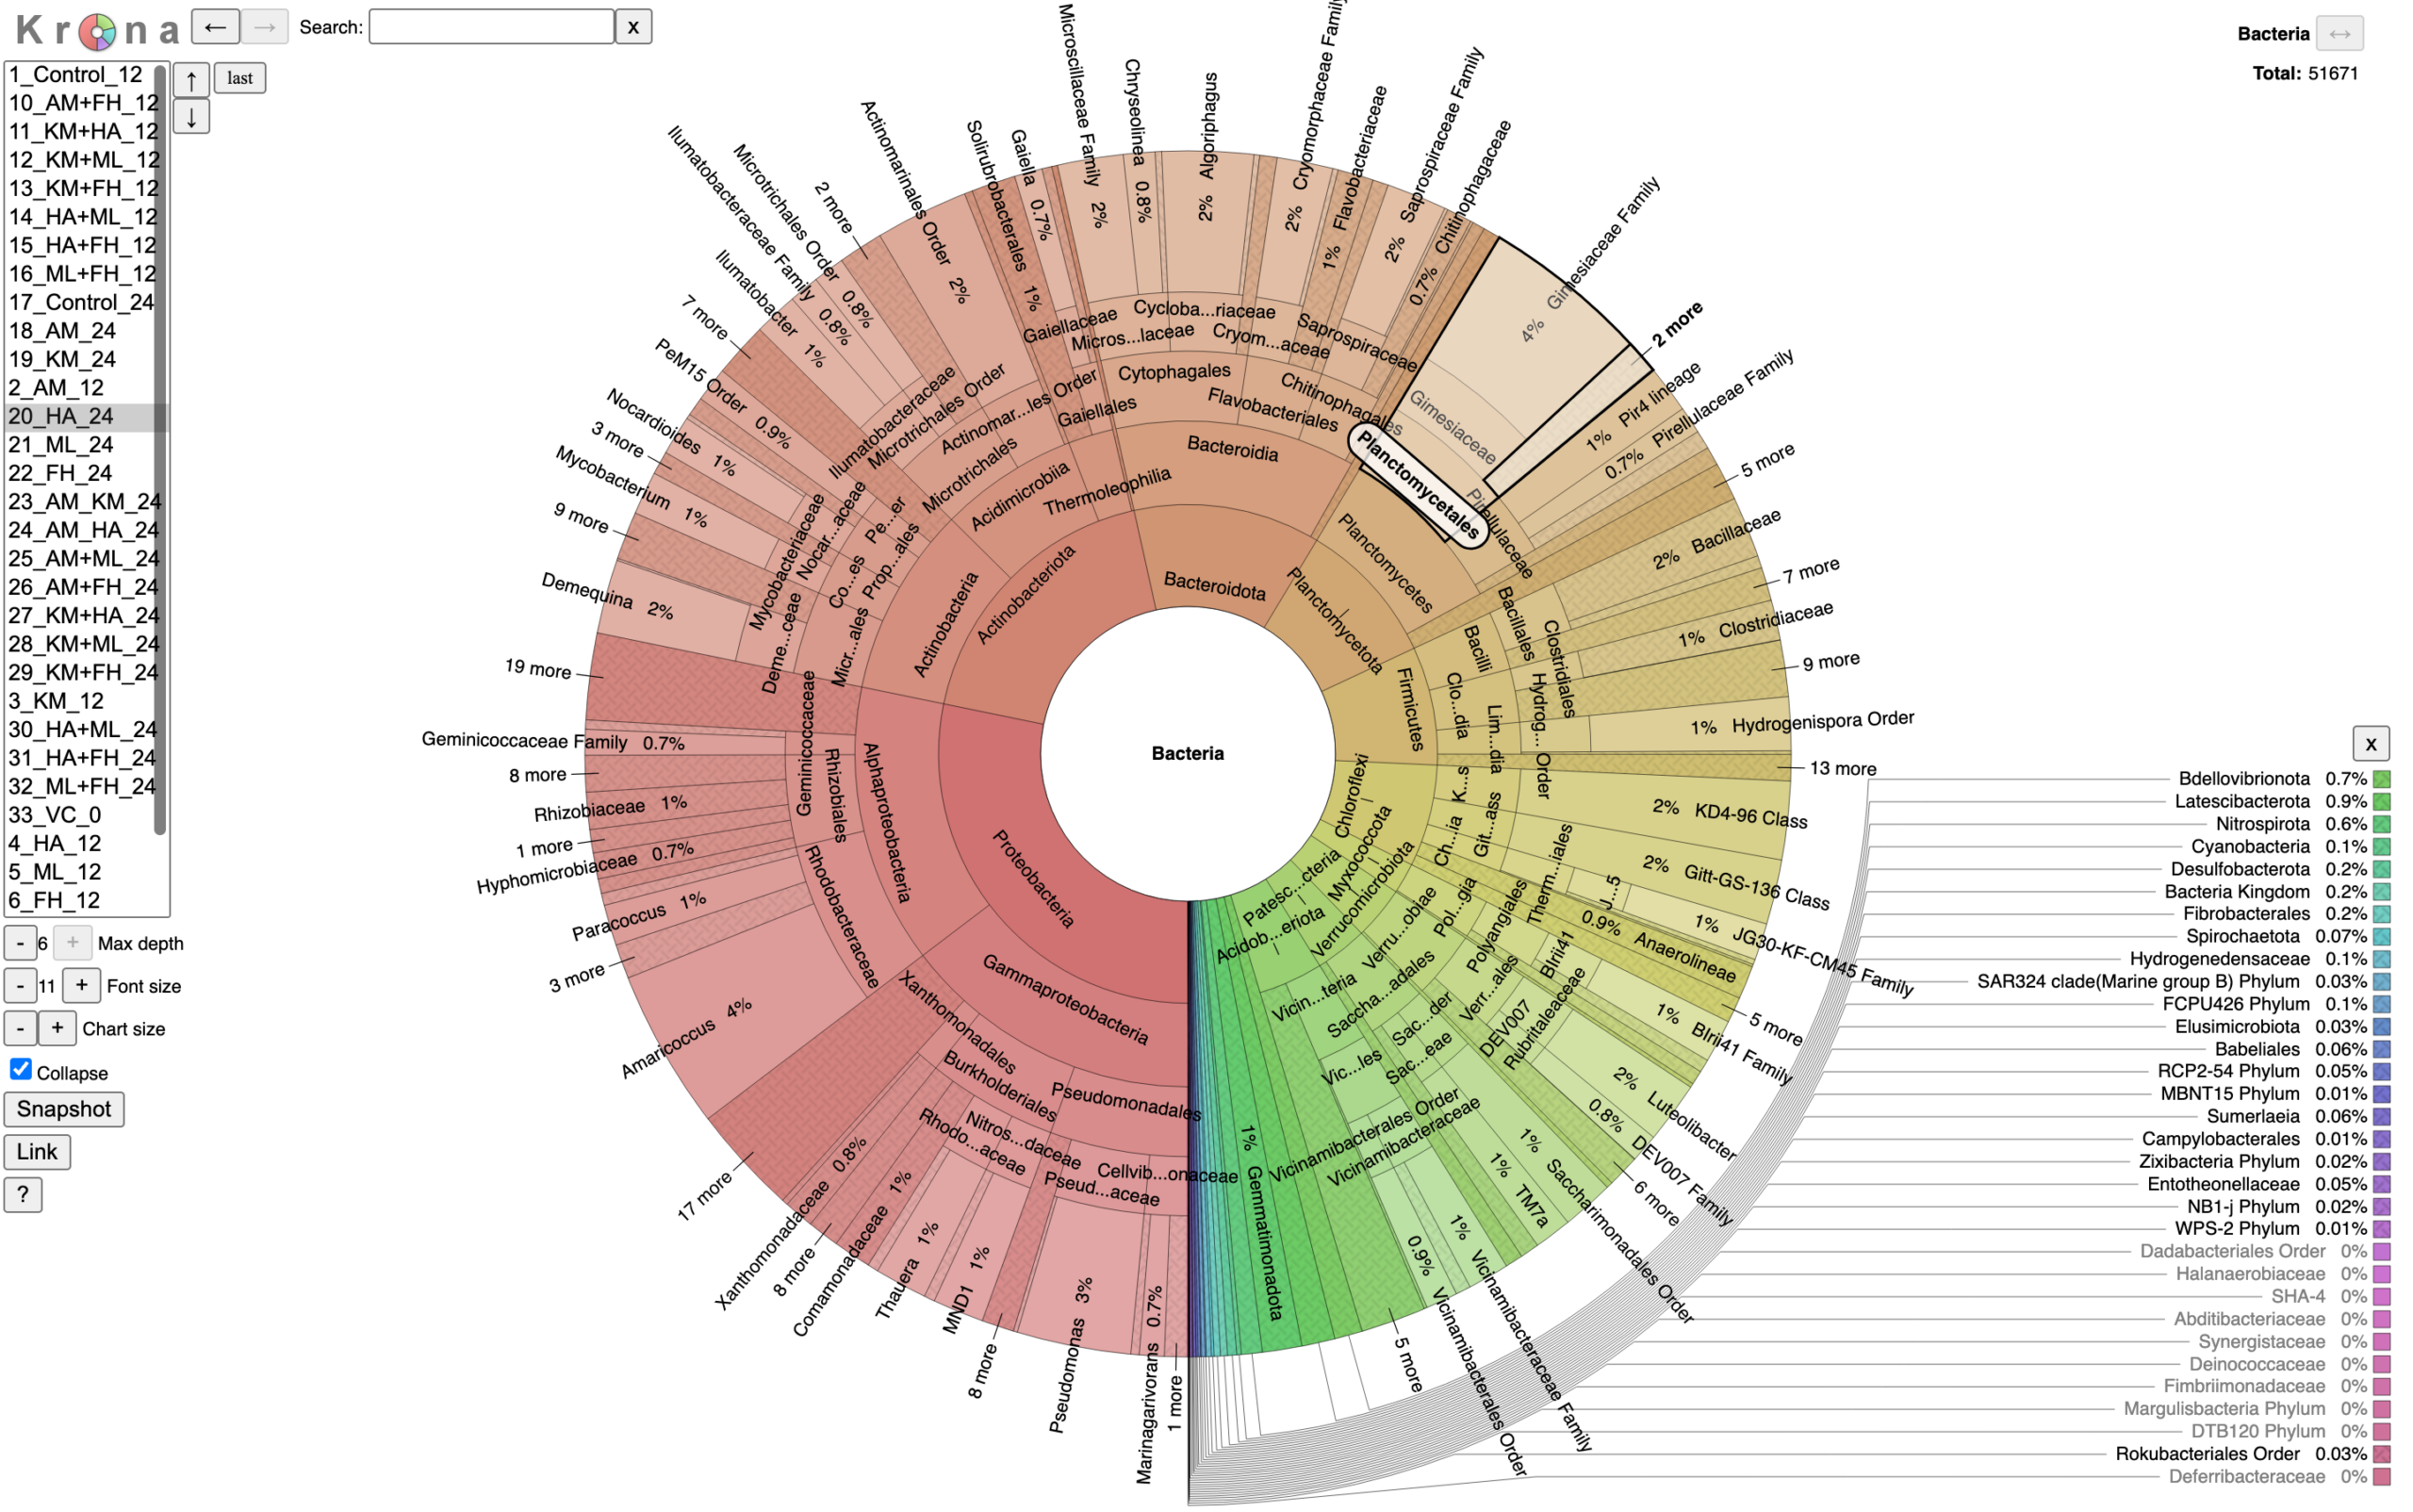
Figure 6. Humic Acids, 24 hours (Non-pathogen-promoting).
Nearly the same community as the unfed tea, with Pseudomonas lifted to 3%.
Enterobacteriaceae 0.03%,
PGPBs 5.8%, Shannon 5.96, the most rich tea in the study.
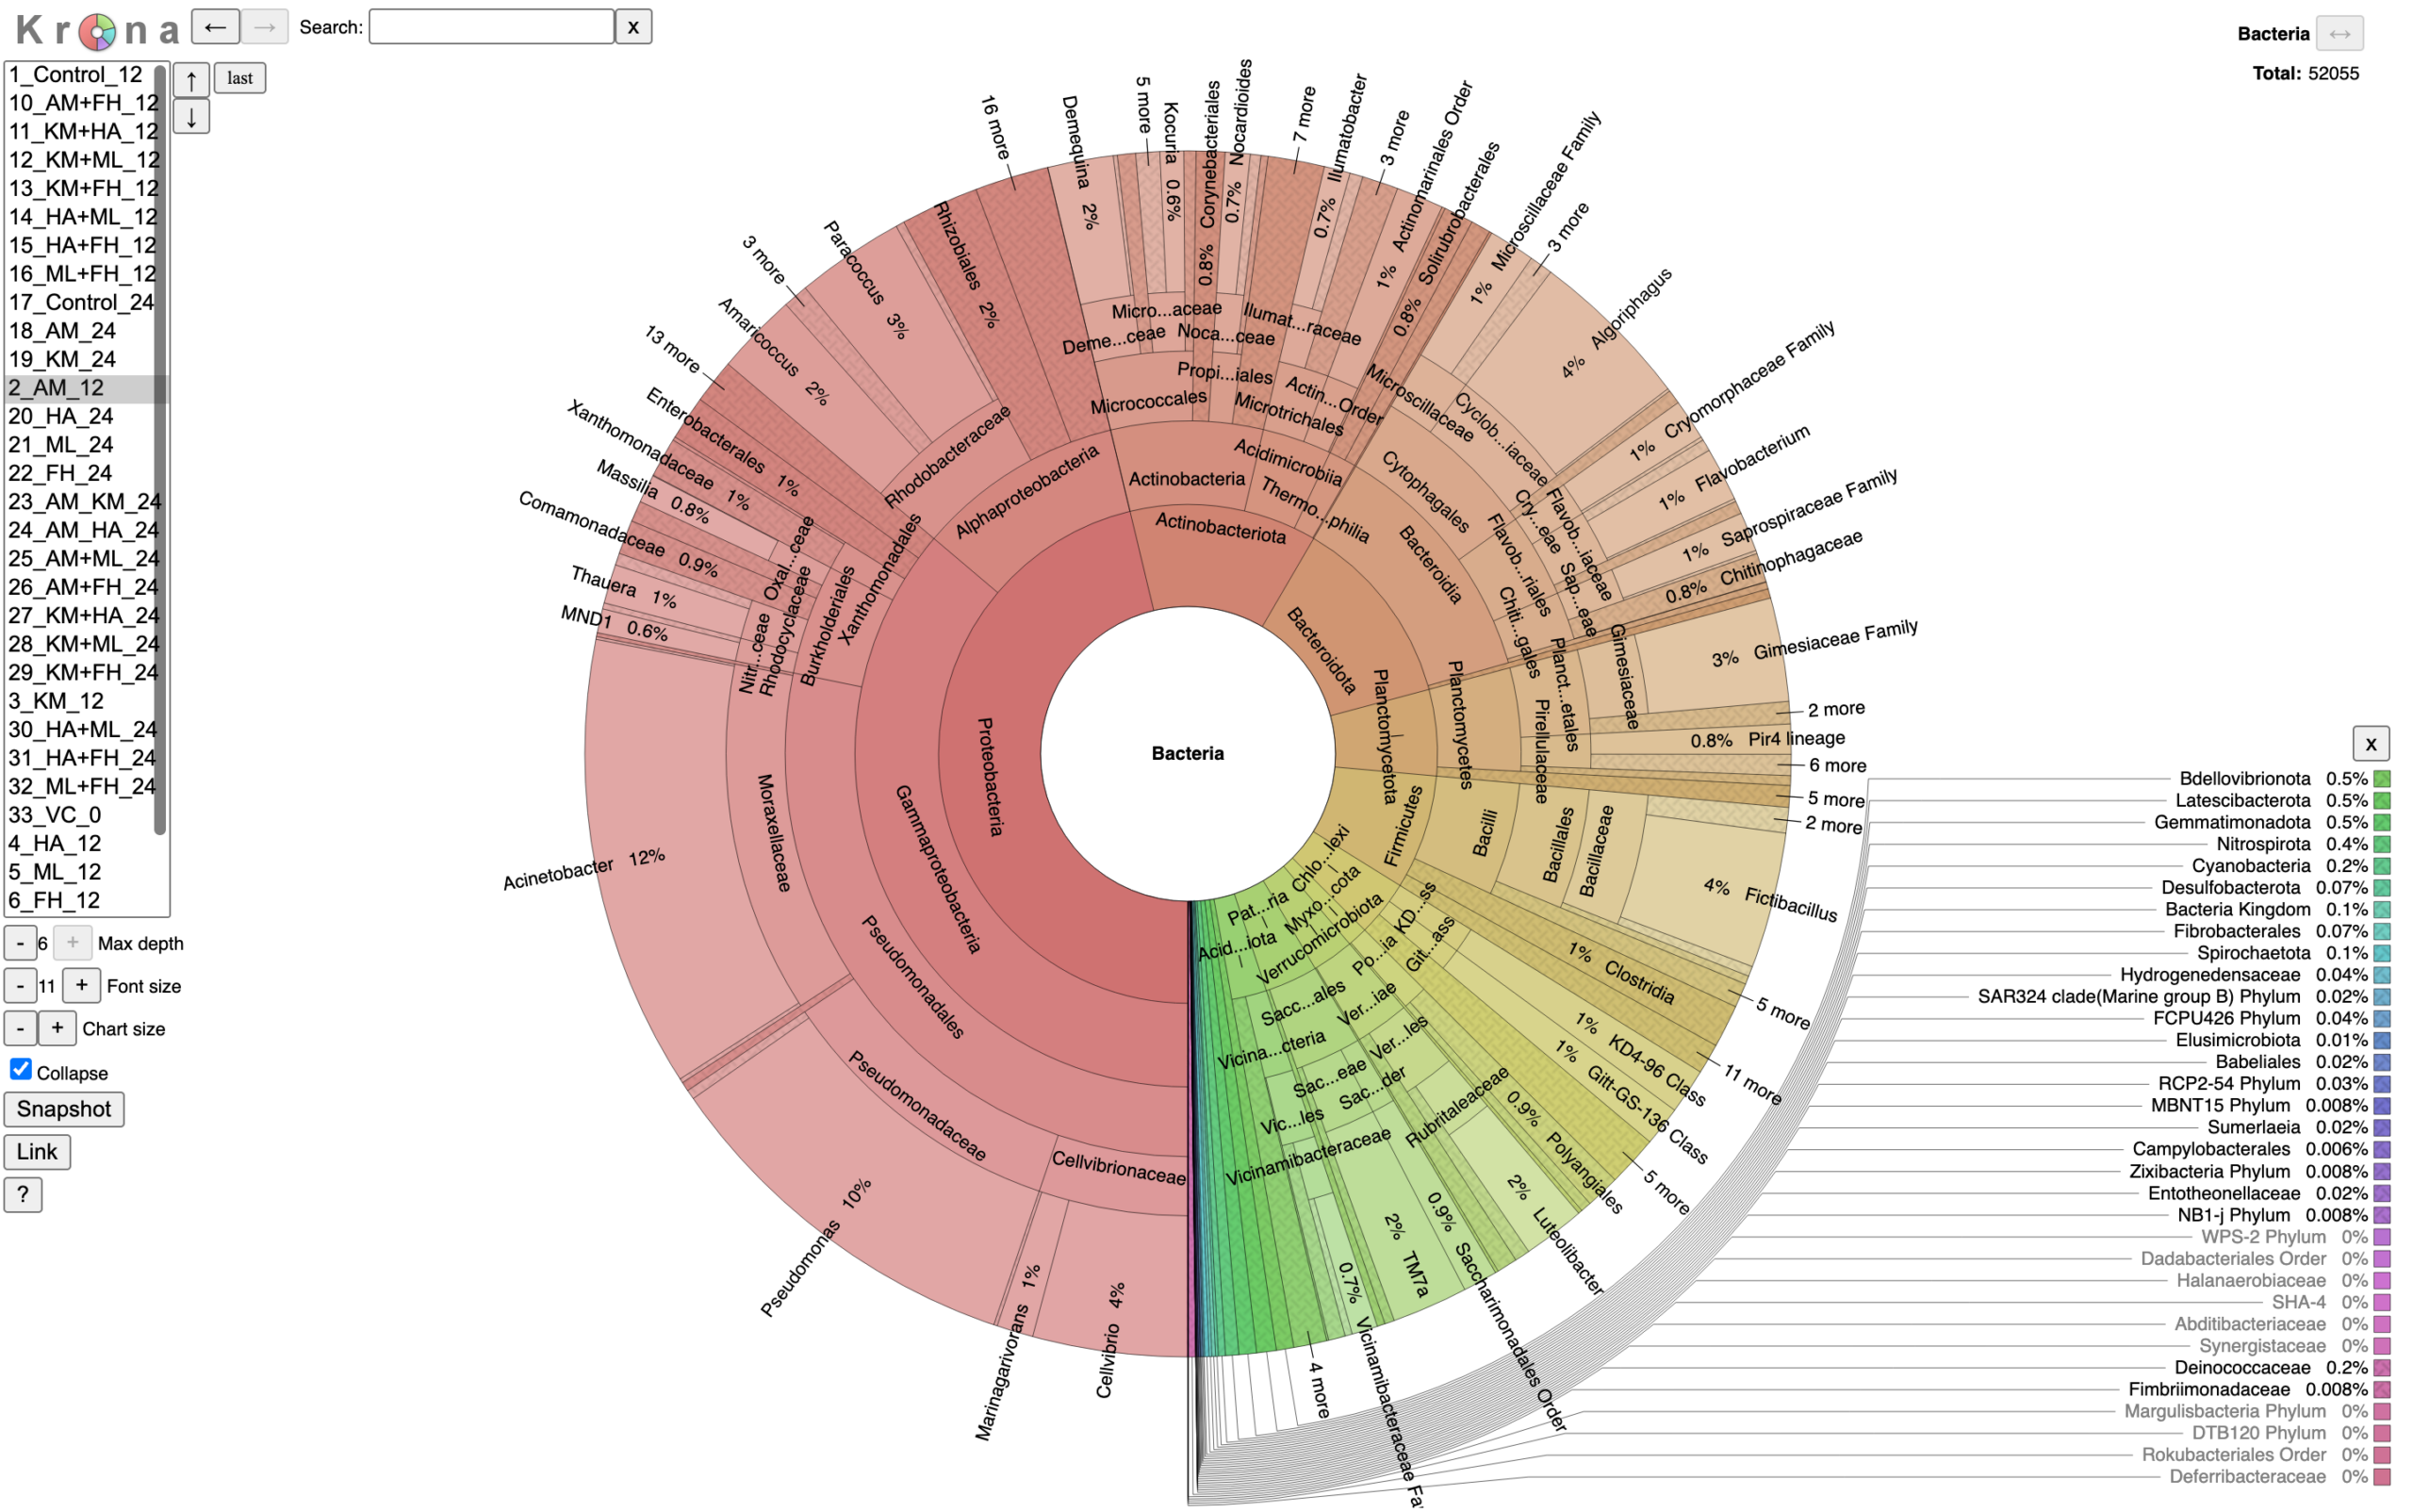
Figure 7. Alfalfa Meal, 12 hours (Non-pathogen-promoting).
Acinetobacter (12%) and Pseudomonas (10%) grow, but the rest of the wheel stays broad.
PGPBs 29.0%, just under the 30% effectiveness line. Shannon 5.54.
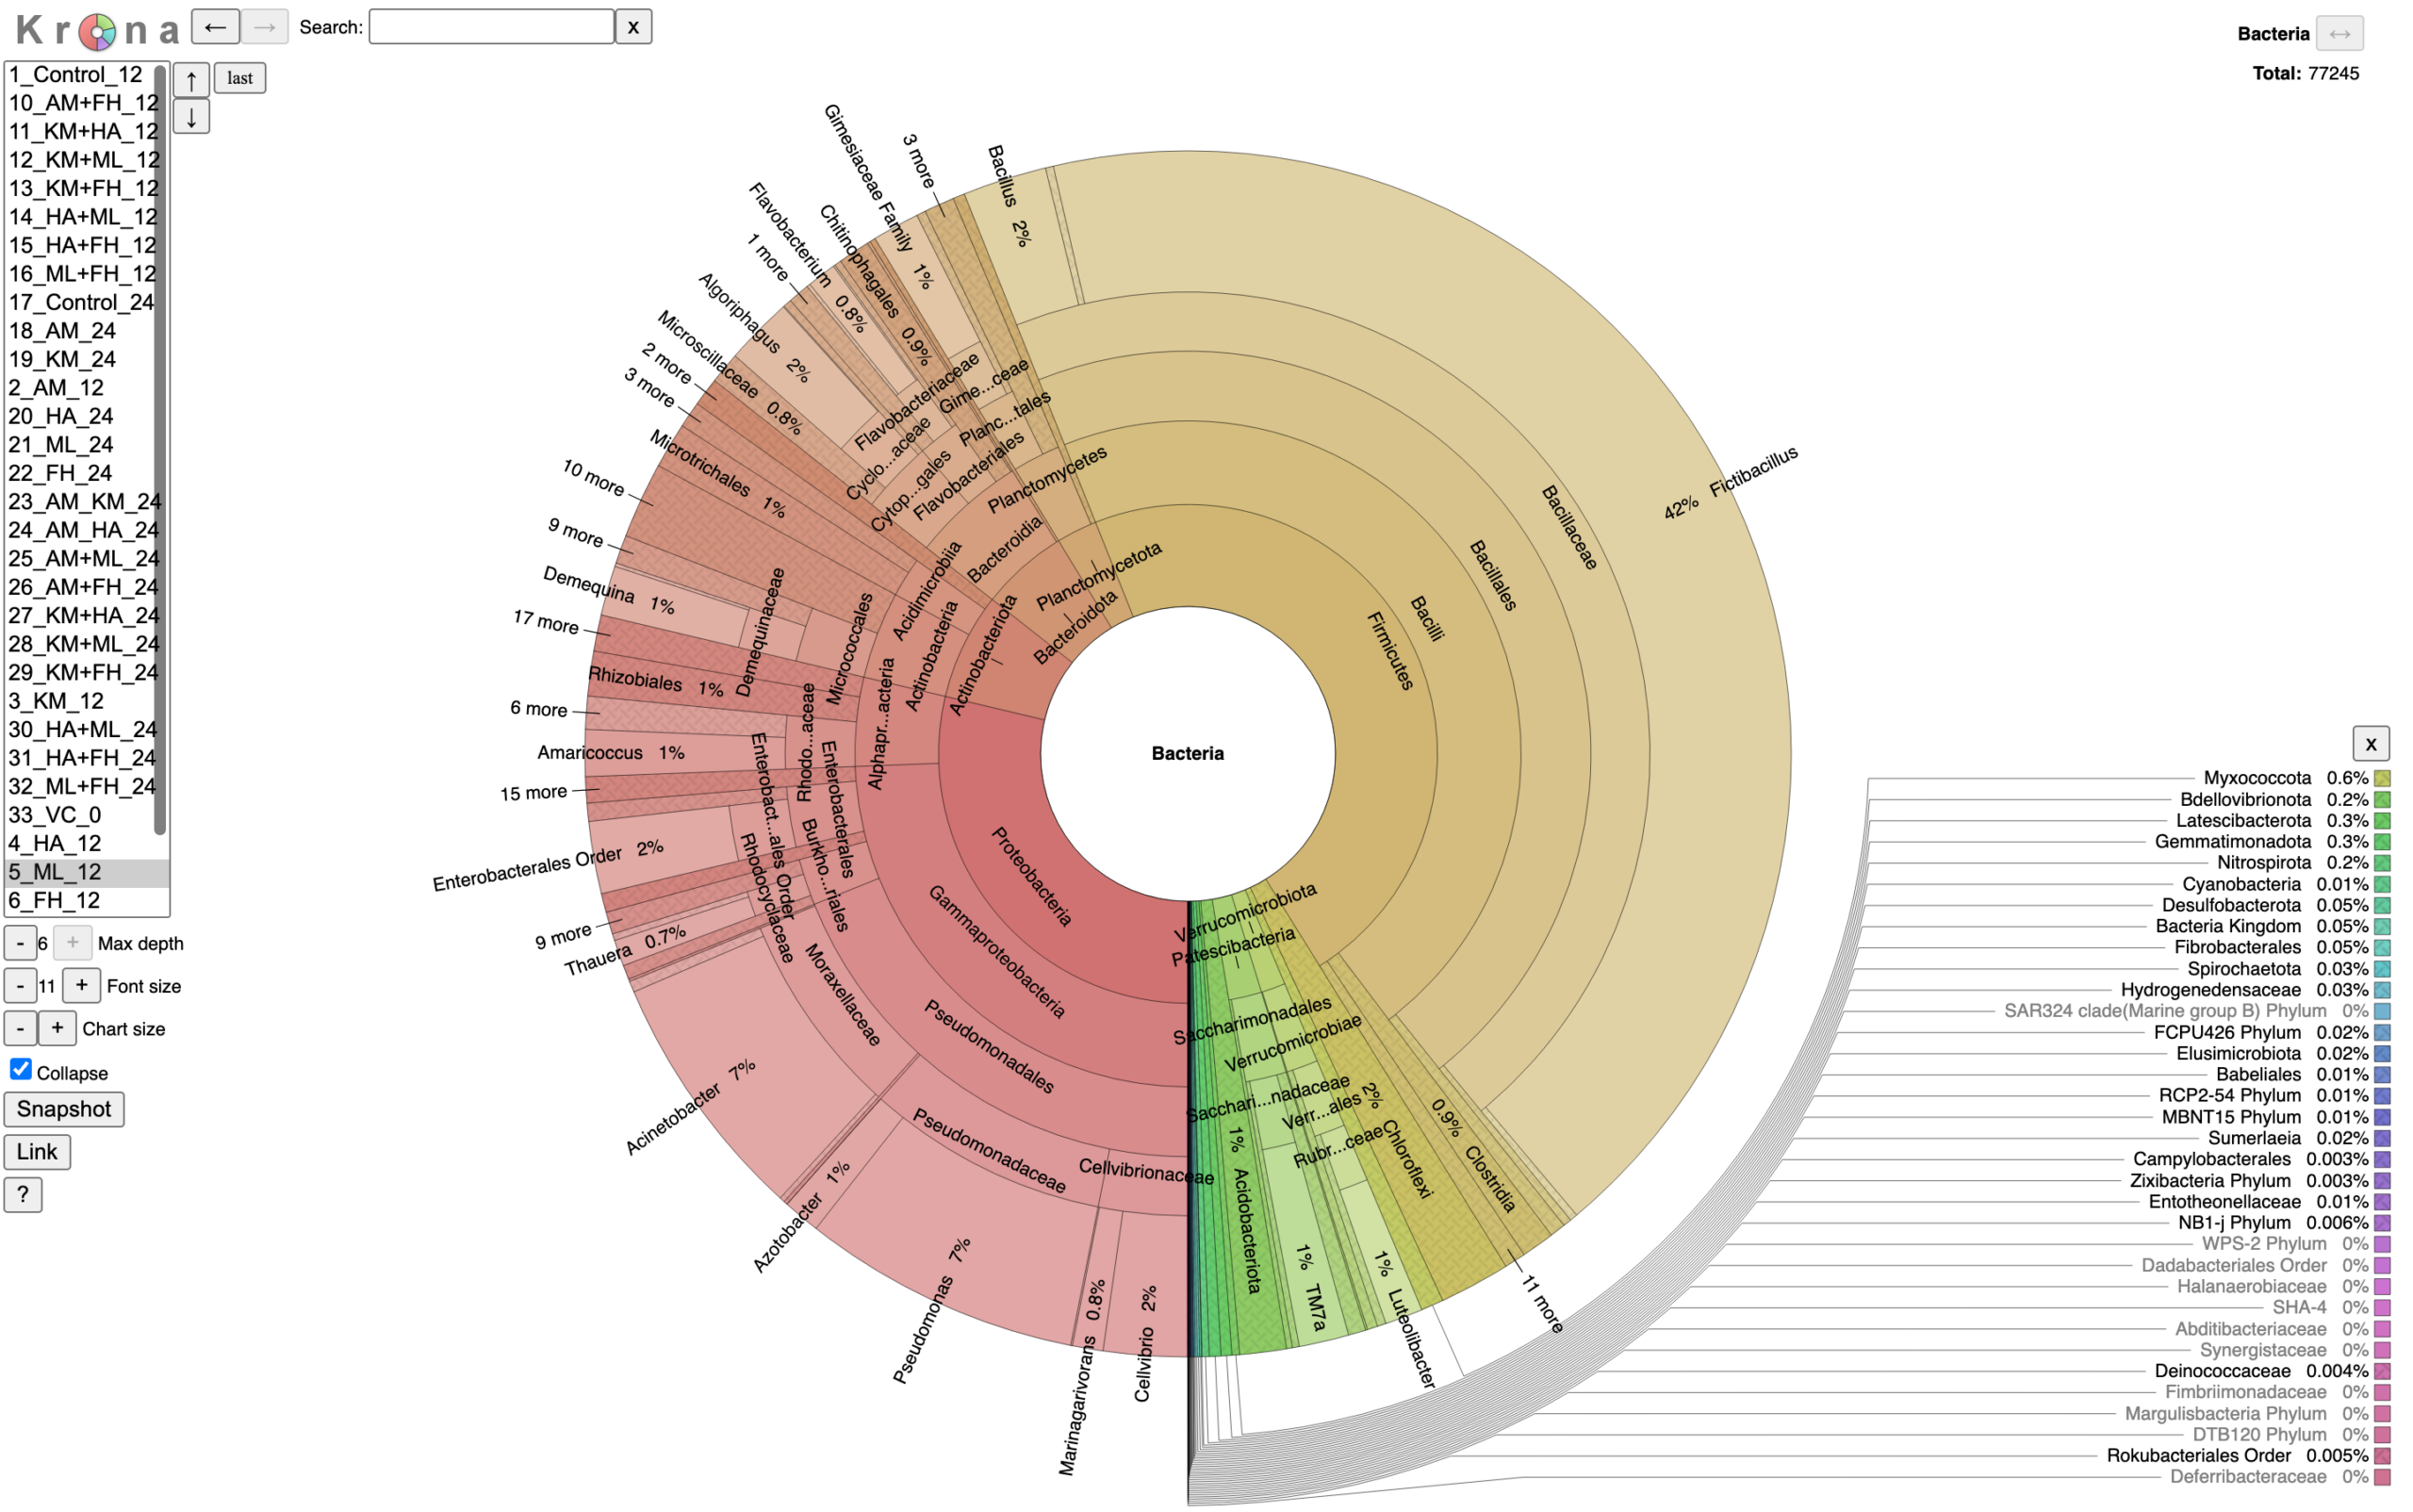
Figure 8. Molasses, 12 hours (Non-pathogen-promoting & Effective).
Fictibacillus, a potential plant growth promoter, takes 42% of the tank.
PGPBs 61.4%, Enterobacteriaceae 0.04%, Shannon 4.28.
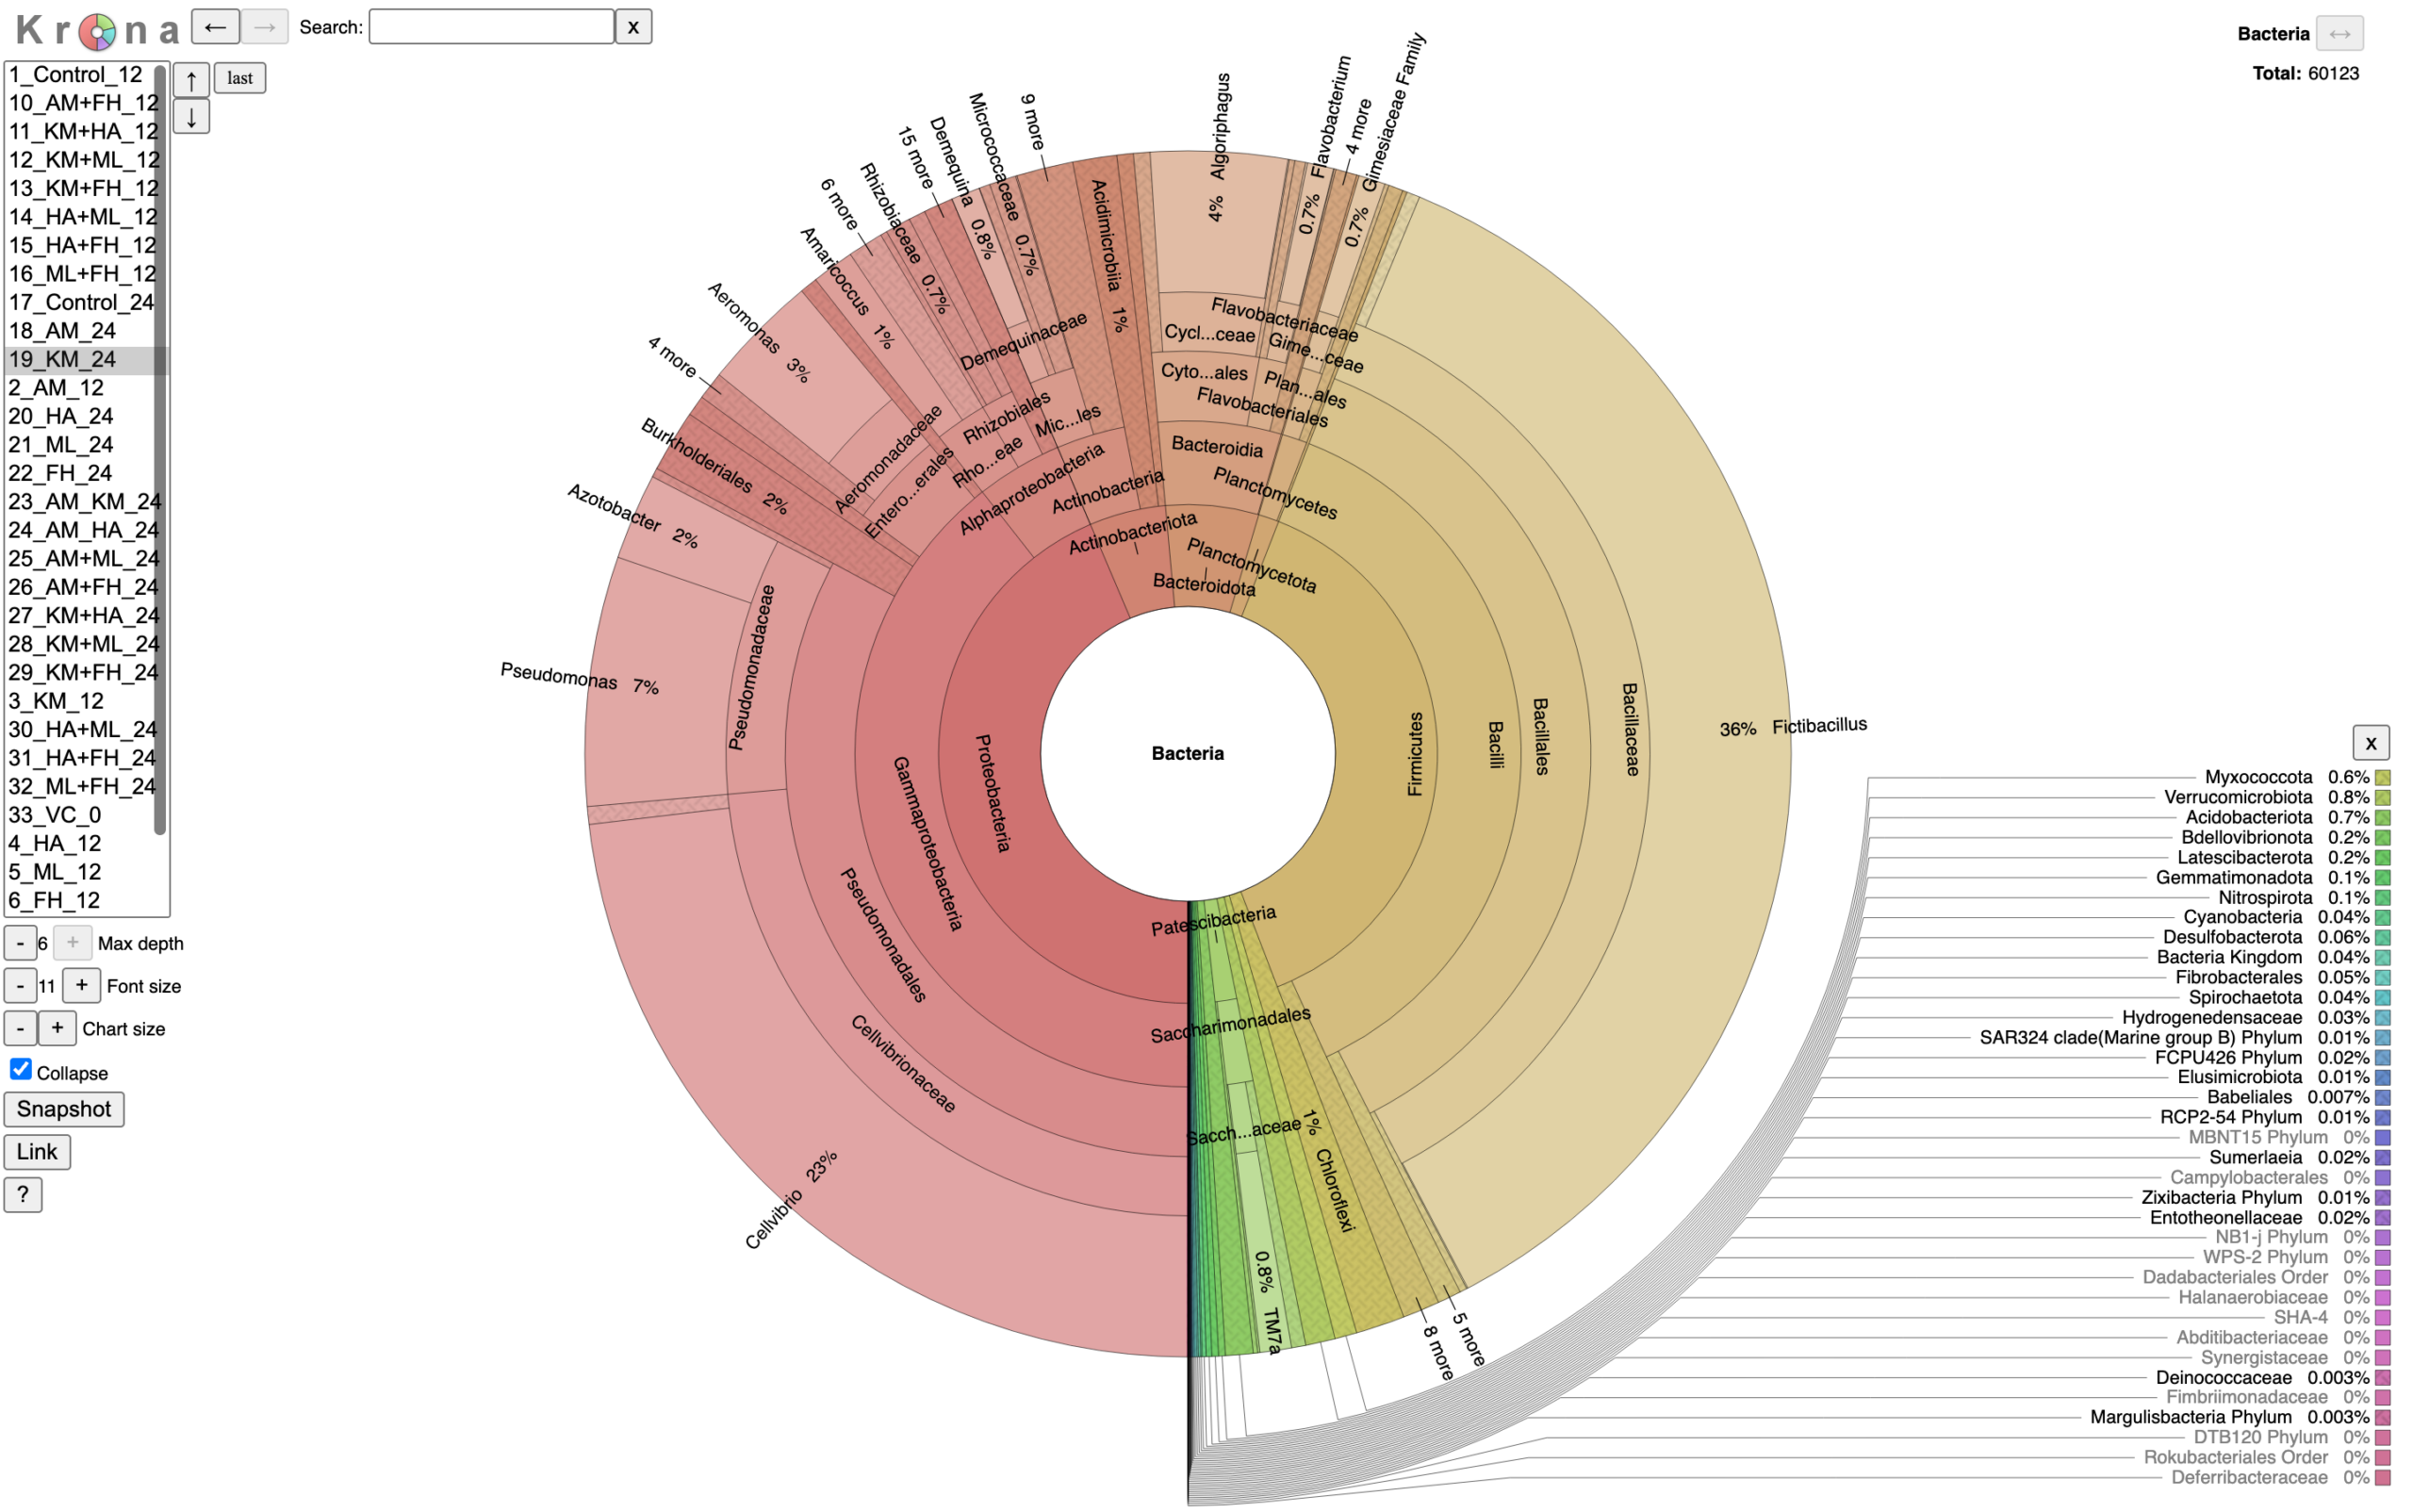
Figure 9. Kelp Meal, 24 hours (Pathogen-promoting).
Fictibacillus (36%) and Cellvibrio (23%) dominate;
Shannon 3.99 is the lowest in the study, and Enterobacteriaceae reach 0.44%, mostly Klebsiella.
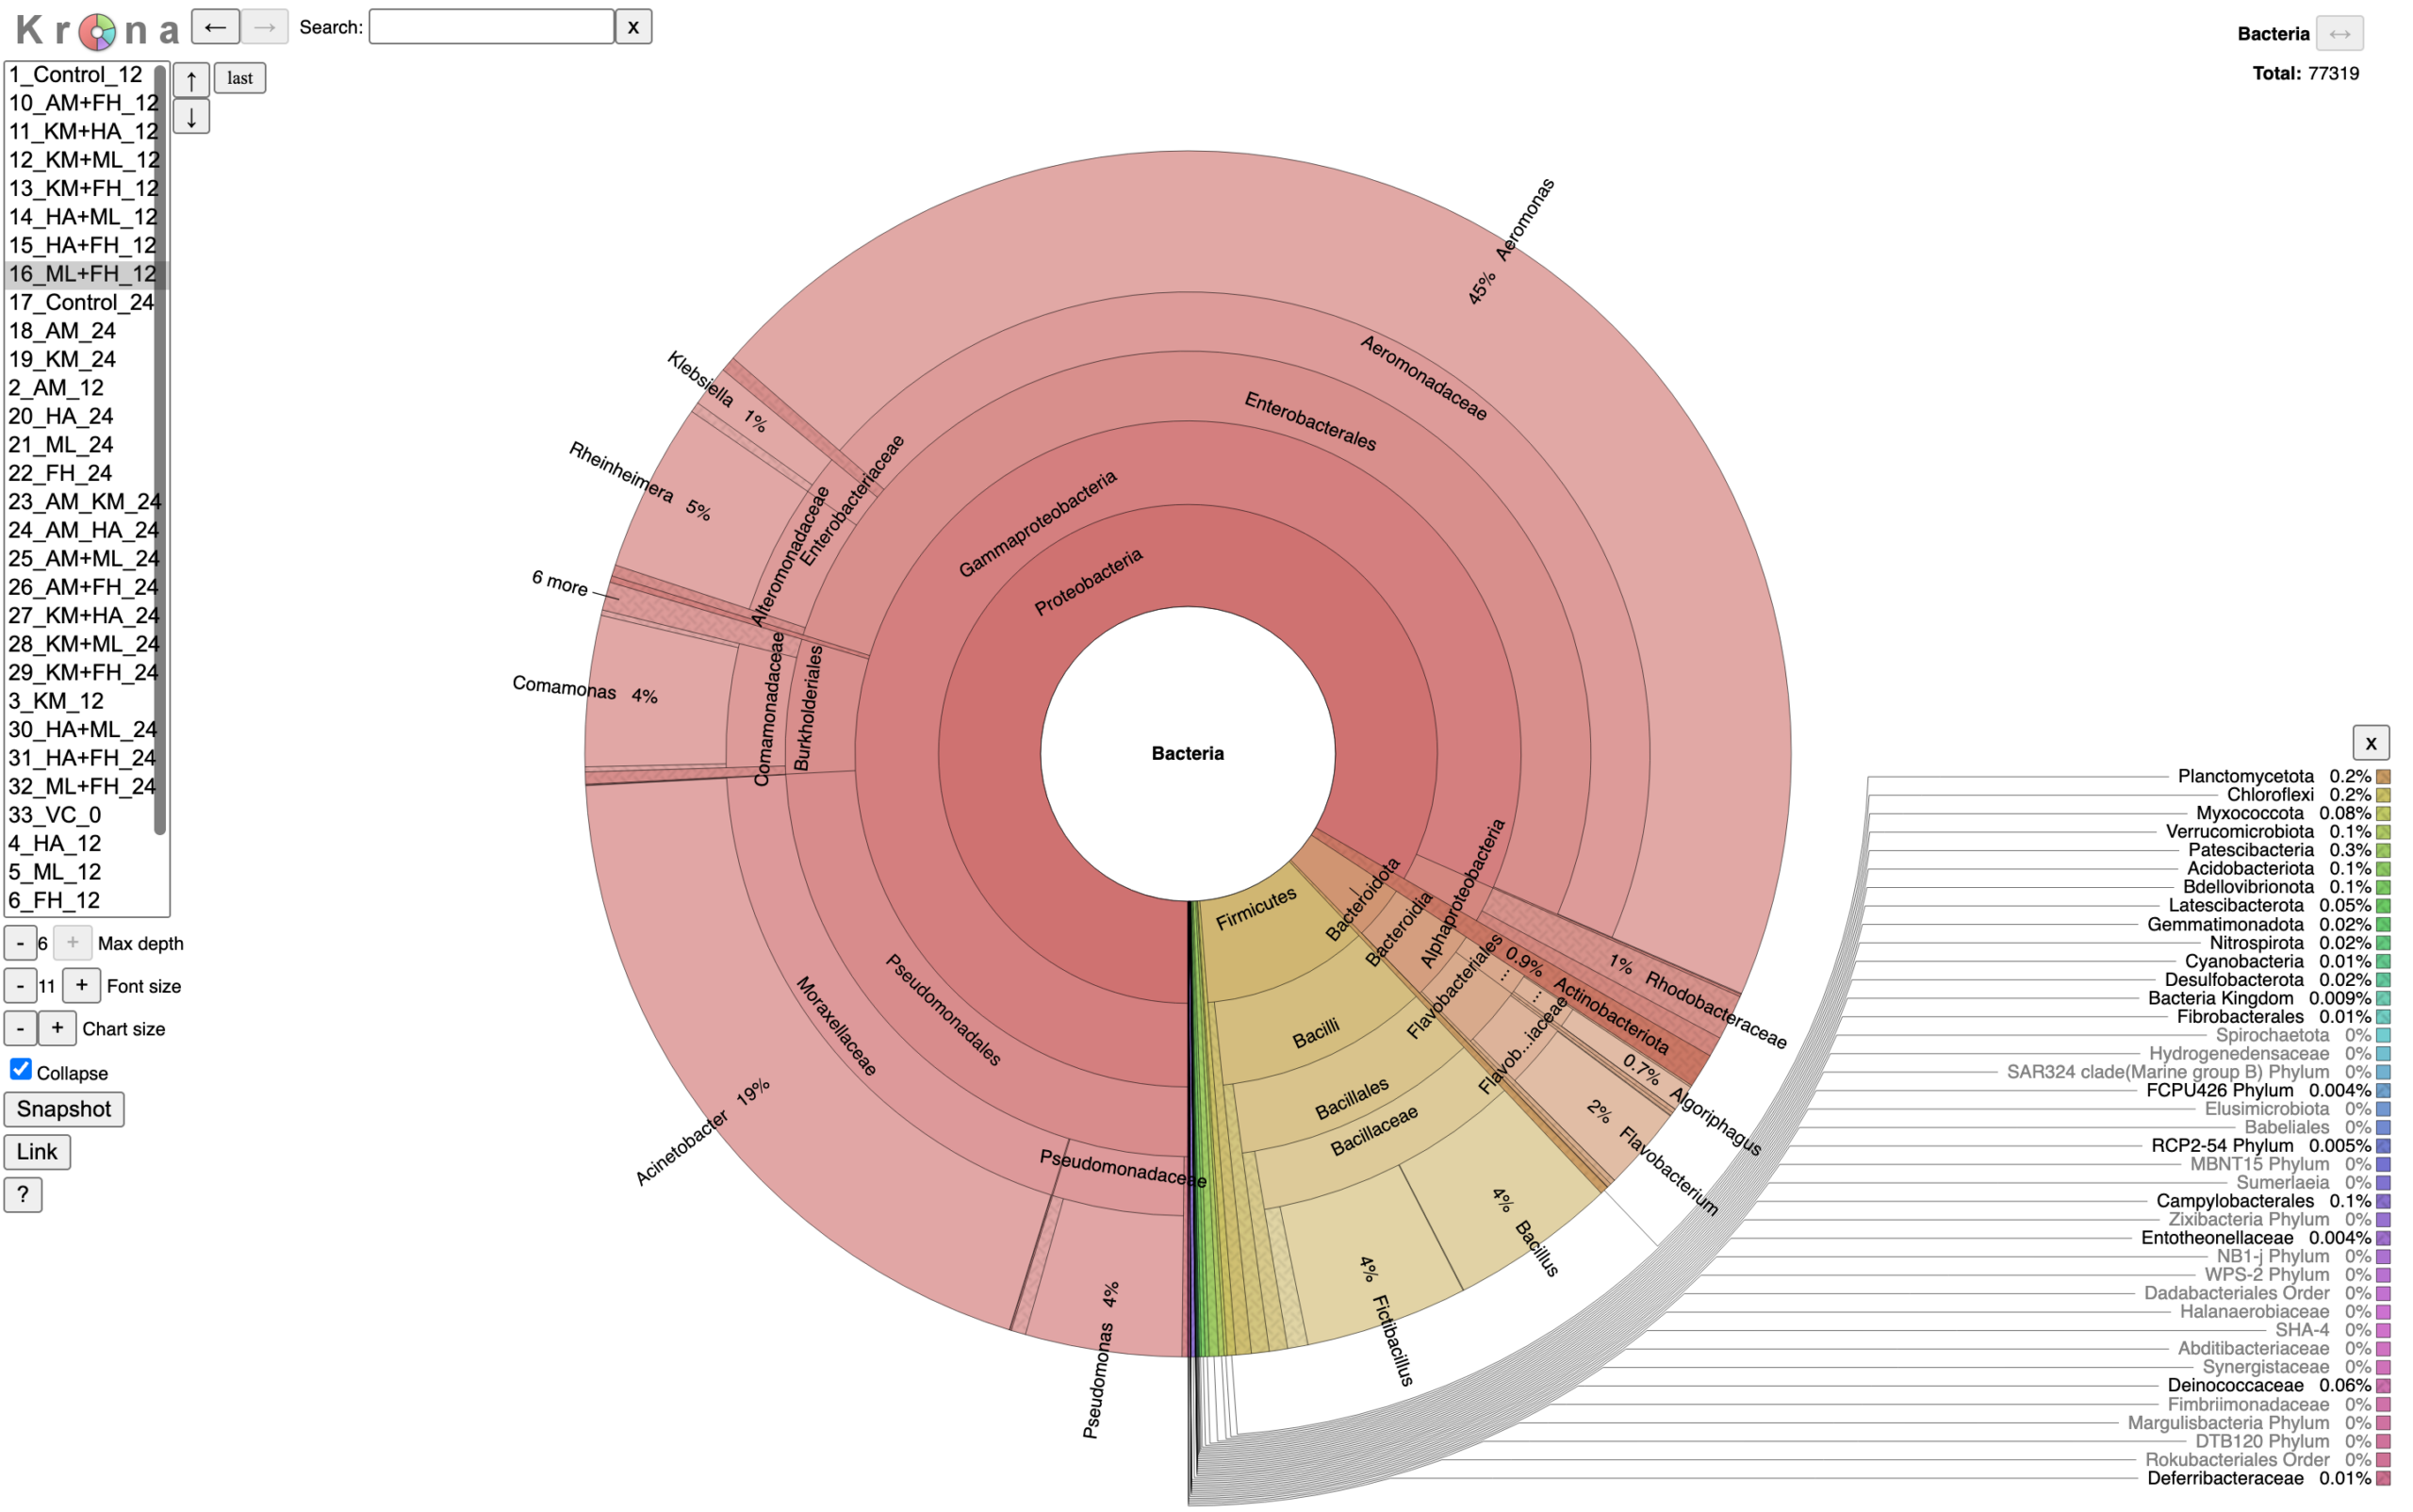
Figure 10. Molasses + Fish Hydrolysate, 12 hours (Pathogen-promoting). Aeromonas (45%) and Acinetobacter (19%) take over, and Klebsiella is visible as its own 1% slice. Enterobacteriaceae 1.38%, rising to 2.01% at 24 hours.
Interactive Krona plots for all 33 samples are available when you download the HTML files on this drive.
4. 12 hours vs 24 hours
- Some recipes looked fairly similar at 12 and 24 hours.
- In other recipes, a few bacteria became much more dominant by 24 hours, which likely means they liked that particular food and had more time to multiply.
- Enterobacteriaceae rose between 12 and 24 hours in 10 of the 15 fed teas. They held flat or fell in 4 of the 5 humic acid teas (humic alone, with alfalfa, with molasses, and with fish hydrolysate) and in molasses alone. Dr. Jones notes that putting compost into a liquid likely favors enteric organisms to some degree, since many of them can swim.
- Overall, time mattered, but feed type mattered more. On the PCoA plot, the teas mostly grouped by what they were fed, with 12- and 24-hour samples from the same feed sitting closer together than samples from different feeds.
So, within the 12 to 24 hour window that most farmers use, the choice of feed ingredient has more impact on community "shape" than the extra 12 hours of brewing, and a shorter brew is the safer choice for most feeds.

Figure 11. Principal coordinates analysis (PCoA); samples closer together have more similar communities.
Axis 1 explains 50.2% of the variation and Axis 2 17.3%.
The dots for the unbrewed vermicompost, unfed teas and humic acid teas are shown close together at the far right, meaning they have very similar mixes of bacteria.
Molasses teas (and kelp at 24 hours) sit at the top, driven by Fictibacillus.
Fish hydrolysate and kelp combinations sit at the lower left, driven by Aeromonas and Acinetobacter.
Light blue = 24 hours, dark blue = 12 hours.
5. Biologically Rich (how many different kinds of bacteria)
Shannon index counts two things at once: how many kinds of bacteria are in the sample, and how evenly they're spread out.
|
Group |
Samples (Shannon) |
|---|---|
|
Most rich, most even |
Vermicompost unbrewed (6.06), |
|
Least rich, most "top-heavy" (meaning a few kinds of bacteria dominate) |
KM_24 (3.99), |
HA = humic acid,
AM = alfalfa meal,
FH = fish hydrolysate,
ML = molasses,
KM = kelp meal.
The unfed tea measured 5.22 at 12 hours and 5.54 at 24 hours.
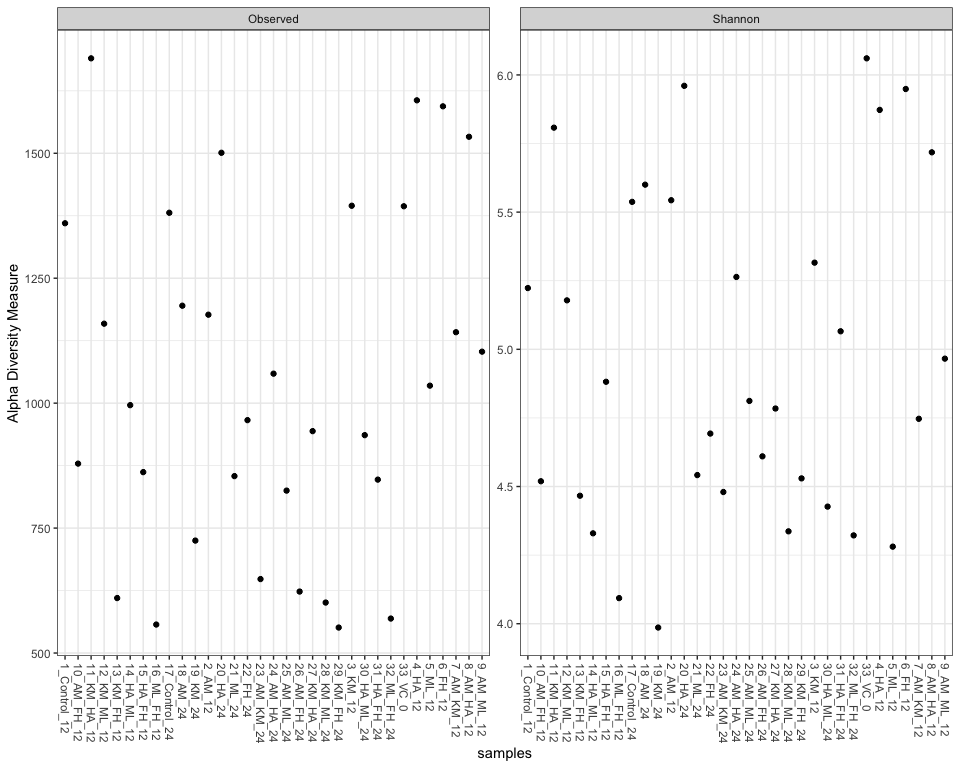
Figure 12. Observed count and Shannon index for each sample.
Observed (left) counts the number of genera detected, from about 550 (Kelp + Fish Hydrolysate at 24 hours) to about 1,700 (Kelp + Humic Acids at 12 hours).
Shannon (right) also weighs how evenly reads are spread, from 3.99 (Kelp, 24 hours) to 6.06 (unbrewed vermicompost).
Humic acid buffered biological richness. The humic acid teas had Shannon values very close to the starting vermicompost, which means many genera were present and fairly evenly represented. In practice, humic acid, especially on its own or paired with alfalfa, seemed to buffer the brew and keep a broad, balanced community rather than letting one microbe dominate.
Molasses and kelp recipes were the least biologically rich. Six of the seven least rich teas contained molasses, and kelp alone at 24 hours was the least rich of all (Fictibacillus 36% and Cellvibrio 23%). Lower richness is not by itself a problem. In the molasses teas it reflects a bloom of Fictibacillus, a potential plant growth promoter, rather than a takeover by potential pathogens.
Biologically rich and dominated teas are different communities that may suit different uses.
Biological richness and beneficial bacteria are a trade-off. A biologically rich tea contains many kinds of bacteria, much like the compost it came from, but not necessarily more of the ones that help plants. In our study the two moved in opposite directions. Meaning, the more my tea contained many different types of bacteria, the fewer beneficial bacteria (PGPBs) it seemed to have and vice versa. See below:
|
Tea |
Biological Richness (Shannon) |
PGPBs (% of reads) |
|---|---|---|
|
Unbrewed vermicompost |
6.06 (highest) |
1.7 |
|
Humic Acids, 24 hr |
5.96 |
5.8 |
|
Unfed tea, 24 hr |
5.54 |
4.5 |
|
Humic Acids + Molasses, 12 hr |
4.33 |
56.7 |
|
Molasses, 12 hr |
4.28 |
61.4 |
A biologically rich tea (humic acid or no feed) carries a broad sample of the whole compost community into the soil.
An enriched tea (molasses) grows a large share of a few plant-helping bacteria at the cost of variety.
This study did not test which approach helps plants more.
6. What the microbiology tells us
- Molasses, alone or with humic acid, was the most effective feed. It was the only feed rated non-pathogen-promoting and effective at both 12 and 24 hours. This reverses our hypothesis that molasses would be the least safe feed.
- Humic acid alone was the most conservative feed. It was non-pathogen-promoting at both brew times, kept Enterobacteriaceae below the unfed tea, and stayed closest to the starting compost, but it added few beneficial bacteria. It was selected for the tomato trials using the earlier standards before these definitions were finalized with our technical advisor.
- Alfalfa alone was a middle ground, non-pathogen-promoting at both times with 26 to 29% PGPBs.
- Kelp and fish hydrolysate combinations carried the highest pathogen risk. This differs from the EdaPro data, where the alfalfa and kelp blend performed well; in our compost, kelp consistently raised Klebsiella and Enterobacter.
- Molasses paired with fish hydrolysate produced the least safe tea in the study, even though molasses on its own did not raise Enterobacteriaceae.
- Limits of the method: relative abundance shows each group's share of the DNA, not how many live cells are in the tank, and 16S sequencing usually cannot separate harmful from harmless strains within a genus.
Each tea is also a single sample.
Nutrient Density in Tomatoes Applied with Compost Tea
Across two seasons, humic-fed ACT did not produce a statistically significant yield difference, and its nutrient effects were mixed: weak leaf sugar and nitrate status in 2025, but the highest mineral content in fruit in 2026.
2025: Leaf Extract Analysis (September 2, 2025)
|
Leaf sap value |
Control new / old |
ACT new / old |
Nitrogen new / old |
|---|---|---|---|
|
Total sugars (%) |
0.47 / 2.46 |
0.58 / 0.52 |
0.44 / 0.30 |
|
Nitrate (NO3) |
63.59 / 83.55 |
8.15 / 15.93 |
31.69 / 149.89 |
|
Ammonium (NH4) |
96.96 / 296.95 |
81.77 / 380.89 |
90.06 / 286.04 |
|
Calcium |
929.57 / 3,032.73 |
1,436.73 / 3,762.11 |
1,781.51 / 3,355.80 |
|
Potassium |
3,727.90 / 3,683.20 |
3,646.17 / 4,317.92 |
3,490.94 / 3,680.22 |
|
Magnesium |
583.97 / 1,505.49 |
678.43 / 1,392.48 |
871.83 / 1,342.71 |
Source: Apical Ag reports #35361, #35362, #35363.
- Across all treatments, the Leaf Extract Analysis indicated patterns consistent with constrained plant physiology rather than simple nutrient shortage. This was determined from data interpretation given by Apical Ag lab.
- The dominant signals were low photosynthetic energy status (very low sugars in new growth), low nitrate relative to ammonium, and multiple cation and micronutrient limitations in new leaves.
- These patterns point most strongly toward uptake and transport constraints driven by field conditions (water status, root function, temperature, soil aeration/Oxidation-Reduction Potential or ORP, and nutrient antagonisms).
There was hardly 1 inch of rainfall in August and September when these samples were taken.
The July 30 soil test also showed a low ORP (12 against an ideal of 80).
ACT vs control (what we can responsibly claim).
- At the September 2025 sampling, the ACT program did not produce a clear improvement in the primary "plant health" indicators compared to the control.
- ACT showed very low sugars in both new and old leaves and the lowest nitrate of any treatment, suggesting the program did not improve photosynthesis or nitrogen-form balance at that time point. ACT did carry more calcium than the control in both new and old leaves, and the most potassium in old leaves.
- The control showed the strongest sugar status at this sampling point, particularly in the older leaf tissue (2.46%). This raises the possibility that, under these field conditions and application method, the inconsistent treatment of compost tea did not improve plant energy status and may have contributed to additional physiological stress rather than alleviating it.
- Nitrogen results: The nitrogen treatment cannot be used as a valid fertility comparison because the applied rate was far above label guidance (a mixing error in the ammoniacal-N application).
In short, I didn't really do a good job of carrying out treatments in 2025. Which is why I retested in 2026.
2026: Harvest
|
Treatment |
Beds |
Plants |
Season total |
oz per plant |
Mean per bed (oz) |
SD per bed (oz) |
|---|---|---|---|---|---|---|
|
Fertilized |
C3, B3, A2 |
9 |
118 lb 11.5 oz (1,899.5 oz) |
211.1 |
618.2 |
230.9 |
|
Compost Tea |
C2, B1, A3 |
6 |
103 lb 12.5 oz (1,660.5 oz) |
276.8 |
553.5 |
40.3 |
|
Control |
C1, B2, A1 |
6 |
90 lb 14 oz (1,454.0 oz) |
242.3 |
484.7 |
127.8 |
|
Total |
9 |
21 |
313 lb 6 oz (5,014 oz) |
|
|
|
Per-bed figures exclude 45 oz from a combined B3/C3 pick on September 18 that could not be split by bed (it is included in the Fertilized total).
The Tomato Trial Tracker can be found here.
- No treatment difference was statistically significant. On bed totals, one-way ANOVA gave F = 0.563, p = 0.597, and Kruskal-Wallis gave
H = 1.422, p = 0.491.
On yield per plant, ANOVA gave p = 0.640.
With three beds per treatment, only a very large, consistent effect could have been detected.
(An explanation of the statistical testing is found above Materials & Methodology/Statistical Analysis section)
- Compost Tea was the most consistent treatment. Its three beds ranged only from 508 to 584.5 oz (SD 40.3 oz), against 355 to 787 oz for Fertilized and 338 to 572 oz for Control.
- Ranking depends on how yield is expressed. Fertilized had the highest total, but it also had 9 plants against 6 in each of the other treatments. Per plant, Compost Tea was highest (276.8 oz), then Control (242.3 oz), then Fertilized (211.1 oz). Because plant count per bed ranged from one to three, neither total nor per-plant yield is a clean comparison.
- Timing differed by treatment. Compost Tea led mid-August and Control led through early September. Fertilized had almost no harvest until August 22, then had its largest days on September 9, 12, 21 and 25, finishing ahead. On August 11, fruit set was 20.5 fruit per plant for Control, 20.2 for Compost Tea and 10.1 for Fertilized.
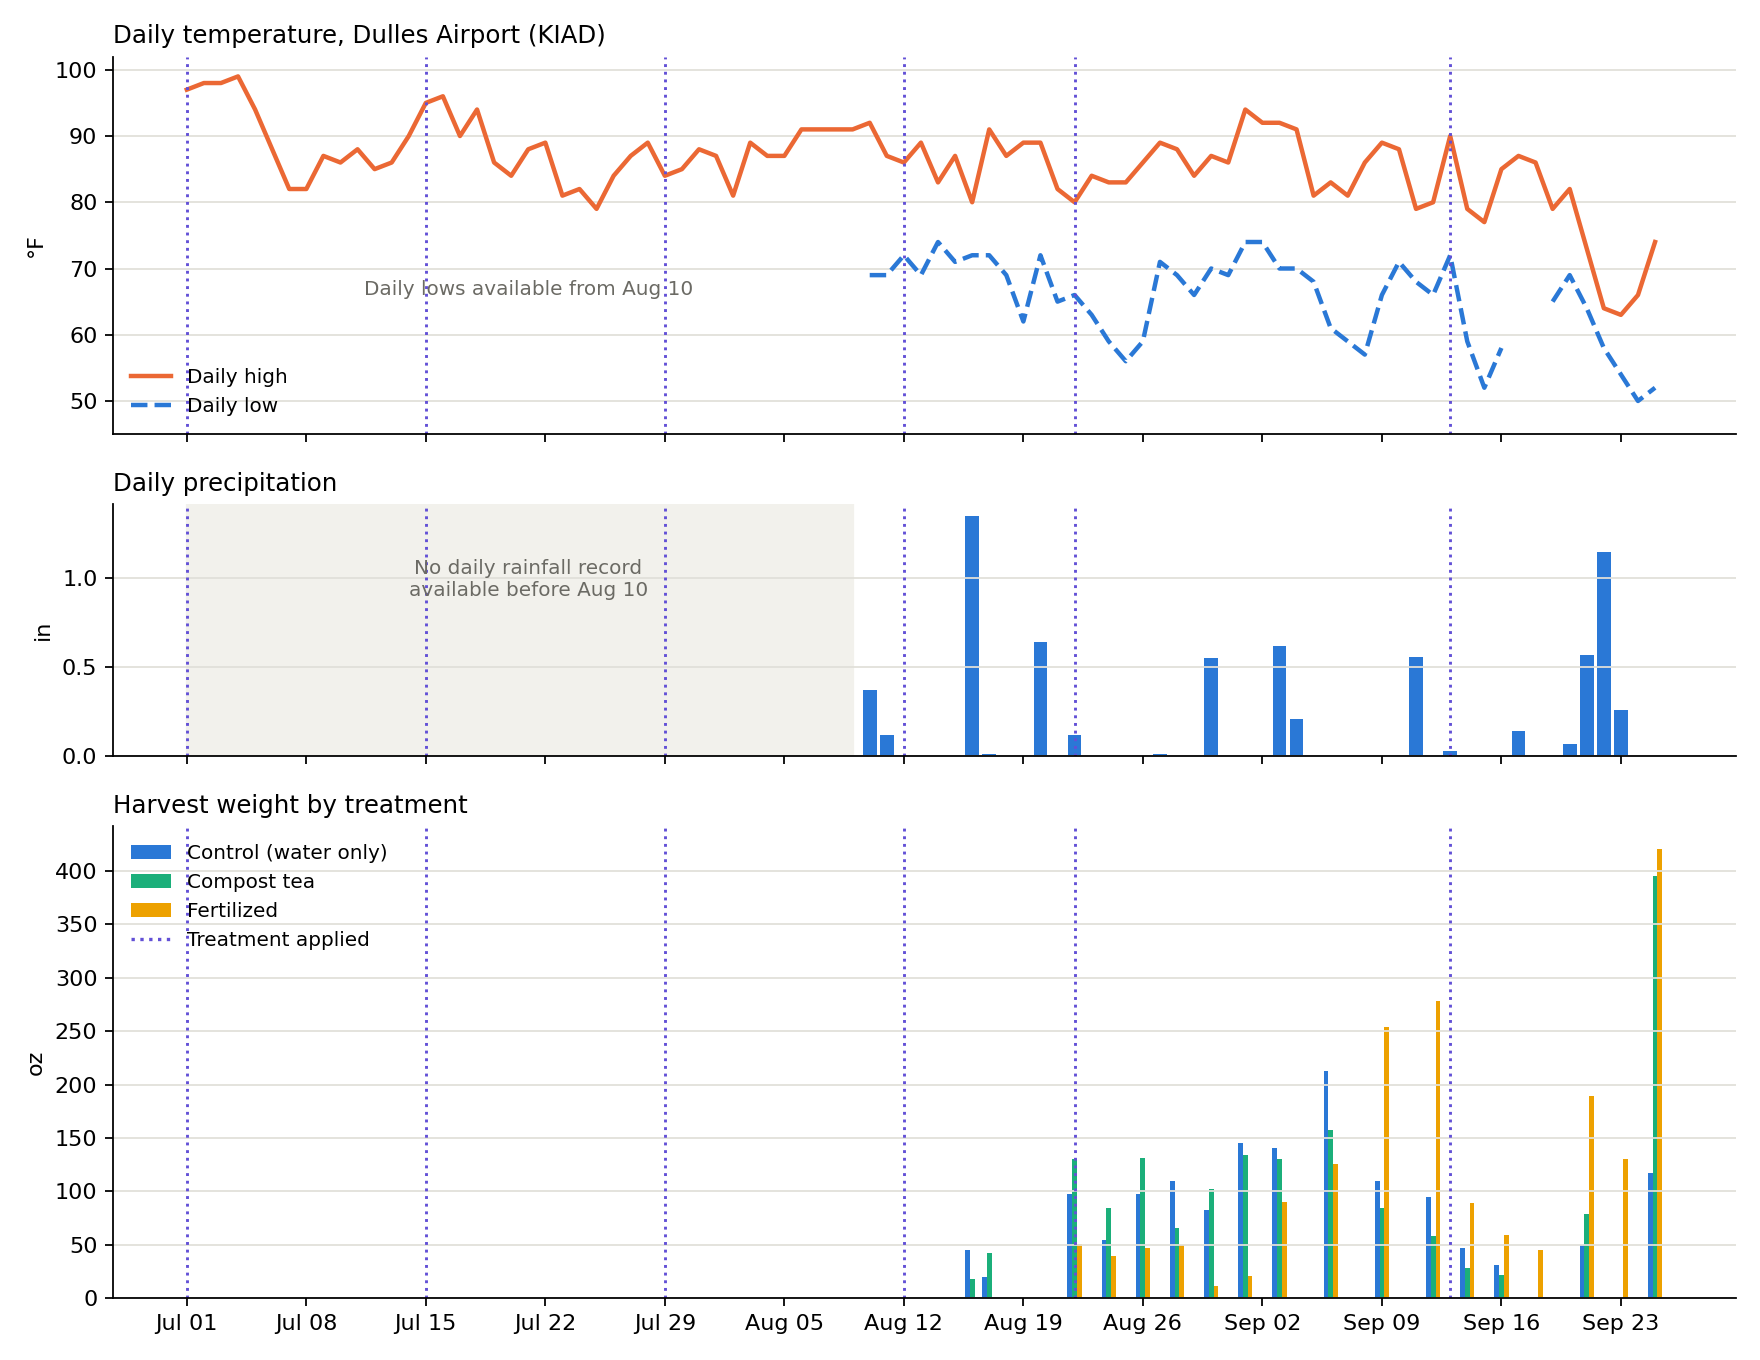
Figure 13. 2026 season at Bethany Farm, July 1 to September 25: daily high and low temperature and daily precipitation at Dulles Airport (NWS station KIAD), and harvest weight by treatment on each harvest date.
Dotted lines mark the six application dates. Daily highs cover the full season; daily lows and rainfall are available from August 10 (lows missing September 17 and 18).
The hottest days came at the first application, 97 to 99°F from July 1 to 4, followed by 95 to 96°F on July 15 and 16.
Note the dry stretch of August 21 to 29 and the cool, wet final week (1.15 inches on September 22).
Weather data: NWS weather reports and the Iowa Mesonet archive for KIAD.
Pests and disease (2026).
- Hornworm: recurring on A2 (Fertilized) and C1 (Control), with damage on Compost Tea beds (B1, A3, C2) later in the season and on B3 and A2 at the final harvest. Parasitic wasp larvae killed hornworms on several dates.
- Stink bugs: on Control beds (A1, B2) and one Compost Tea bed (C2).
- Blossom end rot: on Compost Tea beds (B1, A3, and one fruit on C2) and one Fertilized bed (A2).
- Leaf curl and yellowing on B2 (Control): Apical's CNA field notes list Tomato Yellow Leaf Curl for the Control sample. B2 was also the only bed with a Kellogg's Breakfast plant, so its lower yield (338 oz) cannot be attributed to treatment alone.
The ACT did not show a clear disease-resistance benefit. Blossom end rot is a calcium-transport disorder linked to uneven watering, which fits the dry stretch of August 21 to 29.
2026: Crop Nutrient Analysis of Fruit (August 24, 2026)
|
Fruit value (Apical CNA) |
Compost Tea (#691) |
Control (#692) |
Fertilized (#693) |
|---|---|---|---|
|
Total sugars |
44.28 |
46.87 |
41.66 |
|
Total protein |
6.92 |
7.14 |
6.80 |
|
Total phenols |
993.57 |
1,109.18 |
1,031.46 |
|
Calcium |
1,569.78 |
1,552.21 |
1,306.45 |
|
Potassium |
43,610.54 |
38,835.51 |
37,536.09 |
|
Magnesium |
1,687.79 |
1,448.02 |
1,326.03 |
|
Iron |
45.17 |
35.09 |
31.69 |
|
Zinc |
22.07 |
20.73 |
18.81 |
|
Boron |
14.16 |
11.06 |
10.04 |
|
Sulfur |
1,267.59 |
1,157.87 |
1,107.72 |
|
Phosphorus |
3,852.90 |
4,505.77 |
3,485.63 |
|
Nitrate (desired 65) |
42.49 |
28.75 |
96.07 |
|
Aluminum (should be under 3.5) |
15.00 |
12.82 |
10.69 |
|
Heavy metals (As, Cd, Cr, Hg, Ni, Pb, Sn, V) |
not detected |
not detected |
not detected |
Units as reported by Apical Ag.
|
Score |
Compost Tea |
Control |
Fertilized |
|---|---|---|---|
|
Nutrient Adequacy Score (NAS) |
0.755 |
0.726 |
0.675 |
|
Heavy Metal Safety Index (HMSI) |
1.0 |
1.0 |
1.0 |
|
Nitrogen Load Index (higher score = less excess nitrate in the fruit; |
0.346 |
0.558 |
0.000 |
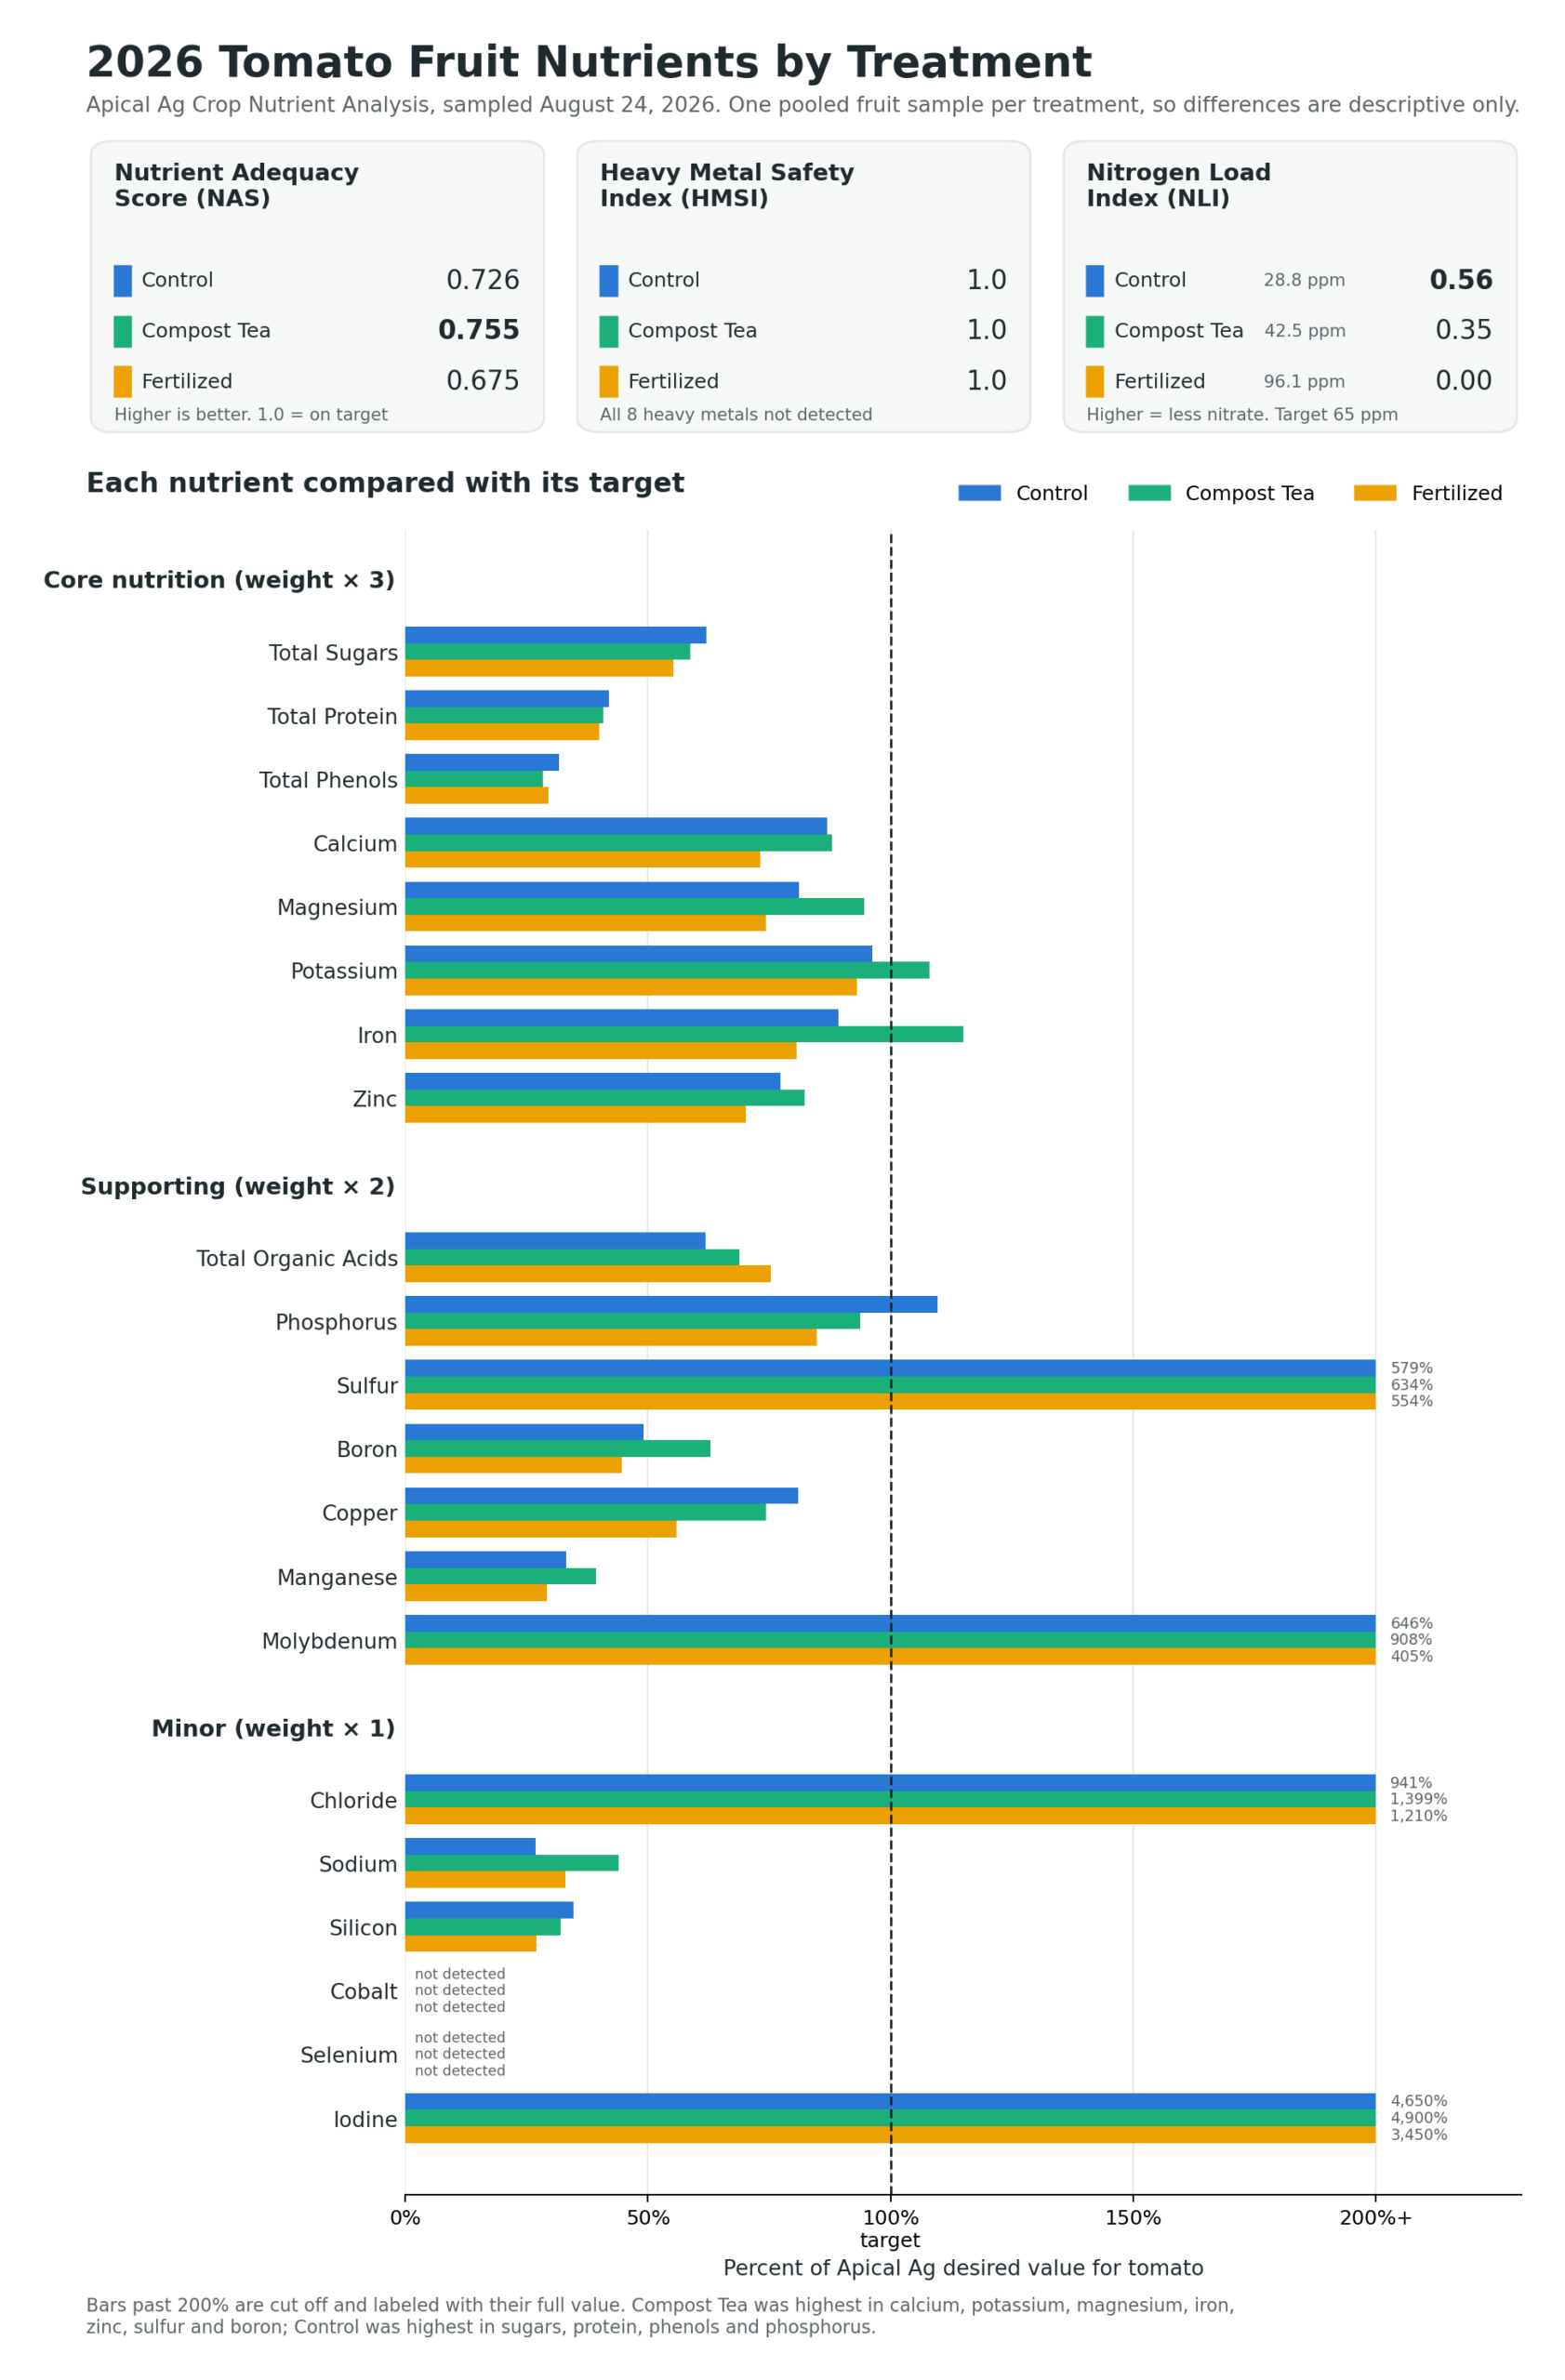
Figure 14. 2026 tomato fruit nutrients by treatment.
Top: The three scores for each treatment.
Bottom: Each of the 21 beneficial nutrients as a percent of Apical Ag's desired value for tomato
The dashed line marks the target.
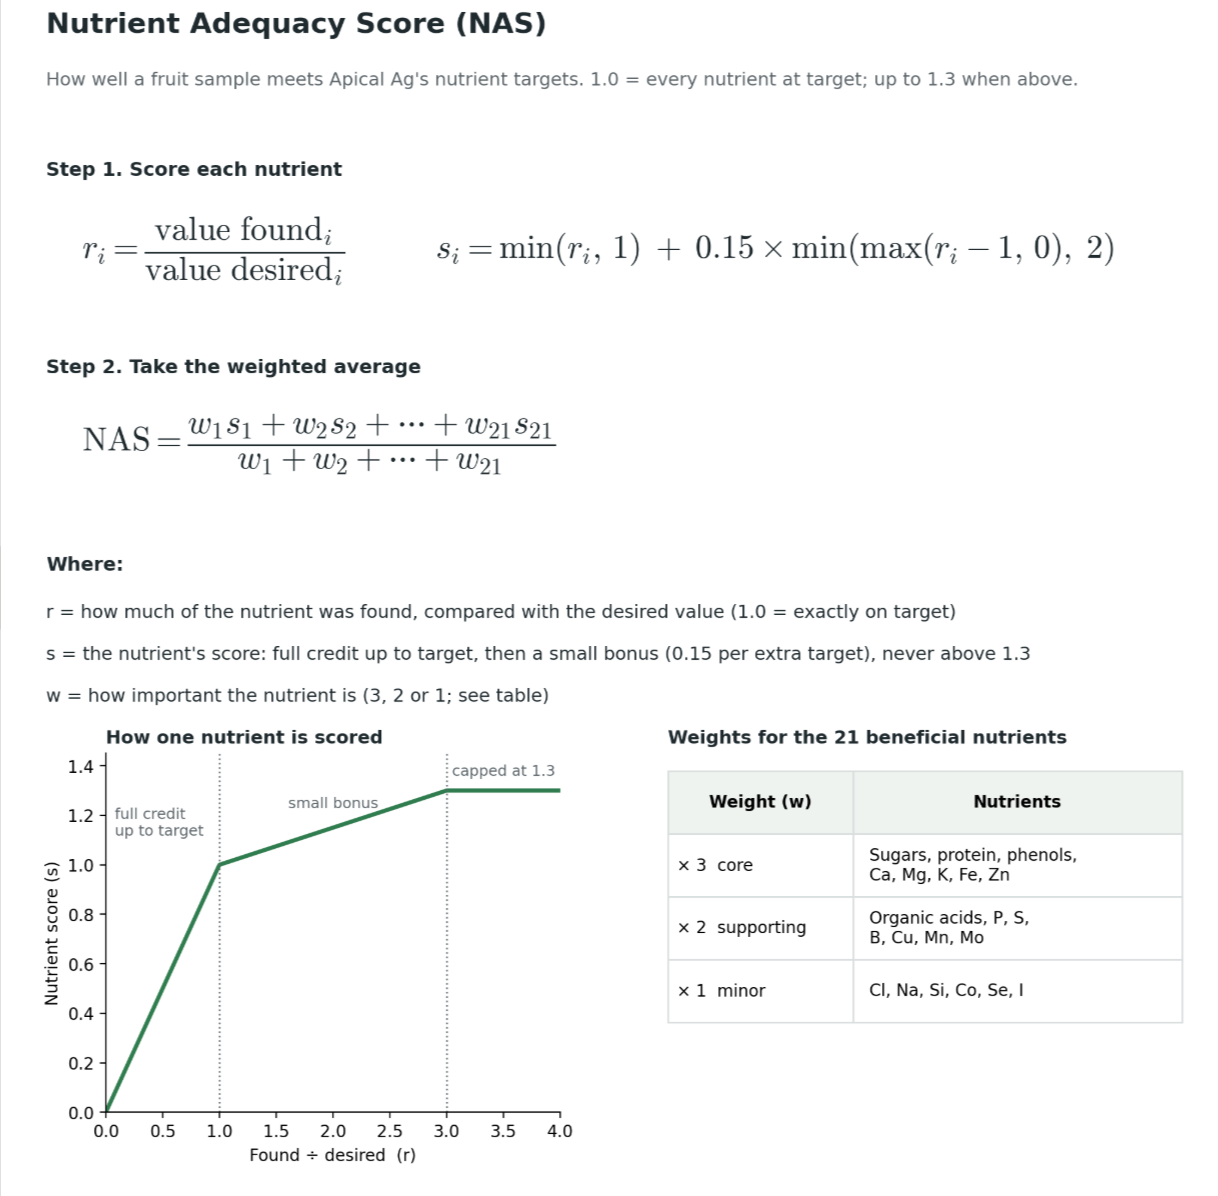
- Compost Tea fruit was highest in calcium, potassium, magnesium, iron, zinc, sulfur and boron, and scored highest on NAS. The same direction showed up in the 2025 leaf data, where ACT leaves carried more calcium than the control.
- Control fruit was highest in sugars, protein and phenols, which matches the 2025 leaf data where the control had the strongest sugar status.
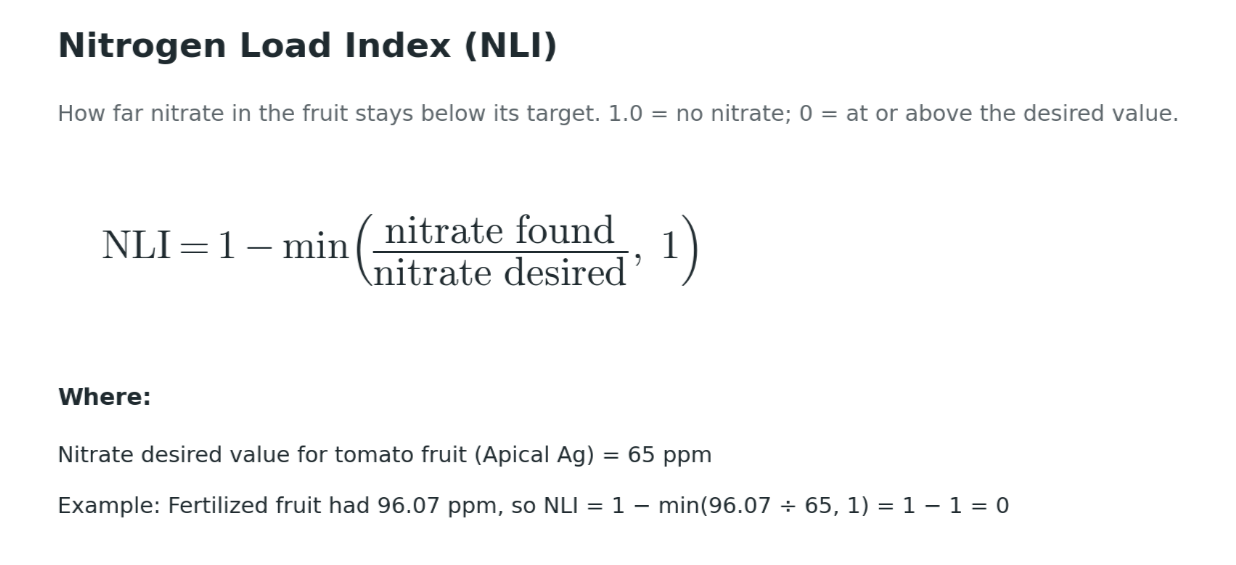
- Fertilized fruit had the highest nitrate (96.07, above the desired 65) even though Tomato-tone is a low-nitrogen organic fertilizer.
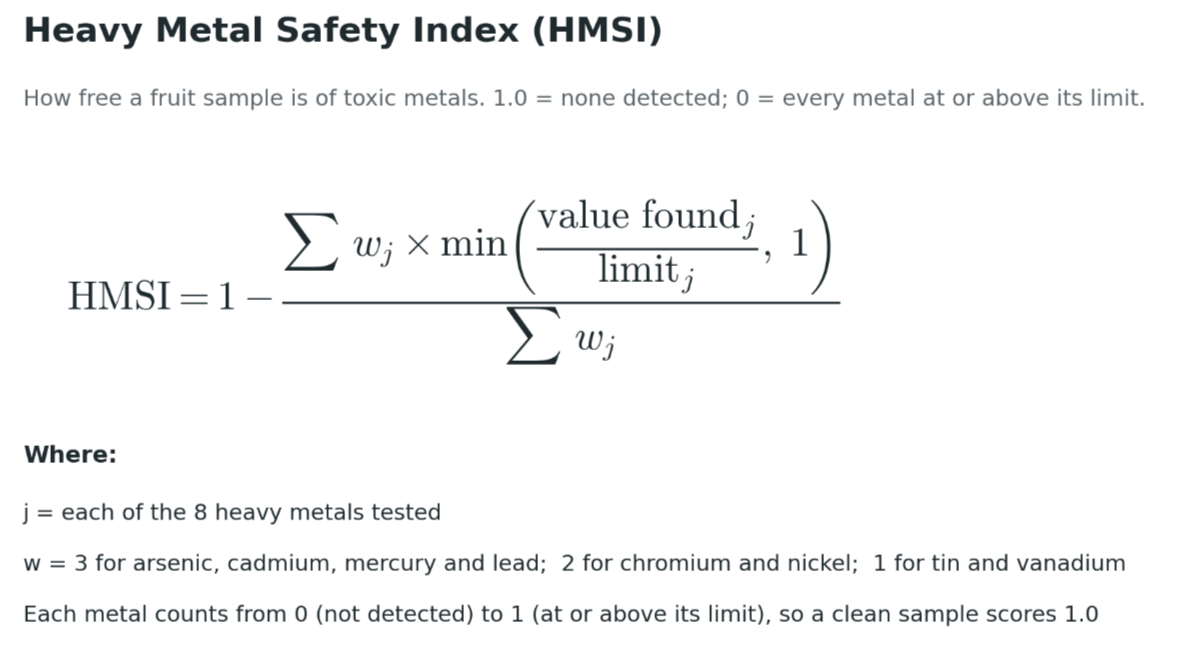
- All three samples were free of detectable heavy metals. Aluminum was above Apical's 3.5 guidance in all three; Apical recommends leaf analysis during the season to track it.
- Limits: budget allowed one pooled sample per treatment (n = 1), so these differences cannot be tested for significance and should be read as descriptive.
The NAS tier weights are our own; Apical's David Knaus supported the heavy metal index but noted that nutrient priorities vary from person to person, and Apical generally interprets nutrient ratios rather than summed scores.
Educational & Outreach Activities
Participation summary:
Outreach is the heart of the work that I do on my farm, online, and when traveling to address farming and gardening audiences. I teach how to grow food online monthly in a live workshop, sometimes daily through social media, and weekly through my gardening newsletter. This is how I currently teach families how to grow their own food and medicine through ecological gardening.
I have a mailing list of about 2,500 people around the US and abroad. Over the course of this project, outreach has included:
- 2 webinars about compost tea findings from this study
- "The Truth About Aerated Compost Teas" at the Baker's Creek Heirloom Expo, California (September 2025)
- "The Truth About Aerated Compost Teas" at the VA Biological Farming Conference (January 2026)
- A private presentation of compost tea research findings to a panel of scientists via Zoom (February 18, 2026)
- A podcast interview with 4TheSoil podcast
- A webpage on my website dedicated to my Compost Tea research
- 2 Fact Sheets summarizing the findings of this project.
Looking ahead, I hope to:
- Partner with SARE and VA Tech to teach farmers in person and online
- Present findings at local farming conferences and outreaches in Southern regions
- Continue sharing research through online platforms and webinars
Learning Outcomes
Increased awareness of microbiology in the soil and compost and how it reacts to different feeds
Project Outcomes
Project Outcomes
The feed you put in a compost tea matters.
- Molasses grew the most beneficial bacteria while staying low in potential pathogens
- Humic acid kept the tea closest to the original compost, and
- Kelp and fish hydrolysate blends carried the highest pathogen risk.
Research outcomes
- Safest and most effective microbial starter (Question 1).
Molasses, alone or with humic acid, was the only feed rated non-pathogen-promoting and effective at both 12 and 24 hours, with 57 to 61% PGPBs (mostly Fictibacillus) and Enterobacteriaceae at or below the unfed tea.
This reverses our hypothesis that molasses would be the least safe feed, and differs from the EdaPro data.
Humic acid alone was the most conservative choice: non-pathogen-promoting at both times, among the lowest Enterobacteriaceae, and the community closest to the starting compost, but it raised PGPBs only to about 6%.
Kelp was the least safe feed; every kelp tea was pathogen-promoting by 24 hours.
Molasses plus fish hydrolysate was the worst tea tested.
- Optimal brew time (Question 2).
Within 12 to 24 hours, feed choice mattered more than brew time.
Enterobacteriaceae rose between 12 and 24 hours in 10 of the 15 fed teas, so a shorter brew is the safer choice.
Based on this, the 2026 tomato tea was brewed for 30 minutes.
- Reducing Enterobacters by brewing (Question 3).
No Enterobacteriaceae were detected in the unbrewed vermicompost (0 of 44,520 reads).
They appeared at low levels in every brew, including the unfed tea (0.06 to 0.08%), and were amplified most by kelp and fish hydrolysate.
Brewing therefore did not reduce them.
They stayed lowest with humic acid, molasses alone or alfalfa alone, and with shorter brews.
- Effect of ACT on tomatoes (Question 4).
Across two seasons, humic-fed ACT did not significantly change tomato yield.
In 2026 it gave the most consistent yields between beds, the highest yield per plant, and fruit highest in calcium, potassium, magnesium, iron and zinc, but these are single-sample or non-significant results.
It did not show a clear disease-resistance benefit, and in the dry 2025 season it did not improve leaf sugar or nitrate status.
Because humic acid tea added few PGPBs, a molasses-based tea may be the better candidate for a future plant trial.
Recommendations for farmers and gardeners
- For the most beneficial bacteria, feed molasses alone or molasses with humic acid.
These teas were 57 to 61% PGPBs while keeping Enterobacteriaceae at or below the unfed tea.
- For a tea closest to your compost, use humic acid or no feed.
Both retain several different kinds of bacteria and low in Enterobacteriaceae at 12 and 24 hours.
- Alfalfa meal is a middle ground, low in Enterobacteriaceae at both brew times with 26 to 29% PGPBs.
- Avoid kelp and fish hydrolysate blends, and never pair molasses with fish hydrolysate.
Every kelp tea crossed our pathogen-promoting limit by 24 hours, and molasses plus fish hydrolysate was the least safe tea we tested.
- Keep brews short.
Enterobacteriaceae rose between 12 and 24 hours in most fed teas, and brewing longer did not improve the tea.
In 2026 we brewed our humic acid tea for just 30 minutes.
- Start with good compost.
The unbrewed vermicompost was the most bacterially rich sample of all and had no detectable Enterobacteriaceae.
Brewing shifts that community rather than adding to it.
- Confirm your method with an occasional plate count.
Testing every batch is not practical, but an occasional E. coli and enterococci plate count on your usual recipe confirms that your compost and method still meet food-safety thresholds.
- Do not expect compost tea alone to fix a stressed crop.
In both seasons, heat and drought drove plant stress more than any treatment.
System design (polyculture plus mulch and soil protection) may have a bigger impact on plant health than compost tea alone when conditions get extreme.
A practical safety approach for farmers.
Most growers cannot test each batch of compost or tea for pathogens.
A realistic starting point is to rely on what vermicomposting itself does to human pathogens, then keep the brew from undoing it:
- Start with mature, well-made vermicompost.
Earthworms and the compost's native microbes together reduce human pathogens.
A review of vermicomposting studies reported reductions of 85 to 100% in total coliforms and 93 to 100% in fecal coliforms (Swati & Hait, 2018, J. Environ. Qual.).
In a controlled trial, E. coli fell below the US EPA compost guideline within 18 to 21 days, but took up to 51 days where worms were absent and the microbial community was poor (Hénault-Ethier et al., 2016, Waste Management).
Our own vermicompost fits this picture: no Enterobacteriaceae were detected in it (0 of 44,520 reads).
- Keep the brew short and the feed conservative.
In our study, brewing is where Enterobacteriaceae appeared, and they rose with time and with kelp or fish hydrolysate.
A short brew (we used 30 minutes in 2026) with humic acid, alfalfa, molasses alone or no feed keeps them lowest.
- Use clean water and equipment.
Our well water met the E. coli standard but carried some coliforms, which may explain the small amounts seen even in the unfed tea.
Vermicomposting has limits:
- It has no high-temperature stage, which is what regulators rely on to kill pathogens
- Results depend on worm density, feedstock and time; and
- Pathogen reduction is selective, so some bacteria survive better than others.
Heavily contaminated inputs such as fresh manure should be hot-composted first. For produce eaten raw, an occasional plate count remains the only way to confirm a tea is safe.
What we would do differently
- Test finished teas for E. coli and enterococci colony counts (CFU/100ml) alongside DNA sequencing, so the DNA-based ratings can be checked against the original plate-count thresholds.
- Plant the same variety and the same number of plants in every bed, and mulch all research beds to reduce heat and water stress. We initially did this but some plants died or we had to replace with seedlings that were not the same variety.
- Send one nutrient sample per bed rather than one pooled sample per treatment, so nutrient-density differences can be tested statistically. This would mean a bigger budget for testing
- Re-run the stored sequencing data through AggregoData's species-level pipeline, to tell beneficial species of Pseudomonas, Acinetobacter and Fictibacillus from harmful ones.
Thank you to Southern SARE for funding this project, and to Adrian Rubi (EdaPro), Dr. Zack Jones (AggregoData), and Dr. David Knaus and Daniel Josefchak (Apical Ag) for their data, analysis and guidance.