Final report for FW15-044
Project Information
Del-Moro.-2019.-Cover-Crops-for-Hops-Final-Report-SARE-FW15-044
The goal of this research was to determine an economical cover crop species that provides the greatest ground cover in hop yard interrows while reducing weed ground cover. We tested the following plant species: barley, yellow-blossom alfalfa, wheatgrass and fescue along with a disced control in 2015, and weed cover control in 2016 and 2017. Ground cover from crops and weeds was measured visually every week or every other week throughout the 2015, 2016 and 2017 growing seasons. Barley provided an average season long ground cover of ~84% in 2015 and ~70% in 2016. Perennial grasses achieved significant ground cover after establishment, with wheatgrass and fescue contributing ~65% and ~72% average season-long ground cover in 2017, respectively. The alfalfa did not adequately establish until the end of 2016. Ground cover from weeds was significantly reduced in all cover crop treatments compared to the average season-long ground cover from control plots of 82- to 84%. Soil tests also reported that organic matter and some soil minerals were significantly increased from cover cropped plots. From this study we conclude that perennial grasses, such as hard fescue or tall fescue, are the most economically viable cover crop option for hop yards that will remain planted for at least 5 years. Barley and other cereal grain crops are an economically viable option for particularly dusty or mite-infested hop yards that will be removed within 5 years.
The primary goal of this three-year study was to determine cover crop species that provided the greatest interrow vegetative ground cover for hop producers in the Yakima Valley. Effective ground cover conserves topsoil and reduces dust.
Secondary goals:
- Determine cover crop species that provided the greatest reduction in weed cover
- Assess soil quality changes among cover crop species
- Perform an economic cost-benefit analysis of various interrow management schemes, including cover cropping
Cooperators
Research
Research Location and Cover Crop Species
This study took place at the John I. Haas Yakima Golding Farm, a commercial hop farm located in Toppenish, WA. We chose a hop yard for this research that had a mostly uniform, sandy loam soil, was recently planted to hops (2013 to 2014), and had short enough row lengths to economically plant multiple rows per plot. Hops in this field were drip irrigated in the row, and interrows did not receive any other irrigation. An initial composite soil sample collected from hop rows in summer of 2014 reported the results in Table 1.
Table 1. Composite soil sample results from study location. Soil cores collected from hop rows.
|
Measurement |
Unit |
Value |
|
pH |
|
8.30 |
|
SS |
mmhos/cm |
0.33 |
|
Organic Matter |
% |
2.75 |
|
Nitrate |
lbs/acre |
164 |
|
Ammonium |
lbs/acre |
34.3 |
|
Olsen Phosphorous |
ppm |
16.2 |
|
Sulfur |
ppm |
25.0 |
|
Potassium |
ppm |
842 |
|
Calcium |
meq/100g |
32.5 |
|
Magnesium |
meq/100g |
4.50 |
|
Sodium |
meq/100g |
0.92 |
|
Boron |
ppm |
1.65 |
|
Zinc |
ppm |
2.15 |
|
Manganese |
ppm |
22.5 |
|
Copper |
ppm |
0.95 |
|
Iron |
ppm |
13.0 |
We selected cover crop plant species to test based on the following criteria:
- Drought tolerance, or low precipitation requirement
- High biomass production
- Low stature, or height
Essentially we wanted plants that would germinate well and cover the ground rapidly while minimizing mowing. We additionally wanted to compare at least one annual grain, one perennial grass, and one perennial legume that fit the above criteria. Either due to recommendations and/or availability, we arrived at the following cover crop species to compare in this study:
- ‘Alba’ Barley
- ‘Vavilov II’ Siberian Wheatgrass
- ‘Sodar’ Streambank Wheatgrass
- ‘Henry’ Hard Fescue
- ‘Don’ Falcata Alfalfa (yellow blossom)
All cover crops were initially planted in Oct. 2014 using a Tye double-disc drill with 8-in row spacing, in 2 offset passes to achieve roughly 4-in planted rows. The overall planted interrow swath was roughly 6-ft wide. Barley was planted at 100 lbs per acre in both Oct. 2014 and Nov. 2015. The grass and alfalfa seeds were planted according to their recommended normal rates, with the drill contributing about 1-2 lbs per acre of variation. Monoculture planting rates, seed densities, and additional information are presented in Table 2.
Table 2: Cover crop species seed density, planting rate and characteristics
|
Species |
Cultivar |
Estimated Minimum Precipitation |
Seed Density |
Seeding Rate |
Characteristics |
|
|
|
(in) |
(seeds/lb) |
(lbs/acre) |
|
|
Barley |
‘Alba’ |
8 |
2,880 |
100 |
Annual, grain |
|
Hard Fescue |
‘Henry’ |
16 |
115,200 |
10 |
Perennial, bunch grass |
|
Siberian Wheatgrass |
‘Vavilov II’ |
8 |
32,880 |
8 |
Perennial, bunch grass |
|
Streambank Wheatgrass |
‘Sodar’ |
8 |
27,700 |
10 |
Perennial, sod-forming grass |
|
Falcata Alfalfa |
‘Don’ |
12 |
400,000 |
5 |
Perennial, legume |
By Mar. 2015, we did not see any significant germination of the alfalfa, so we re-planted it using the same method as the previous fall. In all of the perennial grass seed plots, we sprinkled some additional seed in any patches that appeared bare from wind or mechanical movement out of the plot. This research initially included some mixes of the above species; however, germination and early establishment of the species combinations were significantly less than the average germination and establishment of the monocultures of varieties used in the mix. Thus, due to not fitting our main test criteria, species mixes were removed from this study.
Cover crop treatments were planted in 4 blocked, randomly replicated ‘plots’ within the hopyard. Each plot consisted of 3 interrows, in other words planted between 4 hop rows, and spanned the entire length of each row (at least 550-ft). Therefore all plots were at least 9,900 ft2. Cover cropped plots were mowed 2 to 3 times per growing season in each year of the study, and were disced one time per season on the side of the planted hop hills only. In control plots, the entire interrow was disced several times throughout the 2015 growing season. During the 2016 and 2017 seasons, control plots were not disced and were allowed to grow weeds instead, which were maintained with the same mowing practices as the cover cropped plots.
Measurements
Vegetative ground cover was assessed visually in 6- by 6-ft measurement areas in plots every other week or every week during the growing seasons of 2015 through 2017. The measurement area was in the centermost interrow of plots, at least 25-ft from the edge of the hopyard, and consistently planted. Measurement of percent ground cover were averaged for each growing season.
During 2016 and 2017, we additionally measured the percent ground cover contributed by weeds and averaged these values for each growing season. In the same years, soil temperature was measured using a digital thermometer probe at a 2-in depth from each measurement area at the time of assessment. The thermometer was inserted in a representative location (i.e. not in any patches of completely bare soil, rather placed in or around the cover crop species in treated plots, or in or around the weeds in control plots) for at least 30-sec to equilibrate before temperature was recorded.
Composite soil samples to a depth of 1-ft were collected from each plot. Soil samples from barley plots were collected during 2015 and 2016. The soil test variables were subjected to an analysis of variance and means were separated by a least significant difference (LSD) test at a 0.05 probability level.
See the complete report to view figures: Del-Moro.-2019.-Cover-Crops-for-Hops-Final-Report-SARE-FW15-044
Ground Cover
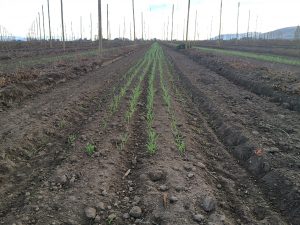
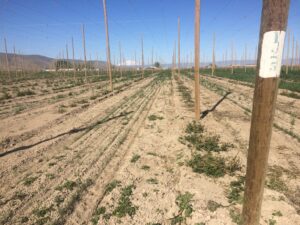
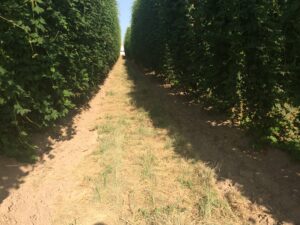
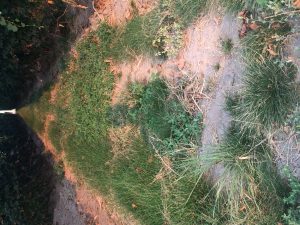
The most representative ground cover measurements were made after the cover crops were clearly established. We considered establishment as visibly planted rows with tillers or branching, and around 4-in of height. Barley reached this threshold as early as Nov. 2014 (Fig. 1). Siberian wheatgrass was established by the time our first spring measurements were made in 2015 (Fig. 2), and streambank wheatgrass required until the summer of 2015 to fully establish (Fig.3). Hard fescue was much slower; it was not until the fall of 2015 that most plots were established well enough to represent ground cover (Fig. 4). Alfalfa unfortunately did not establish at any time during 2015, even after re-planting in the spring. We observed only occasional, isolated sprouts. Therefore, the yellow-blossom alfalfa was removed from our study, assuming it would not germinate quickly enough to provide benefit in hop production. We disced the alfalfa plots in the fall of 2015, but then they took and interesting and surprising turn. By summer of 2016 the alfalfa plots germinated, and by the summer of 2017 half of the alfalfa plots showed significant ground cover (Fig. 5). Measurements were still not recorded as the crop had been dismissed as a viable option due to lack of germination and establishment in the first two years.
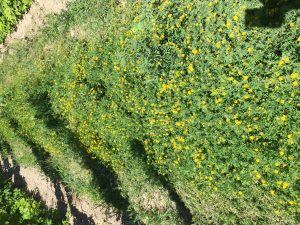
Most ground cover measurements began in April and continued through September each year. Table 3 displays the season-long ground cover results for each ground cover treatment and each year. Weedy ground cover in the control plots was minimal during 2015 when they were disced regularly throughout the growing season (Figs 6A and B). Weeds in the control plots quickly emerged and established significant ground cover through 2016 and remained through 2017 (Figs. 6C and D).
After establishment, barley quickly became the quickest and most consistent ground cover of all of the species tested. Barley produced seed heads quickly after its first mow, with most plots completely headed by 15 May 2015 (Fig. 7A). After the second mow, barley quickly re-produced seed heads then senesced completely by Jul. 2015 (Fig. 7B and C). By Oct. 2015, barley had visibly re-seeded and new plants had completely emerged, although none had emerged in the original 6-ft planted swath of the drill (Fig. 7D). All of the new barley plants were on the outside of swath, in the area where tractor tires travelled and all the way into the hop row. We disced and replanted the barley plots in Nov. 2015. In 2016, barley achieved the best ground cover before heading and senescing (Figs. 8A-D). Seed heads were produced in May 2016, and the barley was once again fully senesced in Jul. 2016. Overall vigor of the barley was reduced in 2016 compared to 2015. This may be caused by barley’s allelopathic nature, or simply because not enough moisture was available after replanting. Regardless, the barley plots still resulted in the lowest season-long weed cover percentage in 2016.
The perennial grasses displayed an opposite trend to barley over the course of the study. Siberian wheatgrass maintained the most consistent season-long ground cover during every year of the study out of every cover crop treatment (Figs. 9A-D). Streambank wheatgrass followed a similar trend as Siberian wheatgrass, but was overall less vigorous (Figs. 10A-D). Hard fescue ended with the highest season-long average ground cover of 72.3% in 2017, and the lowest percentage of weeds. Hard fescue requires at least one year to establish before true ground cover benefits can be realized (Figs. 11A-D). The perennial grasses also differed in how much seed they produced. Hard fescue seeded early in 2016 (Fig. 11A), then produced only minimal seed at any point in the study thereafter. The wheatgrasses produced seed heads in the summer of both 2016 and 2017. During and after seed production, the vigor of the wheatgrasses was slightly reduced. Some plots developed a chlorotic appearance until temperatures cooled again. The hard fescue on the other hand remained dark green, and continued to grow and spread throughout the summer. The fescue thrived in the shade of the hops in the otherwise hot temperatures in August and September, then slowed after the hops were harvested. Vigorous growth returned as soon as the temperature cooled.
Table 3: Average Season-long Ground Cover of Cover Crops and Weeds
|
|
Season-long Average Vegetative Ground Cover |
||||
|
|
Cover Crop Contribution % (SE) |
Weeds Contribution % (SE) |
|||
|
|
2015 |
2016 |
2017 |
2016 |
2017 |
|
Control |
<1.00 |
<1.00 |
<1.00 |
81.95 (3.22) |
84.47 (2.06) |
|
Barley |
84.16 (1.93) |
70.45 (3.40) |
- |
16.38 (3.80) |
- |
|
Siberian Wheatgrass |
59.09 (4.39) |
75.58 (4.95) |
64.65 (3.95) |
20.45 (4.57) |
15.00 (1.74) |
|
Streambank Wheatgrass |
39.05 (5.29) |
71.80 (5.91) |
57.65 (6.33) |
21.38 (4.80) |
22.75 (4.86) |
|
Hard Fescue |
21.92 (3.21) |
40.70 (5.05) |
72.30 (5.40) |
48.98 (5.77) |
13.10 (2.93) |
Soil Qualities
Soil temperature measurements were initiated in the summer of 2016 and continued through 2017. The temperature measurements were not taken at exactly the same time from every plot, but were collected within the same 30-min time frame from each block. Therefore we calculated the difference in soil temperature recorded from cover cropped plots and control plots from the same block. The average results by year are presented in Table 4. Surface soil temperature was not significantly different among any of the cover crops in 2016; however in 2017, we observed that the hard fescue was consistently 1 to 3 °F lower in temperature than the control plots, especially on the hottest days. The fescue resulted in a significant season long average decrease in soil temperature of 2.14 °F compared to control plots. The effects of soil temperature differences on hops, either beneficial or detrimental, are inconclusive in this study.
Table 4: Average season-long difference in surface soil temperature vs. control
|
|
Season-long Average Surface Soil Temperature vs. Control ±°F (SE) |
|
|
|
2016 |
2017 |
|
Barley |
+0.75 (0.35) |
- |
|
Siberian Wheatgrass |
+0.42 (0.09) |
+0.36 (0.64) |
|
Streambank Wheatgrass |
+0.61 (0.20) |
-0.08 (0.70) |
|
Hard Fescue |
-0.09 (0.28) |
-2.14 (0.55) |
Several soil test variables were significantly different among all of the treatments according to an analysis of variance at a 95% confidence level (Appendix), including organic matter, pH, nitrate, potassium, boron, manganese, iron and aluminum. Organic matter was perhaps the most interesting result. All of the perennial grasses resulted in significantly higher organic matter levels than the control, with 0.25% more on average in both of the wheatgrasses, 0.23% more organic matter on average in the fescue plots, and though the increase was not significant, 0.17% more organic matter on average in barley plots. Assuming our sandy loam soil has a bulk density of about 1.55 g/cm3, this 0.25% gain is equivalent to over 10,000 lbs more organic matter than the control plots. This roughly 5-ton gain in the top 1-ft of soil cannot be attributed entirely to the degradation of mowed debris on the soil surface, but more likely contributed from exudates of deep, dense root systems common to grass species and to a lesser degree, microbial remains.
Soil pH was significantly higher in barley and Siberian wheatgrass plots compared to control and hard fescue plots. This same general trend occurred with potassium, sodium, boron and zinc; all of these soil minerals seemed to increase steadily with the grainier grasses. These are many of the same minerals required for the reproductive stage of plants, including flowering and seed production. Additionally, grasses require more potassium than herbaceous plants, and even more so if they are classified as a cereal. It is for this reason that it is not surprising to see the most elevated levels of potassium, sodium, zinc and boron from barley plots which grow and produce seed rapidly, while the lowest levels outside of the control plots were from fescue, which rarely produced seed.
Economic Analysis
Outside of this study, the farm planted tall fescue in other hop yards. As of the 2018 growing season, we observed the tall fescue germinate much more rapidly than hard fescue and achieve excellent ground cover in the first year of planting. While we were initially concerned that tall fescue would cost more to manage from mowing, it tended to lodge as soon as it reached a height of over 12-in. The farm also planted cereal rye as a cover crop in several additional hop yards. Cereal rye establishment and growth was very similar to what we observed from barley.
The most common interrow management in Yakima Valley hop production is still cultivation of the soil to remove and prevent weeds. The next most common interrow management is to allow the weeds to grow, but with occasional mowing to shorten their height and prevent the spread of seeds. Cover crops are an increasingly common management option for hop growers in the Yakima Valley. The preferred cover crop option among hop growers is cereal rye.
To evaluate the economics of cover cropping, we compared two cover crop systems with two non-cropped systems: 1) an annual grain, 2) a perennial grass, 3) disc cultivation and 4) mowed weeds. Current seed prices of an annual grain range from $0.27 to $0.75 per lb, the lower and cheaper end of the spectrum including grains such as cereal rye and wheat, and the higher end of the spectrum includes barley. Price varies more among perennial grasses. Most varieties of tall fescue are currently $2.00 per lb, hard fescue is $2.70 per lb for the variety, “Durar”, Siberian wheatgrass is $3.70 per lb, and ‘Sodar’ Streambank Wheatgrass is $5.40 per lb. Cereals should be planted at 100 lbs per acre to achieve the greatest benefit in ground cover. Most perennial grasses are recommended to be planted at 10 lbs per acre, but as cover crops in the typical soils of Yakima Valley, the planting rate should be doubled to achieve a denser stand in the first year. AS of 2018, we estimate that it costs approximately $6.00 per acre to operate a tractor for any purpose in a hop yard, including labor and fuel.
Our economic scenario also assumes that the hop yard will be removed 5 years from the initial fall planting of the cover crops. New hop cultivars are released almost yearly, and as the market changes, it is increasingly uncommon for a hop yard to remain planted to the same cultivar for a time frame longer than 5 to 8 years. This is a factor when considering a perennial cover crop as it will add complication to the removal of hop plants since root diggers travel perpendicular to planted rows and cannot move as efficiently through a cover cropped interrow.
The planting, maintenance and removal cost estimations of 4 interrow management programs in a 5-year hop production cycle are presented in Table 5.
Table 5. Cost estimation per acre of interrow management programs in a 5-year hop yard, beginning with fall planting after harvest as Year 1, and ending with cover crop removal in fall at the end of Year 5.
|
|
Hop yard Interrow Management Programs |
|||||
|
Operation |
Task |
Frequency |
Annual Grain |
Perennial Grass |
Disc Cultivation |
Mowed Weeds |
|
Planting |
Soil Prep: Discing, Smoothing Soil |
1x before planting |
$6.00 x Years 1-5 |
$6.00 x Year 1 |
$0.00 |
$0.00 |
|
Planting: i.e. Drill |
1x each planting |
$6.00 x Years 1-5 |
$6.00 x Year 1 |
$0.00 |
$0.00 |
|
|
Seed |
1x each planting |
$25 to $75 x Years 1-5 |
$20 to $60 x Year 1 |
$0.00 |
$0.00 |
|
|
Maintenance |
Complete Discing |
3x per growing season |
$0.00 |
$0.00 |
$18.00 x Years 1-5 |
$0.00 |
|
Side-hill Discing |
1x per growing season |
$6.00 x Years 1-5 |
$6.00 x Years 1-5 |
$0.00 |
$6.00 x Years 1-5 |
|
|
Mowing |
3x per growing season |
$18.00 x Years 1-5 |
$18.00 x Years 1-5 |
$0.00 |
$18.00 x Years 1-5 |
|
|
Removal |
Complete Discing, or Other Cultivation |
2x to remove established plants |
$0.00 |
$12.00 x Year 5 |
$0.00 |
$12.00 x Year 5 |
|
Year 1 Total |
$61 - $111 |
$56 - $96 |
$18 |
$24 |
||
|
Years 2-4 Total, Each |
$61 - $111 |
$24 |
$18 |
$24 |
||
|
Year 5 Total |
$61 - $111 |
$36 |
$18 |
$36 |
||
|
Total Cost per Acre after 5 Years |
$305-$555 |
$164-$204 |
$90 |
$132 |
||
Additional Cost Considerations:
- If fescue were planted as the perennial grass, it would likely not require 3 mowings per growing season. One mow is all that would be required in the first year, and two would be plenty in the years after.
- How high the hops are hilled up and what pruning methods are used to smooth them down will drastically affect a grower’s decision on cover crops.
- Our standard production practice used to be cross-cultivation (down as well as across rows) to smooth out hills for efficient and safer string tying, as well as mechanically pruning the plants. Adjusting our standard practice to fit cover crops required at minimum an investment of time, and from some farms can require an investment in new equipment.
- What pests become more prevalent when cover cropping?
- Rodents such as a voles were a severe economic pest in the 2017 growing season. Voles and their trails have been sighted more frequently in cover cropped hop yards on many farms.
- Loopers and other lepitdopteran larvae also tend to be more prevalent in hop yards that have any interrow vegetation growing. Nearly all hops regardless of ground cover are currently treated at least once per season with a larvicide, however, due to increased pressure from the use of pesticides that are safer for beneficial arthropods.
- Other pests and diseases may be correlated with cover crops, but at present, we don’t have sufficient evidence of the effects a cover crop has on diseases or other pests in hops.
Benefit Considerations
What are the values of the benefits of satisfactory ground cover in a hop yard?
- Reduction of arthropod pests:
- Two-spotted spider mites are the most economically impactful pest of hops, and they thrive in dusty conditions for a variety of reasons presented in the proposal of this research. How would reducing dust in a hop yard impact a mite management program? Miticide sprays may be more effective, or fewer sprays may be required. While working in hops throughout the Yakima Valley, I have observed hop yards that are cover cropped generally require at least one less miticide spray than hop yards with disc cultivated interrows year-after-year. The correlation and significance between cover crops and two-spotted spider mites is still being developed. However if a farm can eliminate one miticide spray, they will save $15 to $100 in chemical costs in one growing season.
- Reduction of weeds:
- Established cover crops resulted in reduced ground cover from weeds. Some cover crop species, such as barley, are allelopathic and exhibit herbicidal activity against weeds.
- Discing also results in significant weed cover reduction in hop interrows; however, dust can be a larger problem due to its effect on spider mites. Between spider mites and weeds, spider mites are a much more severe and economically impactful pest to manage in hop yards with fewer chemical control options.
- Marketing
- Several hop farms are Global G.A.P. certified or participate in other sustainable farming or good agricultural practice programs. These programs often suggest or require a farm to implement dust control strategies in hops.
- Brewers are the main customers of hop growers, and they are an involved customer: hop harvest and the month beforehand is a common time for brewers to visit, check the hops they’ve purchased, and select others that they haven’t yet purchased. The appearance of the hop yard is thus an important marketing tool. Discing interrows has been effective at removing weeds and is a preferable appearance compared to a weed cover, however the fine, talcum-like dust produced from this practice can be irritating to visitors in the slightest wind. Cover crops can be a great alternative for both weeds and dust, and grasses look comparably nice when planted thick and mowed before harvest.
- Soil qualities
- The significantly greater organic matter of cover cropped interrows may not directly influence hops since they are grown outside of the cover cropped swath; however the gain in soil organic matter in interrows would rapidly benefit any new hop plantings that would follow their removal and subsequent mixing or cultivating of the soil.
- Options to increase organic matter in Yakima Valley hops include compost, partially composted manure, hop harvest waste, and even humic acids and other organic acids applied through the drip system. An average composted manure in our area would contain approximately 225 lbs of carbon per dry ton of material, and typically costs $20 to $25 per ton applied. A 5-ton increase in soil organic matter would therefore require more than 44 tons of this composted manure. Such a rate would be detrimental due to excessive phosphorus, potassium and salts. If the goal is to increase organic matter of the overall hop yard, a cover crop is one of most economical ways to do so. Additionally, organic matter from root exudates is already incorporated throughout a 1-ft depth of soil, whereas most other inputs are surface-applied. This being said, there benefit from a diverse source of inputs in hops to achieve various physical (i.e. drainage), chemical (i.e. minerals or pH) and biological goals for the soil.
The mineral differences resulting in this study (i.e. potassium, boron, zinc, etc.) can be considered beneficial depending on what a specific hop yard needs. For example, potassium was already present at adequate or high levels in our test hop yard, so the increase in potassium in the top foot of soil was not needed. It was likely collected from deeper feeder roots from leached/excess potassium applied to hops over the years. Boron and zinc are almost always deficient in hop yard soils in the Yakima Valley. Direct mineral benefits would vary most and would be difficult to attribute value to outside of the context of a specific hop yard.
Research Outcomes
Education and Outreach
Participation Summary:
Several individuals and groups from different farms have visited the cover crop trail site for a more personalized tour. These are really all the same farms and people that would attend if we held a field day for the trial. A poster was produced that is currently on display at the local Washington State University Research and Education Center in Prosser, WA. The hop cover crop project was included in the overall presentations at the winter hop growers meetings in 2016, which were well-attended. At least 50 individuals from different farms and at least 24 other professionals working in the hops industry throughout the Pacific Northwest were in attendance. The final results of this project will also be presented at the 2019 Washington Hop Growers meeting in Yakima, WA on January 4, 2019. Nearly all Washington hop farmers attend, as well as other hop industry professionals such as researchers and consultants. Additionally, this project was mentioned in an emailed newsletter from Hop Growers of America to all hop farmers on their mailing list.
Some current impacts from this research include larger scale planting of cover crops on the farm, and interest among some researchers and professionals in conducting further studies to analyze the effect of cover crops on hop pests and diseases as well as hop characteristics, yield, and quality. Several farms that have increased the acreage of cover crops planted in their hopyards have visited or discussed this project with us. The Yakima Valley as a whole has experienced significantly more cover cropped hop acres in the past 5 years, and the trend seems to be continuing. Limitation of effective miticides seems to be one main driver for this trend (eliminating dust).
Education and Outreach Outcomes
We made some key assumptions with our research, including:
- The relationship of increased soil conservation from covered ground, and subsequent reduction in dust
- That weeds are not as good at preventing dust than low-stature, high-density cover crops
The soil test results were also key data for further insights into the value and sustainability of the different cover crop species tested, even if conclusions cannot be drawn from this study alone.
Along with this study, past research, and individual farm trials, hop growers are increasingly aware of the best management scheme for their individual hop yard interrows. Where we still lack information as an industry is on true effect of cover crops on pests, diseases, and hop qualities (i.e. yield or cone color) compared to disced interrows. Undertaking pest and disease research related to cover crops in commercial hops has never been more possible than it is now that more acres of hops throughout all regions of Yakima Valley are planted with cover crops. At least two university scientists and extension professionals have expressed interest in proposing studies to examine the relationship of spider mite and powdery mildew populations with cover cropped and traditional disced interrows in hops.
Information Products
- Cover Crops for Hop Production in Semi Arid Climates (Conference/Presentation Material)