Final report for FW18-034
Project Information
PROGRESS UPDATE
Mid March 2018:
After being selected for funding, photopoints were set (Figure 1 & 2). The first Facebook announcement regarding the experiment was posted to the Graze & Sprout Farm Page. The image was an interactive panoramic photo of the first photopoint at the top of the property. This photo is interactive and shows/introduces the audience to our Intensive Rotational Grazing (IRG) System. The next related post was a video of the chickens grazing the grass and getting a little treat of cauliflower from the garden. The second post was a video of chickens grazing and was a huge hit with more than 1,800 people reached. Posts continue more than once monthly until October. We were a bit lax during the holidays, but will pick back up.
End of April 2018:
We received grant funds. Materials were also ordered for sampling, research tools, and fencing materials.
May 2018:
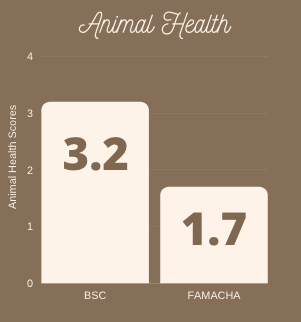
Scheduled meeting with the vet (Christy Balcomb). Dr. Balcomb collected data (FAMACHA, Body Condition Scores (BSC) and Fecal Test) on seven (7) sheep prior beginning the experiment. The BCS is based on an scale of 1-5 and is defined: (1) 20% or more underweight; (2) 10% underweight; (3) Ideal, unless pregnant or nursing; (4) Ideal if pregnant or nursing; (5) 20% Overweight. Our sheep scored an average of 3.21 on a 5 point scale (Figure 4). A score of between 3-4 on the BCS is ideal for sheep.
FAMACHA score were also taken. FAMACHA Score uses eyelid color as an indicator of anemia and parasite load. The lighter/more pale the eyelid color the more anemic the animal and the more likely the animal has the blood-feeding parasite barberpole worm. The FAMACHA Scoring System is defined: (1) Optimal, no dewormer needed; (2) Acceptable, no dewormer needed; (3) Questionable, dewormer needed if fecal score is high; (4) Dangerous, dose with dewormer; (5) Fatal, dose with dewormer immediately. The average FAMACHA score is 1.74, indicating a very low level of anemia and suggesting a low to absent level of barberpole worm.
Fecal Examination was performed. The Fecal Examination is used to determine parasite load of: (a) strongyles, (b) coccidia, and (c) tapeworm. The parasite levels were low over all, with the exception of two sheep (Cosmo and Mini). Cosmo showed a heavier burden of strongyles and coccidia. Her heavier parasite load is not surprising as she has had issue with digestion and weight gain in the past. She was treated with a chemical dewormer in January of 2018 and recovered rapidly upon treatment. These results suggest that Cosmo may be more predisposed to parasite and digestive issues than the other sheep. Of note, Cosmo suffered a prolapsed anus shortly after this report was written. She had to be put down due to irreparable damage. Mini demonstrated a heavier load of coccidia than any of the other sheep. She will be carefully monitored to make sure her body condition does not suffer. Overall, Dr. Balcomb did rated parasite load as below average, with no need for deworming treatment.
We can conclude that the sheep were in excellent condition at the start of the experiment with ideal BSC scores, excellent FAMACHA scores, and below average worm load counts. We will compare these data at the end of the study to make sure that the animal health is not compromised via the IRG grazing system.
June 2018:
Technical Advisor (Christina “Bena” Pegg) tried to schedule experimental set-up for June-July, but both of us had unexpected travel plans come up in these months and were unable to schedule. We had to postponed the experimental start date from June to August.
While on the Mainland, Bena contacted MidWest Laboratories to clarify some questions around sampling. She also created a more detailed plan for sample collection so we could hit the ground running in August. From this plan, I set up and marked out the Treatment Group locations in the field.
July 2018:
The Facebook announcement was made early in March, soon after our grant received funding. The website domain grazeandsprout.com was purchased and a template was uploaded. However, the template is so large it bogs down the server making it next to impossible to load or edit the site. At this time I have not had the time or resources to figure out how to fix this technical glitch.
August-September 2018:
The full IRG + IMO program began in the September 2018. Sampling began in late August and finished in early September. Samples cores were taken at a depth of 6 inches. A total of 7 treatment groups were sampled: (1) Mowed control; (2) Rested Pasture; (3) Sheep Alone; (4) Chickens Alone; (5) IMO Alone; (5) Sheep + Chickens; (6) Sheep + Chickens + IMO. For each sample, 5 cores were taken, sifted of any debris, and mixed to form a uniform sample from which about 1 cup of soil was packaged and shipped to MidWest Labs for analysis. Completed data was received in Mid-September.
November 2018: Bena analyzed and complied graphs for Mowed Control vs. Sheep + Chickens. Upon analysis it became apparent that t-test comparison between groups would be ineffective given the amount of data collected. She is currently working to revise analysis to include all treatment groups, but this time using ANOVA statistical analysis to compare all groups at once. Nonetheless, the first comparison between Mowed Control vs. Sheep + Chickens is informative (Figure 8-17).
Results:
Total Carbon (TOC), Total Nitrogen (TN), Carbon: Nitrogen ratio (C:N), percent organic matter (%), bulk density (g/cm3) were compared (Figure 8). TOC, TN, CN, OM% were all significantly lower in the Sheep + Chickens group than the Mowed Control/Rested 2.5 years. Nitrates where significantly high in the Sheep + Chickens groups when compared to Mowed Control. Potassium (K) and were significantly increased in Sheep + Chicken group when compared to Mowed control (Figure 9). Magnesium (Mg) and Sodium (Na) were significantly reduced when comparing Sheep + Chicken to Mowed control (Figure 9). Calcium, soil pH, Buffer Index, and Cation Exchange Capacity were significantly increased in Sheep + Chicken when compared to Mowed Control (Figure 10). Sulfur (S) and Copper (Cu) were significantly lower in T5 (sheep + chicken) when compared to C1 (mowed control). CO2 Burst was significantly increased in T5 (Sheep + Chicken) when compared to C1 (mowed control).
Soil-Sampling-Results-Baseline
Discussion:
Data in Figure 8 is in direct opposition to established data that suggests Carbon increases in the soil when animals (cattle) are grazed in an IRG fashion. A confounding factor may explain this seemingly contradictory data. Some 15-20 years ago, the pasture where all of our treatment groups are was grazed exclusively by a horse without any management for as long as 15 years. Whereas, the sample taken from the Mowed Control/Rested 2.5 years was taken from a part the property that was never grazed by the unmanaged horse. Thus, we may be seeing the long-term effect of unmanaged grazing showing up in our data. To determine if this is true, we will add a another sample group in the pasture that is also mowed for the final round of sampling.
Interestingly, nitrates were significantly increased in Sheep + Chickens zone when compared to Mowed control. This is likely due to an increase in nitrates from the chicken poop. The contradiction of increased nitrates and decreased nitrogen is yet to be determined. Analysis of Minerals and Soluble salts is yet to be completed.
Increase in Calcium in the Sheep + Chicken group is likely explained by the high calcium feed provided to the chickens and the high calcium mineral provided to the sheep. Not all of the calcium is absorbed by the animals and thus, some is deposited onto the field in manure. The increase in calcium on the field likely contributes to the increase in pH as increase calcium ions in the soil helps to displace hydrogen ions and created a more basic soil. The same principle is true for the high Cation Exchange Capacity. Finally, an increase in Microbial Burst suggests that there are more aerobic, respiring organisms in the soil in the Sheep + Chickens zone when compared with the Mowed Control. This supports the theory that animals can increase microbial life in the soil when managed properly.
February 2019: Bena will complete analysis of the data and contact Maui Farmers Union to set up our presentation.
Additional Items to complete:
Supplementation thus far has been limited to 6 bales of hay and trees cut from the outer edge of the pasture. Dumor Sheep Mineral has been provided free choice. This data will be factored into the final calculation for animals per acre. The winter cycle is approximately 80 days and the summer cycle is approximately 45 days. We have completed two deliveries of IMO onto the test plots. Compaction tests need to be completed at the conclusion of the experiment (September). Additionally, slope and aspect need to me measured at this time.
FINAL REPORT
Can Intensive Rotational Grazing in combination with Indigenous Microorganism Application Improve Soil Conditions (i.e., soil carbon, minerals, microbial life)?
Half the world’s topsoil has been lost in the last 150 years. The situation is becoming so severe that some experts believe that we will run out of topsoil in 60 years. Overgrazing livestock has been identified as one of the main contributors to soil degeneration and topsoil loss.
Static state or minimal rotational grazing results of domestic grazing animals results in compaction of soil, loss of cover, and topsoil erosion. On the other hand, removing wild migratory grazing animals from rangelands has proven deleterious to ecosystems. Thus, the questions is: Does overgrazing and soil loss arise from the presence of grazing animals or does it happen due to mismanagement?
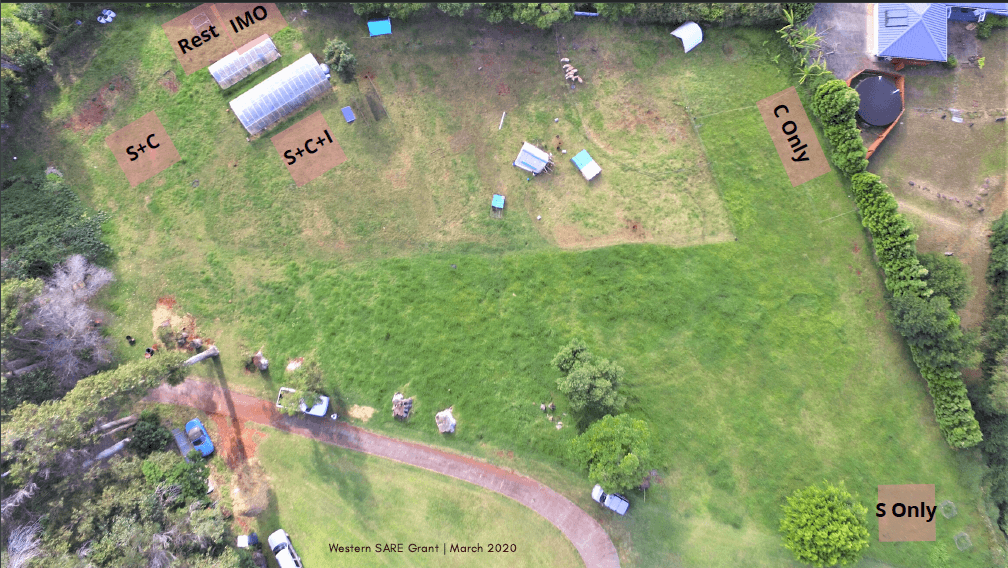
Our study aims to determine if soil condition can be improved by Intensive Rotational Grazing (IRG) in combination with Indigenous Microorganisms (IMO) cultivated by Korean Natural Farming methods. The treatment groups are the control (rested pasture/no treatment) vs. IRG Pasture (experimental groups: sheep alone; chickens alone; sheep + chickens; sheep + chickens + IMO).
IRG is managed according to grass cycles and regrowth. For our grass and climate roughly a 90 cycle was followed during rainy season and a 60 day cycle was followed during dry season. Animals were given 3 and 2 sections per day, respectively. Supplementation of timothy hay was provided in small amounts in rainy season as needed. Chicken feed was supplemented in dry season on occasion. These supplements are accounted for in carrying capacity measurements.
Parameters measured are: animal condition (body condition; parasite load), percent organic carbon & nitrogen, productive capacity (forage and animals), pH, microbial life, and minerals. Unfortunately, through minerals were measured for all treatment groups, no conclusive data could be gathered. For this reason the mineral data is not included in this report. Animal parameters (FAMACHA, Fecal, and Body Condition) were measured by a trained veterinarian. Animal measurements were taken to assure that IRG method did not cause harm to the animals.
Data was collected at the start of the experiment (t = 0) and at the end (t = 1 year). Analysis across groups (ANOVA) proved unsuccessful because of the high variability across treatment groups. Analysis instead focused on longitudinal (temporal) changes between the start (t = 0) and end of the experiment (t = 1 year). Treatment groups were compared to their baseline after 1 year of treatment using Student T-Test. Significance was assigned if p < 0.05.
An aerial photograph of the experiment is shown here. Treatment groups are layout out according to experimental design. Location of treatment groups were chosen to control upon slope and aspect. Treatment group locations were also chosen according the to the USDA Soil Map in order to select areas with similar soil types.
Sampling began in late August and finished in early September. Sample cores were taken at a depth of 6 inches. A total of 7 treatment groups were sampled: (1) Mowed control; (2) Rested Pasture; (3) Sheep Alone; (4) Chickens Alone; (5) IMO; (6) Sheep + Chickens; (7) Sheep + Chickens + IMO. For each sample, 5 cores were taken, sifted of any debris, and mixed to form a uniform sample from which about 1 cup of soil was packaged and shipped to MidWest Labs for analysis.
Animal Condition Scoring Parameters
Dr. Balcomb collected data on parasite load (FAMACHA and Fecal) and took Body Condition Scores (BCS) on all animals (7).
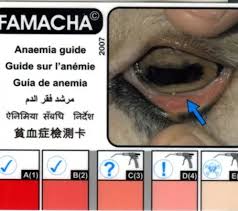
FAMACHA uses eyelid color as an indicator of anemia and parasite load. The lighter/more pale the eyelid color the more anemic the animal and the more likely the animal has the blood-feeding parasite barberpole worm. The FAMACHA Scoring system is defined:
- Optimal: no dewormer needed;
- Acceptable: no dewormer needed;
- Questionable: dewormer needed if fecal score is high;
- Dangerous: dose with dewormer;
- Fatal: does with dewormer immediately.
Illustration of FAMACHA Scoring System
The fecal examination is used to determine quantitative parasite load of: (a) strongyles, (b) coccidia, and (c) tapeworm. Fecals samples were taken from animals and dissolved in aqueous solutions. Known volumes were counted for number of worms. The veterinarian performed this test and determined cut-offs for deworming.
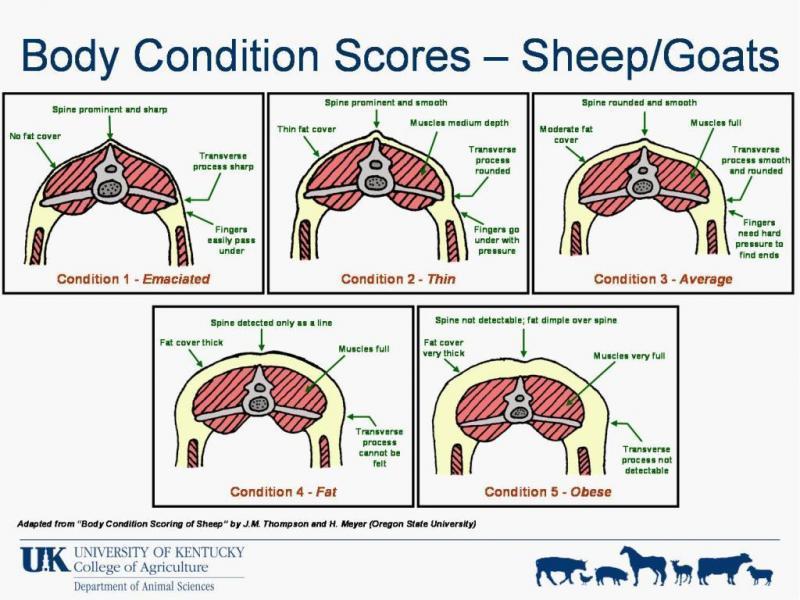
Body Condition Score (BCS) is based on a scale of 1-5 and is defined:
- 20% or more underweight;
- 10% underweight;
- Ideal, unless pregnant or nursing;
- Ideal if pregnant or nursing;
- 20%
Animal Condition Scoring Results
The average score FAMACHA for our animals was 1.74; indicating optimal health and low to non-existence of barberpole parasite. Worm counts were below amount requiring deworming, except for in one animal that showed moderate burden of strongyles and coccidia. She was a “poor doer” with inadequate digestion. She eventually had to be put down for prolaspsed anus. The average Body Condition Score was 3.21 on a 5 point scale. A score of between 3-4 on the BCS is ideal for sheep.
Dr. Balcomb stated that the FAMACHA and Fecal scores were some of the lowest she had seen on the island and when compared to similar wet climate zones. She also stated that the animals had overall body condition and health seemed ideal to optimal. We can conclude that the sheep were in excellent condition at the start of the experiment with ideal BSC Scores, excellent FAMACHA scores, and below average worm load counts.
Unfortunately, we were unable to get a second round of data on the animals at the completion of the experiment due to loss of data, which we never received from Dr. Balcomb. However, since the animals were IRG grazing for 1.5 years prior to this experiment, we believe that the baseline study is enough to demonstrate that this method is not harmful to the animals.
Productivity
Photopoints were taken at the beginning and end of the experiment. Overall, improvement of grass coverage and production can be seen when 2019 is compared to 2018 in the photos. Taking each photopoint one by one, we can discuss a few interesting observations that came up in these images.
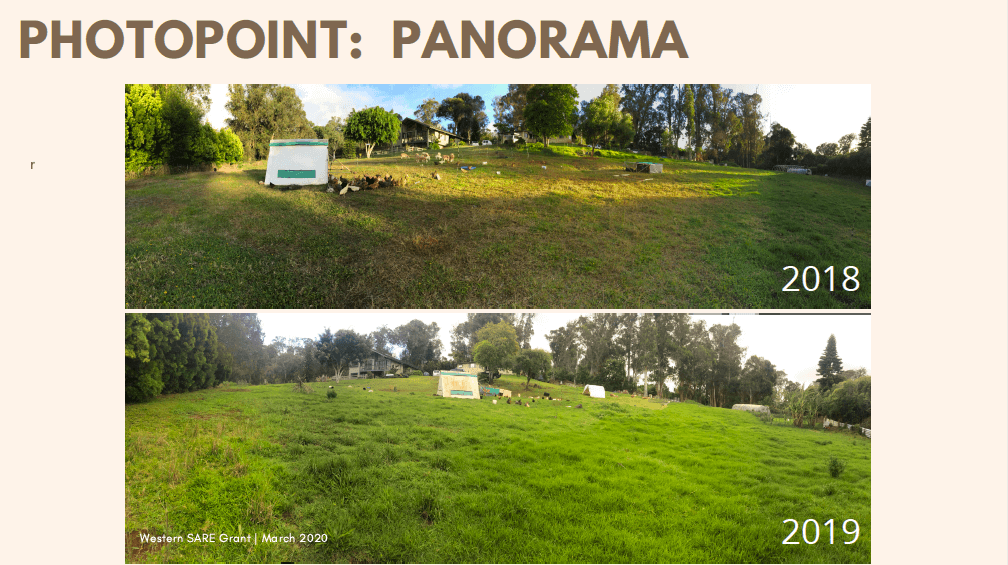
The first Panorama image show’s patchy, dry grass in 2018 and lush green grass in 2019. Also, of interest in the 2019 photo we see in the mid-ground on the right side that a garden has been added. In the far-ground right side a greenhouse has been added. There is also an added squash patch and tomato patch in the center. We estimate approximately 0.2 acres was removed from 0.9 acres of grazing land that we started with. This number is accounted for in the animal units calculation. The photos demonstrate that even the removal of approximately 20% pasture, land health and productivity was improved.
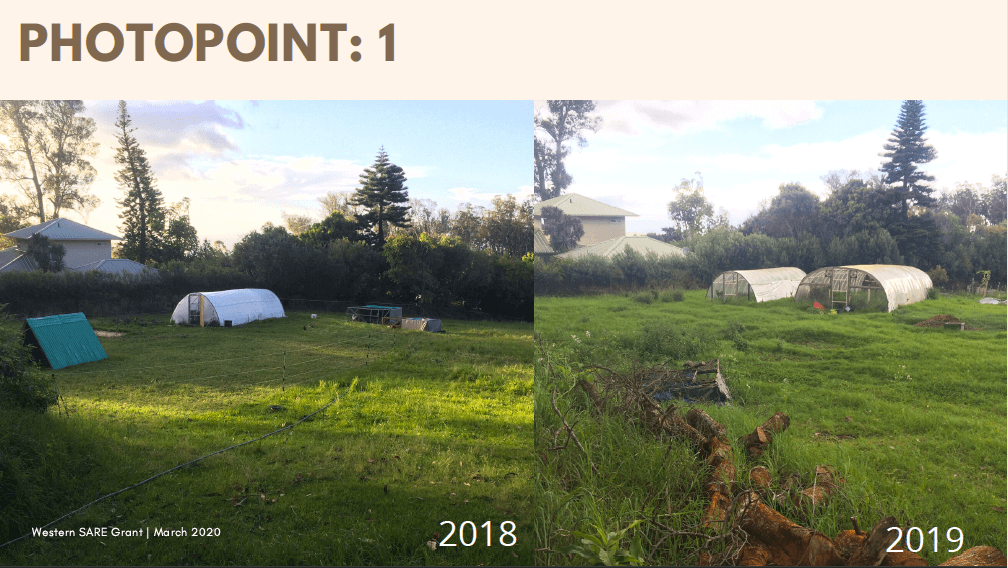
Photopoint 1 is the region where we measured Sheep + Chicken impact. Unfortunately, where we layed out the location for the Sheep + Chicken zone also happened to receive full shade for 4 months in the winter. We had a severe, extended rain event during the winter and the pasture was mucked up and denuded in this area because the shade had weakened the grass. When the animals came through they trampled and mucked up the land. However, even with all of that impact, the land still appears improved and healthy in the 2019 photo. Also, of interested, the disturbance caused a large number of forbes (some native) to establish in this area.
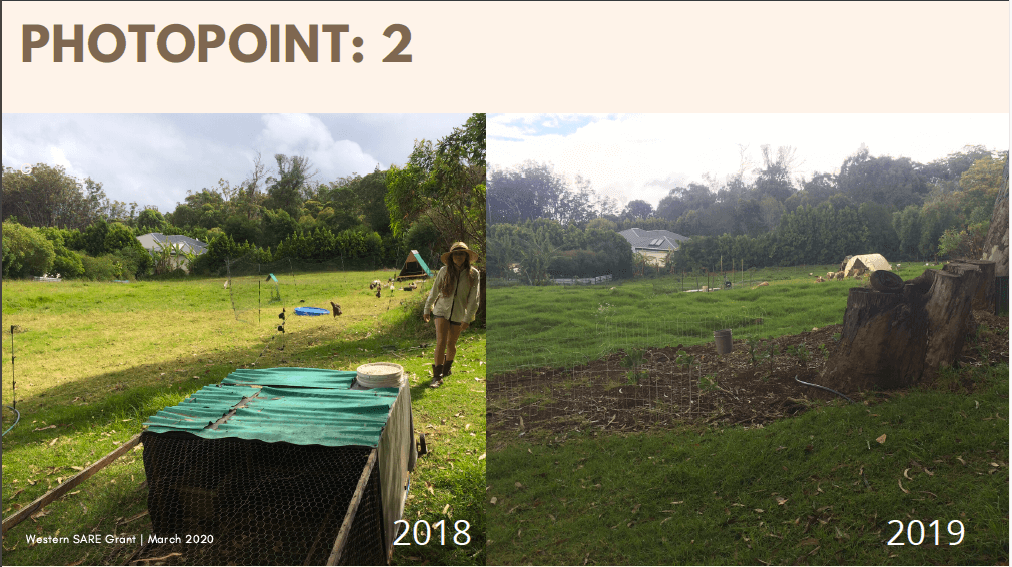
Photopoint 2 shows another garden that was made in the pasture. This small garden was created after this aread had be mucked up in the winter. It is adjacent to Photopoint 1 and had the same issue of being shaded in the rainy season. Here instead of allowing the pasture to regrow as in Photopoint 1, we decided to turn it into a small garden for Kale.
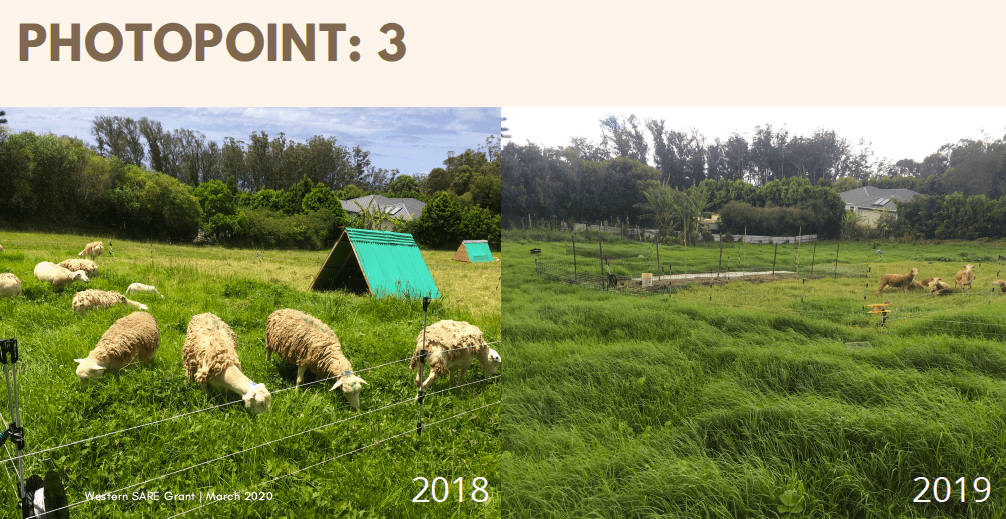
Photo point three shows the change in species from 2018 to 2019. There was a large amount of invasive glycine in the pasture in 2018. By 2018 it had all been removed. We believe this is due to the quick cycle that we had the animals grazing in the summer (50-60 days). The glycine prefers a longer rest period to recuperate. Without the long rest period, it was unable to bounce back and the kikuyu graze eventually outcompeted it.
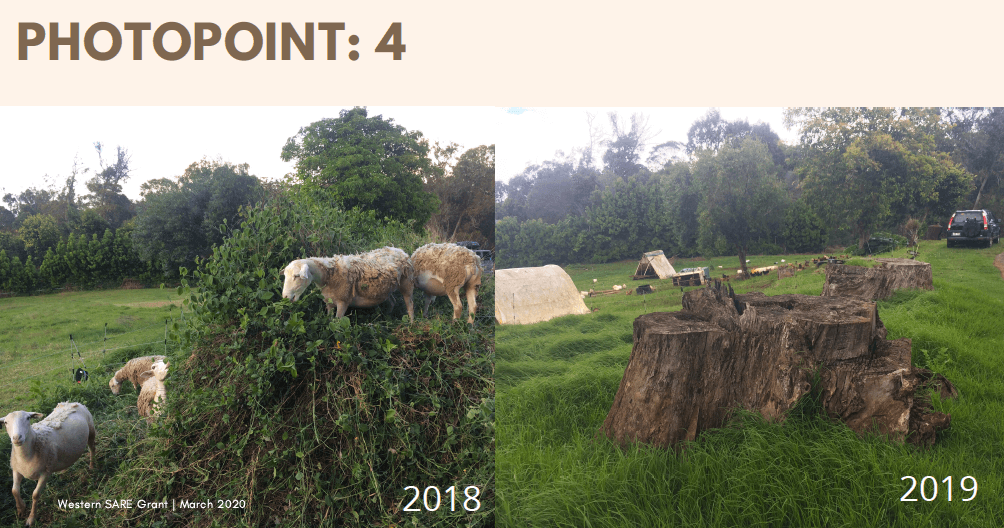
Photopoint 4 also show the eradication of invasive glycine species. This is important because the current methods used to remove glycine is to spray it with Round-Up weed killer. Round-Up is a known carcinogen. It would be incredible to see the protocol shift from toxic chemical elimination of invasive species to managed grazing elimination. We’ve demonstrated it is possible in this study.
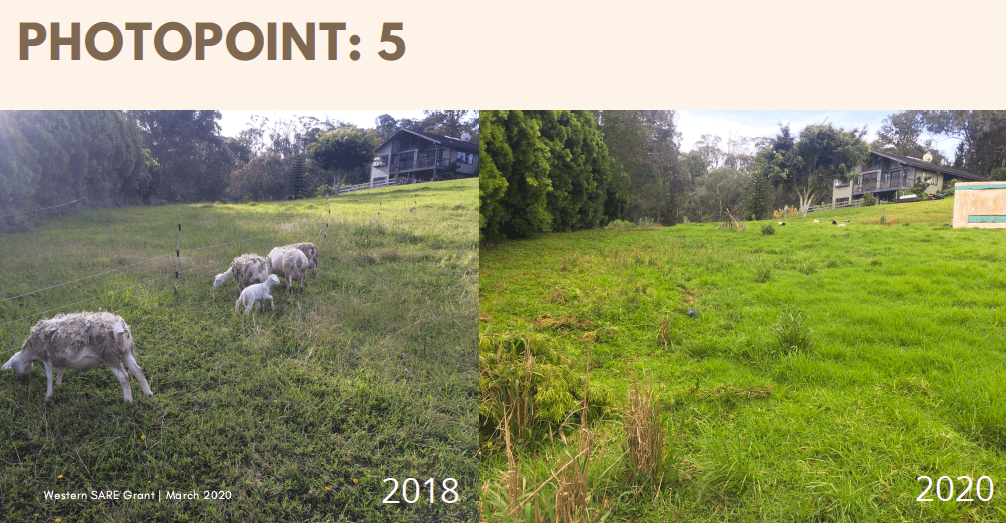
Photopoint 5 shows improvement, more green, less patchy, more lush grass. Also, of interest in this region of the pasture was Wadelia—an invasive groundcover. It can be seen in the foreground of the 2018 photo: dark green forb with yellow flowers. The area shown in the 2018 was about 60-70% Wadelia when we first started our grazing program (2017). Through time kikuyu, crab grasses, and paspalum took hold. Now there is almost no Wadelia in the pasture. Again, we suspect that Wadelia requires a longer recovery period than kikuyu or crab grasses that took over. It is another good example of using animals as an organic method to eliminate invasive species.
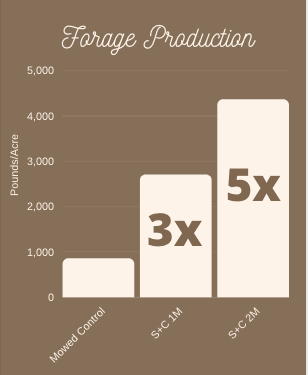
Forage Production
Forage Production was measured using the Hoop Method as described in the paper “Stocking Rate: The Most Important Tool in your Toolbox.” Forage production was measured at the end of the experiment at one month and two months of rest after grazing. Samples were taken in a representative region of the Sheep + Chicken grazing zone. At one month, production was 3x that of the mowed control. At two months, production was 5x that of mowed control.
Animal Carrying Capacity
The carrying capacity accounts for number of acres grazed, number of animals, and supplementation. One animal unit is defined as 1000 pounds. We determined our animal units to include both sheep and chickens. Chickens are included because they have high impact on the grass, even if they do not get their total diet from forage.
In 2020, carrying capacity reached 3.12 animal units per acre. This an increase of 2.6 times our original carrying capacity and it is an increase of approximately three times (3X) the “recommended[1]” animals units per acre.
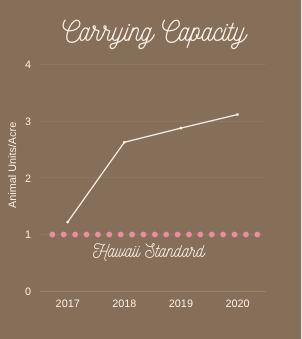
These data show that grass production improved 5 times when compared to mowed control. They also show that carrying capacity is 3 times the “Hawaii Standard” carrying capacity overtime. These data taken together show that IRG managed animals can improve the productivity of the land rather destroy or hinder productivity.
The fact that our study demonstrates large increases in productivity (forage production and animal carrying capacity) is counter to studies that state animals are inherently destructive to the land. This discrepancy implies that management techniques are critical when it comes to the outcome and productivity of the land.
An anecdote that has been used to describe this discrepancy is: “It’s not the cow, but the how.” How we manage animals on our lands is critical to shifting the balance from destruction to rejuvenation. The nuances of this management require attention to detail particularly with regard to grass cycles and pasture health; weather patterns; rain events; and seasonal productivity. When one takes care to manage for productivity of the grass and the land, the animals inherently benefit and also increase in productivity.
Soil Health
Preliminary analysis was performed across two groups (Sheep + Chickens and Mowed Control; at t = 0) (Progress Report). At first the data appeared to be telling. But when other groups were added, it became clear that the baselines taken were too varied across groups to draw conclusions. Given the initial variability between groups, it was decided not to measure data between groups. Instead analysis focused on each group compared to itself through time; at t = 0 and t = 1 year (t-test).
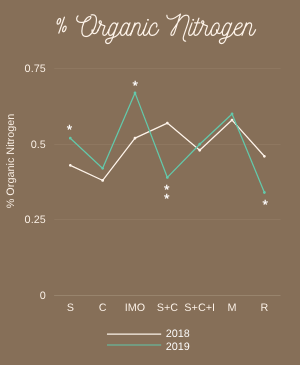
Percent Carbon & Nitrogen Results
Total Organic Carbon (TOC) or Total Nitrogen (TON) is a measure of organic carbon or nitrogen in the soil after inorganic carbon or nitrogen is removed. It is an indicator or living, once-living or natural debris. Bulk density ratio (O:N) was included in calculations to determine Percent Carbon or Nitrogen.
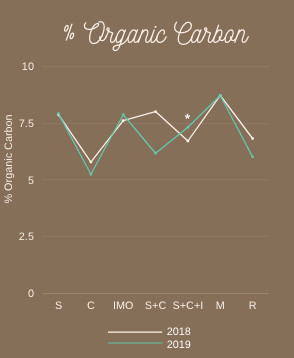
Change in %Carbon was only significant in one group: Sheep + Chicken + IMO. The increase in 2019 was 0.61% above 2018 (p = 0.024; p < 0.05).
There was a significant increase in %Nitrogen in Sheep Only and the IMO Only Group. The Sheep Only group increased by 0.1% Nitrogen (p = 0.02; p < 0.05) and the IMO Only Group increased by 0.15% Nitrogen (p = 0.03; p < 0.05). There was a significant decrease in %Nitrogen in the Sheep + Chicken group (-0.18%; p = 0.002; p < 0.01) and in the rested pasture groups (-0.12%; p = 0.015; p < 0.05).
The 0.61% increase in %Carbon in the Sheep + Chicken + IMO zone makes sense because animals were grazing the grasses that feed the soil when roots die off after grazing. Additionally, IMO’s provide microbial cultures that help the soil life thrive and reproduce. Given that other zones did not increase, it suggests that the combination is important. The inoculation of both the soil and manure facilitates the efficient breakdown of manure and integration into the soil.
The increase of 0.61% carbon may seem like only a small amount, but it is in fact quite large;
background information is required to understand this number in context. First, a mere 2% increase in soil carbon across currently cultivated lands would restore our soils and return pre-CO2 to pre-industrial levels in the atmosphere (Dr. Rattan Lai). Second, currently established methods such as no-till farming and covercropping sequester about 0.1% and 0.2% carbon per year, respectively.
Thus, the observed 0.61% increase in soil carbon over a one year period of IRG grazing (sheep + chickens) and with a modest amount of IMO application (4x that year), resulted in large capture of carbon in the soil. It was more than 6 times that of no-till farming and more than 3 times that of covercropping.
Taken as a measure of what is possible per year, we could estimate that at 4 years time, 2.44% carbon could be drawn down into the soil. Thus, this data gives us a tangible (though still theoretical) perspective on creating large scale agricultural carbon sinks if this method is followed. Moreover, integration of other planting methods in a grazing system such as covercropping and fruit/nut/fodder trees on keyline in the currently cultivated fields would only increase carbon sequestration with animal grazing and IMO application providing the much needed nutrient cycling for a healthy and thriving system.
Water-holding capacity associated with carbon is also of interest. For every 1% of carbon increase in the soil there is a 25,000 gallon increase in water that can be held per acre. This means that according to our research our 0.61% increase of Carbon would result in an additional 15,250 gallons of water per acre. By increasing the absorption capacity of the land, we are increasing the ability of the land to take up water in rain events and hold it in drought events.
This is important because as rain and drought events become more severe, soil’s ability to absorb and hold the water becomes more critical. By increasing carbon in the soil we are in some sense making a “sponge” out of the land. Carbon in the soil translates more or less into life in the soil. Whether it be microbes, fungus, or other small creatures/bodies, it is the life in the soil that makes the dirt into Earth. Excrements and secretions given by these animals and the bodies of the fugus themselves, provides organic matter structures that hold water better than dry dirt.
This study demonstrated a significant increase in Nitrogen in the Sheep Only group (+0.1%, p < 0.05). A significant increase in Nitrogen was observed in the IMO Only group (+0.15%, p <0.05). Excellent grass coverage and continual grazing/manuring in the Sheep Only group, likely contributed to accumulation of nitrogen rather than its loss. The IMO group also had excellent coverage and continual (4x) addition of microbes to the soil, likely contributing to the assimulation rather than loss of N. We are not sure why and increase in nitrogen was not observed in the Sheep + Chicken + IMO group.
This study also showed a significant decrease in %Nitrogen (-0.18%) in the Sheep + Chicken zone. We believe this is was due to the fact that this zone was in the shade. During the rainy season, the high impact and low light resulted in bare ground. Bare ground is one of the fastest ways to lose carbon and nitrogen from the soil. This is because the soil can become dried out, overheated, and does not get fed the proper nutrients coming from grass or forb roots. A combination of desiccation and starvation results in the death of living organisms in the soil. With the soil exposed to the elements the organic matter (carbon and nitrogen) from these organisms volatilizes into the atmosphere.
Additionally, nitrogen found in chicken manure is highly volatile. It’s absorption into the soil depends on both moisture and coverage. Without grass cover to hold moisture, chicken manure dries out quickly and nitrogen volatilizes into the atmosphere rather than being absorbed into the soil.
There was also a significant decrease in %Nitrogen (-0.12%) in the rested pasture may be explained by no animal manure being applied in this zone. Also, without grazing grass roots do not cycle (die off, regenerate; die off, regenerate). This cycle of death, decay, and regeneration results in nutrient cycling that feeds the soil and soil life. Without it there is less food and less accumulation of nitrogen in the soil.
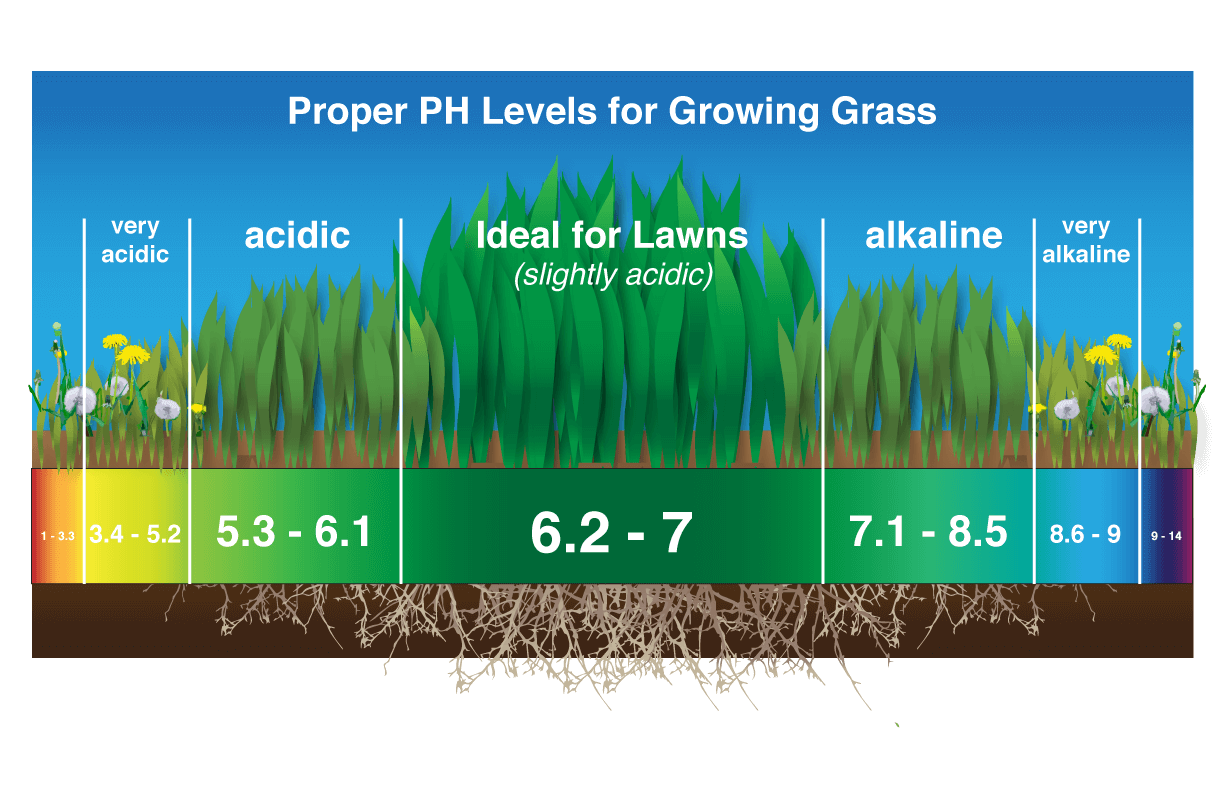
Soil Acidity
The acidity of the soil is a measure of hydrogen ions in the soil (less than 7 is more acidic; more than 7 is less acidic). The ideal range for a healthy soil is considered to be between 6.2-7. Established research suggests that when the pH is in this ideal range, mineral availability is balanced and accessible for the plants.
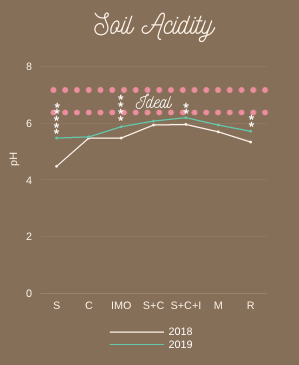
All groups except for the Chicken Alone group and the Mowed control increased in pH and moved closer toward the ideal range when 2019 was compared to 2018. An extremely significant increase from 4.84 to 5.48 was observed in the Sheep only group (+0.64, p = 0.00001; p < 0.00001). The IMO Only group had a highly significant increase which from 5.48 to 5.88 (+0.4, p = 0.00019; p < 0.001). The Sheep + Chicken + IMO group had a very significant increase from 5.86 to 6.2 (+0.34, p = 0.0045; p < 0.01). The Rested Pasture group had a very significant increase from 5.34 to 5.73 (+ 0.39, p = 0.0068; p < 0.01).
In all groups pH increased and began to approach ideal levels. Regarding the relative significance of each group it is easiest to consider Sheep Only group as an example for understanding. This group had the highest observed increase not because the Sheep Only were somehow the best for the soil, but rather because the soil started out with the lowest pH in the region where the Sheep Only group was tested. Therefore, the Sheep Only region had the highest potential for improvement for pH because of its very low starting point.
This trend seems to be true for the IMO Only and Sheep + Chicken + IMO groups. The Rested Pasture group started as the second lowest and improvement was the lowest. This data suggests that animal manure and IMO application are important for pH balancing.
According to Elaine Ingham, healthy, living soils will naturally balance their pH via biological processes that occur in the soil food web. We suspect that this is the reason for the increasing pH balance observed in our data.
Microbial Life
Microbial life was measured using the Solvita CO2 Burst test. The amount of CO2 given off was measured. CO2 indicates active respiration of microorganisms and can be used as a measure of microbial life in the soil.
Microbial Life
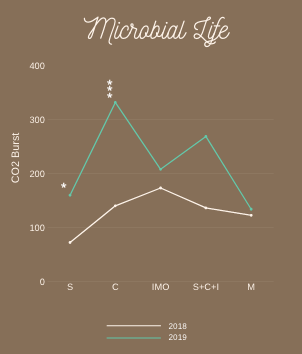
A highly significant increase in microbial life was observed in the Chicken Only group (+191.7 ppm CO2-C, p < 0.001). A significant increase in microbial life was observed in the Sheep Only group (+87.64 ppm CO2-C, p < 0.05).
The highly significantly increase in the Chicken only group was likely a confounding factor because samples were taken the second time directly after the chickens had moved to the next grazing zone. The first collection was done ahead of the chickens. This difference in collection likely shows an increase due to increased fresh chicken manure in the samples, rather than an increase in the soil. The observed increase in the Sheep Only group was done ahead of Sheep grazing and can be trusted. The nonsignificant increase in the Sheep + Chicken + IMO group is likely due to the high variation in the samples.
It will be important in the future to be very careful gathering samples for this test. Of note is that samples must be gathered at the same time in the grazing cycle each time. Also, animal excrement and debris must be carefully removed to assure that manure is removed as a confounding factor.
Discussion
Our study demonstrated that IRG management has the capacity to improve the land (productivity, carbon, nitrogen, pH, and microbial life). Minerals did not show conclusive data and are not included in this report.
Productivity was measured by qualitative and quantitative data. Photopoints were the qualitative data. The images compare 6 regions in 2018 and in 2019. In all the photos we see a visual improvement in grass productivity. In specific photos other items of interest are observed, such as: decrease in invasives species (glycine, wadelia; increase in grass production; increase native forb occurrence after disturbance). Also, of note is the removal of approximately 0.2 acres or 22% of the grazing acreage during this experiment. A new greenhouse, garden, and pasture garden plots account for the reduction in pasture.
Productivity was also measured via quantitative data. Forage production was measured in pounds per acre and compared. The Sheep + Chicken zone was compared to the mowed control at 1 month and 2 months. The Sheep + Chicken zone increased by 3 and 5 times, respectively.
Productivity was also measured according to Animal Carrying Capacity. The carrying capacity (Animal Units) accounted for acreage, animal number, and supplementation. The Animal Units increased by 2.6x from original number in 2017 and by 3x that of Hawaii Standard. Taken together these data suggest that the Productivity of the land improves with IRG management.
Soil Health was also measured quantitatively. Carbon increased by 0.61% in the Sheep + Chicken + IMO. This increase is approximately 6x that of no-till farming and 3x that of covercropping. A mere 2% of carbon drawdown into the soils of currently cultivated lands will result in the return to pre-industrial levels of CO2. Also, for each 1% carbon added to the soil there is a 25,000 gallon water holding capacity. Taken together, our data demonstrates that managed grazing + moderate IMO application (4x) could result in an increased carbon sequestration on Farmlands. If these methods were integrated with covercropping and keyline tree cropping, we believe this system would improve carbon sequestration greatly as part of a whole system.
Nitrogen was both added and lots from the soil in our experiment. It appeared that areas with good grass coverage and continual nutrient cycling or microbial life encourage the assimulations rather than the loss of nitrogen (Sheep Only and IMO Only zones). Nitrogen appeared to be lost due to loss of grass coverage (Sheep + Chicken zone) and lack of nutrient cycling (Rested Pasture).
Soil acidity was measured via pH. All groups except for the Sheep + Chicken zone and the Mowed control improved pH, each approaching ideal range (6.2-7). The Sheep Only zone had the most improvement, however, this region also started with the lowest pH. Therefore, the Sheep Only region likely had the highest potential for improvement for pH because of its very low starting point.
This trend seems to be true for the IMO Only and Sheep + Chicken + IMO groups. The Rested Pasture group started as the second lowest and improvement was the lowest. This data suggests that animal manure and IMO application are important for pH balancing.
According to Elaine Ingham, healthy, living soils will naturally balance their pH via biological processes that occur in the soil food web. We suspect that this is the reason for the increasing pH balance observed in our data.
Microbial Life was also measured. Microbial life increased in the Sheep Only group and greatly increased in the Chicken Only group. We believe that the data for the chicken only group was confounded by chicken manure in the sample because it was gathered directly after the chickens were grazing in 2019. Thus, it was recorded as falsely high. The Sheep Only number was recorded ahead of the Sheep in both 2018 and 2019. Thus, the data can be accepted. Variability in the Sheep + Chicken + IMO seems to eliminate significance. This again is likely due to how the samples were collected, manure may have contaminated some samples and not others, increasing variability. For the next experiment, it will be important to carefully measure these samples so as not to confound data.
Overall we can conclude from our study that Production (Forage and Animal), Carbon & Nitrogen, and pH improved in our IRG managed system. More data need to be collected to determine definitively if microbial life improved. Elaine Ingham’s method may be a better measurement for the future.
Presentations
Live, in-person presentations via Maui Farmers Union (3/24/20) and La Kahea Community Education Farm (3/28/20) were cancelled due to Corona Virus. Presentations were given online via Facebook. As of May 27, 2020 the online presentation had reached over 2,600 people. Advertisements included fliers and Facebook posts notifying community of the presentation. Unfortunately, we never could get our website up and running. All advertisements were done via Facebook.
Example Facebook Announcement
Flyer
Presentation Announcement
[1] USDA recommended carrying capacity in Hawaii is 1 animal unit per acre.
The objectives are to determine if soil benefits are afforded via:
(1) IRG (Sheep or Chickens alone)
(2) Multispecies IRG (Sheep + Chickens)
(3) Multispecies IRG + IMO (Sheep + Chickens + IMO)
when compared to Rested Pasture and through time. Sheep health will be monitored for body
condition and parasite load to assure rotational grazing is not done at the expense of the animal.
Cooperators
Research
Our method of Intensive Rotational Grazing accounts for effects of seasonal variation on grass regrowth cycle. Grazing cycle is targeted at 45 days per rotation in the warm season (April, May, June, July, August, September, October) during rapid regrowth. Animals can re-graze after a shorter rest period because the grass recovers faster than in the cool season. In the cool season (November, December, January, February, March) rotation is slower and takes approximately 70 days per rotation. Mowing occurs in cycle with the grass and seasonality-- but is kept much shorter-- the cycle is approximately 15 days in the warm season and 30 days in the cool season.
Animals will be grazed in rotation on approximately 0.9 acres of land. Sheep will be grazed within temporary electric fence paddocks. Sheep will be given two paddocks per day at 10am and 2pm. Every three days a line will be set up behind the sheep, so that they cannot backtrack and re-graze. Rotationally grazed chickens will be moved every 3-4 days on Tuesday mornings and Saturday mornings. They will be grazing immediately behind the sheep within a 3-7 day window. Chickens will tighten their rotation for approximately 0.05 acres when sheep graze alone.
The chicken-only treatment group graze in tractors on approximately 0.1 acres of land. Rotation days will be the same as the rotation days of the other chickens (45 and 70) depending on seasonality. Grazing acres per day will also be the same.
The KNF vegetative treatment developed by Hank Young Cho. will be applied 2 weeks after each rotation to allows for regrowth of the forage and foliar uptake of treatment. Given rotation cycle described above-- approximately 7 treatments will be applied throughout the year.
Soil samples will be taken as described in Conant et al. 2002. Sample sites will be marked with a fence post (exact location) and via GPS map (PDF Maps Avenza, approximate location). Soil cores will be taken via soil corer. Samples will be taken to a depth of 6 inches. A total of 5 cores will be taken per composite sample. Each core will be divided, sieved to removed rocks and debris, then packaged as composite sample. A total of 5 composite samples per treatment group will be collected at the start of the experiment (t = 0) and at the completion of the experiment (t = 1 year).
Composite samples will be sent to MidWest Labs for analysis. The tests will include: Total Carbon, T:N, Bulk Density and Soil Health Complete assessment which measures numerous minerals (macro and micro), pH, and microbial activity in the soil.
See the initial summary for this information.
Research outcomes
Education and Outreach
Participation summary:
To date we have not organized an outreach or educational event. Outreach will be completed at the completion of our 1 year research project. Outreach was done on Facebook. Our three presentations (one for the college (presentation), one for the farmers union (presentation), and one for the La Kahea (on-farm demonstration)) were cancelled because of the Corona virus and quarantine. We did a Facebook live as a means to present given the shut down. There was very little advertising (flyers) for this because advertising was focused on the in person events that were cancelled. In the first hour of the presentation we have reached 458 people with 130 views of the video. We are hopeful that more will watch as time goes on.
We have consulted on 5 grazing projects: one on Oahu and three on Maui. These projects are still in the works. Consultation on Maui and Oahu was performed in November and is on going to integrate rotational grazing into a large scale agricultural system. The second consultation was with a private land owner for management and electric fencing set up for goats, horses, and chickens. The third was for a farmer with sheep and chickens. The fourth was farmer friend with a small scale, bio-intensive vegetable cropping system. He already had cattle and wanted to add sheep to the mix. We visited his farm and helped him set up a grazing program for the animals.
We have had 6 farmers come visit to tour our property and learn more about Intensive Rotational Grazing since we have begun the project. One farmer is from Haiku; one from Makawao; one from Kula. All have sheep and chickens; one also has pigs. Since, last year we have had three more people come up to check out the farming system. A woman with goats, a woman that wanted to set up a bee and goat sanctuary, and a man who works for a regenerative agriculture project at a special needs school.
Of the 11 farmers that we have consulted with or invited to see our farm many 5 have developed a similar grazing style that have already successfully implemented it. The other 6 are working on other projects right now and have not taken on the new system, but have improved some of their grazing rotational habits in already fenced in systems.
Education and Outreach Outcomes
We feel the project was very successful. The data was very conclusively beneficial and the items that were not beneficial were well explained. We would love to do more research to look at the microbial life in the soil (using Elaine Ingham's method). Additionally, doing this study with covercrops would be ideal. We are interested in seeing how the covercrops with the animals will affect carbon sequestration.
The benefits of nutrient cycling and ground coverage.
Improved fertility!
Decreased inputs and nutrient cycling.
Carbon Sequestration
Soil Regeneration