Final report for FW18-053
Project Information
Managing Canada Thistle for Soil Health and Greater Farm Profitability through Crimped Cover
Crop and Strip Tillage on Annual Brassicas and Cucurbits
Our biggest challenges in appropriately scaling up our operation are weed pressure and the labor
costs associated with maintaining crops such as transplanted brassicas and direct-sown cucurbits.
With traditional tillage and annual turnover of our fields in the fall and spring, we inadvertently
increase our Canada thistle (Cirsium arvense) problem on an annual basis.
It is our hope that cover cropping, roller crimping and strip tilling can solve this problem. A
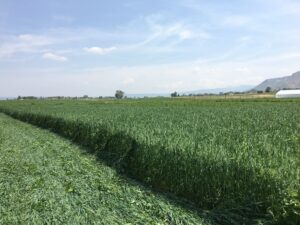
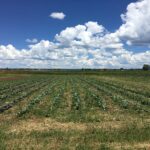
summer grown cover crop of oats terminated in the fall with a roller, left in place through the
winter to protect the soil from erosion, then strip tilled in the spring and planted for the main
season will help us expand our operation by reducing labor costs on weed management while
also growing soil organic matter and reducing our soil carbon losses. We will be collecting data
on: labor and time spent in the strip tilled field for managing Canada thistle, crop yield, water
usage, and soil health (biannual Haney and PFLA biome density tests before planting and postharvest).
We will also manage a control field of the same crops, on the same spacing in a
traditional tilled, shaped, planted and hand cultivated manner so we have a comparison to assess
improvements and differences in water usage, soil health, and labor costs between the two fields.
We will host late summer field days to tour the fields, answer questions, and gauge interest form
the farming community. Once all data is collected we plan to speak at local conferences and
workshops to present analyzed data will the goal of helping producers adopt project techniques
for greater profitability, better weed management, and increased soil health on their operations.
1. Decrease perennial weed pressure (Canada thistle) through reduced tillage, crimped cover
crops and strip tilling.
2. Protect the soil biome and retain carbon in our soil through reduced tillage, crimped cover
crops and strip tilling.
3. Decrease time spent managing Canada thistle on the crops.
4. Increase profitability through decreased labor and therefore gain the ability to increase
local market share.
Cooperators
- - Technical Advisor (Researcher)
Research
Project Update 2018
In the Spring and Summer of 2019 we will be fully implementing our project. The summer of 2018 was spent focusing on the following tasks:
-
- Prepping control field and experiment field for 2019 production
- Control Field
- Our control field was in production (potatoes in 2018). Once the crop was harvested, we were lucky to have some soil moisture to work with from some late summer rains. Field was disced and drilled to a cover crop of Triticale, Austrian winter pea, and purple hairy vetch for the 2019 season (rate of about 100lbs to the acre at a 70/20/10 Triticale, pea, vetch mix). Cover crop was establishing prior to snow cover around December 1st of 2018 and has been under snow cover since then. In the spring of 2019, our plan is to flail mow and disc in the cover crop for our control replication of the crimped / strip tilled field.
- Experiment Field
-
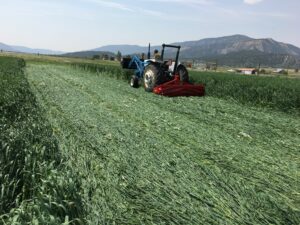
- We ordered our Roller Crimper from I and J Manufacturing in Gordonville, PA in the Spring of 2018. It is an 8ft model that is 3 pt attached and pulled by our late 90's Ford 5900. The Crimper weighs 1,510 lbs and when filled up with water, maxes out at just of 3,200 lbs. We have no down pressure on the 3 point on the tractor, which we have learned would be beneficial if timing is less than ideal for crimping (Further discussed later).
- We experienced an unprecedented drought in 2018, but we lucky enough to work with neighbors to give about 3 inches of water to our experiment field for the oat cover crop. We planted the oats in mid June, irrigated 4 times, and crimped on August 2nd. Due to the drought, we planted earlier than anticipated, and as we replicate this study over 2 years we will do our best to plant more on the later side of summer (July) and so our crimp date is closer to a early September frost. We imagine as we continue in this project and use the crimper again our skill and knowledge will increase immensely, but our take aways from our first experiment in roller crimping an oat crop are the following:
-
- Later plant date for Oats - Planting later in the summer so the oats hit flower / milk stage a few weeks prior to frost is more ideal. Oat crop will grow more robust during a later planting time as opposed to earlier in the summer, we can rely more on monsoonal rains, and our termination of the crop closer to the first frost date will discourage grow back from weeds in the field and from the oats that were not terminated 100% of the way from crimping.
-
- Crimping as close as possible to milk stage for proper killing - We crimped at the beginning of pollen / flower and some of the oat field grew back after crimping. If we would have waited until flower / pollen had drop and the oats were in milk stage we believe we would have had less grow back from the oat crop and we would not have had to run a flail over the crops to prevent it from heading out further. There is a sweet spot in the Oats anthesis that we missed by about a week and we will adjust in the future.
- We ordered our Roller Crimper from I and J Manufacturing in Gordonville, PA in the Spring of 2018. It is an 8ft model that is 3 pt attached and pulled by our late 90's Ford 5900. The Crimper weighs 1,510 lbs and when filled up with water, maxes out at just of 3,200 lbs. We have no down pressure on the 3 point on the tractor, which we have learned would be beneficial if timing is less than ideal for crimping (Further discussed later).
-
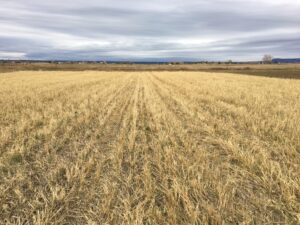
- Overall, we have a solid mat of crimped oats on the ground and covered in snow. Adjusting planting timing and crimping timing will make using the crimper more efficient, but what we have to work with in the next steps of strip tilling is perfect for our needs and the proposed deliverables of the project.
- Control Field
- Conducting Haney Soil tests and PFLA soil tests (attached in links below)
- We conducted both Haney soil tests and PFLA tests on the control field and the experiment field in the early fall of 2018. The Oat field had been crimped and the control field was about to go into cover crop for the winter. We did not notice much variation in each plot (they are on the same field and have been managed similarly for 5 years). The goal of these tests is to set a baseline that we can work off as we continue to do tests in the Spring and Fall in 2019 and 2020. One takeaway is form the PFLA test. The Experiment plot (Labeled SARE on the soil tests) has a higher total living microbial biomass than the control field. One of our theories is disturbance of the field through tillage, but we will have to wait and see how theses numbers adjust as we continue in our project. SARE-Control SARE-Experiment-Field
- Ordering, receiving and setting up Strip Tiller
-
- We ordered a Strip tiller form Yetter Maverick HR PLUS 2984 Strip Tiller. We are currently setting it up, building a tool bar for it and discussing ways to experiment with it prior to using it in the experiment and our field days.
-
- Prepping control field and experiment field for 2019 production

Project Update 2019
I will start with a narrative of the beginning of the main season and how we implemented the project. More specific data on labor, weed pressure, water usage, crop yield and health, and soil and PFLA results will be discussed at the end with further detail later.
The winter of 2018/2019 was a huge relief for both this project and our farm as a whole. We came off one of the driest years on record, barely able to produce a healthy stand of oats for the experiment field, and went into one of the wettest winters in 100 years. Our snowpack going into planting season (where the implementation of year 2 of the project truly began) was well over 300%. That alleviated our worries for irrigation water to proceed with the project.
That being said, before I get into the details of our specific implementation of the project, there are a few caveats which took this project on a course we were not expecting.
- We had VERY wet and slightly warm winter
- Our May temperatures were the 5th coldest on record
- Our June temps were well below average
- We froze at 27.5 degrees on June 23rd (one of the latest and hardest on record for our valley)
- Our last measureable precipitation event was the 2nd week of June, with nothing agriculturally significant or measureable until November.
- July, August and September were not only dry, they were above average with regards to temperature.
- We had one of the earliest hardest frosts in recent memory, getting down to 12 degrees two nights in a row October 9th and 10th.
While keep all that in mind, here is our timeline for implementation for the Summer of 2019 leading up to Harvest and data collection.
- Experimental field – implementation timeline:
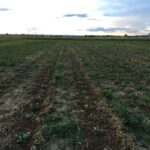
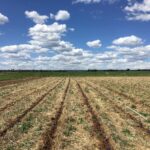
The oat mulch did a great job of staying put during the winter. As temperature started to warm up slightly in early May, we saw the beginnings of Canada Thistle starting to emerge, and it was minimal (20%) compared to that of the control field, though that would dramatically change later.
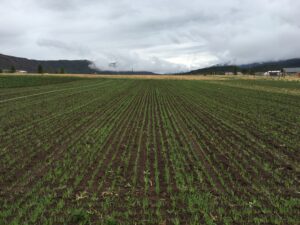
We were finally able to come into the experimental field and run the strip tiller on the 31st of May, many weeks later than we thought, but the timing was fine due to the cold wet May we were experiencing. We planted the experimental block in the following order on June 6th:
- 4 rows of Farao cabbage
- 4 rows of Ruby cabbage
- 4 rows of Storage # 4 cabbage
- 1 row of Skywalker cauliflower
- 1 row of split Gypsy and Green Magic Cauliflower
- 1 row of Green Bor Kale
- 2 rows of Delicata Squash
- 1 row of Raven Zucchini
- 1 row of Gold Rush zucchini
- 4 rows of Hubbard Winter Squash
Because we had more space, we increased some of the plantings numbers and changed a few of things with regard to the proposed project due to the quality of the starts and the general late start of the plantings. With regards to yields that are discussed later, the control block had more successions and increased plantings. *In order to get accurate data we merely divided crops out so that the compared populations of plants were equal in both the control and experimental blocks.*
Below are the observations for the first 3 months with regard to the main measureable deliverables of this project.
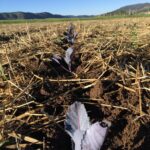
- SOIL TEMPERATURE: Plant growth was extremely stunted. We attribute this to the combination of the cool May and June and the terminated oat mulch not allowing the soil to warm up and hold heat properly. We brought out Darrin Parmenter to take a look at the trials in late June. We used a red dot digital thermometer to look at the soil temps to see if our hypothesis was true. The readings we took were pretty incredible. The experimental field was reading at 120 degrees on the surface of the oat mulch, reflecting almost all the heat away from the soil (this turned out to be a benefit with regards to pest pressure). Once we peeled back the mulch, the soil was sitting cool at mid 50s, and slightly warmer, mid 60’s, at the plant (where the mulch was removed slightly by the strip tiller). That temperature dropped down to the high 40s a about 2-3 inches down. In contrast, the soil in the control field was sitting right in the mid to high 80s and in the low 60s down more than 4+ inches. Once we got into July and August, prior to harvest, the soil temps maintained higher in the experimental block, but were still only 70%+/- of that in the control, thus plant growth was extremely stunted throughout the season.
- NUTRIENT AVAILABILTY: Due to the cold soil the the experimental block, the PFLA soil tests came back saying that the soil was dead (further discussion on this at the end of the project update). We ended up side dressing the field with an OMRI listed 4-3-2 pelleted composted chicken fertilizer in order to give the plants a jump, which worked very well. Though the experimental field never caught up to the main control block, the NPK boost pushed it over the goal line for the fall, giving us a moderate, but manageable harvest.
- IRRIGATION: The most interesting thing about the early irrigations leading into July was that the soil seemed to have trouble holding water appropriately. We irrigated the field about 25% more over the season, with most of that happening in the first 6 weeks after planting, giving the crop 1.5-2 inches a week over this time as opposed to 1 inch. Our theory is that the combination of the cool soils, slower root growth, larger spacing in-between plants (as compared to the control block) caused the plants, not the soil per say, to need more frequent irrigations as they established at a much slower rate.
- WEED PRESSURE: This was another surprise. Our assumption was that the living mulch would help with managing the weed pressure, and we were sorely wrong. We attribute this to two things, the density of the mulch and the cool, wet spring which allowed almost anything under the mulch to germinate, while the control field dried back considerably. At first we saw a huge decrease in Canada Thistle pressure, but once the field warmed up appropriately (early July) the Canada Thistle and other annual and perennial weeds (red root pigweed, lambs quarter, and plantain) all caught up and pushed thru the surface of the mulch.
- LABOR AND WEED MANAGEMENT: This was another interesting learning point of the project. Labor on this field was minimal at first, it aligned with similar planting times in the control block. Once the weeds started to take over the mulch, we realized that we had to go in by hand to manage it, as the mechanical weeder would get either bound up as the weeds were rooted very well under the mulch or because the mulch was still close to the plants, thus binding up the weeding equipment. Our first change in method and adaptation was to run hula hoes around the plant and in the mulched gaps. That did not work well, so we changed to pulling everything by hand around the plants and in the mulched gaps and using knives to cut below the soil surface without damaging the mulched cover. The problem was that the hula hoes could were hitting the mulch and sliding, there was no bare ground to make them bite and hit the root system of the plant. Additionally, the hoes were getting bound up with oat material on the edges of the crop lines. From there, we watched the weed growth increase in speed, as the soil temperature increased. We ended up weedwacking the block three times, running a lawn mower on it twice, and weeding everything by hand around the plant 3 more times. Because there was a delay in plant growth due to soil temps and the gaps on the field were larger because of growing on a single row, the plants never really took up much space or developed a canopy that would shade out the soil and diminish weed pressure.
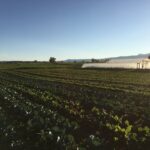
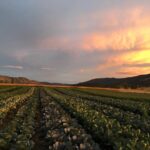
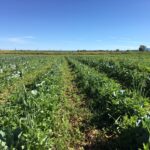
- PLANT HEALTH AND VIGOR: This was another aspect that was amazing. I’ve attached photos at the bottom of this narrative to show how drastically different the plant growth was between the control block and the experimental block. Simply stated, the experimental block stalled very hard immediately after planting. We noticed very little above ground growth, rooting was taking twice as long (about a full week to 10 days for the plants to be sturdy in the ground as opposed to 3-4 days in the control). At the 5-week mark, the experimental field plants had put on about 2 weeks of actual growth as compared to the control field. The initial cold soil temps in combination with our short season caused the plants to be half the size of normal averages, as compared with the control. One of the crops, the Delicata Squash, barely grew past one set of true leaved all season and we mowed that crop in late august, as the plants were stunted to the point of have zero production. On the other hand, regarding plant health, the brassicas were extremely healthy! Our theory is that the mulch provided enough reflective heat and light that the cabbage moths were disoriented never found the block (similar to white ground cover or plastic) and there was no aphid pressure on the kale, while out control block was ridden with aphids. Though the yield was down considerably and the stems were weaker on the kale, this was a great takeaway from the experimental block.
- JUNE 23rd FROST: We hit freezing at 2.45am on the 23rd of June, finally maxing out at 27.5 degrees just before sunrise. Due to the fact that the mulch had insulated the soil to the point where it was not warming up as well as the control, the frost damage on the experimental block was more drastic and widespread. We lost more than 50% of the winter squash and zucchini, 100% of the cauliflower was translucent (though it recovered and reset from the growth tip), and there was slight tip burn on all the other brassicas (while there was next to none in the control). We believe this significantly contributed to reduced yields, and without such low temps our yields would have been considerably higher.
CONTROL FIELD
We were able to prep the control block, along with the rest of our farm in mid-May, which is about 4-6 weeks later than normal. Our preparation of our fields has changed over the last few years, but the methodology is still similar. We flail mow the cover crop (triticale, vetch and field pea), and disc the flailed cover crop residue into the soil. I did an initial discing to break up the root system of the cover crop, and then come back 48hours later for one final pass, which incorporated close to 95% of the residue.
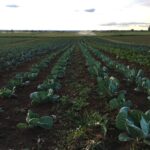
We let that disced field settle and breakdown for about two weeks, and we able to come into the field to plant the 1st of June. We did not shape beds this year, as we moved to a more mechanical weeding setup (which we wanted to use on on the experimental field, but were not able to do to the high amount of residue). Therefore, we “plant on the flat” as opposed to shaping beds, but with the tilth and depth we have generated over the past 6 years, we had 10-12+ inches of depth throughout the field.
Due to the fact that the experimental block was just that, an experiment, we increased our plantings in the control block to make up for errors or a loss of yield in the experimental block. There were also some additional brassicas planted to fill space and for our other markets. To note, we also planted a second and third succession (which we normally do) of cauliflower and broccoli and a second of Farao cabbage. The Farao was planted in response to lagging growth in the experimental block and those numbers from secondary and tertiary plantings are not including in data collection for yield calculations. The layout was as follows:
- 2 beds of 2 lines of Kale (Bor, Red Russian and Dino split equally)
- 1 bed of 2 lines of Storage #4 cabbage
- 1 bed of 2 lines of Farao Cabbage
- 1 bed of 2 lines of Ruby Cabbage
- 1 bed of 2 lines of Skywalker Cauliflower
- 1 bed of 2 lines of Gypsy and Green Magic Broccoli (split)
- 1 bed of 2 lines of Farao cabbage
- 2 beds of 1 line of Hubbard Winter Squash
- 2 beds of 2 lines of Raven and Gold Star Zucchini (split 50% each)
- 2 beds of 1 line of Delicata Squash – Lost almost entirely to frost and removed from field
Due to some of the new weeding technology we brought into the farm (finger weeders from Kult-Kress) our spacing was adjusted slightly than previously talked about in the proposal. We ended up having about one plant per 28-30 inches of space, running on 60 inch centers on the tractor for furrow marking. That is a little wider then we normally plant, but needed the space for the mechanical cultivation.
Below are our observations and main measurable deliverables for the control block, leading up to harvest
- SOIL TEMPERATURE: Soil temperature was much different to that of the experimental field as discussed earlier. With surface temps in the 80s and consistent temps in the mid 60s through the root zone of the plants, the control block grew in what can only be called an expected manner based on over a decade of planting in similar soil, time of year, density and variety.
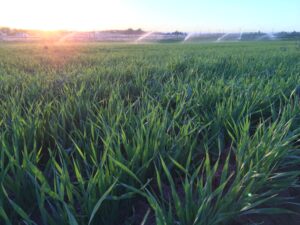
- NUTRIENT AVAILABILTY: We fertilized the control field in the spring with 800lbs to the acre of 4-3-2 pelleted composted chicken manure. This is something we started to do 4 years ago at one ton to the acre, but have decreased due to the fact that our soil NPK levels are stabilizing year to year due to cover cropping, incorporating organic matter, and crop rotation. The control field was healthy and very normal.
- IRRIGATION: our irrigation was as expected, and did not need the additional boost that the experiential block needed as the season started. We irrigate lightly at first, giving the field .5 inches of water every 3-4 days at the beginning (first 3 weeks after planting), then increasing to close to 1inch of water once a week for the remainder of the season. We gave the crop about 16 inches, give or take wind and other conditions, while the experimental field needed about 20 inches. Due to the hot, dry summer, with regular wind and no precipitation, this number was a little higher than past years (comparable with the 2018 drought), though the relation to water usage between plots would stay relatively the same year to year due to the mulch, cool soil, strip till differences between the control and experimental block.
- WEED PRESSURE, LABOR AND WEED MANAGEMENT: This was a major difference in between plots. Weed pressure was relatively normal with flushes of annuals and Canada thistle showing up in mid-June and needing to be managed 3 more times throughout the season. The weed pressure, theoretically was no different, but the initial mowing, discing and prepping of the field got an initial flush of weeds out, and the mechanical weeding, though only 90% efficient and hitting the weeds at or below the soil, set the weeds back harder than the way we were able to manage it in the control block. I was able to cultivate the control block of brassicas 3x over the course of the first 6 weeks while the plants gained their canopy. I was able to cultivate the Hubbard and zucchini block 1x before runners started setting and we had to do it by hand. A more specific break down of the time spent in the control block vs. the experimental is found below
- PLANT HEALTH AND VIGOR: Over all plant vigor was twice as good (if not more) with regards to size as compared to the experimental block. We had normal and expected pest pressures that we see year to year, though they felt exaggerated due to the cool wet Spring. We almost lost our kale to aphids, but we able to strip and remove the infected leaves down to the growth tip and follow up with a mix of fish emulsion, kelp, and neem oil. That solved our problem on the kale. The cabbage had some minimal issues with cabbage moths, and we did not spray BT because it did seem to be balancing out with parasitic wasps gaining ground after the June 23rd frost, while the experimental field had no cabbage moth damage whatsoever. Final yields will be discussed below.
- JUNE 23RD FROST: The frost mentioned above hit the control field as well, but not nearly as hard. The brassicas had minor tip burn, and we lost about 35-40% of the winter squash and zucchini, but they recovered very quickly, while the experimental field ones did not. We attribute this to soil temperatures being warmer and acting as an insulator to the cold temps that were moving onto the field that morning.
Results and comparisons for yield, labor, irrigation, and soil health
Weed Management Labor:
- Experimental field:
- Initial hand weeding – 3 people, 2 days, 8 hours days (48hrs)
- Mid-season hand weeding – 8 full days of labor at 8 hours a day (64 hours)
- Mid-season and late season mowing and weedwacking – 12 hours of labor total
- TOTAL of 124 hours or just over 15 days of labor
- Control Field
- Initial cultivation with Allis Chalmers G and finger weeders – 3 passes, 2 hours each pass including setup and equipment checks (6 hours)
- One hula hoe / hand weedings mid-season – 4 people – 4 hours (16 hours)
- Two follow up weedings mid and late season – 2 people, 2 days, 8 hours a day (32 hours)
- TOTAL of 54 hours, just shy of 7 full days of labor
Labor differences were stark between the control and experimental field. The control did have a leg up because the finger weeders were able to go thru it 3 times prior to maintaining it by hand, though, even if we were to maintain it by hand, I do not think it would add almost 70 additional hours of labor.
Water usage:
- Experimental field:
- ~20 inches of water over the course of the season, with the first waterings in the initial month to 6 weeks of planting having to be almost twice as frequent as that of the control. Once we hit early to mid-July, water usage was comparable in both fields.
- Control field:
- ~16 inches of water used throughout the season. Watering interval was close to half of the experimental block leading up to the end of the first week of July (5 weeks after planting). They then evened out with the experimental field and rest of the farm and I was able to apply around 1 inch a week on average.
As stated earlier, the cool soil stalled and slower above ground and root growth of the experimental field, therefore it needed more frequent water as it got established, thus the irrigation on the experimental field was 25% more than what was used on the control field.
Soil Health:
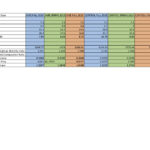
Attached are our Soil samples, Haney and PFLA, from the Spring and Fall from both the experimental and control fields. Below I will go over a few highlights and differences that we saw in the fields, with an attached spreadsheet of some of the most telling numbers.
Control SPRING AND FALL 2019 EXP SPRING AND FALL 2019
HANEY TEST:
Soil pH: There is some fluctuation in soil pH from the baseline that was created in the Fall of 2018, but it is minimal. We are curious to see what the Spring tests bring on both fields.
Organic Matter %: Like many of the data points in these results, this one was interesting. Both fields swung up in OM% in the Spring, with the control field at 4% and the experimental (SARE on the spreadsheet) hitting 3.8%. Both stabilized back to 3.6% in the fall.
Total N: We like to look at the total Nitrogen to see how much has been used by the plants or lost thru the soil due to rain events and irrigation. Interestingly, the Experimental field gained about 10% N between Spring and Fall and the Control lost about 20%. Our conclusion on this is that, we were not robbing the field of as much N because the density of the plantings was wider in the expermeintal field, and even thought the plants themselves needed regular water, the mulch and weed pressure prevented water from moving the nitrogen down thru the soil. We are curious to see what the numbers look like in the Spring and Fall of 2020.
MAC%: For the clearest explanation of this, here is a definition from WARD LABS:
“Microbially active carbon or %MAC is how much of the WEOC pool was acted upon by the microbes measured as soil respiration. If this value is below 25% this tells you that WEOC is probably not the factor limiting your soil respiration. Perhaps it is the soil’s overall fertility, prolonged cold temps or drought that is limiting microbial biomass. On the other hand, if the %MAC value is above 80% this might tell you that WEOC could become limiting to microbial respiration soon and your management focus should be on introducing more carbon into the system. Ideally, I like to see a %MAC value between 50 and 75% for most production systems. This generally tells you that the soil has a good balance of fertility and WEOC to support microbial biomass, but you are not limited by your WEOC pool. This value, however, should be taken into context and we still need to look at the respiration and WEOC individually to gain a better understanding of the overall status of your soil.”
For the Experimental Field, all the numbers from the 3 results are below 28%, and the lowest number from fall 2019, is probably due to the late timing of the soil sample, early hard frosts, and dryer soil conditions. The Control on the other hand, had values of 45.7% and 56.8% in the Fall of 2018 and Spring of 2019 respectively, with a lower number similar to that of the experimental field (18.5%) which attribute to the same timing and conditions. This helps explain the plant limited plant growth and normal / expected growth in the experimental and control blocks, respectively.
Soil Health Calculation: This is a numeric value can go up to 50, but rarely goes above 30, with 7 as a baseline starting point for most soils (wardlabs.com). The experimental field came out on top with its number last fall, primarily because of the better PFLA results it had versus the Control field that I will discuss below.
PFLA
The PFLA test is the best way to look at your soils microbial activity, fungal and bacterial communities, and health. Even with working with these numbers and talking to folks at Ward Labs, they are still hard to understand, but in general, higher numbers mean a more vibrant, healthy, and productive soil.
Instead of going line by line on the results, I will give a snapshot of what occurred. When looking at the results for the experimental field in the Spring of 2019, one can see, down the line, that due to the excessively cool soil temperature, the soils looked clinically dead (or dormant) in the results. Group diversity, composition, and ratios were all extremely low. The control field was higher, more balanced, and what I would expect for a field that was warmer in the spring.
The best take away of these results is the fact that, at the end of the year, the experimental field was much healthier and balanced than the tilled control block. This makes sense to me, we saw much more earthworm activity, tilth seems shallower (we assume the field settled slightly, but very nice with good aggregates.
Unfortunately, because of yield, which I will get into next, labor, and irrigation usage, though the experimental field is healthier, it is hard to economically justify using the crimped and strip tilled method.
Field Yields:
Simply stated, the yields for the experimental block were incredibly lower than that of the control block. As stated earlier, the combination of a record cold may and cool June, the crimped oats insulating the soil from heating up, and a late frost on June 23rd caused the experimental block to never hit the same yield as the control block. That being said, though yields were down, the soil was healthier in the long run. Below are the yield totals and averages for the crops and varieties in the project. All the number totals are averaged out slightly to take into account 2nds, crop loss, frost damage and loss in storage or post harvest handling and are adjusted to balance out proper population comparisons between both the control and experimental fields.
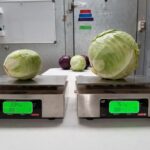
Farao Cabbage:
This was the only cabbage that had a comparable yield when comparing the control and experimental field. The second succession we did in the control field, which is not in these numbers, performed even better due to a later start in warmer soils.
- Control: ~800lbs of yield
- Experimental: ~345 lbs Yields were about 45% of that of the control. Head size was reduced, but quality was there.
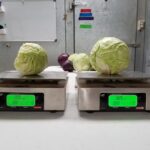
Storage #4 cabbage
The green storage #4 grew fantastic in the control field and was, on average, 1/3rd the size in the experimental block.
- Control: 890lbs of very large heads
- Experimental: 290lbs of heads averaging 1/3rd or less of that in size of the control.
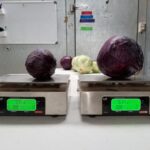
Ruby Cabbage:
Once again, we saw a dramatic difference between the control and experimental field yields.
- Control: ~625 lbs were harvested
- Experimental: ~290lbs were harvested. While almost every single head in the control made it, there were larger swaths in this block that did not even produce heads and were stalled in vegetative growth.
Skywalker Cauliflower:
This crop, due to the frost on June 23rd and the cool soil, was nearly a total failure out of the experimental field.
- Control: ~240lbs were harvest of the first succession that was part of the control block
- Experimental: ~60lbs (about 1.5 wax boxes worth) were harvested over multiple weeks. The plants struggled to produce a head, and when they did, they were significantly smaller than that of the control.
Gypsy and Green Magic Broccoli:
Very few heads were harvested on the experimental block as compared to the control, but what didn’t head out did make shoots that we were able to harvest and market.
- Control: ~170lbs, mostly heads were harvested
- Experimental: ~55 lbs, mostly made up of shoots from later in the season were harvested.
Green Bor Kale:
This was the ONLY crop that was almost identical to that of the control. If soil temps were warmer, the plants would have been bigger and more stout and the numbers would have climbed above that of the control due to the lack of aphid pressure. Number in the control were down compared to normal on the control block of green bor.
- Control: ~145lbs harvested – yields were down due to aphid pressure
- Experimental - ~125lbs harvested with weaker stems that weighed less, but health was overall better than that of the control.
Delicata Squash – CROP FAILURE DUE TO FROST
Hubbard Winter Squash
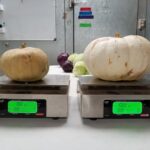
Yields were down significantly in the experimental. All the Hubbards that were harvested that made it thru the frost, were small and averaging only a few pounds, while the control had a good mix, including some that weighed 15-20lbs. Frost also reduced the populations in the experimental field dramatically.
- Control: 710lbs were harvested
- Experimental: 165lbs (about 4-5 wax boxes worth) and were all smaller in size, good for CSA and our smaller front end retail accounts.
Raven Zucchini and Gold Rush Zucchini
We combined these due to the fact that we harvest at the same time and mix both during harvest and post-harvest.
- Control: ~810lbs were harvested over a 7-week period. We had twice the population in the control than the experimental just in case we had some crop failure and this number has been adjusted to reflect that.
- Experimental: ~190lbs were harvest over a 7-week period. This block came on much later and much of the population did not even start to flower.
Project Update 2019 Season:
Though we collected some really interesting data in 2018 and 2019, we were unable to proceed further on the experiment in 2020 due to the following issues:
The Triticale we planted in the Experiment and Control block (and most of the farm for that matter) did not germinate well due to no fall rains, minimal winter moisture and a very late starter to the water year in 2020. By the time Aril and May came around, we only had about 30% germination in the triticale on most of the farm and in these experiment blocks. What was there headed out very short due to record creaking heat in April and may, leaving us with no cover crop to crimp.
We did our best to continue to irrigate and control weeds in the block thru mowing, and by summer almost all of the residue from 2018 and 2019 has broken down. Our hope was to plant back into the experiment blocs with triticale again (which we did in September), but it still has not germinated and we have no rain since one storm in July, and about 3 inches of snow has fallen and melted.
Our hope is that the trickle will germinate as spring comes, but we are predicting a very very tight water year, and if that is the case, we will not have the water to complete the experiment and do the research.
We are currently in a wait and see holding pattern with drought and water availability.
The Soil Tests and PFLA tests data is uploaded to our project.
We will be updating this page with the following data in 2019:
Labor spent in field
Weed Pressure
Water Usage
Crop Yield and Health
Continued Soil and PFLA analysis from our Late Summer 2018 baseline.
Research outcomes
Education and Outreach
Participation summary:
We had a Soil Health Field Day at our Farm on August 17th 2019. We had close to 30 participants, with a really good balance of local farmers, conservation district board members and employees, and educators. We went over the following:
- overarching goals of the project
- the strip tiller and roller crimper
- tractors and implements
- weeding equipment
- challenges and what we are learning as the experiment continues.
From this tour we have some buzz around us speaking at the Food and Farm Forum in Late January in Montrose Colorado. We also are loaning out both the strip tiller and crimper to individual farmers and CSU extension at Yellow Jacket.
We plan on doing another tour, and our goals are to have 40+ attendees with more participation from local farmers and from CSU and NRCS
********************
Project update for 2020 Season:
Due to covid and the failure of our cover crops, we were not able to do any tours not he farms his year, though we hope to do some in 2021.
We were able to present at the Western Colorado Food and Farm Forum in Montrose, CO, for a 70 minute slot, with a packed room of 50 farmers, extension agents and community members. Lots of really great questions were asked and most folks appreciated that though our experiment "failed" in 2019, we were able to present some really good insights. The best feedback we got was that multiple folks appreciated us going over the experiment and how we were able to take positive take aways from a really challenging season.
Attached is our powerpoint presentation. Food And Farm Forum Presentation 2020
We also loaned out our crimper to CSU Yellow Jacket who is using it on multiple experiments and thru that we are gaining more interest in the idea region wide. We hope once COVID tampers down to have some more field days and continue with experimenting with the Crimper and Strip Tiller even once the project is completed.
Education and Outreach Outcomes
Simply stated, we were thrown a curve ball for weather extremes this year and our project did not go as planned. We did learn a lot and will apply that to continuing the project. Most of the narrative and description of what we learned and our assessment of our project can be found in the main update, but I will leave with the following points.
- Our hope to do this next year with crimped winter rye is unlikely. We trialed a block of crimped rye, and without major changes to the down pressure of the crimper we feel like we are setting ourselves up for failure.
- We hope to replicate what we did in 2019 in 2021 with the following changes.
- Higher density planting on the oats (going from 90-100lbs to the acre to 150lbs)
- Smaller block size to minimize economic losses
- Dropping cucurbits from the equation as we feel that they really struggle with soil temps at our elevation.
- Reading soil temperatures harder to determine proper planting times (possibly delaying the planting of the experiment field if we have a similar cool wet May and June)
- Closer plantings on the experimental field (dropping from 48 inch spacing to 36 inch) in hopes of gaining more of a canopy to cover the soil
- Possibly going to drip instead of overhead on the experimental field so we do not cool off the crimped oats as much or as frequently
That all being said, we have learned A LOT from this initial trial. We think there are applications for this more suited to lower elevations, but we are determined to try again, with some big changes, because we think it can work at our elevation and in our climate.
1. Mainly the fact that these technologies, strip tilling and roller crimping, are not new, but not common in our area
2. We now have interest from those in Hemp, research and education looking to us for more data and experiences around said tools.