Final report for FW22-399
Project Information
This project aims to develop assessment protocols that guide biostimulant use practices to improve crop and soil health or remediate crops damaged by herbicide drift. Experiments were conducted on a seedling fruit orchard that was contaminated by drift in 2021, and included additional soil and compost samples from a regenerative demonstration farm.
Questions to be answered by investigation include:
- How closely do rapid and affordable, site-based assessments of leaf color patterns, microscopically detected bacterial:fungal ratios and changes in refractometer based Brix readings correlate with laboratory assessments of plant, soil, or compost nutritional status and microbial diversity?
- Can biostimulant additions (including bioactive composts) improve plant and soil function, as measured by seedling germination bioassays and substrate induced respiration (SIR), in herbicide-treated plants and soils?
- How long will herbicide contamination and detectable plant symptoms persist in plants and soils following biostimulant treatments?
Results will provide farmers, gardeners, and crop advisors with case data to inform crop monitoring practices and demonstrating use of biostimulants for improving plant and soil health in a seedling fruit orchard that is recovering from herbicide damage due to drift.
More broadly, the project will demonstrate the effectiveness of popular on-site and laboratory assessments for guiding decisions that effectively address routine or triage-based plant and soil health demands.
Findings will be disseminated in underserved rural, urban, and indigenous communities through meetings, a field day, and presentations to organizations that support grower education.
Research
- Evaluate utility of site-based and laboratory assessments of plant and soil biological health in fruit orchards for distinguishing between healthy (ie: nutritionally complete and biologically functional) and less healthy soils, leaves, and composts.
- Evaluate effectiveness of biostimulants (compost, compost teas, and fulvic acid for improving detectable plant and soil health responses.
- Evaluate plant and soil responses to various biostimulant treatments in the presence of herbicides.
Education
- Use a combination of live presentations, workshops, and blog articles to:
- describe effective visual, site-based, and laboratory monitoring techniques that support sustainable use of composts and other biostimulants or biological practices.
- illustrate mitigation strategies that can reduce losses associated with herbicide drift or other factors that damage plant and soil health.
- help growers, crop advisors, and general audiences gain appreciation for biological approaches to crop production.
- Help growers in underserved rural, urban, and indigenous communities optimize use of composts and affordable, on-site testing strategies to increase local, sustainable food production.
Cooperators
- - Technical Advisor
- - Producer
- - Producer (Educator and Researcher)
Research
Plant Leaf Analysis (Objective 1)
Leaf samples for refractometer analysis were collected from 3 varieties of apple and 3 varieties of peach in mid-morning on Sep. 12, 2022. Attempts to extract sap from fruit trees utilized a handheld garlic press, vice grips, and a constructed screw press. Sap was also extracted from clover, alfalfa grasses, and grasses in the surrounding cover crop.
Leaf and soil samples for commercial laboratory analysis and on-site microscopy were collected in July, 2023 from mixed varieties of apple trees located on a seedling orchard at J.A.L. Farms in Fort Sumner, NM. Varieties included equal numbers of Honeycrisp, Gibson Golden, Aztec Fuji, and Arkansas Black.
Leaf samples for tissue analysis consisted of new mature leaves collected from south-facing branches of apple trees that were located > 6 m away from the edge of each row. Asymptomatic and symptomatic leaves, defined below, were collected and stored in a cold ice chest , where they were insulated from direct contact with ice. Trees on the southeast portion of the orchard were visibly chlorotic, and made up the bulk of the symptomatic leaf samples described below.
Harvested leaves were divided into categories based on visual symptoms as follows:
Asymptomatic- Dark green, leathery textured leaves free of mechanical damage or other deformities (Figure 1A).
Symptomatic - Symptomatic leaves were initially divided into two categories as follows:
- Chlorotic - very light green or yellow leaves with varied patterns of chlorosis, and often retaining green veins. Some severely chlorotic leaves were nearly white with green veins (Figures 1B, 1C)..
- Mechanically damaged leaves - including leaves with insect damage and/or breaks from wind and rain, etc.
Subsamples of harvested leaves were visualized with stereomicroscopy and photographed. Since mechanical damage was not considered to be a factor that could be addressed with nutrient or biostimulant management, only the chlorotic leaves were included in the “symptomatic” samples for tissue analysis. Triplicate samples of new, mature “symptomatic” and “asymptomatic” leaves were submitted to Ward Laboratories in Kearny, Nebraska for leaf tissue nutrient analysis. Results were subjected to two-sample T-tests for unequal variance in Excel.
Pairs of old and new leaf samples of asymptomatic leaves were also sent to New Age Laboratories in South Haven, MI for sap nutrient analysis. Because the laboratory requirement that sap analysis samples come from south facing, newly mature leaves and the tree seedlings were still quite small, it was only possible to collect enough leaves for a single sample.
Soil And Compost Nutrient Testing (Objective 1)
Soil samples from 3 JAL Farms orchard locations, compost samples from four Johnson-Su style bioreactors(1). Three compost samples came from JAL Farms, and 1 compost sample came from Spirit Farm. An additional soil sample from the vegetable garden at Spirit Farm was submitted to Ward Laboratories, Inc. for routine soil nutrient testing and compost testing.
Analysis of Fungal and Bacterial Abundance in Soil and Compost (Objective 1)
Four soil samples representing the top 4 inches of soil were collected from the orchard on JAL Farms, in Fort Sumner, NM and from the vegetable garden at Spirit Farm, in Vanderwagon, NM. Each sample represented a composite of 12 cores collected from randomly distributed locations within the sample area.
Two compost samples were also collected. One sample came from Spirit Farm and one from JAL Farms. Both composts were made using Johnson Su Bioreactors (1). Compost was initiated on JAL Farms in fall of 2022 by transferring manure and straw collected from cattle pens to one of three Johnson-Su style composting bioreactors(1). An additional composting bioreactor was established on Sprit Farm, in Vanderwagon, NM. Feedstock for the Spirit Farm compost included straw and manure from cattle, sheep, goats, and poultry.
Differences in compost feedstock, production location, and compost irrigation mechanisms were expected to impact compost quality. Spirit Farm is located in Western NM, at an elevation of 7,149 feet (2,179 meters). JAL Farms is in Eastern NM, at an elevation of 4031.89 feet (1228.92 meters) above sea level. The compost at Spirit Farms, which operates on harvested rainwater, is irrigated irregularly by hand. The compost at JAL Farms was irrigated with municipal water high in carbonates on a timed sprinkler. Construction projects required on the farm during the course of the study interrupted the regular irrigation schedule for a period of 90 days, during which time the compost was hand-watered.
Each compost sample represented a composite of 12 small spades filled with compost which was removed from different areas within the bioreactor.
Soil and compost samples were each strained through a 3 mm sieve and blended to ensure uniformity. Samples were then partitioned into 6 subsamples, such that triplicate samples were sent to a commercial laboratory for conventional soil analysis and microbial analysis via phospholipid fatty acid analysis (PFLA). Identical triplicate samples from each lab analyzed at JAL Farms LLC. All samples were kept on ice, and mineral analysis samples were analyzed within one week of sampling.. PFLA samples required 6 weeks to complete the microbial analysis.
For microbial direct counts, each soil or compost sample was analyzed by diluting 0.5 g of soil or compost in 50 mL of carbon filtered tap water. The diluted sample was rocked gently for 60 seconds. Aliquots of suspension were removed from the unsettled suspension using a transfer pipette, placed in the counting chamber of a Neubauer hemocytometer (Figure 2) and examined at 400X magnification on a Motic type 102M compound microscope.
Bacteria cells present in each of the 5 diagonal squares in the center of the hemocytometer were counted. Fungal cells in each of the four corner squares (blue outline, Figure 2), and in the center square of the same size were counted. If more than 300 bacteria were present in a single 0.2 mm grid, the sample was diluted and reanalyzed. Three replicates of each sample were analyzed, providing a total of 15 bacterial, and 15 fungal values for each sample.
To convert the number of cells/ml of solution to cells per gram of dry soil or compost, soil and compost moisture content was determined gravimetrically. Fresh weights of 40 to 50 grams soil or compost were dried at 85oC to a constant weight (36 hours). Soil moisture (M) was recorded as (fresh weight – dry weight) / dry weight.
The number of cells/ml was converted to cells/gram dry soil by multiplying counted cells/mL in each square by the dilution factor of 100 to get the total number of cells in the solution. This value was then divided by the dry weight (dw) of soil, which was calculated as dw = fw/(1+M) where fw=the fresh weight of soil (1 g).
Basic Method for Site-Based Substrate Induced Respiration (SIR) (Objectives 1 and 2)
Substrate-induced respiration utilized the MicroRespTM system(2, 8) to assess soil health by evaluating the functional diversity of soil microbial communities. MicroRespTM offers tremendous flexibility to the end user, since respiration can be measured in the presence of almost any carbon source (ie: "substrate"). Typical applications select a variety of amino acids, carbohydrates, and carboxylic acids. Environmental contaminants of interest can also be evaluated (5, 9). MicroRespTM research articles were reviewed to identify substrates that have proven useful as universal respiration indicators(2, 7), substrates involved in auxin metabolism(6), or substrates useful as soil restoration indicators(3-4,7,9, 10). Substrates deemed to have the highest potential to inform soil responses relevant to herbicide remediation were selected. In cases where substrate availability or solubility made use problematic, analog substances were substituted. The compounds used are listed in Table 1 by compound class and biological function.
SIR Analysis of Orchard Soil and Compost using MicroRespTM (Objective 1)
Soil samples were collected from the JAL Farms orchard (3 samples), or from the vegetable garden at Sprit Farm, sieved, and homogenized as described above. One 60 g aliquot of the homogenized sample was subjected to gravimetric moisture analysis to determine water content. The remaining sample was subjected to SIR analysis using a modified MicroRespTM protocol and the substrates described above (Table 1). Microbial activity across the 12 substrates substrates was calculated based on normalized absorbance at 570 nm as described in the MicroRespTM Technical Manual(12). However, flat bottom detection plates recommended for MicrorespTM could not be obtained at the time of analysis due to supply chain failures. In order to conduct the analysis within the project timeline, it was necessary to use round bottom detection plates. Since corresponding round-bottom strip well plates could not be found for the CO2 Calibration assays, estimates of CO2 emission rates were not possible. However, a calibration curve developed using flat bottom strip well plates confirmed the anticipated inverse relationship between absorbance readings at 570 nm and CO2 emission, so we are confident in assuming that lower absorbance at 570 nm corresponds to higher CO2 emission rates.
All other experimental parameters were according to the protocol(10), and pre-incubation was used to control for non-microbial CO2 emission, so it can be assumed that CO2 emission corresponds to soil microbial metabolic rates. Table 2a shows the deepwell plate layout of soil samples for assessment of microbial diversity. In short, three rows on a single deepwell plate provided three replicates of each soil or compost sample with each of the twelve substrates.
SIR data analysis for native soil and compost SIR samples (Objective 1)
SIR data from soil and compost samples was analyzed according to the MicrorespTM protocol(10). In short, absorbance at 570 nm was normalized. Ai (normalized absorbance) values, which were inversely related to respiration rates were examined using R Studio v 2024.04.2 Build 764 to compare differences by substrate across soil and compost samples. Simpson’s reciprocal index of evenness (E) was calculated from Ai profiles as E=1/∑pi2. As discussed in depth by Oren and Steinberger(11) when assessing catabolic diversity with MicroRespTM, species richness cannot be measured effectively, the number of substrates assessed for each sample does not change. Therefore, we relied strictly on evenness (E) as a diversity indicator.
Seed Germination Bioassays Herbicide Remediation (Objective 2)
The effect of biostimulant and nutrient combinations on seed germination in the presence and absence of herbicides was determined using cosmos (Cosmos bipinnatus) seeds. Cosmos grow rapidly, and the cosmos growing in a garden on JAL farms in 2021 exhibited more sensitivity to class 4 herbicides following the drift incident than any other species observed on the farm, so they offered a useful model system.
Seed germination bioassays were carried out on water agar plates. Aqueous solutions containing 8 g/L molten agar were poured into 55 mm round petri dishes and solidified overnight. Herbicide positive treatments included SpeedZone® herbicide applied at 0.1X of the manufacturer’s recommended dose. Nutrients and/or biostimulants were then applied to the plates using 1X, 2X, or 5X the recommended application rates of two commercially available biostimulants. The biostimulants included Texas Earth BIO NECTAR Dry (BND) applied at a 1X rate of 24 uL reconstituted BND per petri dish, and Persist Micronized Biochar (MBC) applied at a 1X rate of 11 mg per petri dish. The nutrient treatment consisted of Miracle-Grow® All Purpose Plant Food (MG) applied at a 1X rate of 29 uL of a 10 mg/mL stock solution per petri-dish. Four additional treatments consisted of blends between the two biostimulants, which have complementary functions, and blends between one or both biostimulants and nutrients. BND, which was reconstituted 12 hours prior to application, is a complex mixture of humates, sugars, and microorganisms, with biodiversity comparable to that of a compost tea. We hypothesized the high biodiversity in BND improved the odds that at least some of the microbes within the mixture would catalyze herbicide degradation or perform other actions to protect the plants. MBC is a finely ground, high quality biochar. We anticipated that the biochar would absorb residual herbicide while providing aeration and pore space for microbes that can catalyze degradation. MG represents a highly soluble, relatively complete blend of plant nutrients, including N, P, K, B, Cu, Fe, Mn, Mo, and Zn. Since nutrient-limiting conditions prevent both growth and remediation, we used MG to reduce the risk of nutrient limitations.
Five cosmos seeds were placed on each agar plate, and three replicate plates were prepared for each treatment. Plates were sealed with parafilm and incubated at 24oC (75oF) for 6 days. If roots or shoots were visible at 6 days, the seeds were counted as germinated.
Data analysis was conducted in R (R Core Team, 2025), with assistance from ChatGPT (OpenAI, 2025) for code development. To assess the herbicide impact on seed germination across treatments and application levels, we calculated a herbicide effect value for each Treatment × Level × Replication combination as the difference in germination percentage between herbicide-treated and untreated (and untreated samples. Each treatment was replicated three times. For each treatment and level, we compared the herbicide effect against the corresponding effect observed in the control treatment at the same level and replicate. Paired t-tests were used to determine whether the herbicide effect differed significantly from that of the control. This approach isolates the herbicide’s interaction with each treatment while controlling for natural variation across replicates and levels.
SIR Analysis of Herbicide Remediation (Objective 2)
The herbicide chosen for analysis was a commercial blend called Speed Zone Lawn Weed Killer Concentrate (H). This mix, which was marketed to home gardeners, contained 2, 4-D2-ethyhexyl ester (28.57%), mecoprop-p acid (5.88%), dicamba acid (1.71%), and carfentrazone-ethyl (0.62%) along with undisclosed inert ingredients. Because the blend contained a mixture of active ingredients that included two class 4 herbicides, and because it could be purchased in smaller quantities than the commercial blends commonly used for aerial spraying, it provided a useful proof-of-concept treatment. To assess remediation, a bulk sample of soil was collected from JAL Farms orchard in April of 2024 by collecting 20 cores from each row of trees, mixing thoroughly, and sieving soil as described above. Subsamples of the bulk mix were untreated, or combined with a fresh batch of bioreactor compost, provided by David Johnson, at a rate equivalent to 2 lbs per acre. The bioreactor compost served as the biostimulant for this experiment. Gravimetric analysis was used to determine soil moisture content, and soil was partitioned into deep-well plates containing the substrates shown in Table 2b. Plates were then subjected to MicroRespTM analysis as described above.
Statistical Analysis of Herbicide SIR Data (Objective 2).
Dean Barron, of the statistics consulting company, twobluecats.com, performed the statistical analyses for the Herbicide SIR Data. To analyze data and evaluate if compost improves soil function, the data was first examined and outliers removed. Two regression analyses were performed, with CO2 and Simpson evenness as dependent variables, respectively. Both regression analyses forced entry of herbicide level and treatment, followed by stepwise hierarchical regression of treatment combinations and reps, followed by substrates. Compost biostimulant presence, herbicide level, substrate, and repetition were used as independent variables. The statistically significant variables were identified, and a final regression model was determined. Descriptive statistics and comparisons of means were also performed.
Herbicide Residue Testing (Objective 3)
Historical Background
Orchard tree seedlings on JAL Farms were damaged by herbicide drift in 2021. Within two weeks of the incident, trees were treated with a mixture containing 1 quart per acre Symbiosis AgX (AgX), and 1 ounce/acre micronized humate applied as a foliar spray. AgX is a commercial biostimulant reported to contain cytokinins. Previous unpublished trials by Mary Lucero had indicated that micronized humates work in conjunction with AgX to help plants overcome general stress. It was hoped that this biostimulant combination would counter the effects of the synthetic auxins contained in the herbicide mixtures. AgX-plus-humic acid applications were repeated every two weeks through October of 2021, at which time standard nutrient and biostimulant practices were resumed. Namely, trees were allowed to enter winter dormancy. The following spring, nutrients were applied only to address deficiencies as indicated by lab tests or visual inspection. AgX and micronized humate were utilized in spring and early summer of 2022, after which locally produced mixtures of micronized humate, solubilized kelp extract, and molasses were used as foliar biostimulants in conjunction with any nutrients which appeared deficient in laboratory tests.
Residue Testing
In June of 2023, orchard leaf and soil samples were gathered and submitted to South Dakota Agricultural Laboratories in Brookings, South Dakota for herbicide residue analysis. Screening included the “PGR” panel, which tested for the presence of 17 class-4 herbicides, including the picloram, triclopyr, clopyralid, and 2, 4-D that were detected on JAL Farms trees following the drift incident in 2021.
Leaf Sap Analysis by Refractometry (Objective 1)
Refractometry used to determine Brix units of leaf sap is widely promoted by market gardeners and small farms as a cost effective method for estimating nutritional performance of plants. This is because Brix units, which specifically measure dissolved solids in a solution such as sap, increase when plant nutrients are optimized. Other factors, such as temperature, sunlight, and soil moisture can also influence Brix levels, so accurate interpretation requires defining the conditions under which measurements will be taken. We hypothesized that Brix monitoring of apple leaves under controlled conditions could provide a tool for guiding nutrient applications. We were surprised to find that sap extraction for refractometry proved problematic. There was simply not enough extractable sap in apple leaf samples to conduct refractometry. We attempted extractions with a garlic press, vice grips, and a homemade screw press that was capable of squeezing approximately 100 mL of chopped apple leaf tissue. The screw press did force moist leaf tissue through the sieve, but failed to produce free droplets of sap necessary for refractometry analysis. Since all three tools readily extracted sap from grasses and legumes present in the orchard understory, and from vegetable plants in the garden, we speculate that the thicker, more ligneous nature of apple leaves restricted sap extraction. Leaf carbohydrates may have also been absorbing the sap as it quickly as it was extracted from the vascular tissue. We conclude that leaf Brix analysis is ineffective for even crude estimates of sap quality using the extraction methods we tested.
Visual Leaf Analysis. (Objective 1)
Figure 1 provides examples of symptoms observed on apple trees at JAL Farms in June of 2023. Asymptomatic leaves made up 79.60% of newly mature sampled leaves (Figure 1A). Chlorotic leaves made up 1.20% (Figure 1B) of the sampled leaf population. Mechanically damaged leaves (not shown) made up 19.19 %. Mechanical damage was largely attributed to a spring hail storm. The mechanically damaged leaves were not included in the symptomatic tissues sent for laboratory analysis. Figure 1 compares leaves classified as asymptomatic leaves (1A, 1E) to leaves exhibiting varied patterns of chlorosis (1B, 1C, 1D). Note that 1A and 1E represent the same leaf at different levels of magnification, as do figures 1C and 1D. These image pairs and the video in Figure 1F highlight the value of microscopy for revealing leaf conditions that may not be detected with routine visual inspection. While these magnified images may at times be useful for diagnosing persistent conditions, leaf microscopy is labor intensive, making it impractical for routine farm monitoring. In the seasons since this data was collected, we have observed occasional codling moths in delta traps in the southwest corner of the orchard. Since the soil in this area is heavier than other parts of the orchard, these same trees are the first to show micronutrient deficiencies during the growing season. Based on the nutrient deficiencies we have identified and corrected in 2023 and 2024, new research is underway to evaluate the hypothesis that codling moths are associated with silica, iron, boron, and zinc deficiencies.
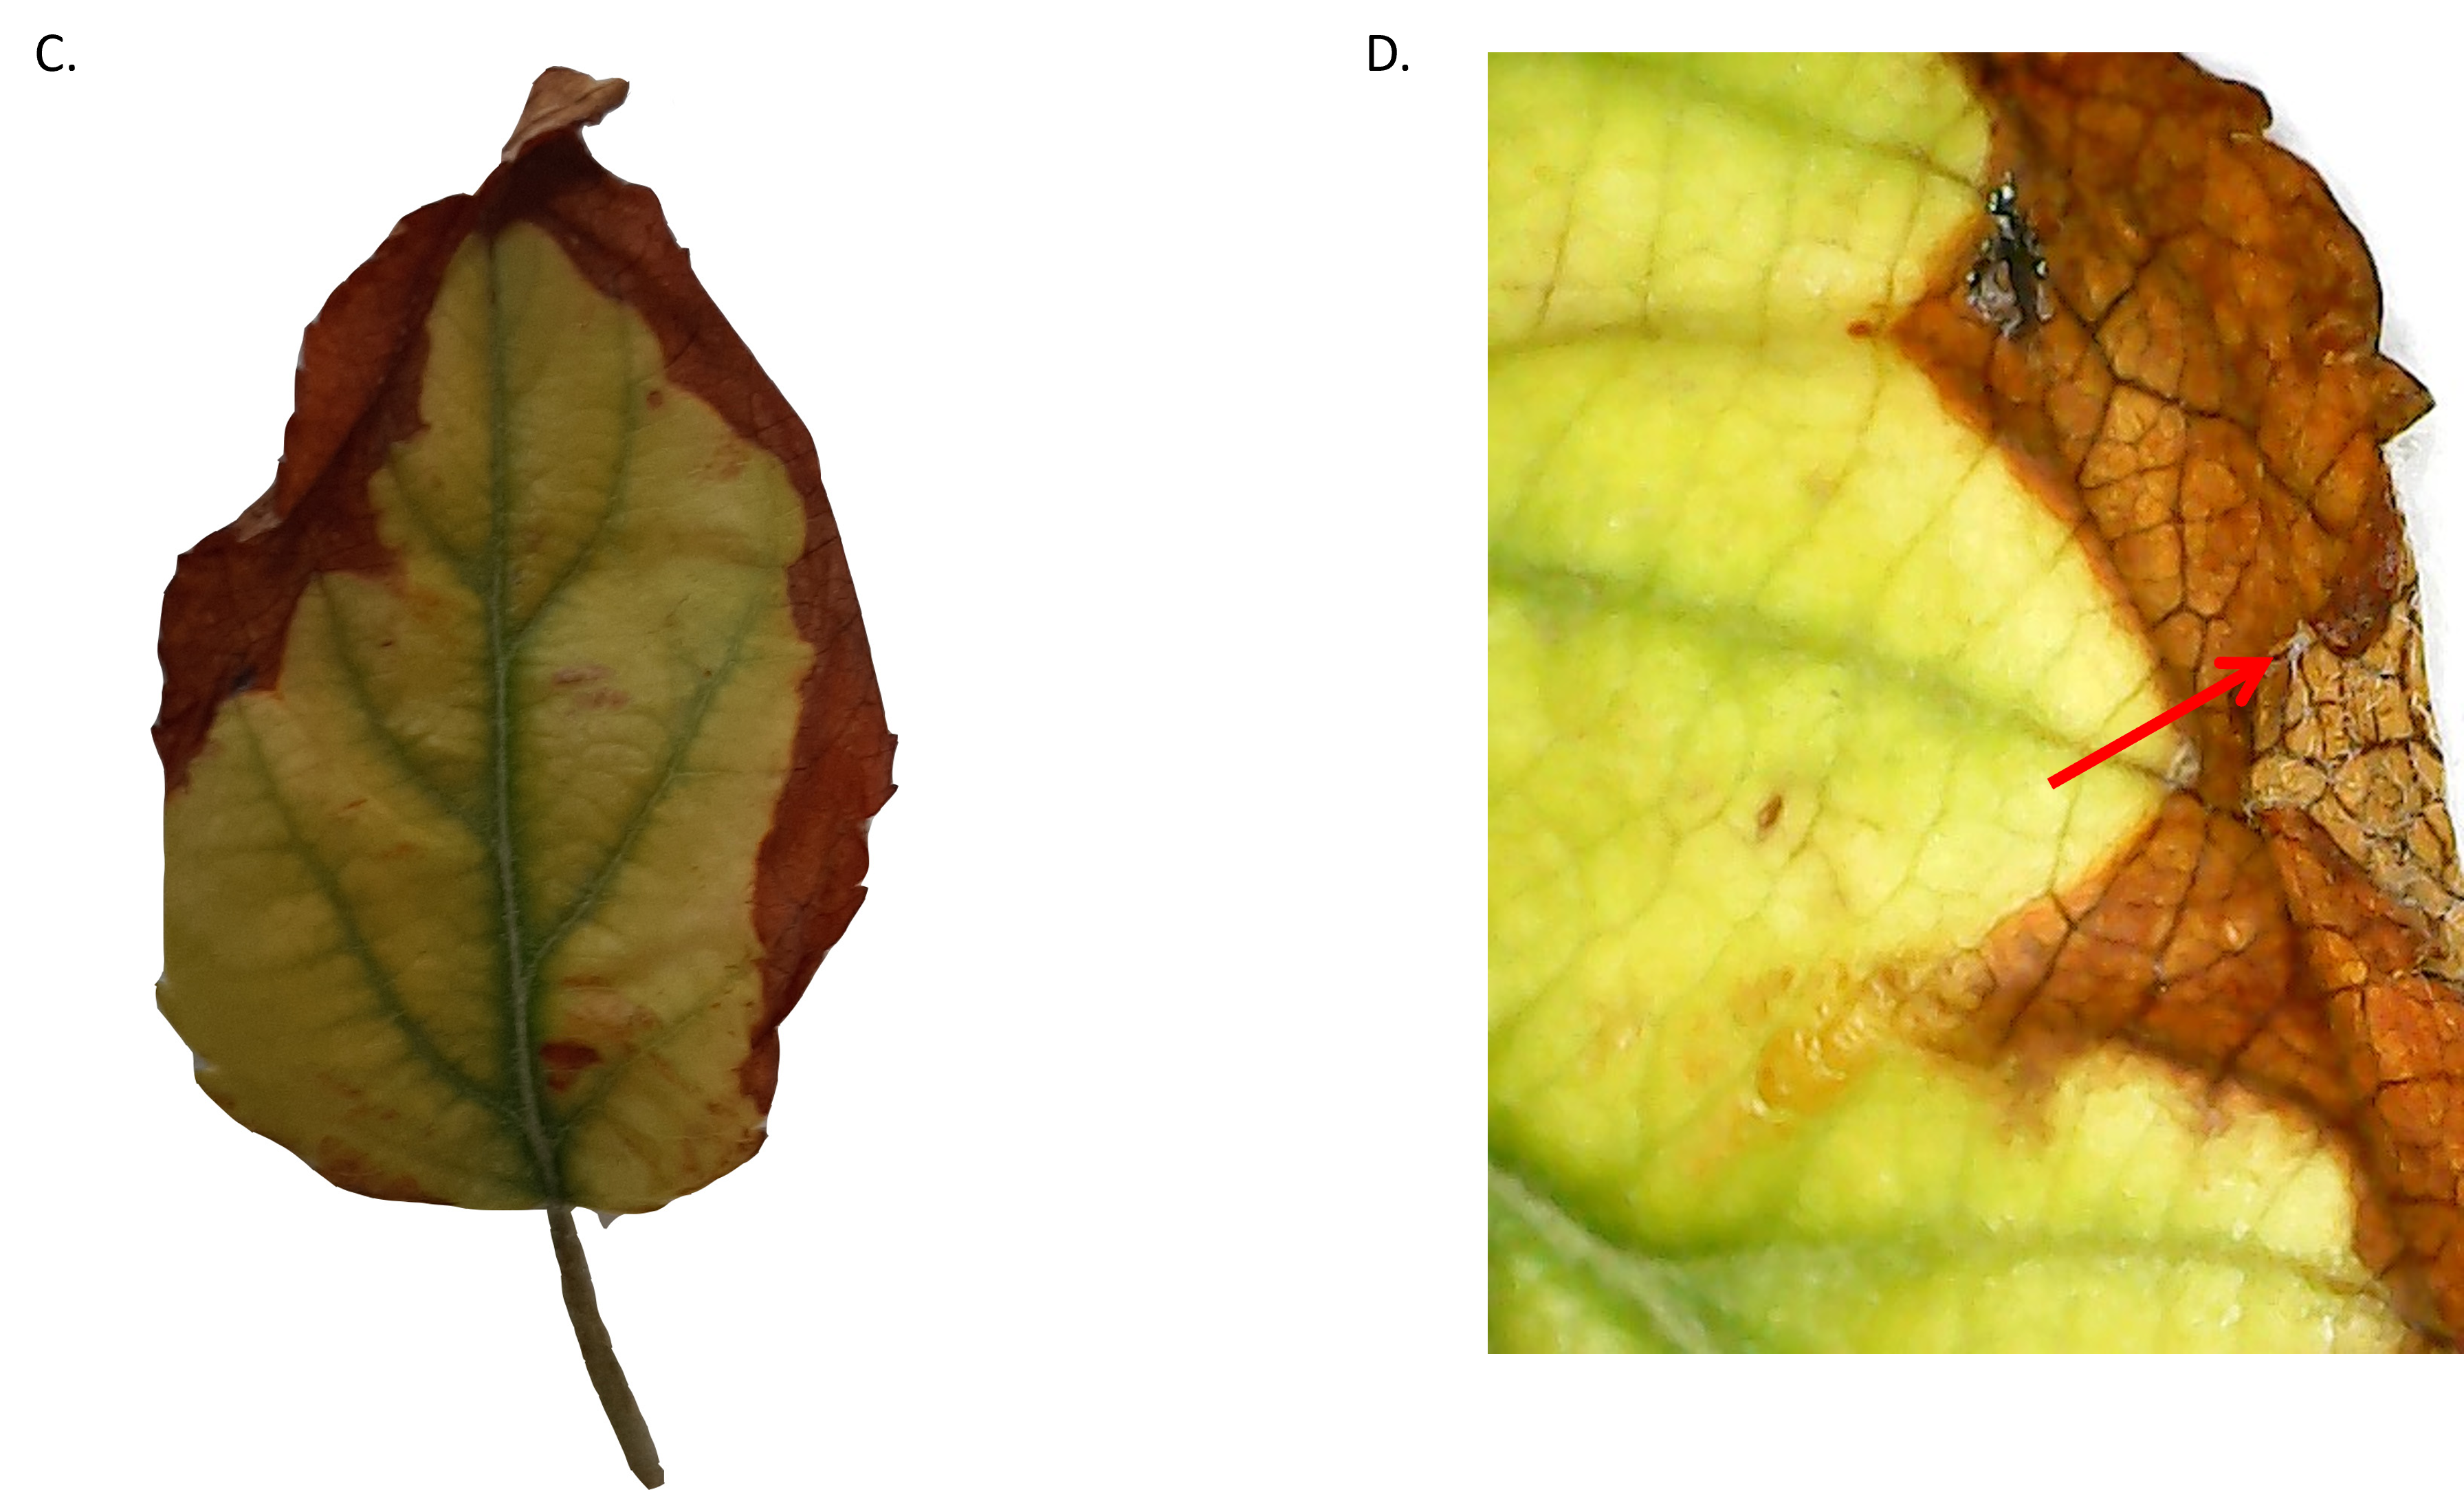
Figure 1 F. (video) Thrip-like arthropod detectable at 50X magnification feeding on the midvein of the leaf shown above in Figure 1B.
Laboratory leaf tissue and sap analysis (Objective 1)
Differences in means between symptomatic and asymptomatic plants as determined by t-tests were significant for sulfur and boron. Remarkably, neither tissue testing nor sap testing revealed deficiencies in either sulfur or boron. The only nutrient deficiency identified by Ward Laboratories, Inc. was in calcium, which appeared low in both symptomatic and asymptomatic samples. Deficiencies in sulfur, but not in calcium are commonly associated with the interveinal chlorosis that was observed visually.
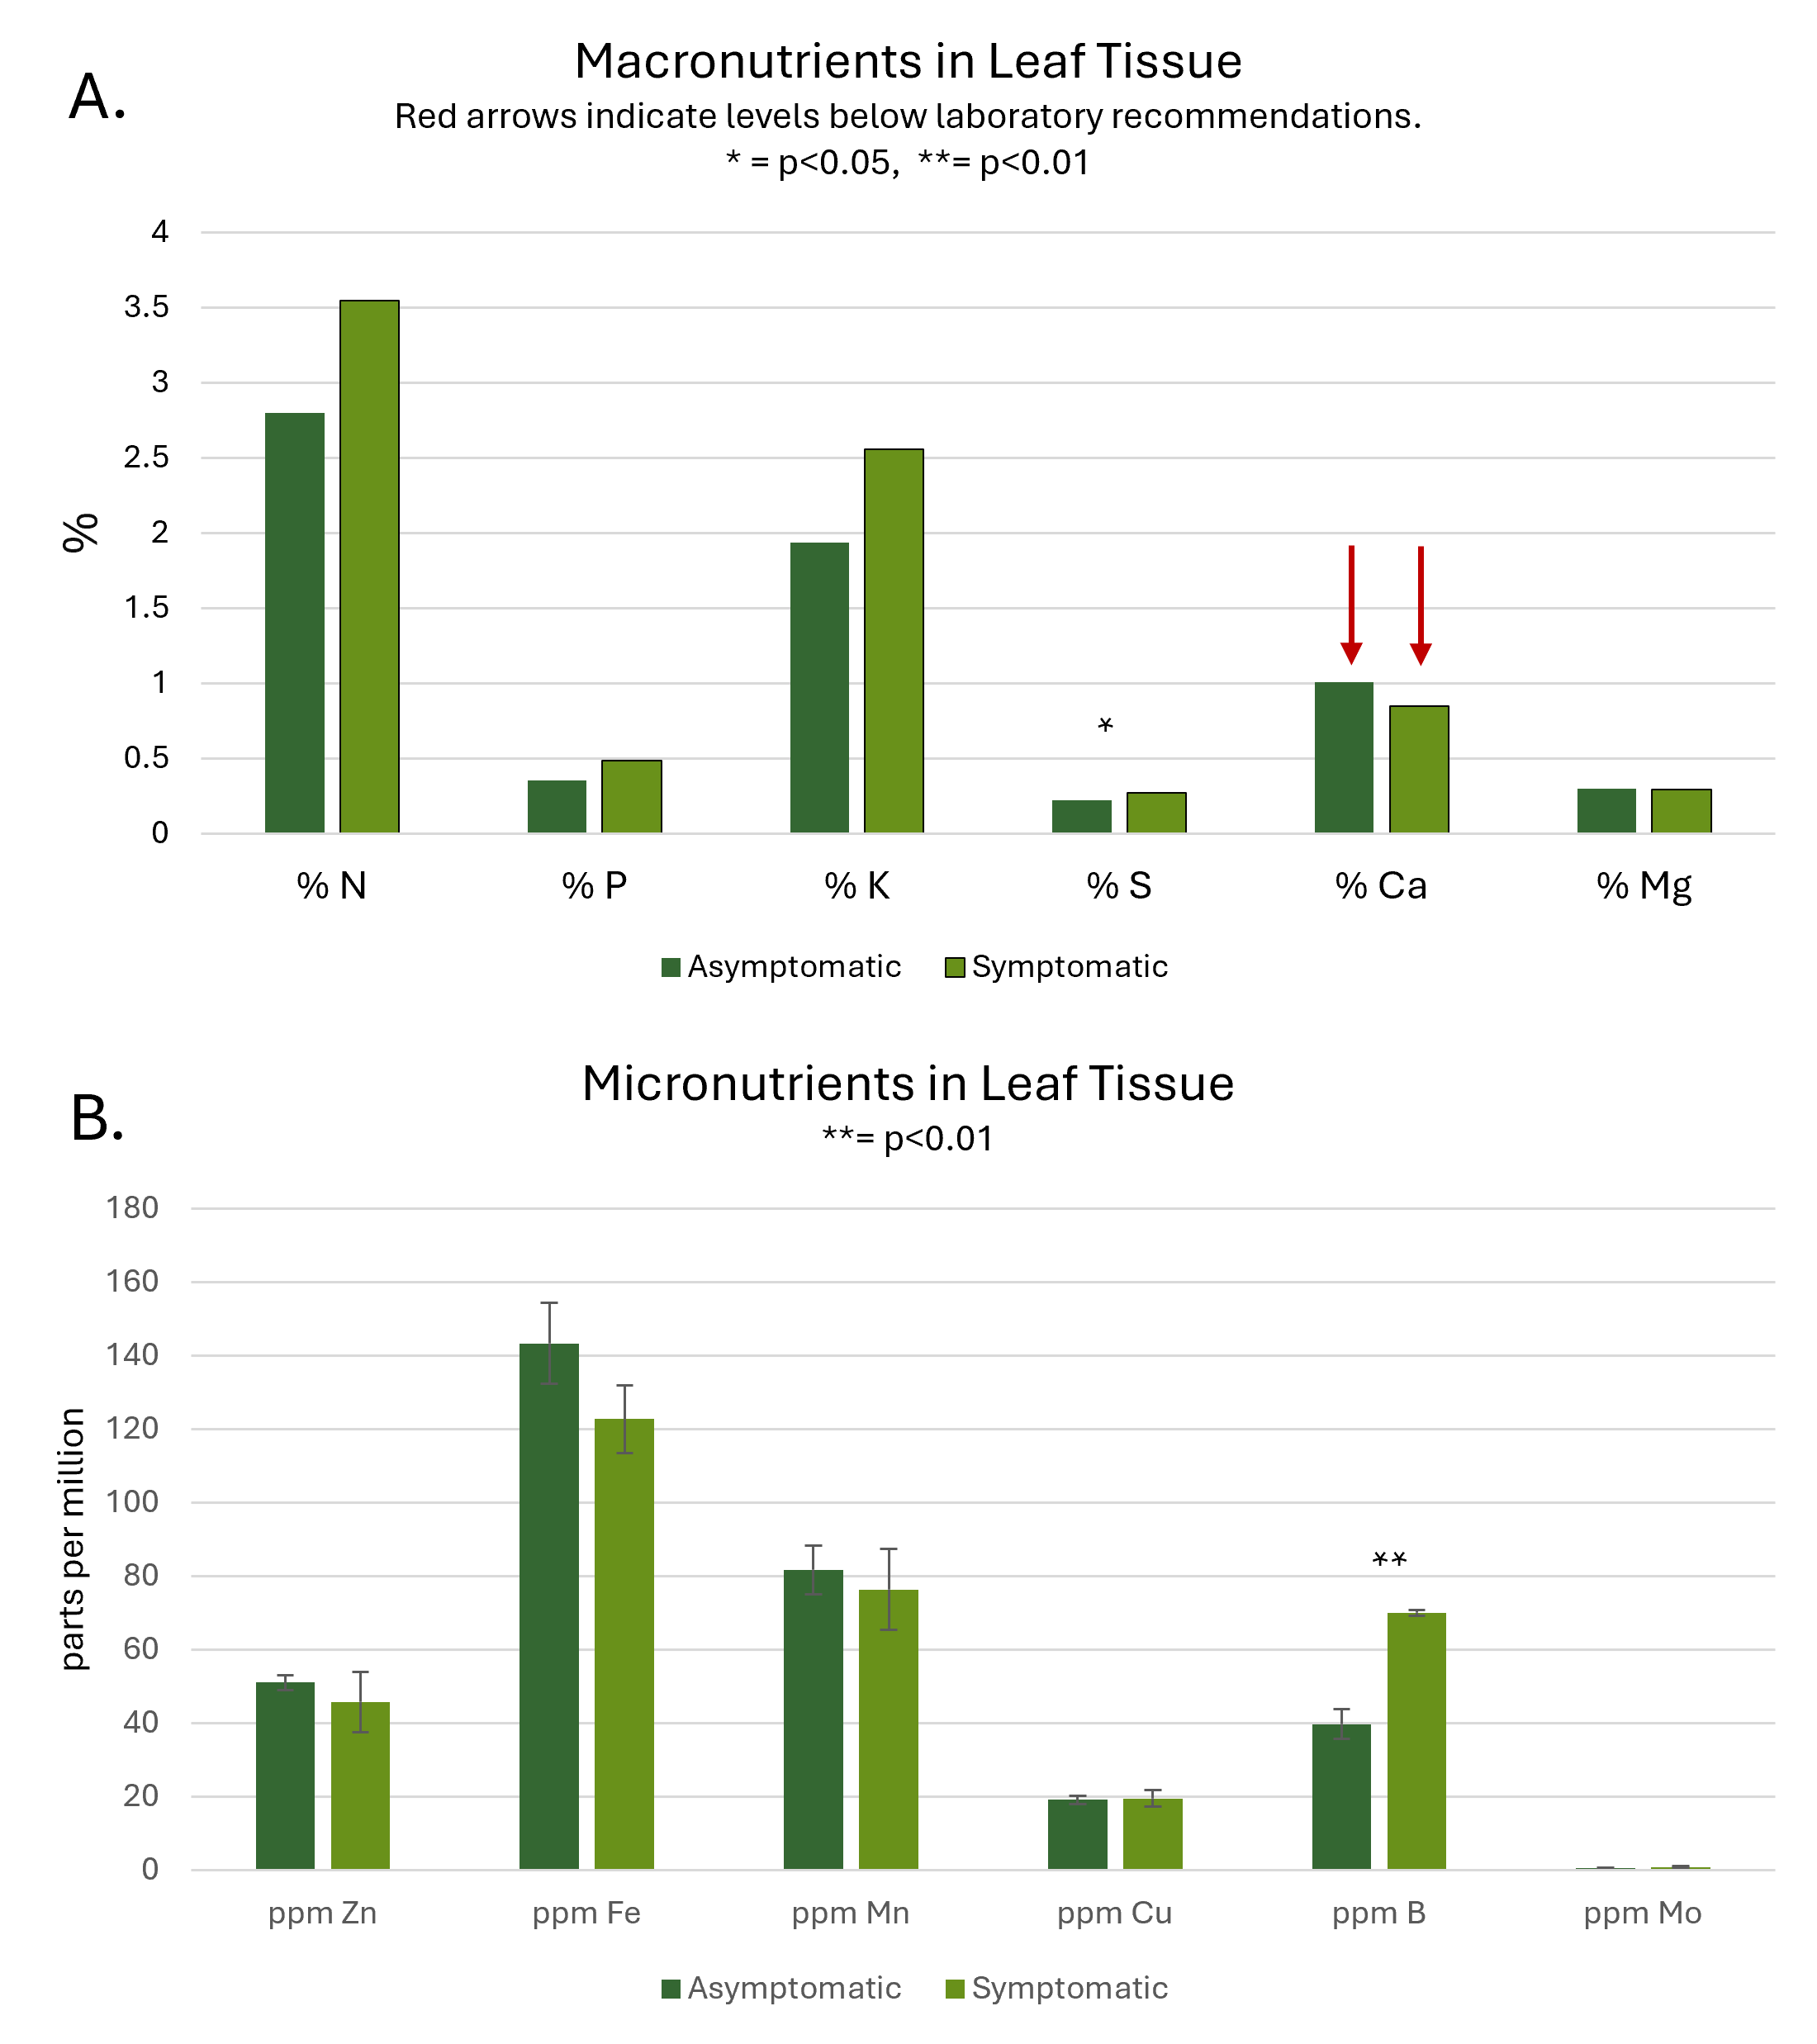
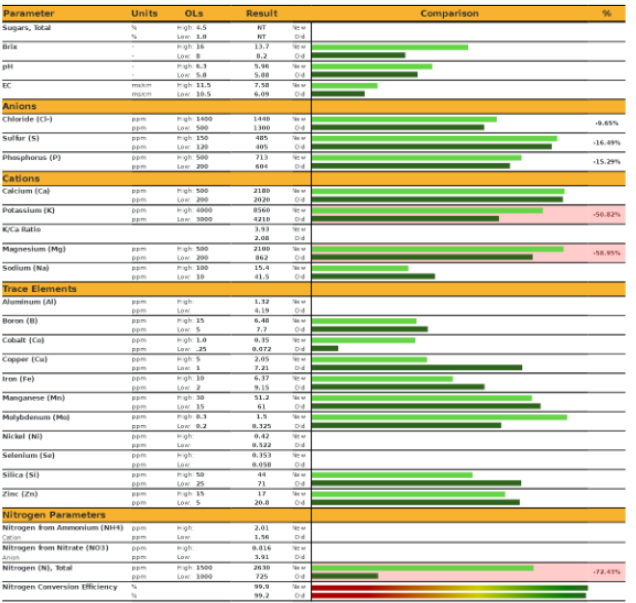
Leaf sap analysis revealed that levels of potassium, magnesium, and total nitrogen were 51%, 58%, and 72% below recommended levels (Figure 3). It should be noted that the application of foliar fertilizer containing potassium, magnesium, and nitrogen following sample collection did eliminate the observed chlorosis.
In comparing results of on-site analyses to laboratory analyses, we conclude that while Brix testing was not feasible, visual monitoring was invaluable for identifying nutrient deficiencies that were reversible with foliar nutrient applications. The results obtained with sap analysis appeared more useful than tissue analysis for guiding nutrient applications, although the sample size and study design did not permit strong inference from these results. Sap analysis remains attractive because it measures those nutrients that are mobilized in the plant. However, the labor required for sap sampling and analysis as described here was significant. Since long-term management goals are to address nutrient deficiencies before chlorosis occurs, subsequent research is underway utilizing a chlorophyll meter for weekly monitoring of orchard trees, in combination with early and mid-season sap analysis at a different lab, using a more simplified sampling protocol. Preliminary observations are that visually chlorotic leaves may be eliminated by applying foliar nutrients when chlorophyll levels fall below 400 μmol/m².
Soil and Compost Nutrient Analysis (Objective 1)
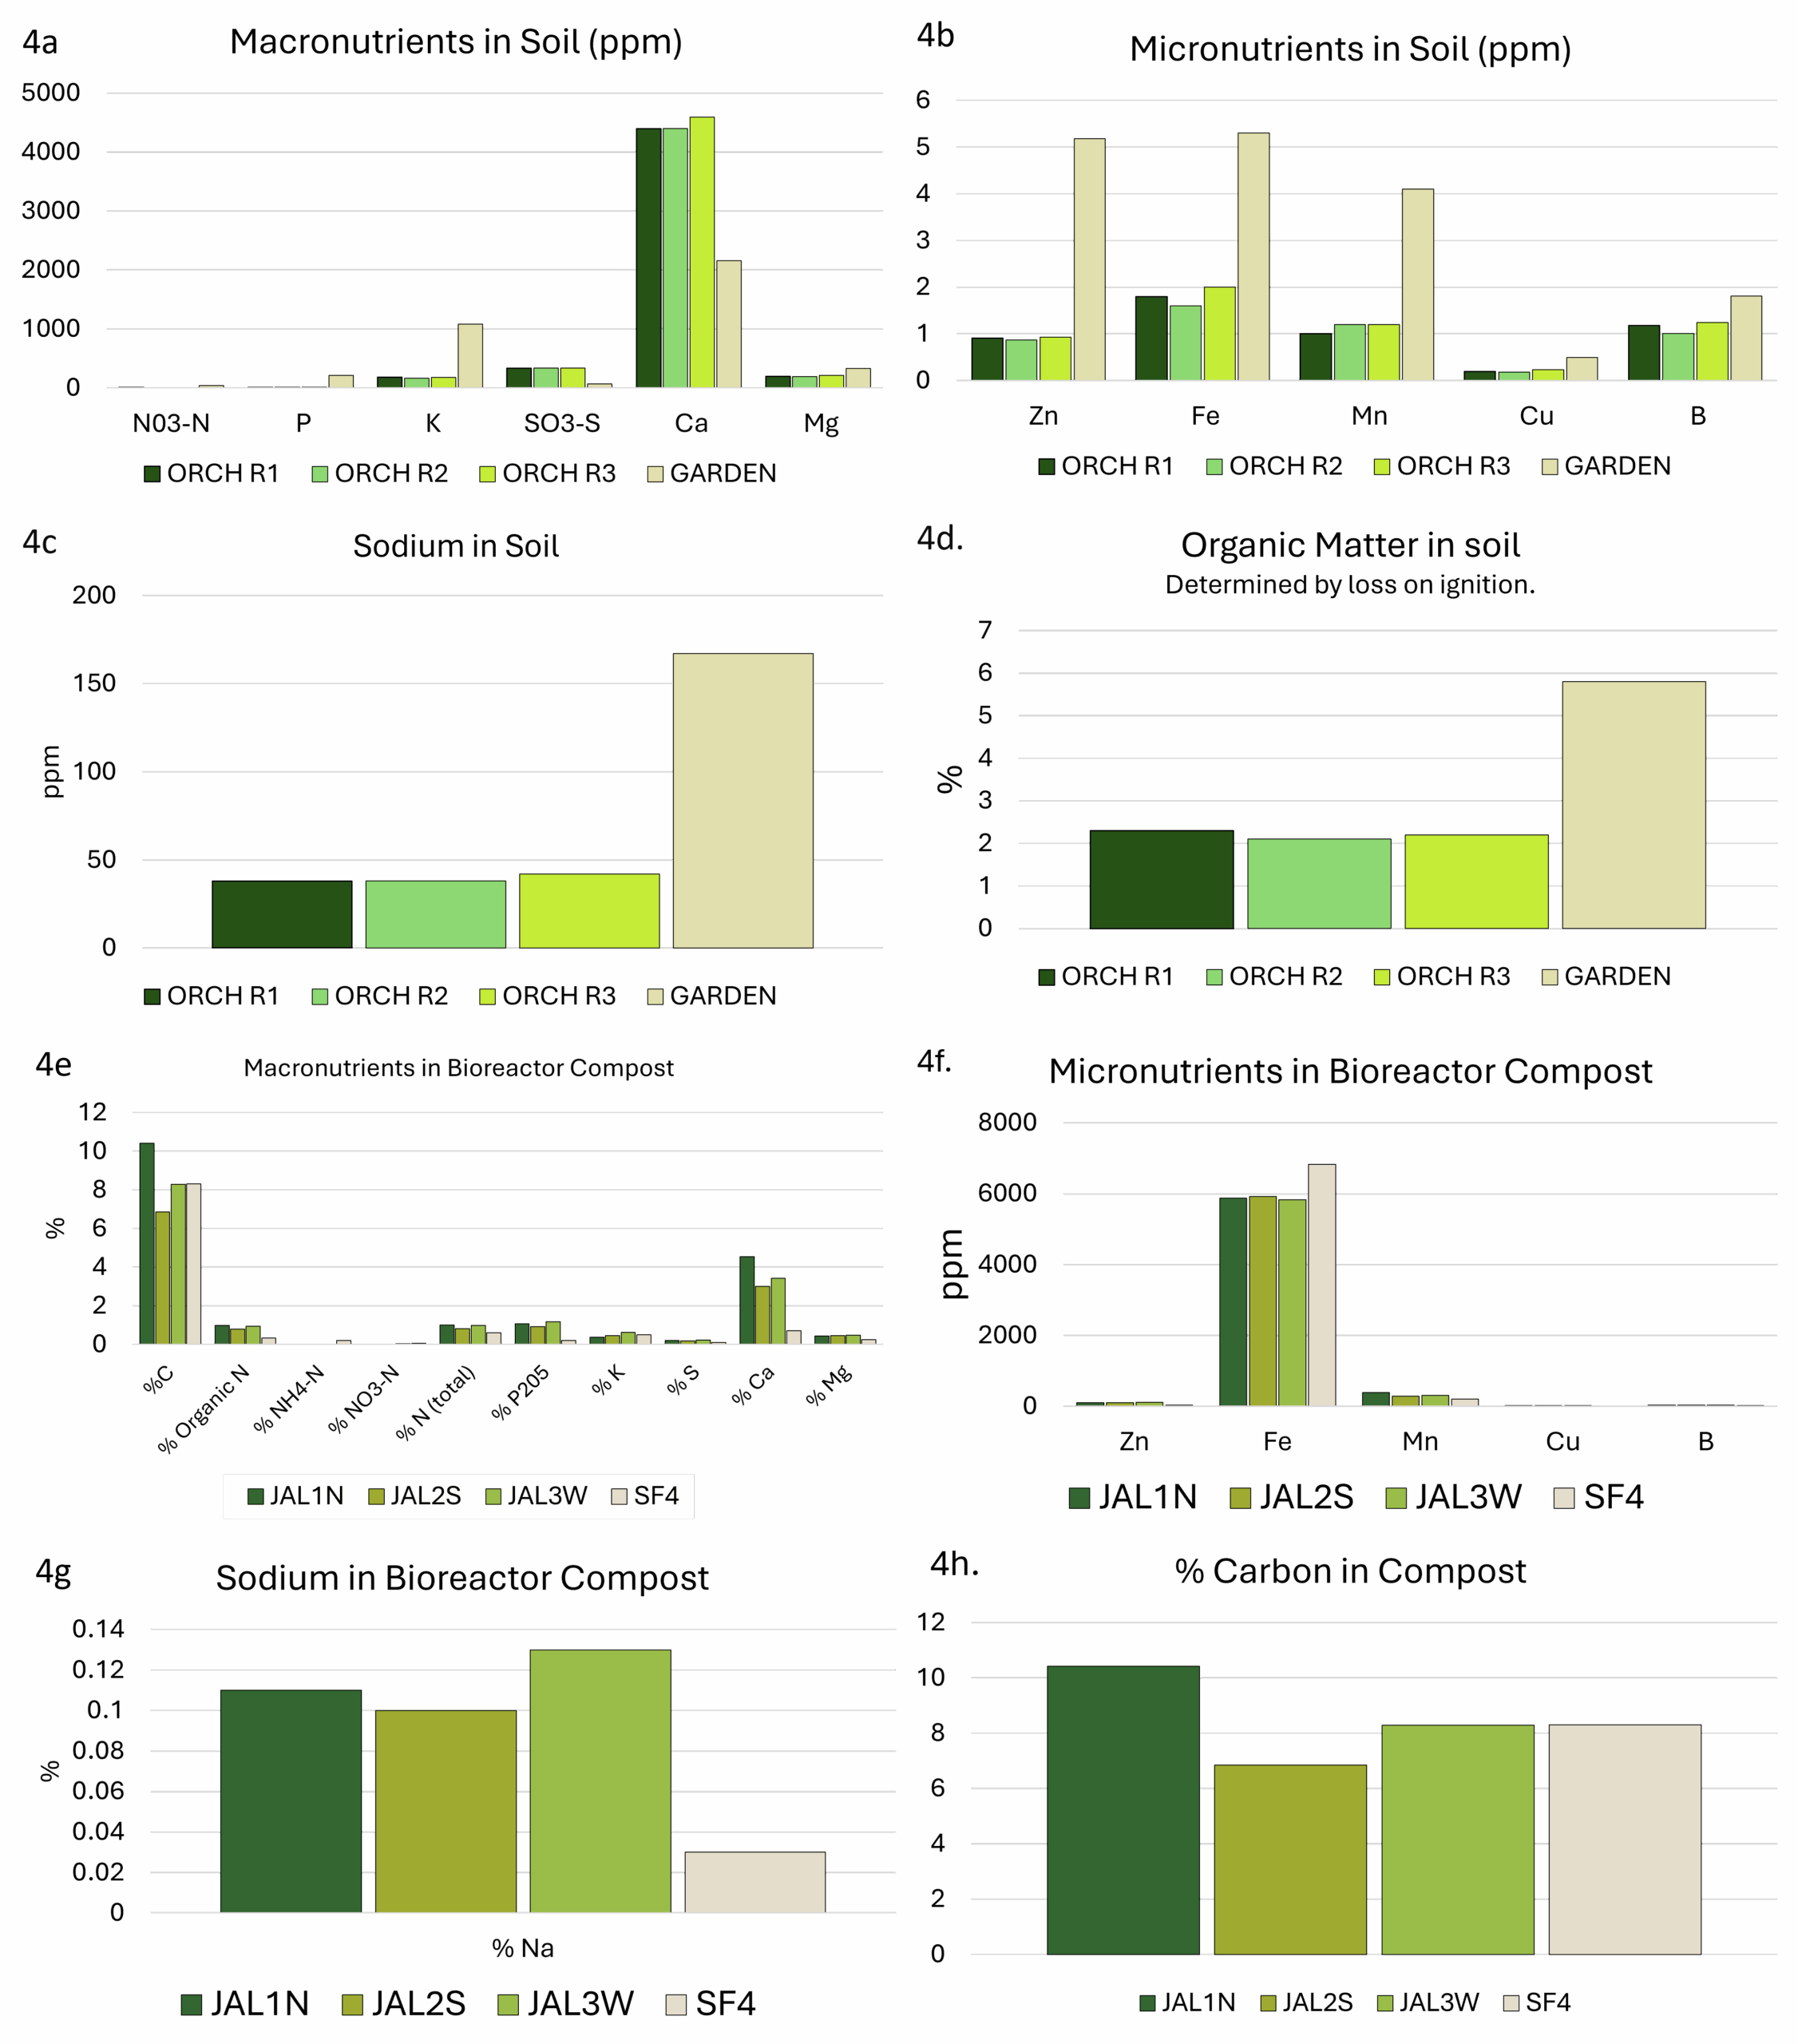
Soil and compost nutrient profiles (Figure 4) revealed low levels of the primary macronutrients (N, P, and K, 4a), and high levels of calcium in all three soil samples from the orchard at JAL Farms. Soils from Spirit Farm showed higher levels of nutrients (4a, 4b), with the exception of calcium and sulfur. While both farms reside in arid lands with alkaline soil, JAL Farms lies in a flood-irrigated river valley, where it was managed as a horse property, with little attention to soil health until late in 2020. Spirit Farm is situated on thinner, arguably more fragile soils at a higher elevation, with less access to irrigation water. However, Spirit Farm was actively managed with routine additions of composted straw and manure for the 4 years preceding this study. Although base soil and parent material certainly influences soil nutrition, management history likely explained much of the difference in levels of available nutrients (Figures 4a and 4b) and organic matter (Figure 4d) present in the garden soil sample. Soils from both sites were high in sodium (4c), with levels ranging from 38-42 ppm in the three orchard samples to 167 ppm in the sample from Spirit farm. Organic matter levels also varied dramatically between the two farms, with orchard samples hovering around 2.2%, and the garden sample at 5.8% (4d).
Although both farms aimed to model bioreactor methods taught by Johnson and Su-Johnson1, Spirit Farm was restricted to manual watering throughout the production period. The reactors at JAL farms were established with automated irrigation, but this was interrupted for 3 months during the summer, and hot, dry conditions likely influenced the compost development. Compost macronutrients are presented in 4e, and micronutrients are illustrated in 4f. All composts were remarkably high in iron. Sodium levels (4g) were higher in the JAL Farms composts. This likely reflects the irrigation source, which is high in sodium. Irrigation at Spirit Farms utilized collected rainwater.
Bacterial and fungal populations in soil and compost. (Objective 1)
A reliability analyses of our direct counts method revealed 98% reliability for the log transformed averages of the bacterial counts on a given sample, and 92% reliable for log-transformed averages of the fungal counts for a given sample (not shown). This indicated high reproducibility of the method from sample to sample. However, it should be noted that accuracy of microbial identification was not assessed. It can be assumed that the distinction between large bacterial cells and small fungal spores can be ambiguous, and different analysts are likely to identify the same cells differently.
Figure 5 shows bacterial (5a) and fungal (5b) abundance determined across soil and compost types using direct counts with microscopy. Typically, the high organic matter content of compost would lead one to anticipate higher microbial densities in compost than in soil. However, microbial abundance was consistently low in the three compost bioreactors from JAL Farms, relative to what was observed in soil. This was likely due to inconsistent irrigation of the compost during the summer of 2022.
Figure 5
Microbial direct counts and fungal-bacterial ratios as determined using microscopy. Sample sources on the X axes represent average values from triplicate samples of compost from each of the three bioreactors at JAL Farms (Comp1--Comp3); compost from the bioreactor at Spirit Farm (Comp 4); soil samples from the fruit orchard at JAL Farms (Orch1-Orch3); and soil from a vegetable garden at Spirit Farm (Gard1). Error bars reflect the mean standard error. Letter codes above the bars indicate statistically significant differences among sources, as determined by Tukey's Honest Significant Difference (HSD) test. Sources sharing the same letter are not significantly different (p > 0.05).
Table 3 compares the abundance of bacterial and fungal cells per gram of dry soil, determined on-site with microscopy to differences in bacterial and fungal populations measured using PFLA. Both methods effectively identified samples with the most abundant fungal and bacterial populations, although rankings of the four compost samples by abundance varied across the two methods. The direct count method used was statistically reproducible, but significantly underestimated the fungal presence and fungal:bacterial ratios detected by PFLA. PFLA analysis also provided more detailed classification of the microbial community, including predator:prey ratios, ratios of gram positive to gram negative bacteria, and various activity ratios (not shown). Since the PFLA results took nearly a month to analyze in the laboratory, and at the time of this report, the analysis cost was listed as $100.95 USD/sample. This makes PFLA highly informative, but financially inaccessible for many small operations. In contrast, microscopy can be carried out on-site with minimal grower training within an hour of collecting the sample, for less than $1 per sample, following a one time investment in a compound microscope and hemocytometer (estimated cost $500 to $1000). We conclude that the reproducibility, speed, and convenience of the direct count method makes it a useful, affordable option for on-site monitoring of changes in microbial diversity and abundance in soil and compost. Users should know that actual counts and fungal to bacterial ratios are likely to vary between analysts due to differences in how cells are classified, and differences in optical clarity of different microscopes. However, with minimal training and practice, an individual grower can achieve reproducible results that enable them to monitor trends in bacterial and fungal density. Information obtained from routine microscopic analysis can be enhanced with baseline knowledge of soil chemistry and occasional laboratory based PFLA.
SIR of Orchard Soil and Compost (Objective 1)
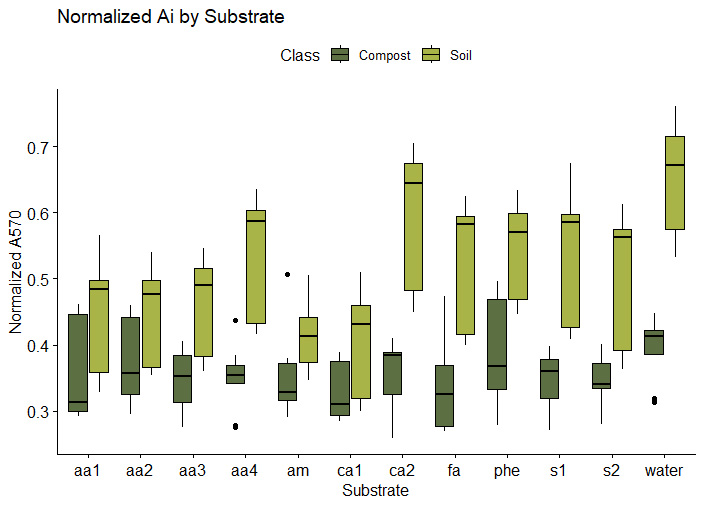
The boxplot in figure 6a shows the normalized absorbance at A570 nm (Ai) for each of the twelve substrates in the presence of orchard soil, garden soil, or compost from the four different bioreactors. A low normalized absorbance at A570 nm indicates a high microbial response. The four composts produced higher microbial functional responses (lower Ai's at 570 nm) than the orchard soils. This contrasts with the lower microbial direct counts observed microscopically in compost, compared to orchard soils shown in Figure 5. The direct count method utilized does not distinguish between live, dead, and dormant cells. One explanation for the higher microbial activity observed in compost could be that a higher percentage of the cells observed in compost were viable and non-dormant. It should also be noted that the direct count method divides all cells into only two categories: fungal or bacterial. Since the SIR method used twelve substrates to assess unique microbial functions, the method is able to assess more complex changes in the microbial community. Specifically, SIR assesses the kinds of metabolic reactions the microbial community is capable of (ie. the functional diversity of the microbial community).
It is of interest to note that the phenolic (phe) substrate was heavily metabolized by Compost 3, which also appears to be the most active compost overall. Microbes that excel at degrading phenolic compounds are thought to be better at degrading lignins and cellulose, important for nutrient cycling in the soil. If future analyses replicate the correlation between overall activity and a high SIR response to phenolic substrates, could provide a potential quality indicator assessing compost maturity.
The garden soil came from a garden at Spirit Farm that has been heavily amended with organic matter over a period of several years, so it is not surprising that several of the substrate-induced responses were similar to those observed in composts.
6a. SIR response by soil source and substrate. Comp1, Comp2, and Comp3 represent the three compost batches produced at JAL Farms LLC. Orch1, Orch2, and Orch3 profiles represent three soil samples collected from the orchard at JAL Farms LLC. The profiles for Comp4 and Gard1 came from compost and garden soil at Spirit Farm, respectively. Substrate codes represent the eleven substrates listed in Table 1, with water acting as a baseline control. Profiles reveal normalized absorbance by cresol red agar at 570 nm using MicroRespTM(10). Absorbance at 570 is inversely correlated with microbial CO2 emissions, such that lower A570 readings indicate higher microbial metabolic function.
Comparing PFLA to site based microbial diversity analysis. (Objective 1)
The microbial diversity analysis carried out on site using substrate induced respiration offers a robust assessment of microbial functional diversity that cannot be directly compared to the functional diversity measured by PFLA, since different parameters are used. PFLA measures the fatty acid profile of the microbes contained within a sample, whereas SIR reveals the ability of microbes within the sample to metabolize each of the twelve selected substrates. The higher startup cost, labor, and technical knowledge involved make the SIR method less preactical for most growers than in-house microscopy. However, the more robust capability of the method, including the ability to quickly detect changes in microbial responses suggest this method could have utility for crop advisors who wish to assess the response of a grower’s soil to a suggested soil amendment.
Seedling Germination Bioassay Results
Six of the seven biostimulant and/or nutrient combinations tested had insignificant effects on seed germination at any of the tested doses. Treatment effects on seed germination (Figure 7) not significant (p< 0.05), with the exception of a single level of MBC, which reduced the seedling germination rate by 20 percent (p< 0.038) when applied at 2 times the manufacturer’s recommended dose, compared to a 50 percent reduction observed in the control. Effects and treatments are likely to be influenced by germination protocol and substrate, such that the dose-response relationship observed on agar plates is likely to differ from rates observed in diverse soil types. The clear reduction of germination inhibition observed at the 2X level was not repeated at lower, or higher treatment levels. More research is needed to clarify the relationship between MBC treatment levels and germination response under a variety of conditions.
Development of a herbicide remediation bioassay with MicrorespTM (Objective 2)
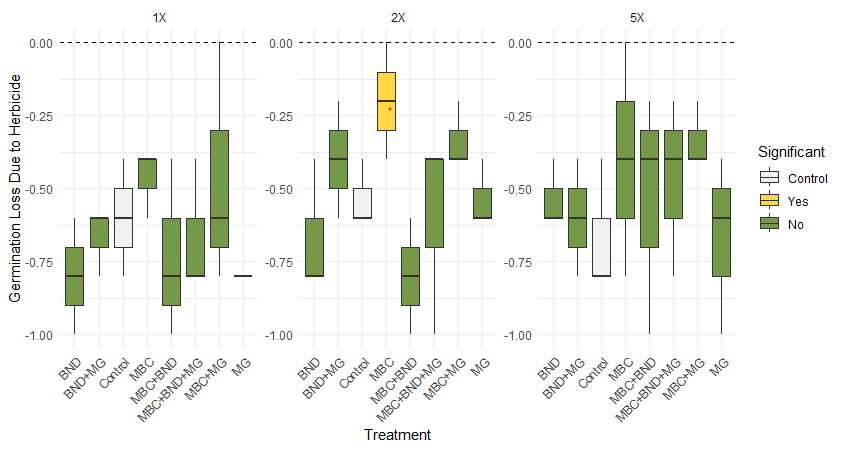
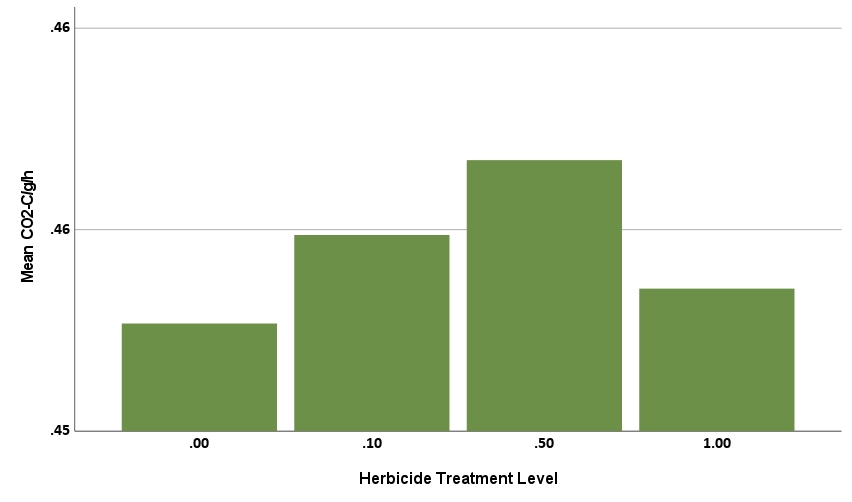
Regression analyses of CO2 production rates (CO2-C/g/h) and of Simpson evenness indices were statistically significant. Discussion of each follows.
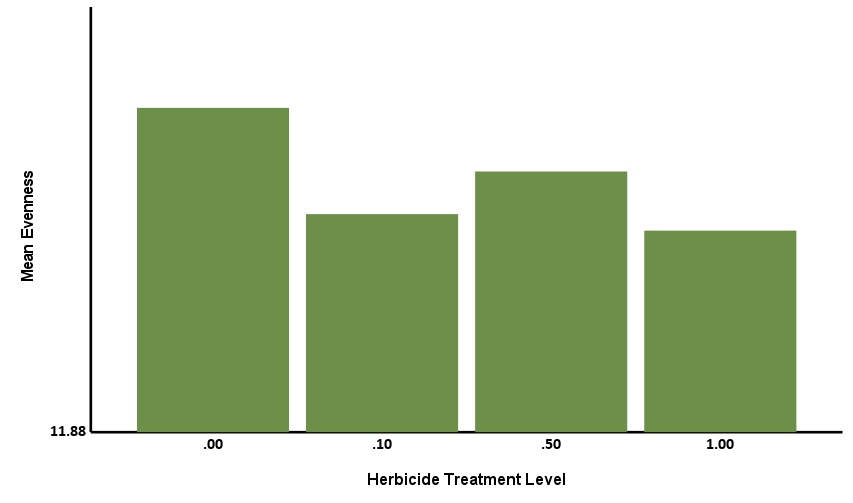
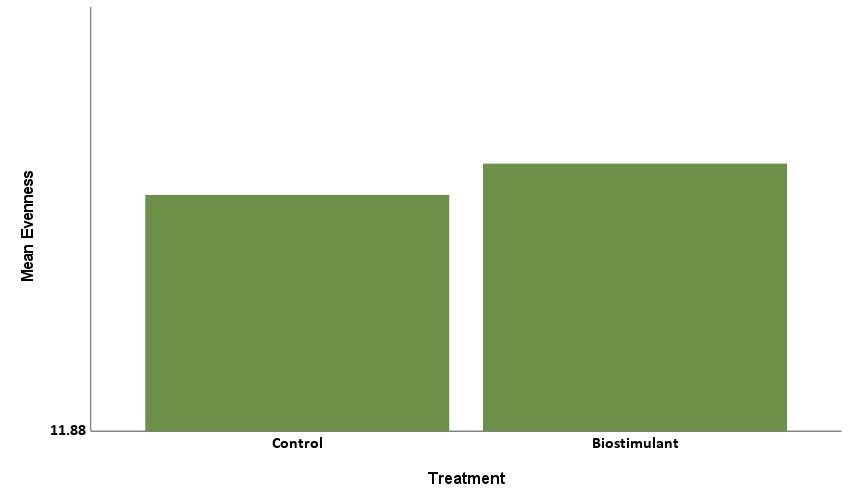
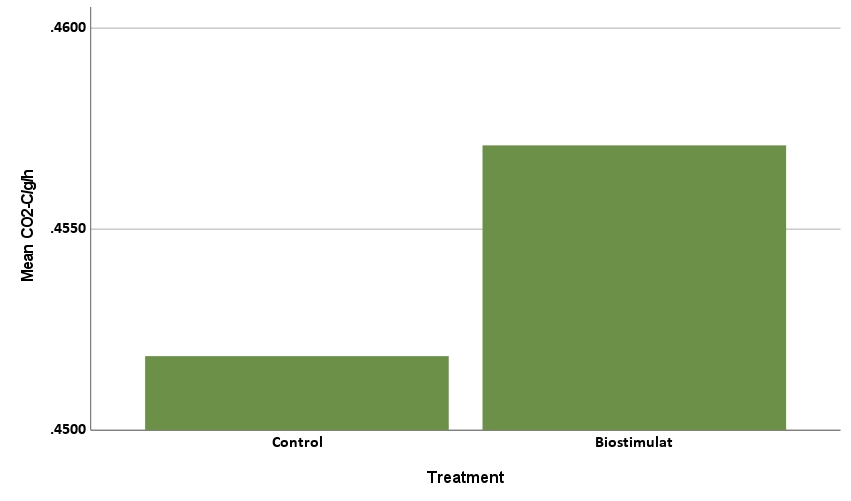
The Simpson Evenness model was statistically significant, explaining 61.45% of the behavior (R2=0.6145, F=76.067, p<.001). Herbicide treatment level was statistically significant with a negative coefficient (-0.014, p<.001), showing that increases in level corresponded to decreases in Simpson Evenness (Figure 8a). Treatment of biostimulant was statistically significant with a positive coefficient (0.015, p<.001) showing that treatment corresponded to increases in Simpson Evenness (Figure 8b). This tells us the herbicide reduced microbial functional diversity, while biostimulant increased microbial diversity.
The CO2 production rate was also statistically significant, explaining 86.8% of the behavior (R2=0.8689, F=181.825, p<.001). Herbicide level was not statistically significant (p=0.113, greater than alpha=0.05 significance threshold), indicating the herbicide treatment did not impact CO2-C/g/h. The rate of CO2 production in soil is often perceived to increase with microbial abundance, suggesting that high doses of herbicide might reduce respiration rates. However, in a complex microbial community, herbicide effects on individual microbial species will vary, with some organisms expected to increase, while others decrease in the presence of herbicide. The compost biostimulant treatment was statistically significant with a positive coefficient (0.006, p<.001, Figure 9b), hence treatment corresponded to increased rates of CO2 production. Eight of 12 substrates also had a statistically significant impact on the CO2 production rate. These eight included three of the four amino acids (aa1, aa3, and aa4), the organic amide (am), one carboxylic acid (ca1), one sugar (s2), one fatty acid analog (fa), and one phenolic (phe). All were positive coefficients, meaning each corresponded to higher rate of CO2 production.
Individual regression analysis of the CO2 production rate by substrate revealed one amino acid substrate, aa3, with statistical significance of both herbicide level (coefficient=-0.0201, p=0.0170) and biostimulant presence (coefficient=0.0390, p=0.0001). aa3 was also the only substrate to have a positive relationship with the biostimulant and negative relationship with herbicide treatment level. The regression model was statistically significant, explaining 84.85% of behavior (R2=0.8485, F=16.10, p<.001). This behavior would be expected if aa3 were mitigating the herbicide effect in the presence of biostimulant, indicating a need for further research.
Herbicide effects on seedling apples and herbicide residue analysis (Objective 3)
Approximately 1/3 of the original orchard seedlings died within 2 years of the spray drift incident in August of 2021. Trees that were dead by October of 2021 were replaced in 2022. Additional trees that failed to leaf out in spring of 2022 were replaced in 2023. Trees that survived the incident, and trees that were planted in 2022, exhibited rapid, vertical, vegetative growth. That is, lateral branches emerged at angles less than 15 degrees from the main stem. Such branches contribute to structural weakness because they cannot hold fruit and they inhibit adequate light penetration. Spring flowering has also been inhibited. Aproximately 5 % of the new shoots that appeared in summer of 2024 exhibited the desirable 45-to-60 degree angles, although a predominance of vertical shoots has continued through June of 2025.
Herbicide residue testing screened for a panel of 17 class-4 herbicides, including picloram, triclopyr, clopyralid, and 2, 4-D-all of which were detected on trees from JAL Farms as a result of pesticide drift in 2021. Soil testing revealed no signs of pesticide contamination. However, leaf tissues revealed traces of 2, 4-D (3.88 ppb).
References
-
- DC Johnson and HC Su-Johnson. (2010), https://youtu.be/DxUGk161Ly8 -.
- Saul-Tcherkas, Y. Steinberger, Substrate utilization patterns of desert soil microbial communities in response to xeric and mesic conditions. Soil Biology and Biochemistry 41, 1882-1893 (2009).
- Bongiorno et al., Soil management intensity shifts microbial catabolic profiles across a range of European long-term field experiments. Applied soil ecology : a section of Agriculture, ecosystems & environment 154, (2020).
- B. Sassi, J. Dollinger, P. Renault, A. Tlili, A. Bérard, The FungiResp method: An application of the MicroResp™ method to assess fungi in microbial communities as soil biological indicators. Ecological indicators 23, 482-490 (2012).
- G. Dennis, T. Kukulies, C. Forstner, T. G. Orton, A. B. Pattison, The effects of glyphosate, glufosinate, paraquat and paraquat-diquat on soil microbial activity and bacterial, archaeal and nematode diversity. Sci Rep 8, 2119 (2018).
- N. Stepanova, J. M. Alonso, Auxin catabolism unplugged: Role of IAA oxidation in auxin homeostasis. Proc Natl Acad Sci U S A 113, 10742-10744 (2016).
- Mohammad Emad, K. Sa’eb, L. Mary, S. Jesus, U. Adrian, Soil community catabolic profiles for a semiarid reclaimed surface coalmine. International Journal of Mining, Reclamation and Environment, 1-17 (2023).
- D. Campbell, S. J. Chapman, C. M. Cameron, M. S. Davidson, J. M. Potts, A Rapid Microtiter Plate Method To Measure Carbon Dioxide Evolved from Carbon Substrate Amendments so as To Determine the Physiological Profiles of Soil Microbial Communities by Using Whole Soil. Appl. Environ. Microbiol. 69, 3593-3599 (2003).
- J. Fernández-Gómez, R. Nogales, H. Insam, E. Romero, M. Goberna, Role of vermicompost chemical composition, microbial functional diversity, and fungal community structure in their microbial respiratory response to three pesticides. Bioresour Technol 102, 9638-9645 (2011).
- O. Gazdag et al., Density and Diversity of Microbial Symbionts under Organic and Conventional Agricultural Management. Microbes and environments 34, 234-243 (2019).
- A. Oren, Y. Steinberger, Catabolic profiles of soil fungal communities along a geographic climatic gradient in Israel. Soil Biology and Biochemistry 40, 2578-2587 (2008)
- MicroResp ™ Technical Manual. (James Hutton Ltd, ed. 4, 2022).
Research outcomes
On-site Visual Leaf Analysis
Visual analysis is arguably the most user accessible method for examining tree health, since leaf color, leaf deformities and abrasions, and pest or disease damage are clear indicators of tree health. While visual symptoms alert growers to problems and assist in diagnosis, visual analysis cannot clearly identify which essential nutrients might be missing, since many deficiencies provide similar symptoms. Furthermore, if the goal is to maintain trees at optimal health, it is desirable to apply nutrients before clear visual symptoms appear. In our experience, thrips and other pests that feed on visually asymptomatic leaves (Figure 1 video) disappear when nutrient deficiencies are corrected.
On-site Leaf Sap Extraction and Brix Analysis
Brix values taken from leaf sap of most annuals and many forage crops can provide indicators of general plant health, However, extracting leaf sap from fruit tree leaves is less feasible, since leaf sap may be too difficult to extract. Since we did find blogs from orchard managers who claimed to use Brix testing, it may be that environmental factors influence sap extractability.
It should be noted that Brix monitoring of fresh fruit is a well-proven technique for assessing sugars. As such, it remains a valuable tool for monitoring fruit quality. Also, newer tools such as chlorophyll meters may provide similar general plant health indicators, since chlorophyll levels indicate photosynthetic capability, which is an essential production factor.
Laboratory Analysis of Leaf Tissues and Sap
In the data presented here, laboratory analysis of leaf sap was more effective at identifying deficiencies that informed remediation of interveinal chlorosis than leaf tissue analysis, and both methods were more informative in terms of nutrient concentration than any on-site analyses. While grower's might be inclined to apply a general N, P, and K fertilizer when deficiencies are observed, we found micronutrients to be more often in demand, and less expensive to apply than the N, P, and K. This may be the result of no-till practices coupled with a cover crop. It must be noted that the small number of samples utilized for this study prevented strong inference regarding the utility of sap analysis. Based on observations made in this study, and in daily orchard management, our current "best practice" is to monitor leaves every 3 or 4 days by looking for pests and by measuring chlorophyll with a handheld meter. When average chlorophyll readings fall below 400 μmol/m² or pests become problematic, we submit samples for sap analysis and apply the indicated nutrients. This practice has largely eliminated chlorosis.
Site-Based Microbial Direct Counts and Laboratory based soil tests.
Direct counts of soil microorganisms can provide a statistically reliable (reproducible) and cost-effective method to monitor soil microbial populations. The method does require some initial investment, including purchase of a suitable compound microscope and hemocytometer. It also takes a commitment to learning how to distinguish fungi from bacteria under the microscope. For the best quantitative results, samples should be diluted to a concentration of < 300 bacterial cells per 0.2 mm grid, and fungal cell counts should only include spores. Tap water used to suspend microbes should be free of chlorine (carbon filtration is sufficient). Since microbial counts will vary seasonally, and microbial populations will increase with increasing soil organic matter, a useful approach would be to test soil macronutrients, micronutrients, and organic matter at an independent lab annually in conjunction with a microscopic microbial analysis. PFLA may be used in conjunction with, or in place of microbial direct counts, and will provide a more precise measure of microbial diversity and function. Economics and grower preferences will dictate which approach makes the most sense. Growers seeking to manage for healthy soils should typically strive to increase fungal:bacterial ratios. Since optimal fungal to bacterial ratios will vary depending on the analytical method used, growers should optimize their method, choose reputable labs, and avoid changing methods used for long term monitoring.
Microbial Functional Analysis Using Substrate-Induced Respiration
Substrate-induced respiration implemented with a variety of different substrates offers a powerful technique for exploring differences in microbial community function across samples. The technique is technically challenging and labor intensive for most growers, but may have utility for crop advisors, extension agents, or fertilizer and biostimulant producers who want to demonstrate how an added product will impact soil microbiology. The method identified changes in microbial diversity (measured as evenness) that could be attributed to herbicide and/or biostimulant additions. This should make it a useful tool for assessing remediation strategies, and for supporting soil amendment recommendations.
Herbicide persistence and remediation progress
Herbicide residues disappeared from soil two years after the drift incident that inspired this project, while 2, 4 - D remained detectable in leaves in year 3. Plant performance effects of drift, including vertical growth (branch angles <20 degrees) and inhibition of spring flowering, have continued through 2025. In this case study, drift effects caused complete crop failures (no marketable fruit) for two seasons. The crop anticipated for 2025 is projected to yield only 2% of the projected yield for a five-year-old orchard. This project has developed a bioassay that can identify herbicide and biostimulant effects on soil microbial communities, and bioassays that measure effects on model plant seedlings. Both tools may be useful, in conjunction with direct measurements of pesticide residues for new research aimed at identification of biostimulants or other treatments that remediate herbicide damage. Herbicide drift continues to be a widespread problem with devastating impacts to farm sustainability. More intensive research on specific crop remediation methods and herbicide biodegradation would provide growers, crop insurance advisors, and crop consultants with tools for mitigating damage.
Progress towards developing herbicide remediation strategies
Prepared herbicide mixtures, including cocktails used in commercial spraying, or the SpeedZoneTM mixture used in this study are designed to work in diverse conditions, on varied soil types. This makes bioremediation strategies exceptionally challenging to develop. This study provided proof of concept for further research by demonstrating (1) SIR was useful for assessing changes in soil microbial function induced by both a herbicide mixture and a biostimulant, and developing a statistical model that could effectively tease out biostimulant and herbicide activities. (2) Identifying eight substrates that significantly impacted respiration rates, measured as the rate in CO2 emission. (3) Identifying a substrate with a CO2 production pattern that suggests it may be mitigating herbicide impacts on the soil community. (4) Micronized biochar may reverse the effect of herbicide on seed germination. These findings provide a solid foundation for future research by providing bioassay protocols and putative remediation strategies that can be investigated for herbicide drift remediation.
Education and Outreach
Participation summary:
Educational outreach objectives were modified in year 1 included two invited presentations. On March 3, 2023, Mary Lucero delivered a presentation entitled Cover Crops and Low Till Management at the 2023 NM Fruit Growers Workshop in Abiquiu, NM. Approximately 50 growers and agriculture professionals were present. On March 9, she presented Maintaining Healthy Soils in an Unhealthy Ecosystem to the New Mexico Farmers' Marketing Association in Santa Fe, NM. Approximately 45 of the enrolled participants attended this section. Both presentations were delivered in communities with diverse and historically underserved populations.
Outreach in Year 2 included:
- A soil sampling workshop presented to biofertilizer consultants and community gardeners in cooperation with Texas Earth in Idalou, Texas in March of 2023
- A presentation entitled Achieving Sustainable Local Agriculture by Leveraging Microbiomes for Soil Restoration, delivered at the Western SARE Building Partnerships for Agricultural Sustainability Summit in Phoenix, AZ, December 2023
- A field day at JAL Farms that demonstrated soil sampling techniques, microbial analysis, and use of a refractometer for crop nutrient monitoring.
The initial objective of recording 20 podcast episodes was modified due to technical difficulties associated with recording quality and with making the recordings and transcriptions ADA compliant. After consulting with SARE staff, it was decided to drop the podcasts altogether and look for alternative outreach opportunities. Outreach has since been carried out through the two live presentations discussed above. A third presentation has been scheduled for August of 2023.
In both completed presentations, the benefits of biologically based agricultural approaches, laboratory testing, and on-site monitoring were highlighted. For Cover Crops and No Till Management, the audience consisted of experienced fruit growers, so the presentation used soil test data to illustrate the loss in soil quality following deep tillage and laser leveling, followed by the restoration which occurred over the course of two years without tillage, when using cover crops and biostimulants in place of synthetic fertilzers. Participant survey data from this presentation was gathered by the Rio Arriba County Cooperative Extension Service, and will be made available at a later date.
In Maintaining Healthy Soils in an Unhealthy Ecosystem, the audience consisted of less experienced farmers market gardeners, including less
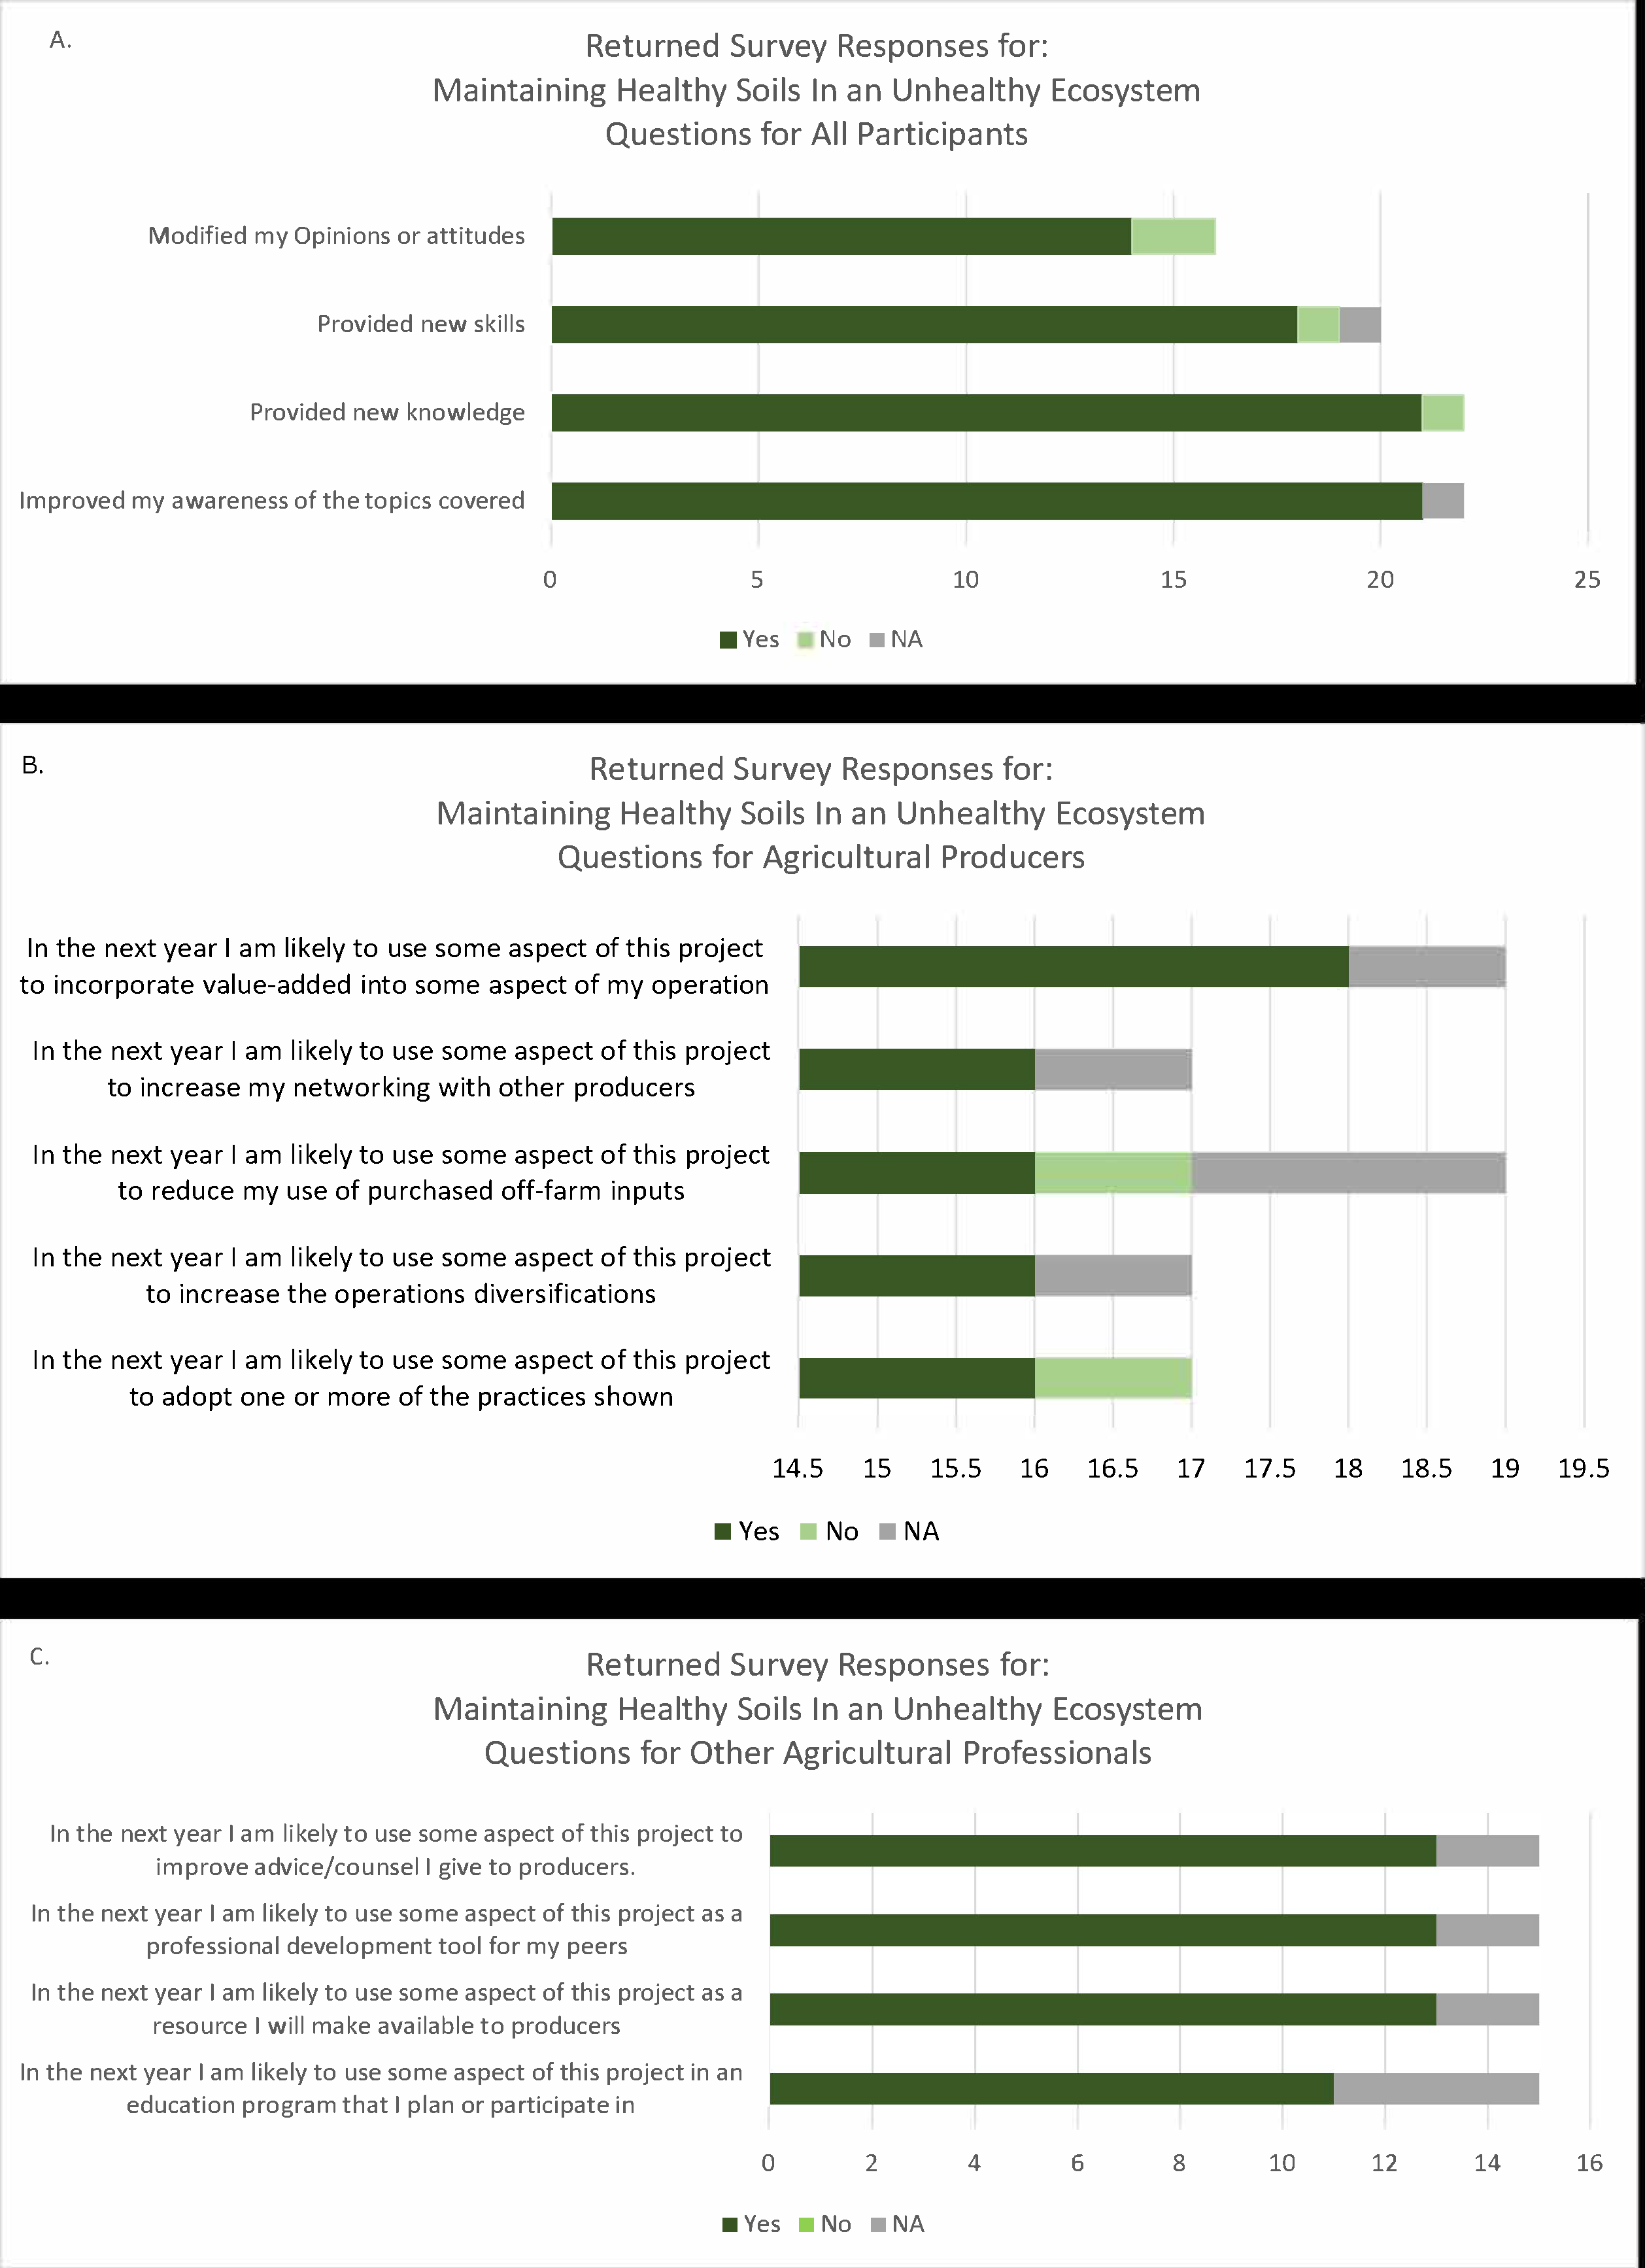
traditional urban and first time growers. This time, the topic centered on basic soil health principles, the benefits of biological practices, and elementary monitoring steps relevant to small operations. Examples of environmental and anthropogenic factors that can interfere with soil health were discussed. Program feedback was assessed using the Western Region Sustainable Agriculture Research and Education Program Outreach Survey. Survey results are illustrated in Figure 1, to the right. A smaller group was anticipated, so only 30 surveys were available to distribute. Twenty-two of these surveys were returned.
The four questions addressed to all respondents (Figure 1A) indicated the presentation was effective in providing new awareness (100% of respondents), new knowledge (95% of respondents), and skills (81% of respondents) that impacted opinions or attitudes.
Responses to questions presented to producers (Figure 1B) revealed unanimous willingness to adopt new practices and diversify production. Curiously, all responses also indicated willingness to use the project to increase networking with other producers. Ninety-four percent of respondents planned to use some aspect of the presented information to reduce purchased off-farm inputs. An additional 94% were willing to adopt one or more of the practices shown.
Fifteen agricultural professionals responded to the survey. Professional responses were overwhelmingly positive, as all answers were either yes (83%), or not applicable to their situation (17%).
Education and Outreach Outcomes
Projects for federal grants that include podcasting or other audio-visual media production need to include budget for transcription and other ADA compliance factors.
Information about sustainable agriculture that illustrates, not only the long term global benefits, but the immediate benefits to the producer has been well received in live presentations.