Final report for FW22-404
Project Information
Testimony from producers in our networks and research presentations by Dr. David Johnson suggest that New Mexico producers can save water, improve soil health, and reduce fertilizer expenses—without sacrificing crop yields—by adopting mixed-species cover cropping and Johnson-Su microbial inoculations. However, the current lack of published field trials leaves this promising combination of approaches as just that: promising.
To produce reliable evidence that could hasten the adoption of mixed-species cover cropping and Johnson-Su microbial inoculations if their promise is confirmed, we designed and began a six-year, on-field trial at Pata Viva farm, using a modified split plot research design. There were three experimental variables--mixed-species cover crops, Johnson-Su microbial inoculations, and fertilizer inputs (progressively decreased over the duration of the study)--and four dependent variables: soil health metrics, plant nutrient data, plant yield data, and water use (controlled and monitored by an automated irrigation system triggered at a threshold soil moisture content). Due to several challenges discovered during the study, the study was concluded in 2024 at the end of WSARE funding.
Based on the experiences of other producers in our networks (see letters of support) and the credible but non-peer-reviewed research of Dr. Johnson, we expected the field trial to provide compelling evidence that cover cropping and Johnson-Su microbial inoculations can provide environmental benefits (reduced water use and improved soil health) and save producers money through reduced inputs (water and fertilizer). By publishing the experimental results and by presenting them to producers in the Soil Health Champions network, the Seeding Regenerative Agriculture project, and other groups, we planned to foster the broader adoption of these (potentially) environmentally and economically favorable practices.
In lay terms, our research objective was to investigate whether New Mexico producers can save water, improve soil health, and reduce fertilizer expenses—without sacrificing crop yields—by adopting mixed-species cover cropping and Johnson-Su microbial inoculations.
Our education objective was to increase awareness of mixed-species cover cropping and Johnson-Su microbial inoculations by sharing the results of our on-field trial through virtual presentations to the New Mexico Soil Health Champions network and through in-person demonstrations through the Seeding Regenerative Agriculture project.
| Year | Farm Management Plan | Data Collection/Outreach | ||
| 2020 | Set up research plots & sample. | Y0: Baseline soil sample | ||
| 2021 | Till, level, lay water lines. | No data collection | ||
| Fall: plant cover crops. | ||||
| WSARE | 2022 | Fertilize, roll cover crops. Plant summer veg., harvest. Plant winter cc. | Y1: Soil sample; plant nutrient and yield data collection. Field day. | |
| GRANT | 2023 | Fertilize, roll cover crops. Plant summer veg., harvest. Plant winter cc. | Y2: Plant yield data collection. Field day. | |
| Activities | 2024 | Fertilize, roll cover crops. Plant summer veg., harvest. Plant winter cc. | Y3: Soil sample; plant nutrient and yield data collection 2. Field day. | |
| in Bold |
2026 | Write and publish article. |
Cooperators
- (Researcher)
Research
Our research objective was to employ an on-field, split-plot design to investigate how mixed-species cover cropping, Johnson-Su microbial inoculations, and progressive reductions in applied fertilizer affected water use, plant biomass, crop yields, and indicators of soil health (physical, chemical, and biological).
Research Design:
Plots were arranged in a split-plot design with Cover Crop Mix vs No Cover Crop Mix as whole plots and Johnson-Su Compost vs No Johnson-Su Compost as subplots (Figure 1). There are two replications of the whole plots, and plots were maintained for four years while soil test data (field and lab) were collected. Each plot was 18' in width (equal to three 6-foot beds) and 72' in length. A tilled border occupied beds to the north and south of the plots.
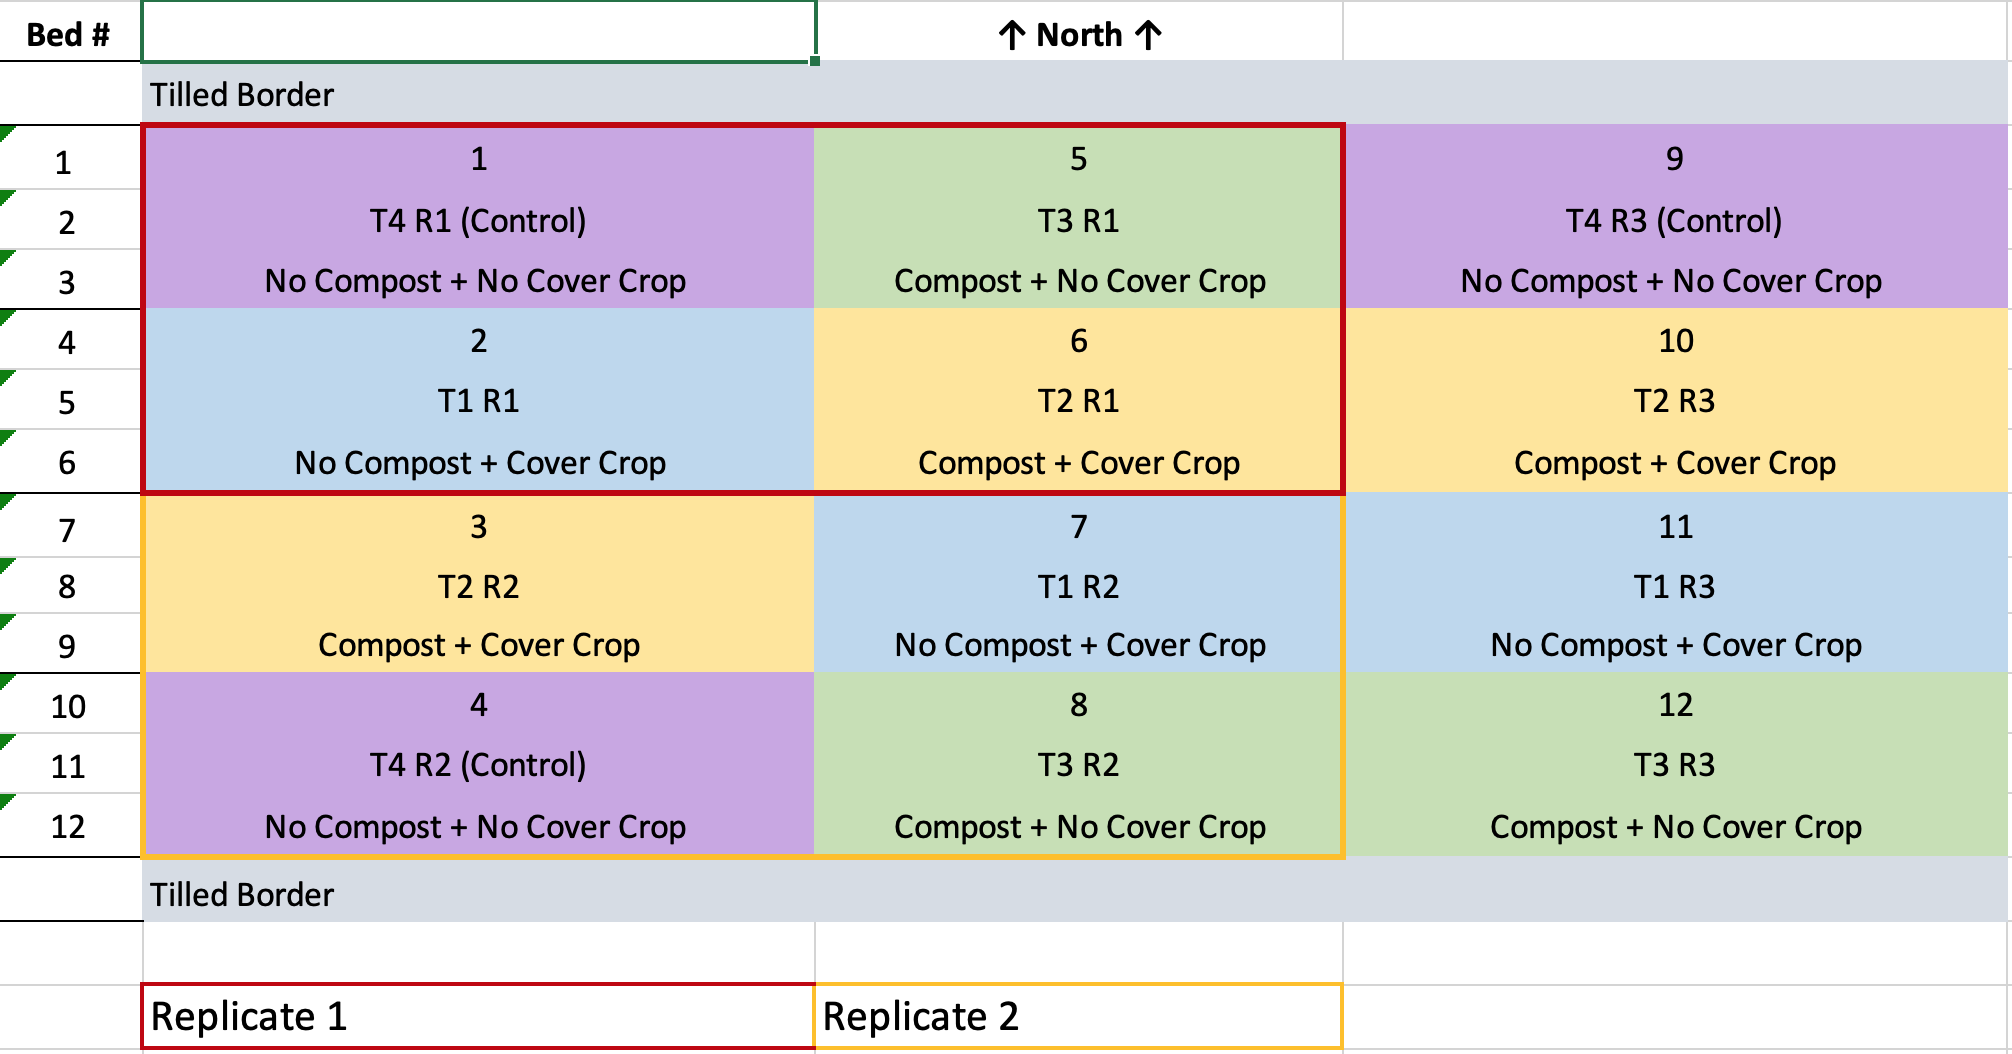
Figure 1. Plot Treatment and Replication Layout
All plots were managed similarly with respect to conservation tillage and fertilizer, while the cover crop vs. non cover crop treatments required different levels of irrigation. Cover crops were terminated by roller crimping.
Within each replicated subplot, four crops were sown east to west as follows: pepper, okra, tomato and squash. Each year, the crop was planted one subplot over (eastward).
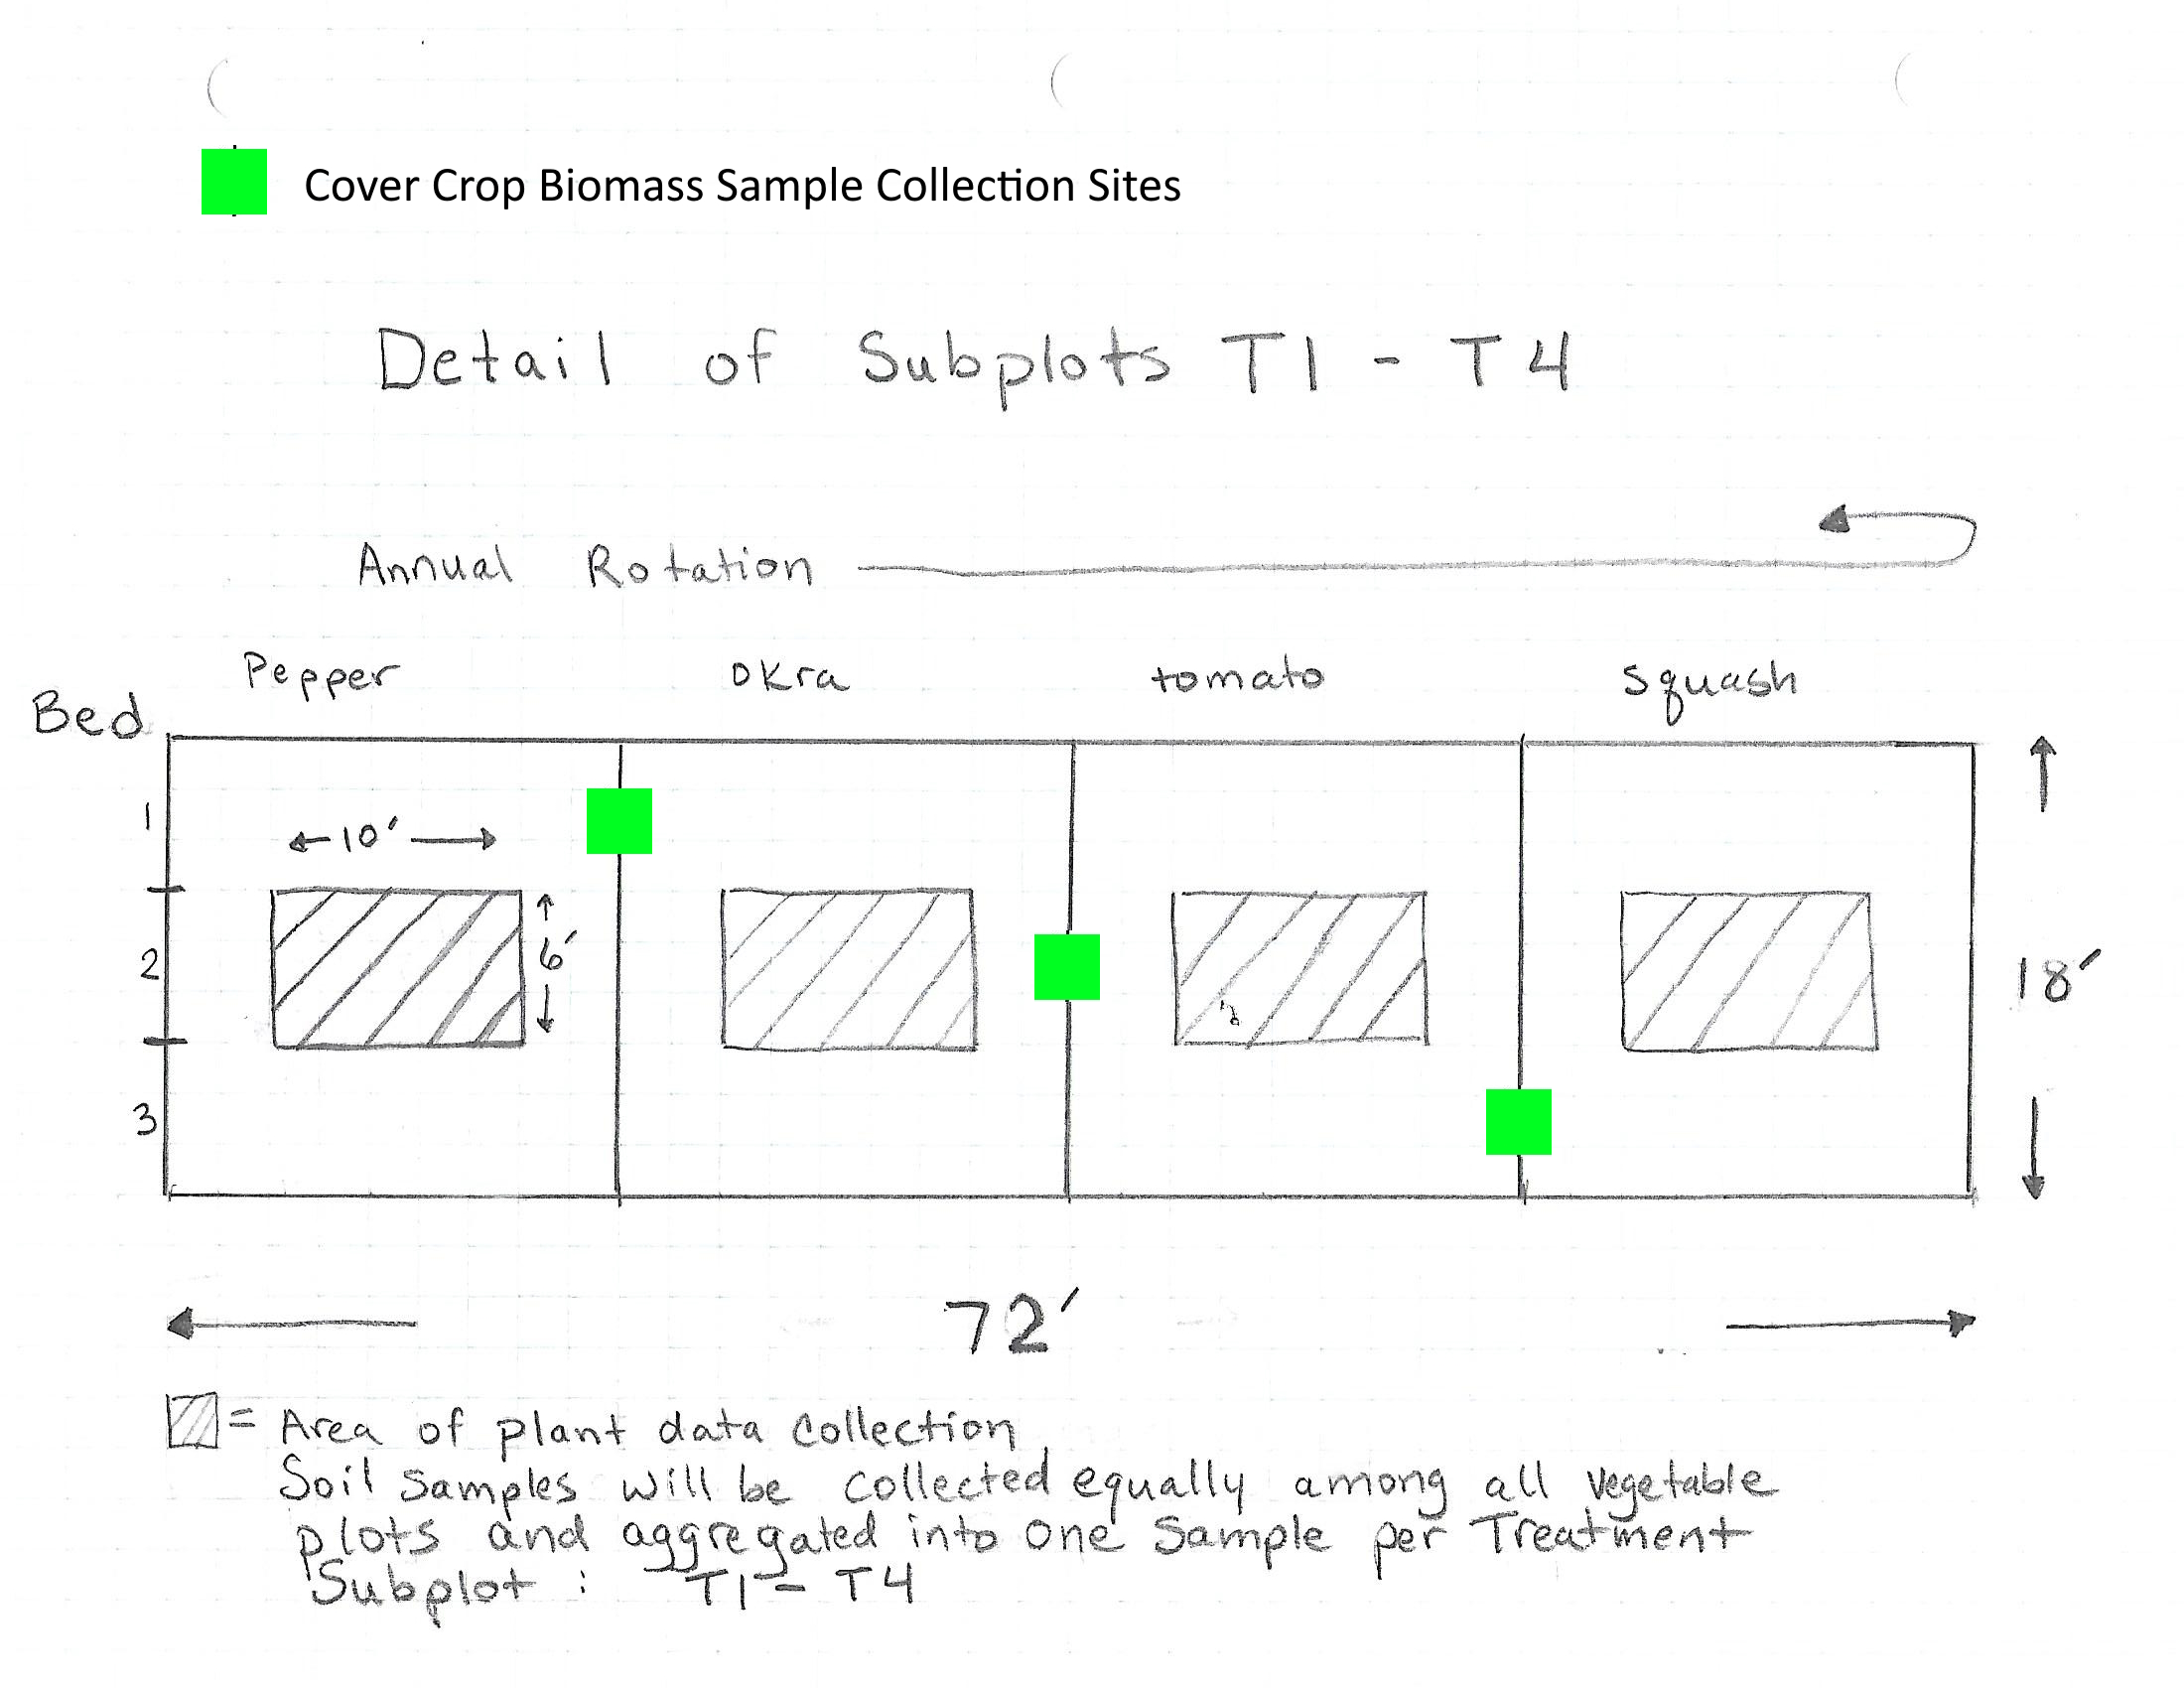
Figure 2. Subplot Details
Peppers and tomatoes were transplanted; okra and butternut squash were direct seeded. Varieties were as follows: Peppers- Carmen Organic and Escamillo Organic; Tomato- Estiva; Okra- Clemson Spineless Organic; Butternut squash- Butterscotch Organic. Planting dates were April-June. In 2024, early extreme heat and pressure from false chinch bugs killed most plants at Pata Viva that were not part of the research. These conditions precluded the possibility of successfully planting the planned crops, so the research team substituted late season melons (Milan Cantaloupe, Golden Giant Korean melon, and Diplomat Honeydew) across all treatments, with an early August planting date.
The project used compost created via the Johnson-Su Bioreactor method, which is an aerobic, no-turn, vermicompost process in which the compost matures 12 months and tends to produce a microbial species-rich, fungally dominant compost.
The cover crop mix was sown every fall and terminated in the spring by roller crimping. Seeding rates and species varied based on actual planting dates, with a priority of maximizing diversity, cycling nutrients, and conserving water.
Fertility Plan
All plots received the same fertilizer and rates, as follows:
- 2022: 700 lbs./ac
- 2023: 300 lbs./ac
- 2024: 150 lbs./ac
Fertilizer (The Farm’s Choice poultry meal, 10-0-0) and liquid nutrients were banded at approximately 3" deep in the planting row . Timing of application was at rolling of cover crop plots. Non-cover crop plots were fertilized at the same time. Rates were reduced each year.
Given the farm’s history of micronutrient deficiencies, a pre-plant liquid fertilizer blend was applied as well. This was band applied with the poultry meal. Rates were as per acre. Fertilizer was from Advancing Eco Agriculture: Rejuvenate (3 quarts), Forage Foliar (1 gallon) and HoloCal (1 quart). Rates were reduced by one third of the original value each year.
Data Collection
For water use monitoring, we established separate irrigation systems between cover crop and non-cover crop treatments. Each system had a water meter and soil moisture sensor. Moisture sensors were integrated with the irrigation controller that automatically turned irrigation on and off based on a soil moisture threshold. Total water applied was tracked by manual water meter readings.
Soil health was monitored through lab tests including Haney, S-11 Salinity, POX-C, PLFA, and S-5 Complete Routine + B, as well as through infiltration rate. These tests were performed according to NRCS guidelines.
Soil samples were collected in fall 2020 for baseline measurements. Additional samples were collected in fall 2022 and fall 2024. Soil samples were taken equally from all vegetable plots and aggregated into one soil sample per treatment subplot (T1-T4). Soil samples were collected at a depth of 0-6”.
Soil cores within one treatment subplot were collected in a bucket, mixed well, placed in Ziplock bags, and labeled with sample IDs that identified treatment, replicate, date, and farm name. Care was taken to use clean buckets and tools from plot to plot to avoid cross-contamination. All soil samples for lab analysis were shipped on ice via the fastest possible method to Ward Labs.
Cover crop biomass was measured as net primary productivity before rolling. Three samples were collected from each cover crop plot as shown by the green squares in the subplot detail image above. Biomass was clipped at soil level within an 18" x 18" frame, collected, and air dried. Samples were then oven dried at 220 °F for three hours. Vegetable crop yield was measured as weight at harvest. These data were gathered from 2022-2024.
Plant tissue/nutrient data for peppers were measured through P-2 Routine Plant Tissue Analysis. Crop yield and plant tissue/nutrient data collection were limited to the center 10’ of the middle rows of each subplot (see Figure 2) for all years except 2024. In 2024, yield from the melons was collected from the middle 60' of each row in order to maintain a sampling buffer between treatments. Collection of plant tissue/nutrient data was conducted in 2022 and 2024.
For fruit yield, data were recorded as fresh weight.
Notes on Materials and Methods
The experimental design was carried out as planned in the 2022 growing season, with the notable exception of the cover crop plots. There was a delay in the planting of the cover crop mix, which was planted on March 25, 2022. The resulting cover crops did not die off as expected in summer heat, and they suppressed the growth of most vegetable crops in the cover crop plots. The cover crops and the few vegetable crops that came up in the cover crop plots were terminated by mowing followed by cultivation on July 18, 2022, with the intention of replanting a summer cover crop; however, rains made the fields unworkable during the summer cover crop planting window, so the cover crop plots were fallow from July 18, 2022, until winter cover crops were planted on November 27, 2022.
In the 2023 growing season, delayed planting due to extreme pest pressure (False Chinch Bugs, Nysius raphanus), combined with record heat (approximately 130 days at or above 100 °F), severely reduced plant stands and yields in all plots. Tomato and pepper crops were both lost. In the 2024 growing season, repeated extreme heat and pest pressure (False Chinch Bugs) made planting the planned summer crops impracticable, so the team substituted late-season melons across all treatments.
Notes on Results
Record-setting extreme heat combined with pest pressure in 2023 and 2024 severely depressed plant growth and survival across all test plots and also across all areas in standard farm production.
Results
Infiltration rate
Infiltration rate increased with time in all treatments. There was no difference by treatment in 2022. In 2024, cover crop plots averaged 60% higher infiltration rate than control plots (P-value < 0.05).
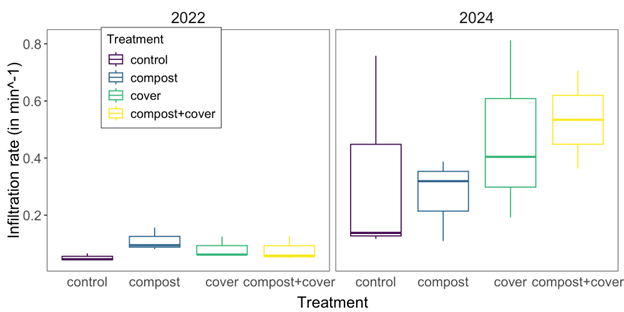
Figure 3. Infiltration rate in 2022 and 2024 by compost and cover crop treatment levels. (Median = thick line, interquartile distances = box, 95% range = whiskers.)
The increased infiltration rates over time in all plots may reflect the impact of reduced tillage across all treatments compared to the baseline.
Bulk Density
Bulk density tended to be lower (4%) in the cover crop plots than controls (X2 = 3.03, P = 0.082), but there was no effect of compost or interactions (P values > 0.1).
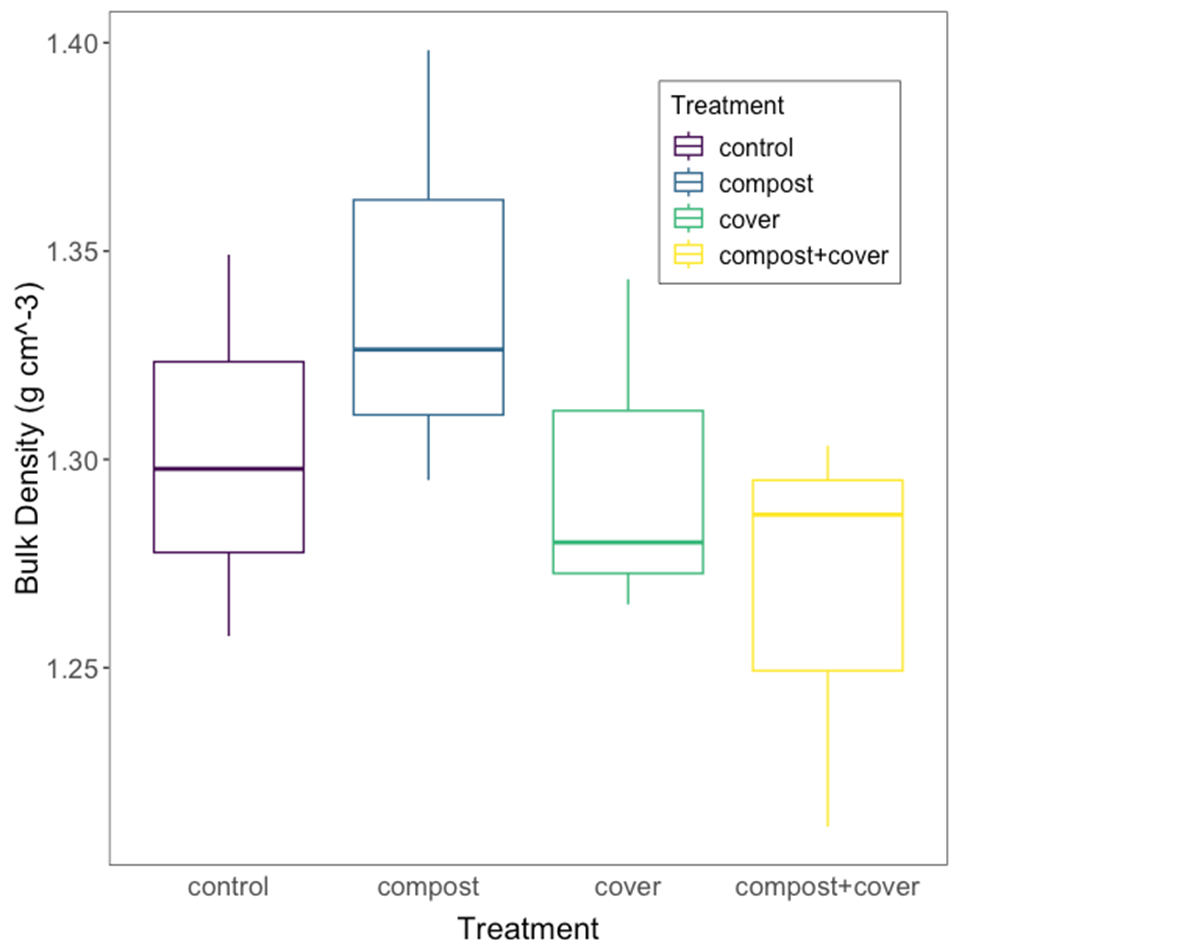
Figure 4. Bulk density in 2022 (1 year after treatments were imposed) by compost and cover crop treatment levels (n = 3). Boxes show the median, and the first and third interquartile range, whiskers extend to the largest value no further than 1.5 * interquartile range, and points indicate outliers beyond the whiskers.
Vegetable yield
There was no significant effect of production per plant by compost treatment in 2022 (F3,16 = 0.55, P = 0.652).
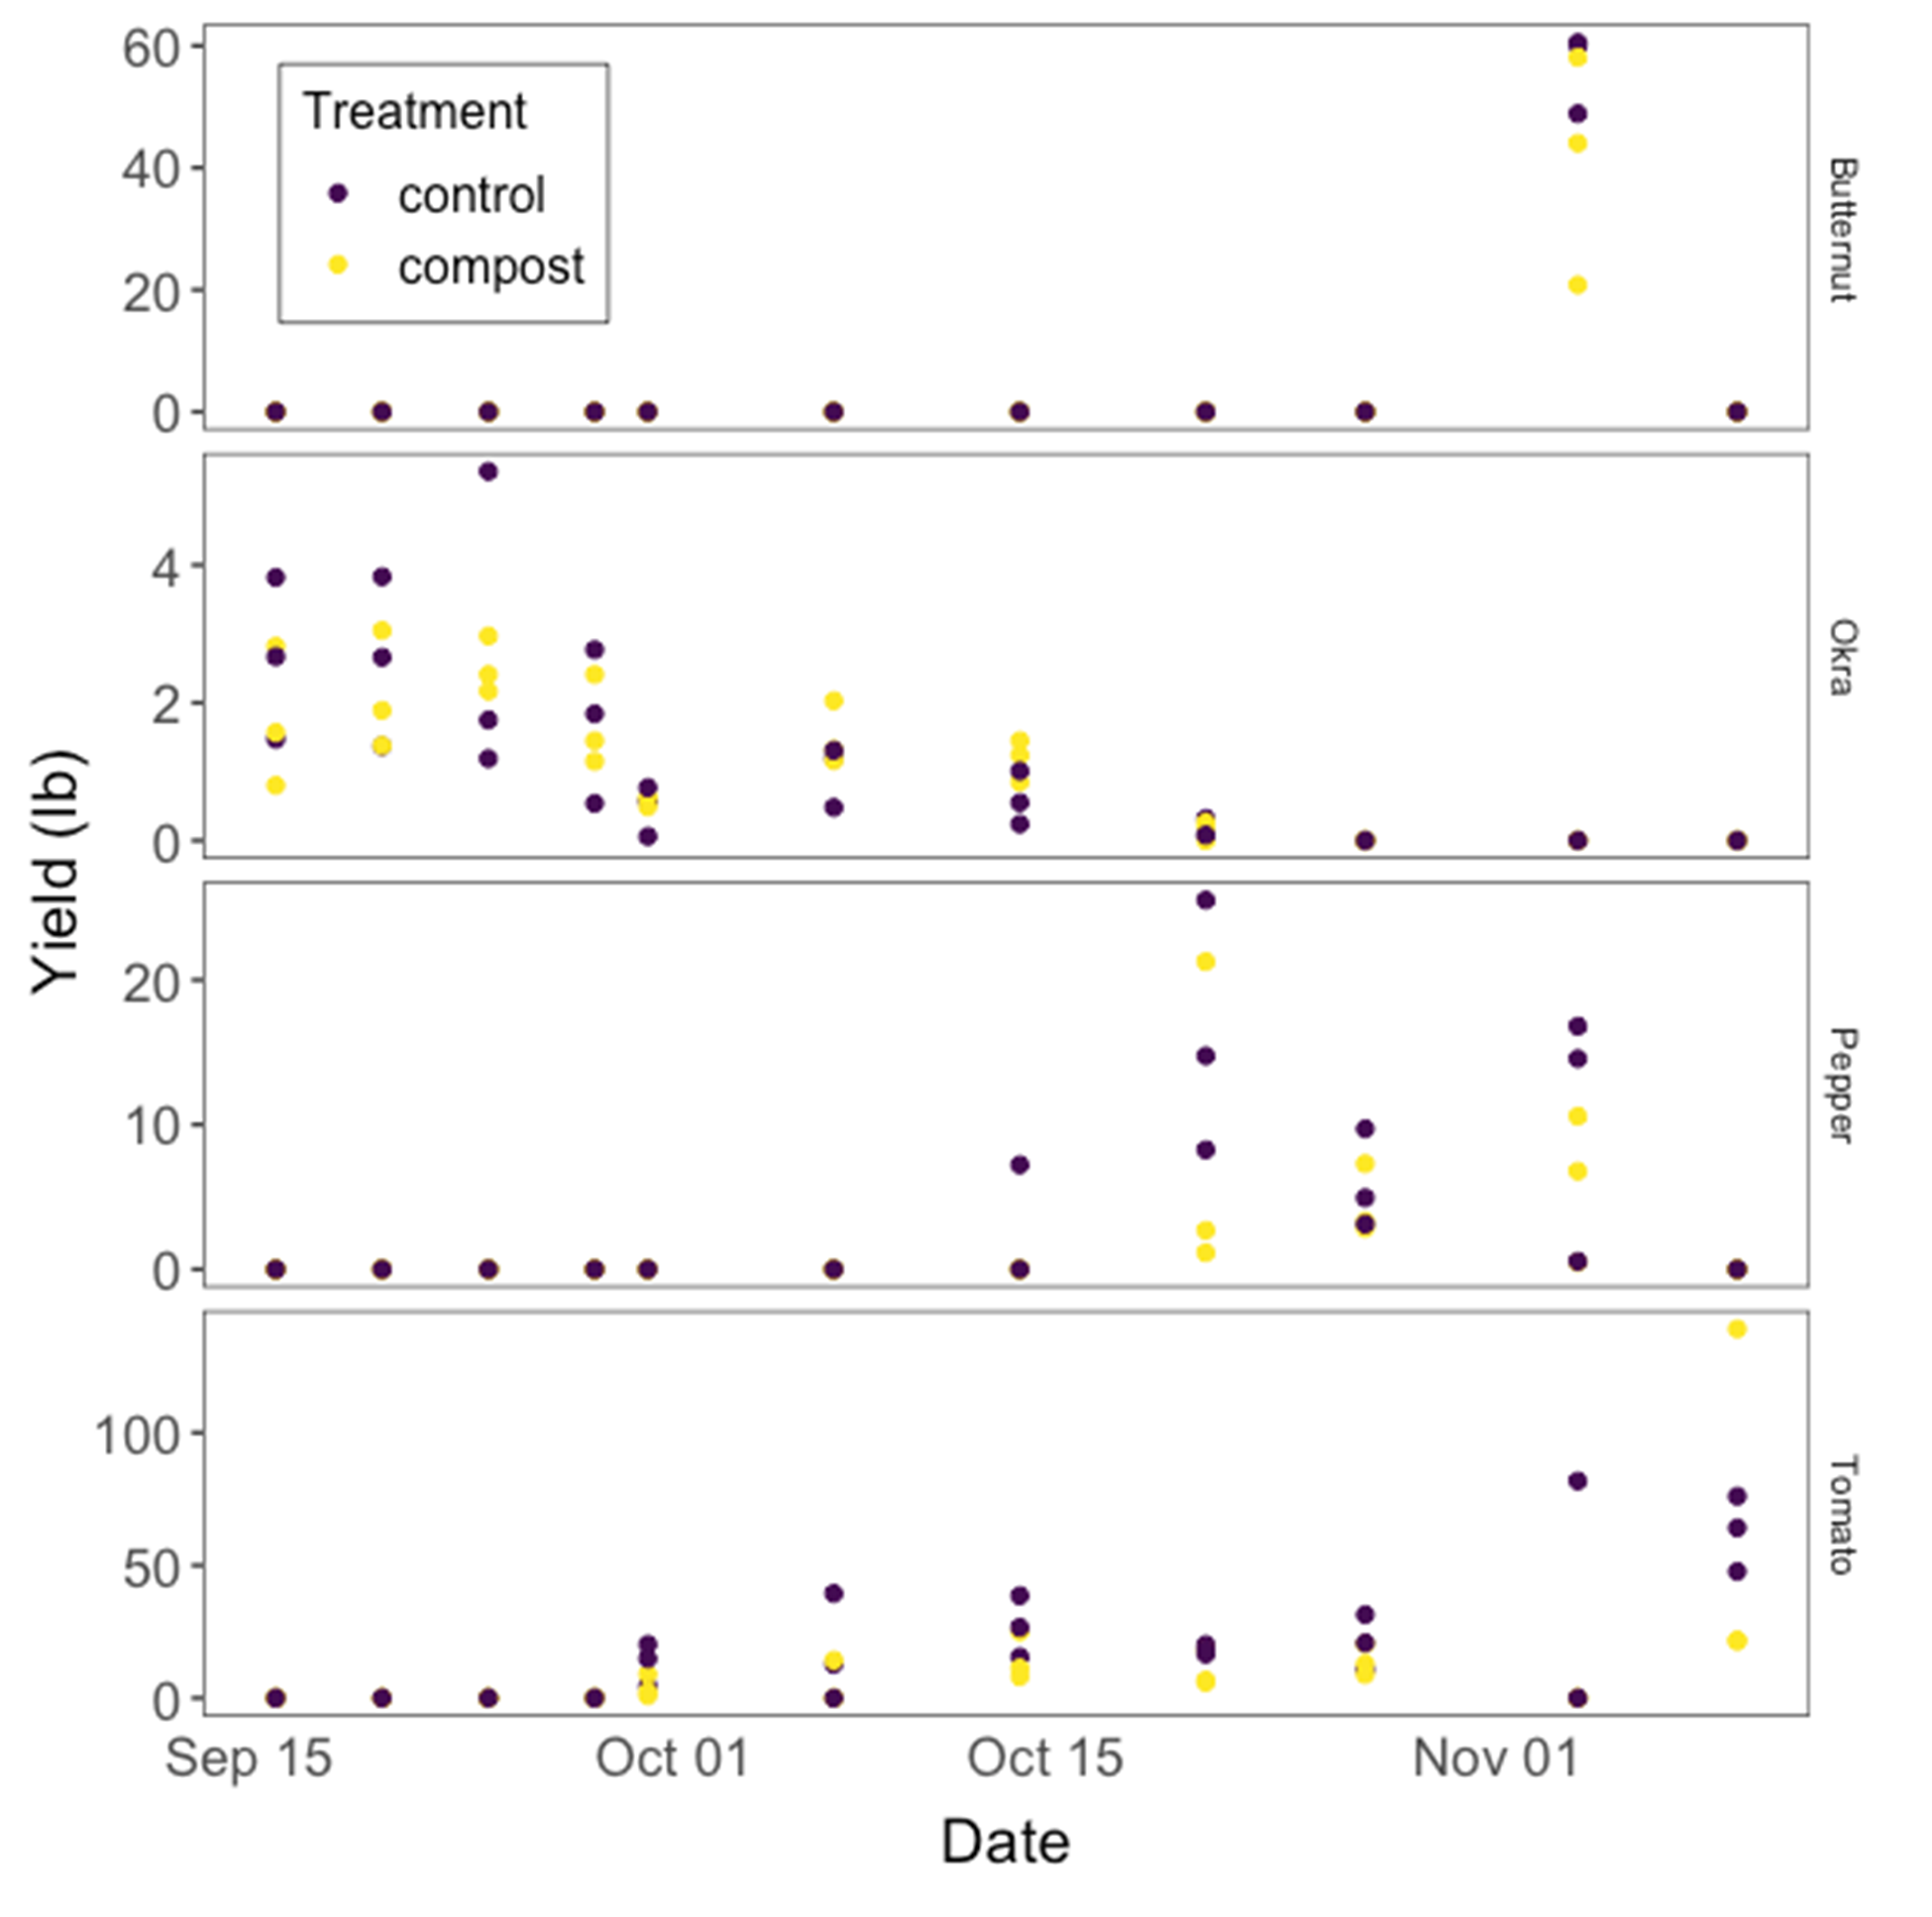
Figure 5. Total yield of different vegetable products through time in 2022 by treatment (treatment was imposed in September 2021; n = 3).
2022 yield data was only collected from plots without cover crops, as cover crops did not die off as expected in summer heat and smothered the vegetables. The cover crops and the few surviving vegetable crops in the cover crop plots were terminated by mowing followed by cultivation on July 18, 2022.
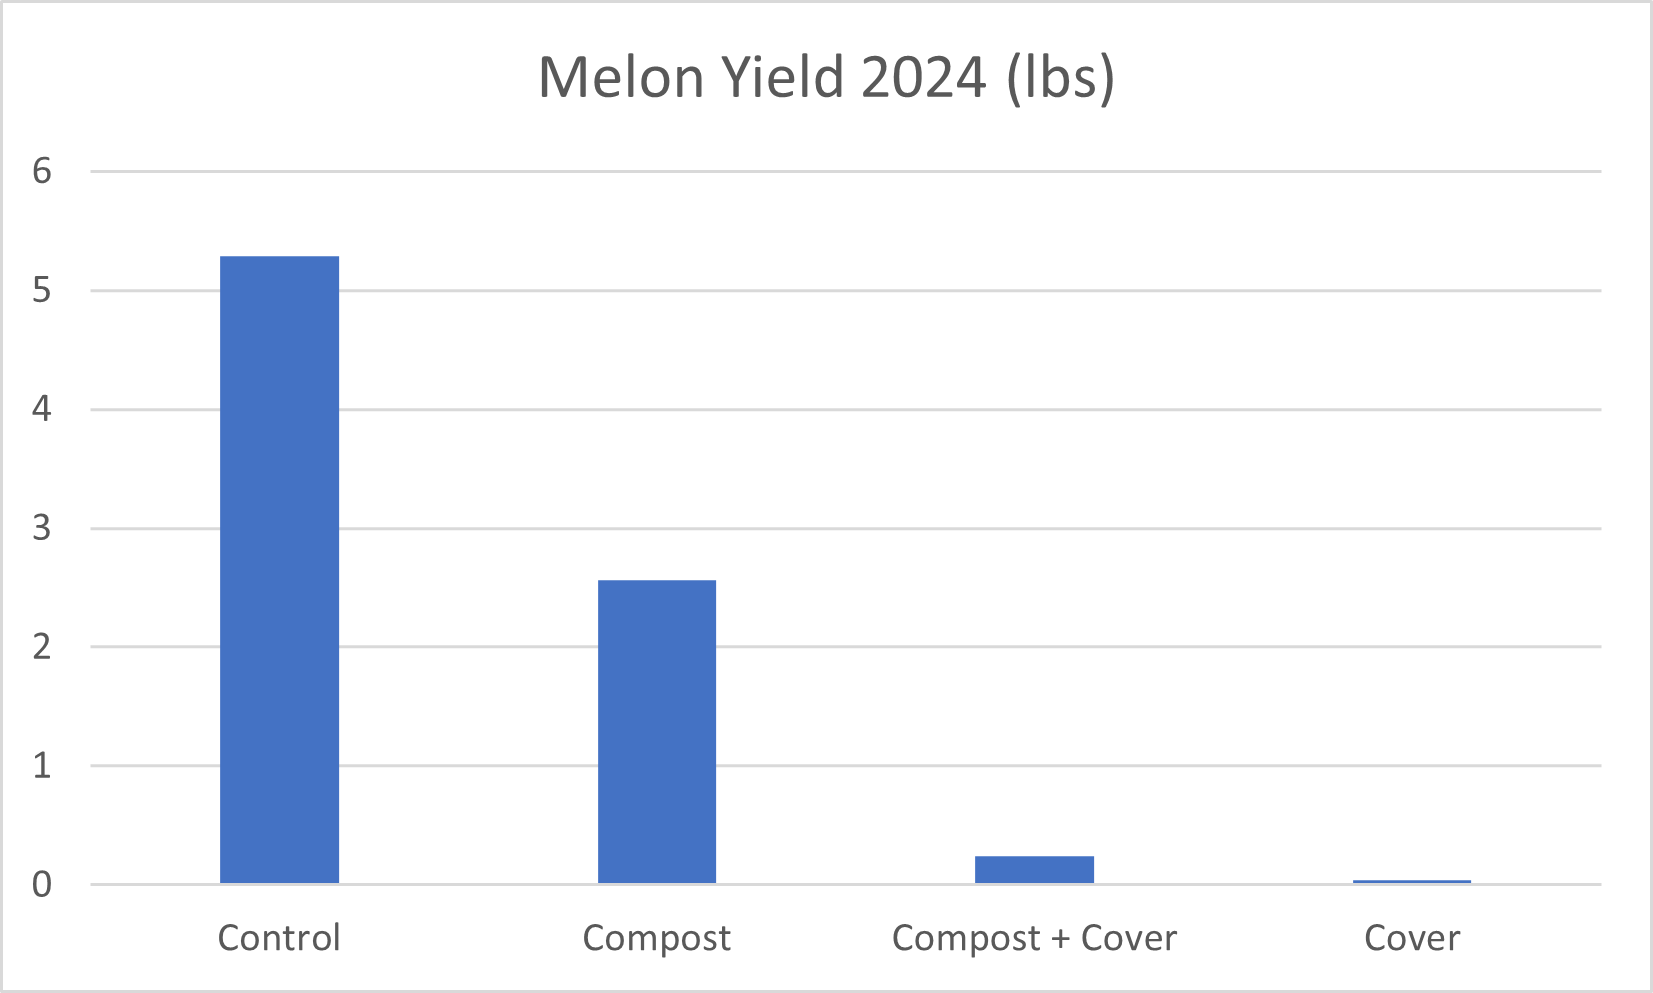
Figure 6. 2024 Melon Yield
For the melons, yield did not vary significantly by variety or between the control and compost treatments. Cover cropping significantly decreased melon yields (P = 0.043) compared to plots without cover crops. The addition of compost to cover cropped plots increased the yield in cover cropped plots over 400% (P = 0.037), but from a baseline of almost zero. The melon plants in all plots were slow to develop and mature through each growth phase, and all plots froze before reaching maturity despite being covered with plastic over hoops. Most cover crop plot melons were frost killed November 4, 2024, while the non cover crop plot melons persisted with mild-moderate damage until November 22, 2024.
The low yields, delayed maturation of the plants, and negative yield impacts in cover cropped plots may be indicative of general low fertility in the field, exacerbated by nutrient tie-up in cover cropped plots.
Slake test
In 2022, plots with a cover crop had 25% higher aggregate stability than plots without (X2 = 7.44, P = 0.006) but there was no effect of compost addition or interactive effect (P>0.10). In 2024 surface aggregate stability, plots with cover crops had 35% higher Herrick test rating than the control plots across both monitoring years. There was no effect of compost treatment on aggregate stability.
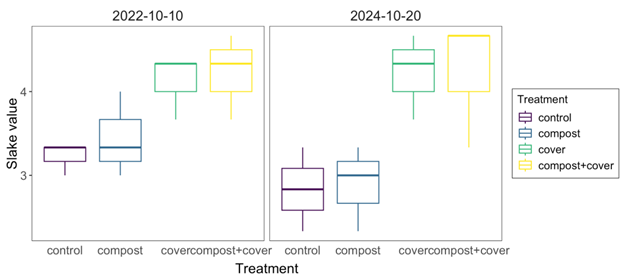
Figure 7. Slake test (median = thick line, interquartile distances = box, 95% range = whiskers) by compost and cover crop treatment combinations after one year (2022) and three years (2024) of treatment implementation.
Total microbial biomass (from PLFA)
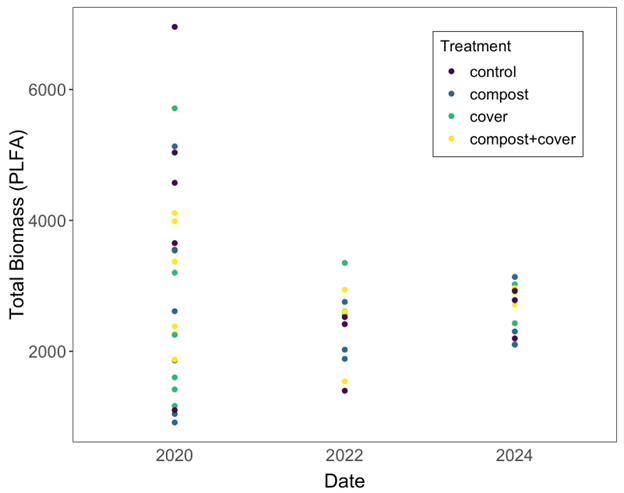
Figure 8. Total microbial biomass (measured with PLFA) by compost and cover crop treatment combinations (point colors) at baseline (2020), after one year (2022), and after three years (2024) of treatment implementation. There was no effect of any treatment on total microbial biomass.
The 2020 PLFA samples were taken when the research area was drylands, after a rainfall. In 2020, moisture levels and soil moisture depths across the research plots were highly variable due to low infiltration and ponding, perhaps contributing to the high variability in PLFA total biomass results. The transition from drylands to irrigation in 2022 may have contributed to the increasing uniformity of the PLFA total biomass results.
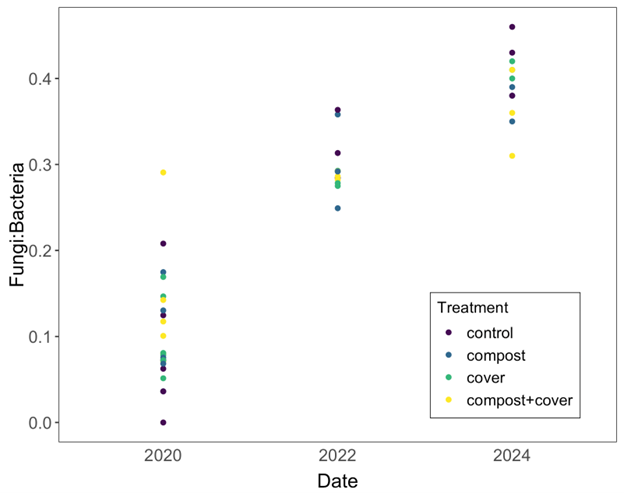
Figures 9. Fungal:bacterial ratio through time by treatment.
The fungal:bacterial ratio increased significantly each year that it was measured (no pairwise post-hoc 95% confidence intervals overlap), but there was no effect of compost or cover crop treatments.
Increases in the fungal:bacterial ratio may be attributable to agricultural cultivation and/or reduced tillage.
Haney Test Results
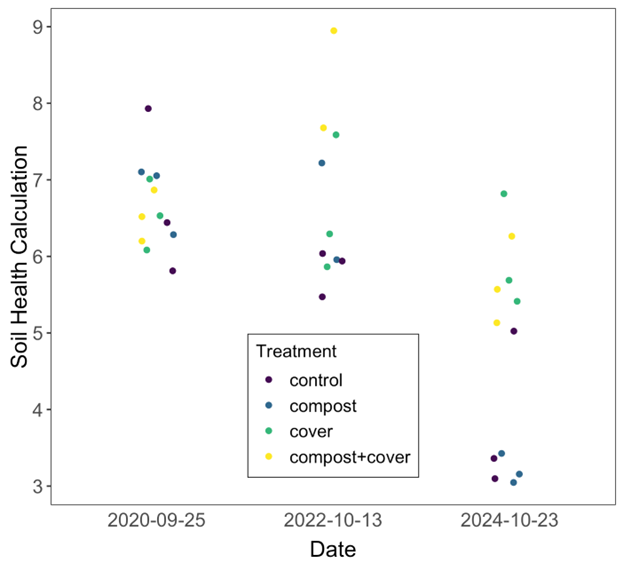
Figure 10. Haney Soil Health Calculation by compost and cover crop treatment combinations (point colors) at baseline (2020), after 1 year (2022), and 3 years (2024) of treatment implementation.
There was no difference in the Haney soil health calculation prior to treatment implementation in 2020 (overlapping post-hoc 95% confidence intervals), but in 2022 and 2024, cover cropping increased soil health by 14% and 65%, respectively, compared to controls.
pH
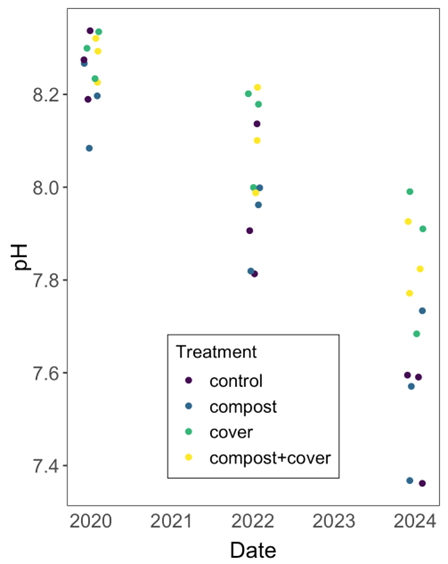
Figure 11. There was no difference in soil pH prior to treatment implementation in 2020 (overlapping post-hoc 95% confidence intervals); pH significantly decreased over time in all treatments.
In 2022 and 2024, pH in cover cropping treatments remained 2% and 4% higher, respectively, than the non cover cropped plots, with a P-value of less than 0.001.
Soil Nutrients
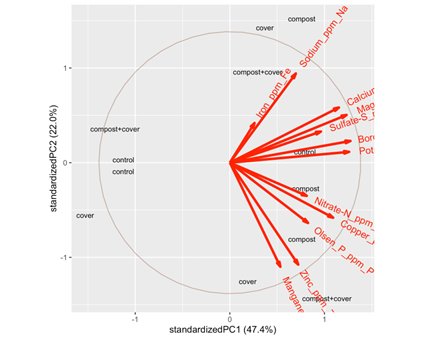
Figure 12. Soil Nutrient Analysis Ward S-5 2020. Principal components results of soil nutrient content in 2020 (baseline conditions). The amount of variance explained by each axis is in parentheses after each axis title. The circle shows 68% of the correlation size, and loadings of each nutrient are displayed from the centroid as red arrows. Plot centroids are displayed with text of the treatment combination.
In 2020, there were no differences in soil nutrients by treatment combination (as expected for baseline conditions).
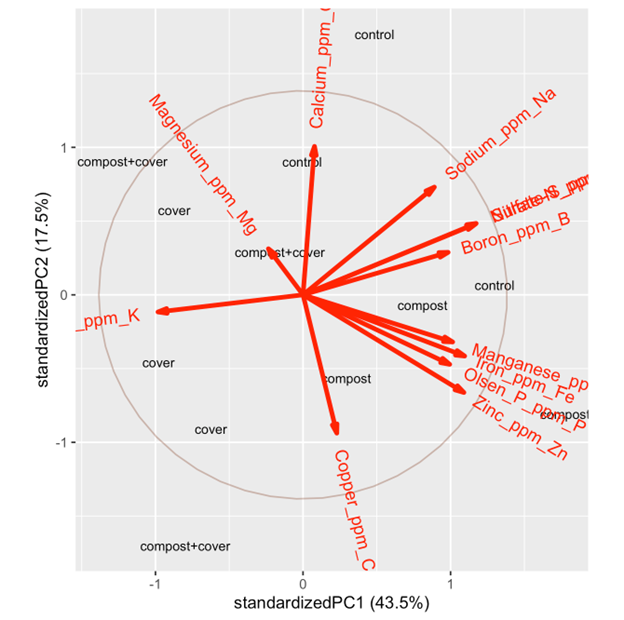
Figure 13. Soil Nutrient Analysis Ward S-5 2022. Principal components results of soil nutrient content in 2022 (after one year of treatments). The amount of variance explained by each axis is in parentheses after each axis title. The circle shows 68% of the correlation size and loadings of each nutrient are displayed from the centroid as red arrows. Plot centroids are displayed with text of the treatment combination.
In 2022, plots with cover crops tended to have more K and less Boron and sulfate (F = 21.8, P = 0.001) but there was no effect of compost or the interaction (all P-values > 0.05)
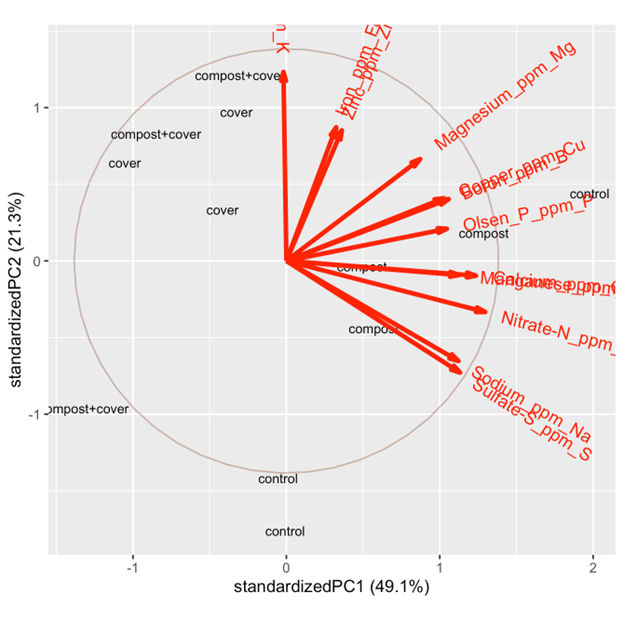
Figure 14. Soil Nutrient Analysis Ward S-5 2024. Principal components results of soil nutrient content in 2024 (after three years of treatments). The amount of variance explained by each axis is in parentheses after each axis title. The circle shows 68% of the correlation size, and loadings of each nutrient are displayed from the centroid as red arrows. Plot centroids are displayed with text of the treatment combination.
In 2024, plots with cover crops tended to have less P, Mg, Ca, and N (axis 1 F = 12.42, P = 0.008) but marginally nonsignificantly higher K (axis 2, F = 4.14, P-value = 0.076). There was no effect of compost or the interaction (all P-values > 0.05).
Soil CEC

Figure 15. Soil Cation exchange capacity by compost and cover crop treatment combinations (point colors) at baseline (2020), after one year (2022), and three years (2024) of treatment implementation.
Cation exchange capacity decreased significantly by year (P-value < 0.001). In 2024, there was a marginally nonsignificant difference of CEC by cover crop, and there were no other significant differences. The reduction by year in cation exchange capacity aligns as expected with reductions in the pH of the alkaline soils in the research plots.
Soil Organic Carbon
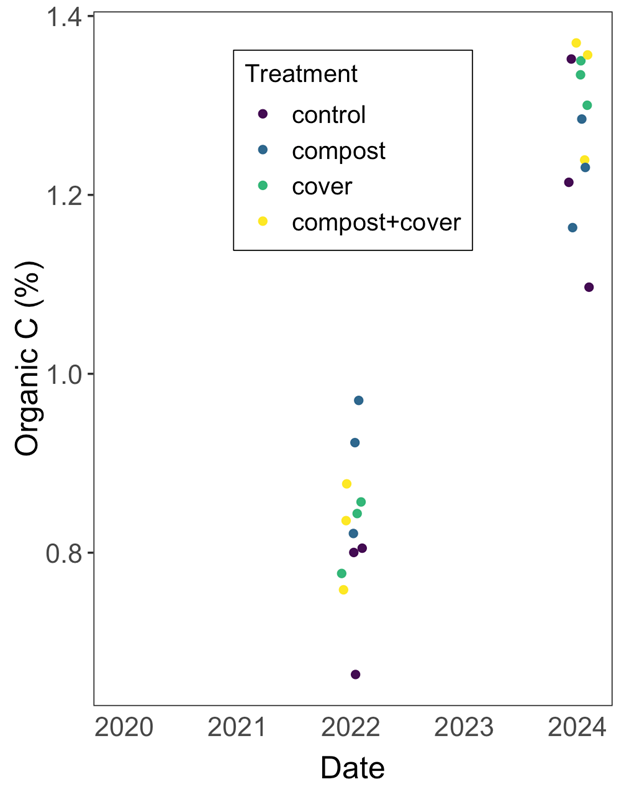
Figure 16. Soil organic carbon (%) by compost and cover crop treatment combinations (point colors) after 1 year (2022), and 3 years (2024) of treatment implementation. Soil organic carbon significantly increased over time (P-value < 0.001), but there was no significant difference by any treatment.
Similar to results noted in the PLFA biomass, F:B ratio, and infiltration the changes may be attributed to the transition from fallow drylands to agricultural cultivation and/or reduced tillage.
Aboveground Cover Crop Biomass

Figure 17. 2023 Aboveground Cover Crop Dry Weight Biomass
There was no significant difference in aboveground biomass by treatment in 2023 (P = 0.80).
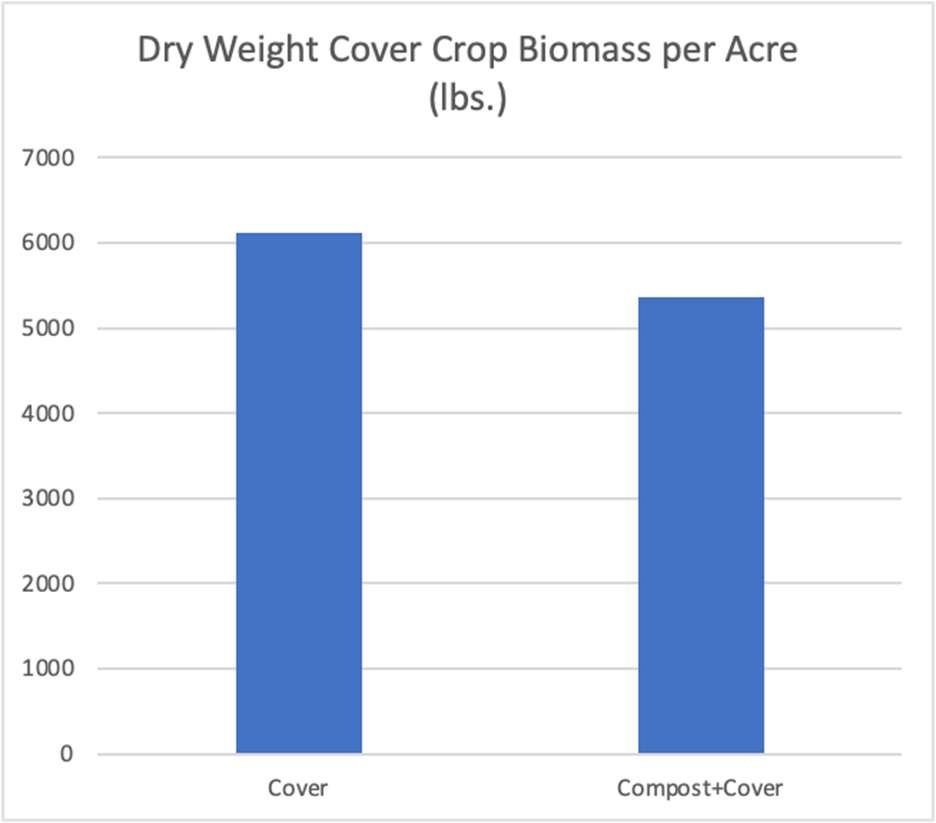
Figure 18. 2024 Aboveground Cover Crop Dry Weight Biomass
There was no significant difference in aboveground biomass by treatment in 2024.
Vegetable Leaf Nutrient Analysis
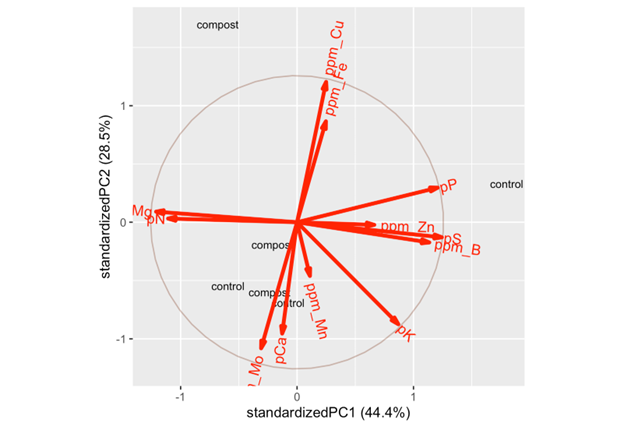
Figure 19. Principal components results of leaf nutrient content for pepper plants in 2022. The amount of variance explained by each axis is in parentheses after each axis title. The circle shows 68% of the correlation size and loadings of each nutrient are displayed from the centroid as red arrows. Plot centroids are displayed with text of the treatment.
No significant difference in leaf tissue for peppers was observed in compost plots vs. control plots in 2022 for either the axis that strongly negatively relates to N, Mg, and positively relates to P, Zn, S, and B (F = 1.02, P = 0.37), or the axis that is strongly strongly positively related to Cu and Fe and is negatively related to Mo (F = 0.60, P = 0.480).
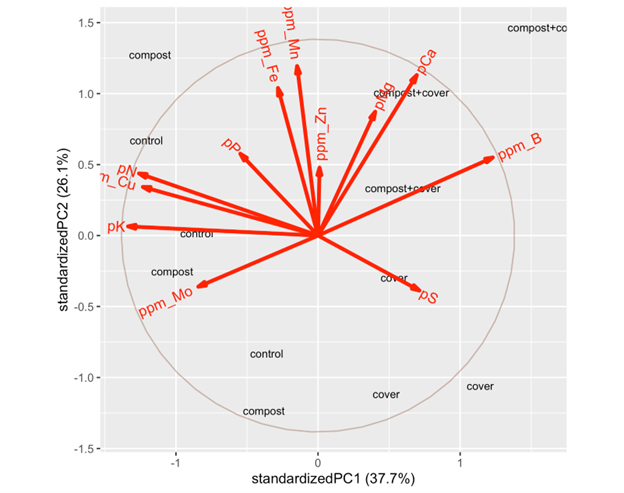
Figure 20. Principal components results of leaf nutrient content for pepper plants in 2022. The amount of variance explained by each axis is in parentheses after each axis title. The circle shows 68% of the correlation size and loadings of each nutrient are displayed from the centroid as red arrows. Plot centroids are displayed with text of the treatment.
There was a significant effect of cover cropping on decreasing leaf nutrients such as K, N, and Cu (F = 41.12, P = 0.00), but there was no effect of compost or the interaction (all P-values > 0.05). For nutrients such as Mn and Fe, there was a marginally nonsignificant interaction between compost and cover crops, where the combination of the two treatments tended to show enhanced nutrient content compared to either treatment alone (compost x cover crop F = 3.53, P = 0.097; compost F = 3.36, P = 0.104; cover crop F = 0.06, P = 0.814).
Irrigation Water Usage
Table 1. 2023 Irrigation Water Usage
| Cover Crop | No Cover Crop | |
| Total Gallons Used | 152,870 | 79,540 |
| Gallons Used by Vegetables | 101,597 | 79,540 |
In 2023, cover crop plots used an additional 92% more water than plots without cover crops.
Table 2. 2024 Irrigation Water Usage
| Cover Crop | No Cover Crop | |
| Total Gallons Used | 147236 | 78783 |
| Gallons Used by Vegetables | 78292 | 78783 |
In 2024, cover crop plots used an additional 87% more water than plots without cover crops.
Research outcomes
Research Outcomes
Cover crops and compost inoculations are not magic bullets in conditions that are well outside the ideal range for crops. During the current study, plant growth, survival, and yields were severely depressed as a result of record heat, extreme pest pressure, and low baseline soil fertility across all test plots and also across all areas in standard farm production.
At the level of statistical significance, under the conditions of this research study, cover crops did improve multiple metrics of soil health--including aggregate stability, Haney soil health scores, and infiltration rates (in 2024)—but increased water usage by 87-92%, decreased vegetable yields, and decreased vegetable leaf nutrients including K, N, and Cu. Compost inoculant applications under the research conditions did not produce meaningful results, with the exception of a small absolute value but high percentage value amelioration of the negative observed impacts of cover crops on the 2024 melon yield.
Under conditions similar to those in this research trial, the benefits of cover cropping and inoculation are not likely to outweigh the costs.
For farmers interested in cover cropping and compost inoculations (ideally under more favorable conditions), this research also identified several potential problems to avoid and opportunities for improvement. One major problem was incompatibility between the planting and harvest/termination timelines for the selected vegetable crops and cover crops. The selected vegetable crops sometimes continued yielding into early/mid-November, pushing the planting date for cover crops back to mid- to late November. The cold temperatures coinciding with this late cover crop planting date strongly favor the survival of cereal grasses over legumes and forbs, increasing the final C:N ratio of the cover crop at crimping and limiting nutrient release for the following cash crop. The late cover crop planting date also contributed to a later termination date for the cover crops, shifting cash crop planting into unfavorably hot conditions. For systems integrating cover crops with cash crops, the cropping cycles must be modified to include compatible vegetable planting and harvest seasons to facilitate timely establishment of cover crops and increase the establishment of more species in mixes.
Irrigation for cover crops could also be more efficiently managed by using deficit irrigation to maintain cover and biology rather than to maximize cover crop biomass, which was not observed to effectively suppress weeds.
The application of N-banded poultry meal, replicating strip-till applications, could also have adversely affected the establishment of biology in this research. N in close proximity to seeds during germination tends to suppress recruitment of microbes in a manner that persists through the growing season. N-banded fertilizers should be more separated (in space or time) from planted seeds than the physical and temporal differences used in this study.
Future Research
The current results are from conditions under which growth, survival, and yields were severely depressed for all investigated plant types across all treatment plots and also across all areas in standard farm production. Since different conditions may produce different results, research on cover cropping and compost inoculations should be repeated under conditions that are more favorable for plant growth, or with plant varieties that are better suited for severe conditions.
Future research might also increase the number of replicates to meaningfully determine changes to additional factors. We detected changes to some factors with just three replicates, and additional replicates could yield additional meaningful results.
In consideration of nitrogen’s tendency to suppress the recruitment of microbes when it is applied in close proximity to seeds, research on the application of N during the growing season could help identify a schedule for N applications that avoids in-season suppression of the rhizophagy cycle.
Education and Outreach
Participation summary:
We established three educational objectives for this project:
- Publish the final experimental results in a peer-reviewed journal within one year of the experiment's completion;
- Train producers and agriculture students in field measurements and testing and share preliminary results through field days at Pata Viva Farm, coinciding with each field data collection scheduled; and
- Inform producers, agricultural scientists, and other stakeholders of preliminary results through digital publications and at least one presentation annually over the project period.
We anticipate that the first objective will be accomplished on schedule, and we have successfully carried out objectives two and three.
In the first three years of the project, objectives two and three were accomplished through field days at Pata Viva on October 9, 2022; October 28, 2023; and October 19, 2024, as well as by soil and plant tissue sampling on October 10, 2022. Thirty participants attended the field days, and in post-event surveys, 100% of attendees reported that the workshop increased their knowledge of sustainable agriculture. In optional comments, participants elaborated on these impacts. Responses included special appreciation for “the chance to do some hands on field testing. Its [sic] really easy for people to explain something, but allowing us to actually get on the farm and try some things was really wonderful.” In another response, another participant reported, “I learned a lot of interesting details about making Johnson-Su compost that I didn’t know before. I also learned about diversity in cover cropping and why that’s important.”
Objective three was also advanced on May 18, 2022, when Bryce and Shelly Richard presented at Quivira Coalition’s soil health workshop in Columbus, NM hosted by James Johnson of Carzalia Valley Produce. Bryce discussed the WSARE research project objectives to 25 attendees including farmers, the general public, and staff from NRCS, SWCD, NMACD, and NMSU.
Outreach, advertising & promotion for the field days was conducted by the Seeding Regenerative Agriculture Project, Quivira Coalition, Cruces Creatives, and New Mexico Healthy Soils through organization websites, email list-servs, and social media.
Success Stories and Participants
Four participants at the 2022 Pata Viva Farm field day–a group of nonprofit administrators, conservationists, and researchers–applied the knowledge they gained through the field day to a composting project in Silver City, New Mexico—the New Earth Project--which is using Johnson-Su composting bioreactors to make compost from school food waste and slash from the Gila National Forest.
Education and Outreach Outcomes
In surveys on the impacts of our education and outreach activities, participants expressed special appreciation for “the chance to do some hands on field testing." They also elaborated, "Its really easy for people to explain something, but allowing us to actually get on the farm and try some things was really wonderful.”
Responses such as these, combined with the data point that 100% of survey respondents reported learning more about sustainable agriculture through the field day, strongly suggest that hands-on learning and knowledge sharing is an effective approach for sharing information.
Cover crop diversity
Principles of Johnson-Su composting
Soil testing procedures