Final report for FW22-406
Project Information
After 3 years of soil testing, team building and information sharing in years 1-3 (2019-2021) of our 10-year-long project, the CSSHP and our 50 participating growers previously showed that lower pH, more water availability, better soil texture, more organic matter inputs, decreased tillage intensity, and more days of living cover resulted in better soil health. We also identified 4 roadblocks to increased adaptation of soil health practices, which were:
1) Only half of participating growers understood their test results and which actions were indicated.
2) 53% of growers wanted more individualized consults with soil health experts.
3) Although our entire data set identified broad soil health group trends, individual grower’s data was erratic, without clear trend lines for most growers.
4) Despite small gains in fellowship, schisms between organic and conventional growers remained, with the County’s under-review GMO ban threatening fellowship gains again.
To address these roadblocks, in 2022-2024 (years 4-6 of the project), the CSSHP committed to adding management recommendations, referrals to local soil health experts and cost-sharing referrals to our test-reporting program. We plumbed our data to identify sources of variability and added grower’s qualitative observations to supplement soil-test data. We expanded our team-building efforts to include a website, small-group problem solving exercises, and promotion of participating growers as subject matter experts. We continued to monitor our growers’ practices, attitudes and understanding to ascertain whether these actions led to an increased adoption of soil health practices, more fellowship, more information sharing, and the emergence of local soil health leaders among our participating growers.
The Citizen Science Soil Health Project, Years 4-6, addressed 3 questions: 1) Could simpler explanations of soil test results and referral to cost-share resources increase adoption of soil health practices? 2) Could increased fellowship and information sharing among growers expand local soil health successes while developing local soil health leaders? 3) Would obtaining additional soil health data reduce individual grower’s data variability and reveal individual grower’s trends? We found that the answer to all 3 questions was "Yes!"
Objectives: Participating growers would develop greater confidence and knowledge about soil health testing and results, as well as different strategies to improve their operation’s soil health. Through program participation, they would receive resources and tools through local partners in understanding and interpreting their test results, as well as resources for potential funding sources to incorporate soil health systems. Throughout this process, peers would recognize several participating growers as subject-matter experts or soil health leaders in their field.
Cooperators
- (Researcher)
- - Producer
- - Technical Advisor
- - Technical Advisor
- - Technical Advisor
Research
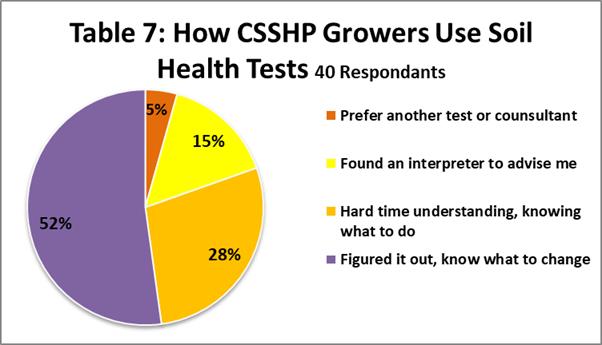
According to our 2021 poll of CSSHP growers, only about half (23) of them fully understood their soil testing results and used this information to drive management decisions (Table 7). The remaining CSSHP growers preferred a different test, found an outside advisor to assist them in management decisions, or were challenged to understand their test results
In 2021, we saw greater understanding of the confidential individualized year-end reports that we sent to all growers (Table 8). Our year-end reports showed growers how they compared with their peers on 10 important Haney and PLFA soil health indicators (soil organic matter, soil respiration, organic nitrogen, organic carbon, carbon-nitrogen ratio, pH, available N, available P, available K, total microbial biomass and Fungi : Bacteria ratio), as well as three management practices (days of living cover, organic matter inputs and tillage intensity). Growers were divided into two peer groups for comparison: the Tilled Fields Group and the Zero Tillage Group. The Year-End reports contained more graphics and fewer categories to decipher than soil test results.
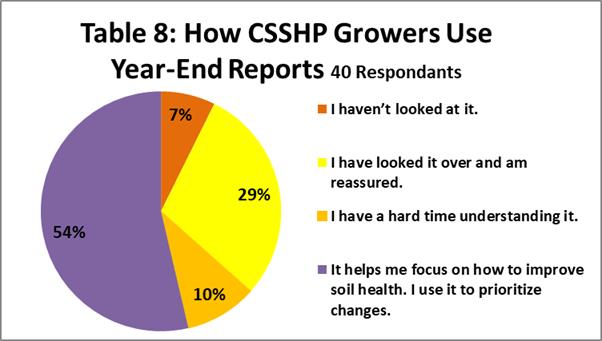 It was designed so that a grower could easily see if they fell into the top, middle or bottom of the pack (See attached PDF, “Example Individualized Progress Report”). This explained why more growers understood the year-end reports in 2021 than their test results
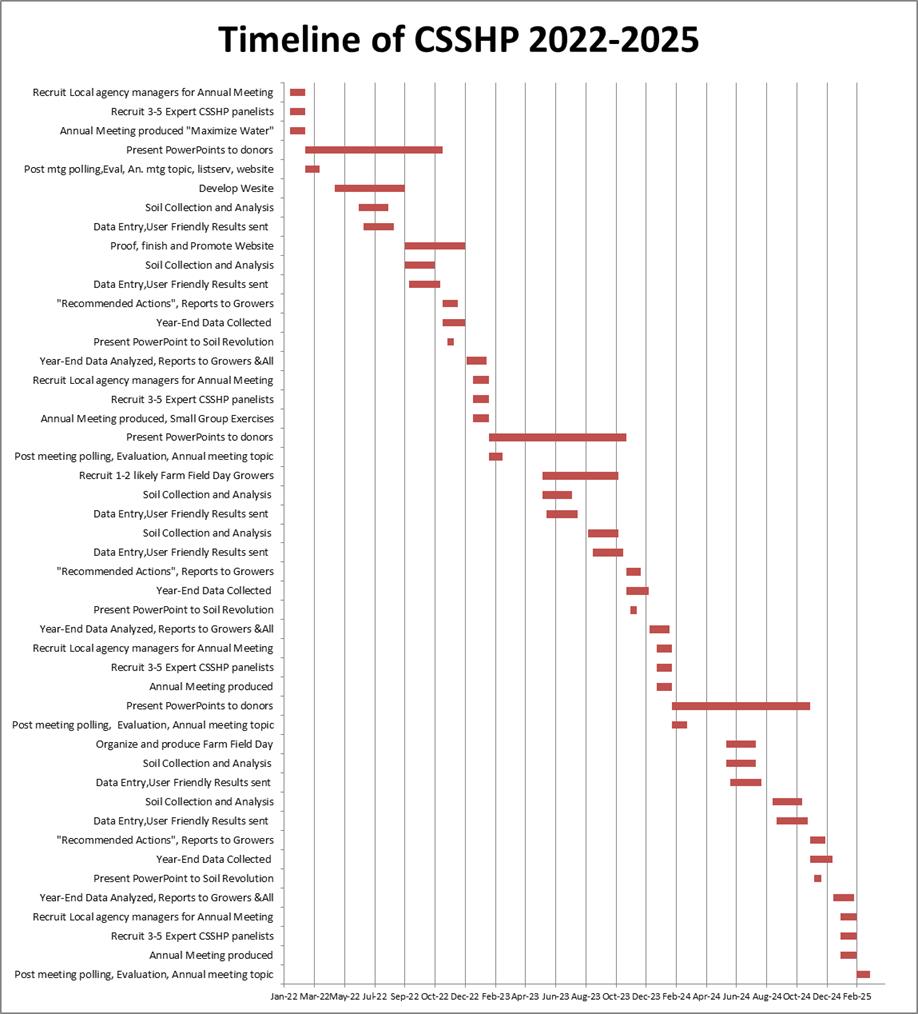
Given the feedback from our growers in Tables 7 and 8, it was clear that simply providing soil test results was not enough. We needed to expand our project to include annual individualized management advice based on testing results. Our previous objectives for the first 3 years of the project were still valid, but our approach to them needed to shift and expand, given feedback from our growers and our data variability problems. See Table 9 for our 2022 to 2024 goals, objectives and planned actions.
For Objective #1, Increase CSSHP growers' knowledge about soil health and use of soil health tests, we would provide growers with 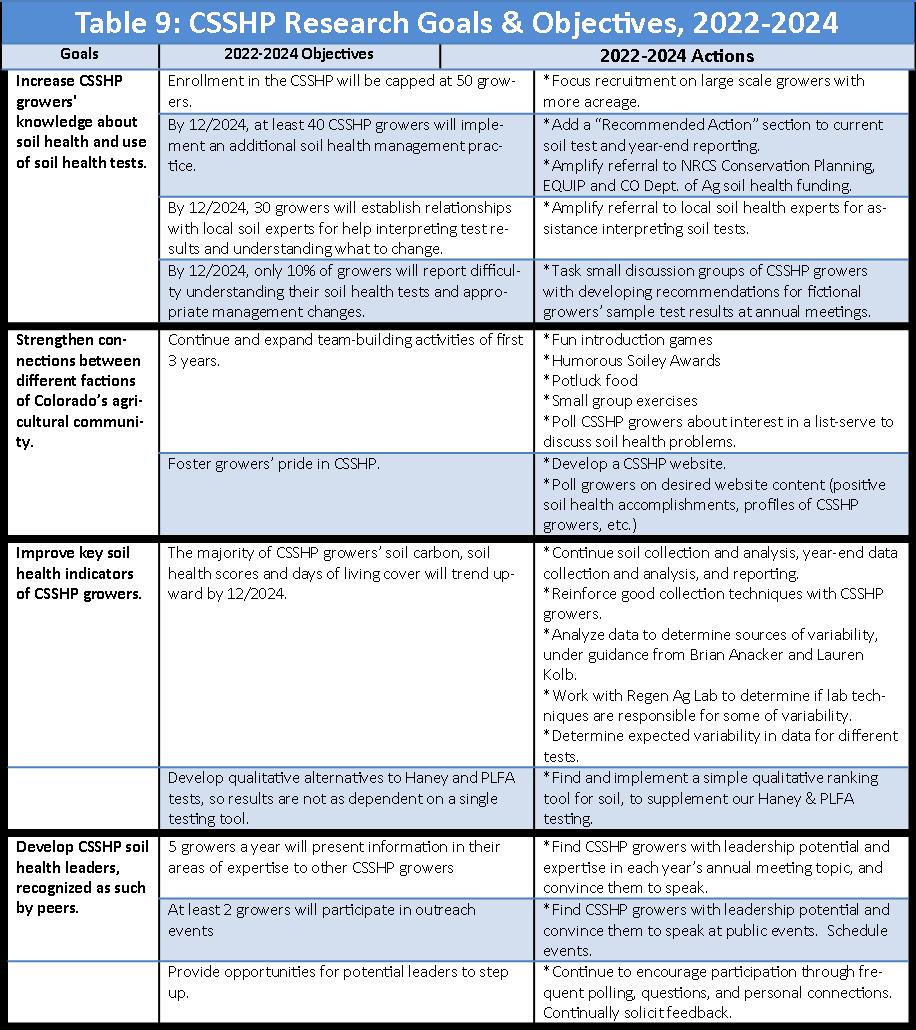 concrete management suggestions, based on their soil testing results, in addition to their regular test results and year-end reports. Our current 6-page “User-Friendly” soil testing results form was clearly too intimidating for many CSSHP growers. We proposed that our local Soil Conservation District Manager and City of Boulder Open Space and Mountain Parks Senior Agricultural Program Manager would provide each CSSHP grower 1-3 individualized management recommendations, based on their free soil tests. We also planned to provide consistent referrals to Soil Conservation District staff for assistance with soil test interpretation, referrals to NRCS conservation planning for EQIP funding, plus practice deciphering soil health test results at annual meetings, so that more CSSHP growers would understand their test results and initiate appropriate actions.
For Objective #2, Strengthen connections between different factions of Colorado’s agricultural community, we committed to build on activities initiated in 2019-2021, the first 3 years of our project. We continued to use humor and fun (speed-dating exercises, Soiley Awards), to introduce folks to each other and break down barriers. We polled growers about their interest in a soil health listserv forum. We felt that by 2021 we had enough goodwill, trust and group data to call for a project website. We polled our growers on what our website should include, and built it according to their feedback.
For Objective #3, Improve key soil health indicators of CSSHP growers, with assistance from Brian Anacker, Chief Science Advisor for Boulder Open Space and Mountain Parks and Lance Gunderson, director of Regen Ag Lab, we continued to collect data, and analyzed our existing data, to determine the cause of the variability in our soil health testing results. Once we determined the cause, we could correct it. However, it was clear that we needed a second soil assessment tool, so that we were not totally dependent on lab tests. We built and implemented a simple qualitative soil ranking tool for our growers, to supplement our Haney & PLFA testing. We also re-emphasized proper collection techniques to try to eliminate that possible cause of our variability.
For Objective # 4, Develop CSSHP soil health leaders, recognized as such by peers, we continued to ask various CSSHP growers to give presentations in their areas of expertise to the whole group and at outreach events. This allowed CSSHP growers to assess each other’s knowledge and leadership abilities. By encouraging participation and open discussion, we expected that a few leaders would rise to the top.
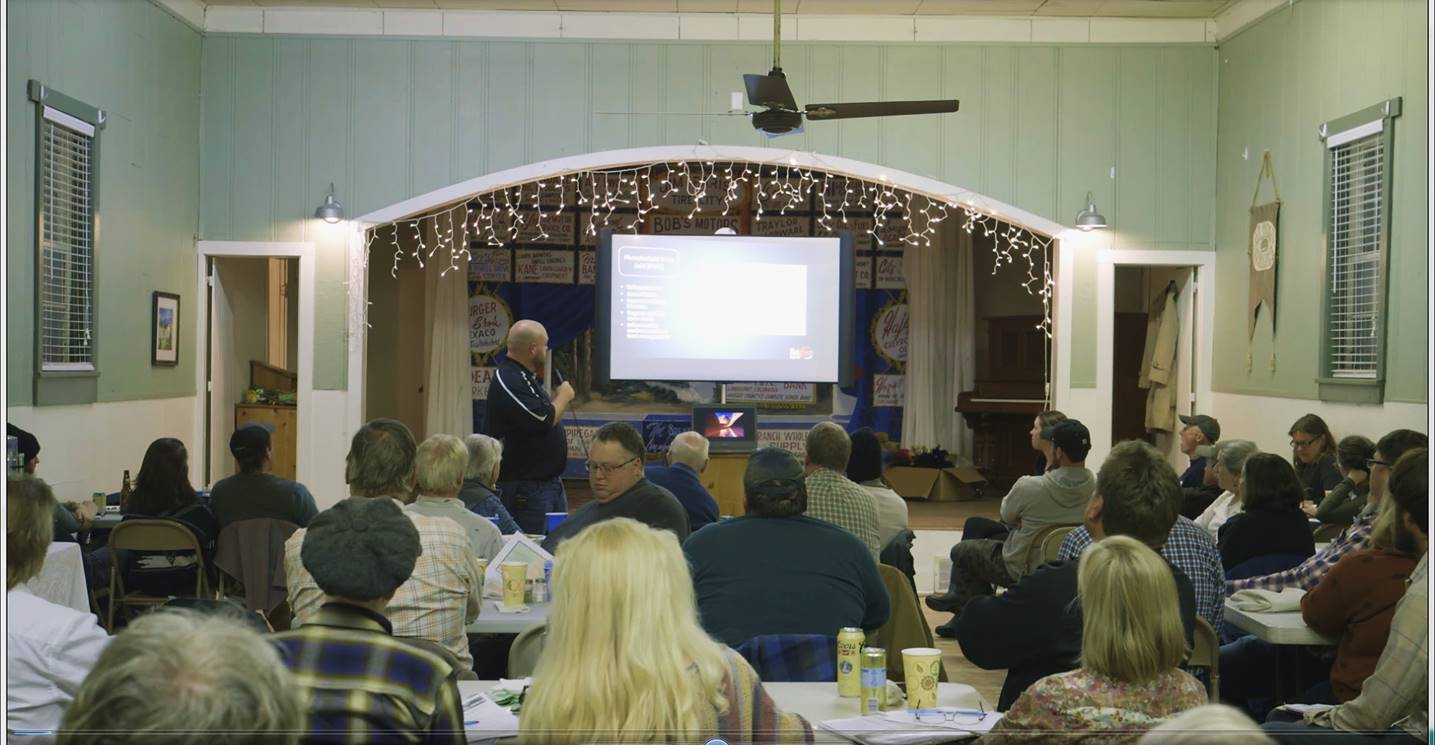
In the 21st century, we expect organizations and sectors to be nimble, able to change as quickly as the world around us. We expect them to rapidly adapt to new technologies, to turn on a dime like a drone. But agriculture is NOT like a nimble drone, flitting to and fro. Rather, it is like a huge super tanker, taking an exceedingly long time to turn. In agriculture, there is usually only one shot per year to try something new, and many reasons why that one shot might or might not work in that year, which then requires more years of testing, tweaking, and retesting. That is why the CSSHP is a 10 year long project. It is also why it took us six years to figure out whether providing annual soil health testing, education and team-building leads to broader adoption of practices that improve soil health.
For Objective #1, Increase CSSHP growers' knowledge about soil health and use of soil health tests, in 2021, 51% of our growers said that they would like to receive a list of recommended actions to consider, in conjunction with their soil health lab reports. However, we were not able to provide growers with concrete management suggestions, based on their soil testing results. When we ran this idea by local conservation district staff and other Ag professionals, they said that they were already overtaxed with their current workload and they could not take on any additional work. They also expressed reservations regarding the wisdom of making recommendations without a site visit to really understand the issues on a site, and without developing a more formal conservation plan for the site. We were able to provide consistent referrals to Soil Conservation District and Regen Ag Lab staff for assistance with soil test interpretation. Over the next 4 years of the CSSHP, we will continue to try to find ways to address this need that our growers have expressed while working within the limitations of local resources.
To make up for our inability to provide growers with concrete management suggestions, at our annual meeting in 2023, we included small-group break-out sessions to practice interpreting soil health tests and to gain a better understanding of what the lab results mean. Growers divided into 3 groups (Pastures, Veggies and Commodities) and each discussed 2 different sample lab tests with local Ag professionals leading each group.
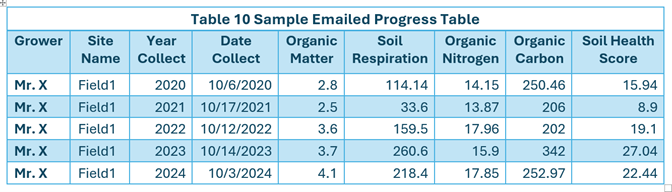
We also added a new analytic tool to our soil test reporting in 2023 and 2024 to help our growers better understand their testing results. When we emailed a grower their soil testing lab results, we included a table showing their results on 5 soil health indicators over all their previous years in the project. This allowed the grower to easily see what if any progress they had been making. (Table 10).
Another initiative we instituted to increase adoption of soil health practices was to increase the frequency of our CSSHP NEWS emails, which included information on soil health grants and their deadlines (See Table 11 for list of grants we publicized).
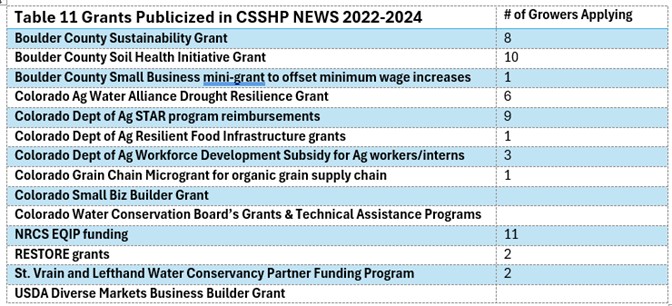
In our 2025 survey of CSSHP growers, about half of respondents reported applying for one or more soil health grants or reimbursement programs over the last 6 years, and all but one received some funding. Altogether, 17 growers reported that they applied for a total of 59 grants, ranging from 1-7 grant applications per grower. An additional quarter of CSSHP growers have not yet applied for a grant but are thinking about it. The final quarter of growers are not interested, or their operations are too small or not qualified for grant funding. ( Figure 12)

For Objective #2, Strengthen connections between different factions of Colorado’s agricultural community, we built on CSSHP activities of 2021-2024. We continued to use humor, light-hearted introduction games (“Your name and your weirdest compost experience”), Soiley Awards, and sharing meals to introduce folks to each other and break down barriers. Our growers were not interested in a soil health listserv forum, so we did not pursue that. In 2022, we built, published and publicized our new website, SoilHealthProject.org, which includes our goals, processes, supporters, grower profiles, findings, articles, forms, and links to our 17 CSSHP videos on our You-Tube channel.
However, our most successful strategy happened by accident. At our annual meetings, we had been setting up the tables in north-to-south rows in the room, with attendees seated on the west side of the tables, facing the speaker to the east, the front of the room. Attendees could only easily speak to the person seated to their left or right. In 2024 and 2025, we set up the tables in east-to-west rows, with attendees seated on both the north and south sides of the narrow tables, facing each other. They had to turn their chairs to see the speaker at the front of the room on the east side. Attendees could now easily speak to multiple people on each side and across their table. As a result, there was a lot more conversation in the room. Noise levels have been steadily increasing at our annual meetings, which we take as a very good sign.
For Objective #3, Improve key soil health indicators of CSSHP growers, we continued to collect data, and analyze our existing data, to determine the cause of the variability in our soil health testing results. Please see the Research section and narrative on our findings from 2022-2024.
By the end of 2024, the 6th year of our project, we had collected and run soil tests on 985 soil samples from a total of 368 different sites. Some sites only had 1-2 years-worth of data, but we also had 77 sites with 5-6 years-worth of soil testing data. In addition to the Haney and PLFA soil testing data from Regen Ag Labs, we also had management data from our growers on all 368 sites, including supplemental water availability, grazing information, soil disturbance activities, unusual weather, organic matter inputs, days of living cover,crops and cover crops grown, tillage intensity, days of cover crops, and fertilizer inputs.
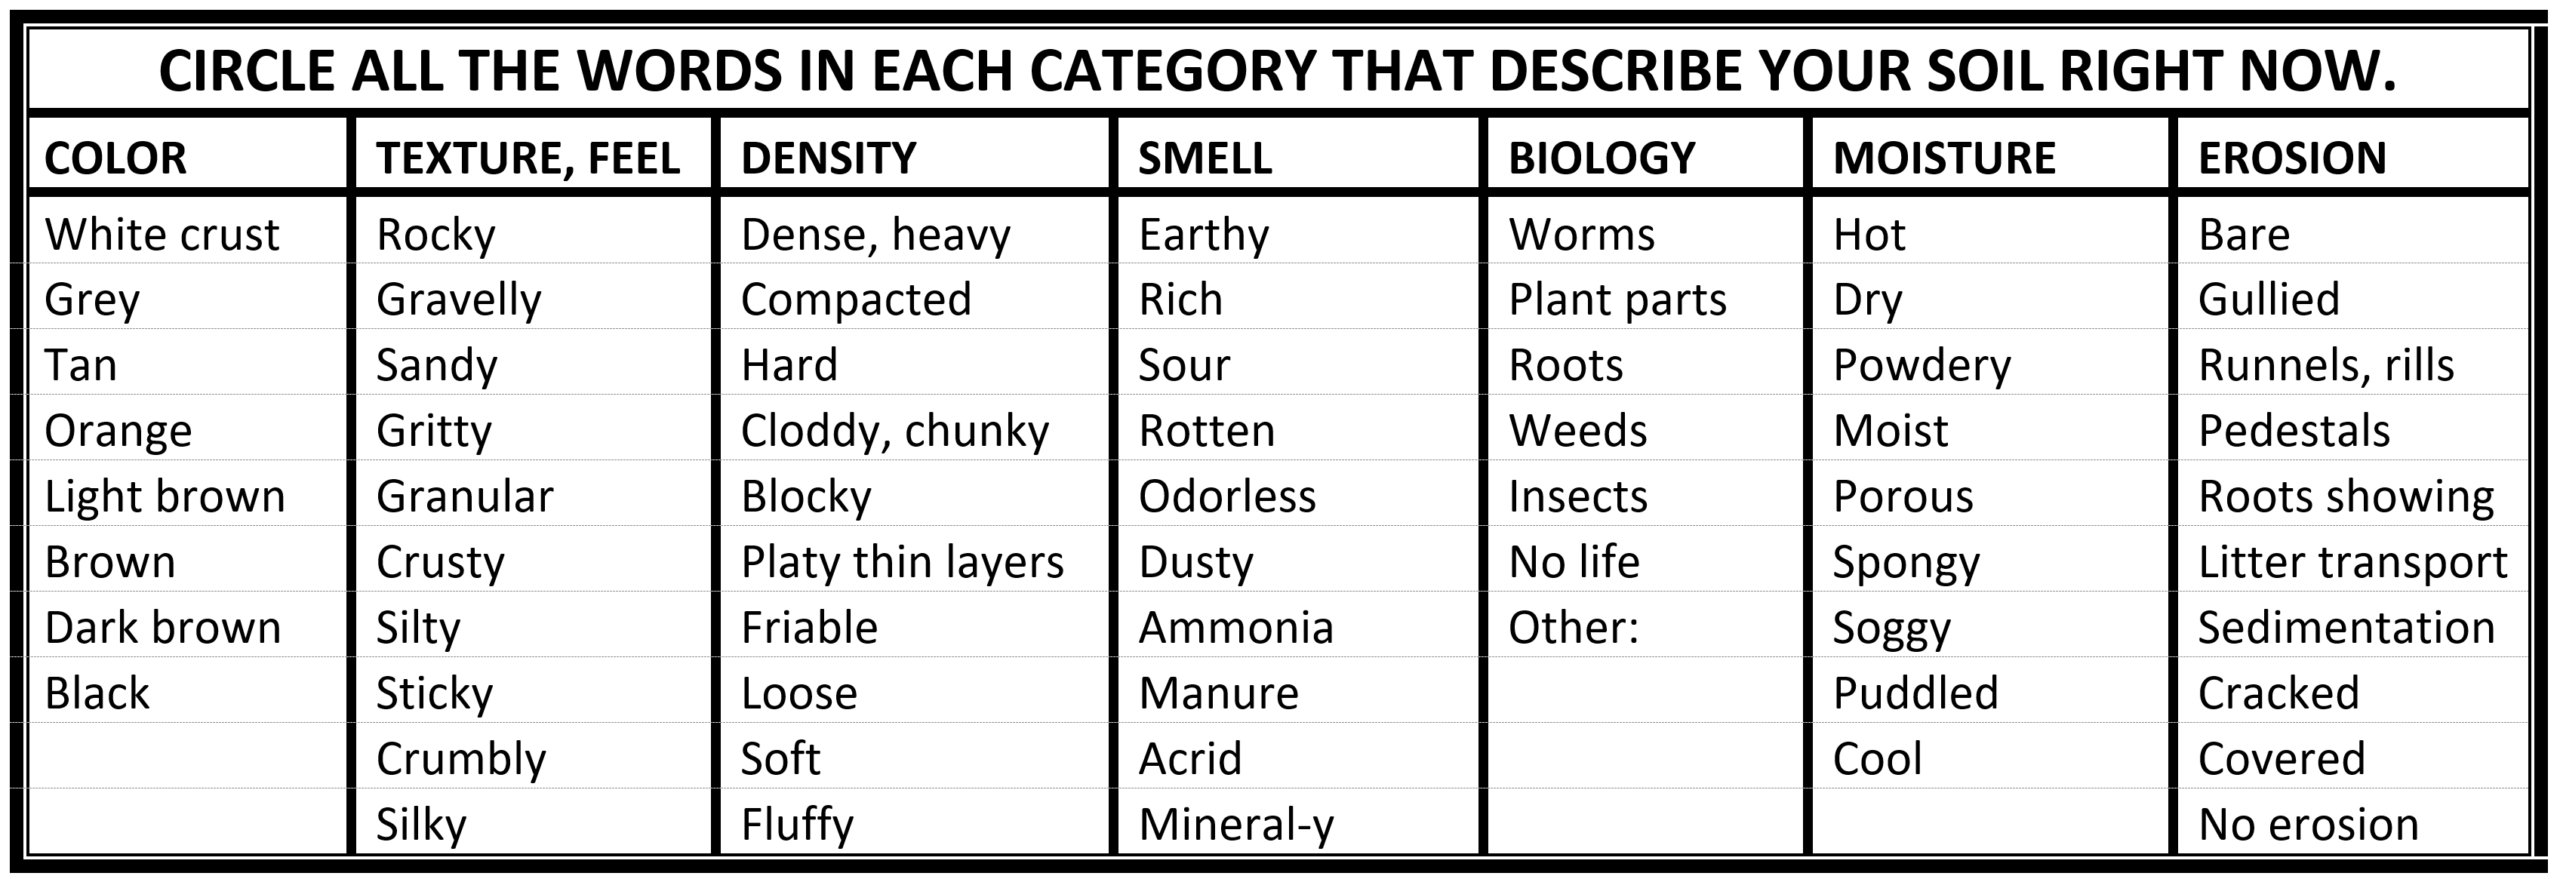
With help from our advisors, we also created a simple subjective soil assessment tool which our growers filled out when they collected their soil samples. (Table 12B Subjective Soil Assessment Tool) However, this tool proved to be less successful than we had hoped. For instance, using this tool, almost all growers said that they had no signs of erosion. The few growers who documented signs of erosion generally were the super-conscientious participants with the best soil and best soil health practices.
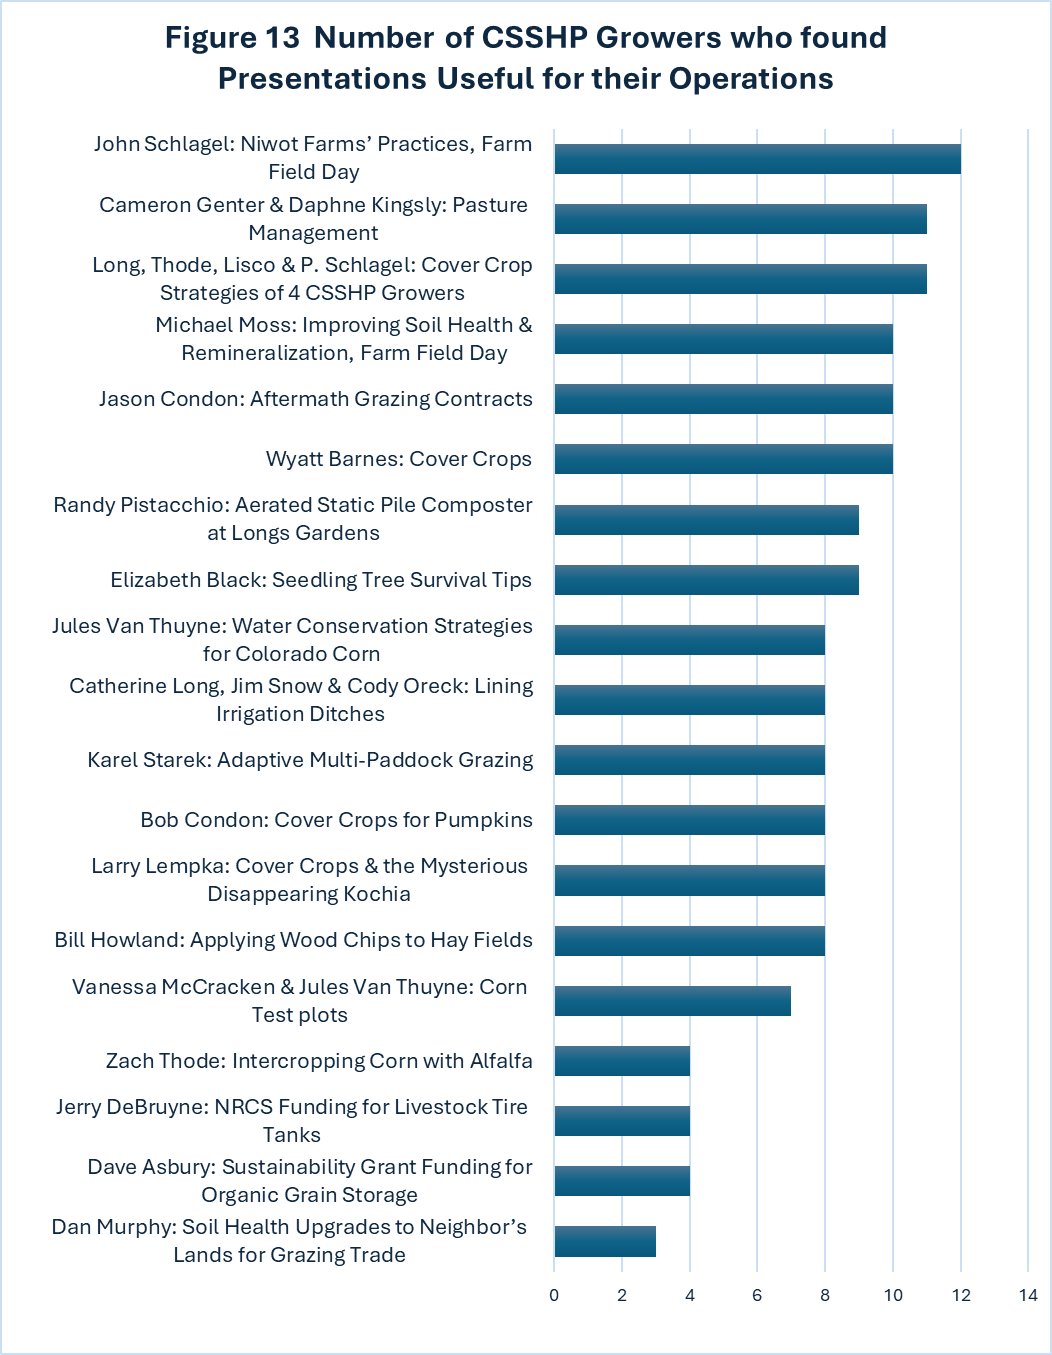
For Objective # 4, Develop CSSHP Soil Health Leaders, recognized as such by peers, we continued to ask various CSSHP growers to give presentations in their areas of expertise to the whole group and at outreach events. Over the last 6 years of the project, 22 CSSHP growers have made a total of 20 presentations and videos at CSSHP events. 16 of these presentations took place in 2022-2024. CSSHP growers told us which videos and presentations had been useful for their operations (Figure 13).
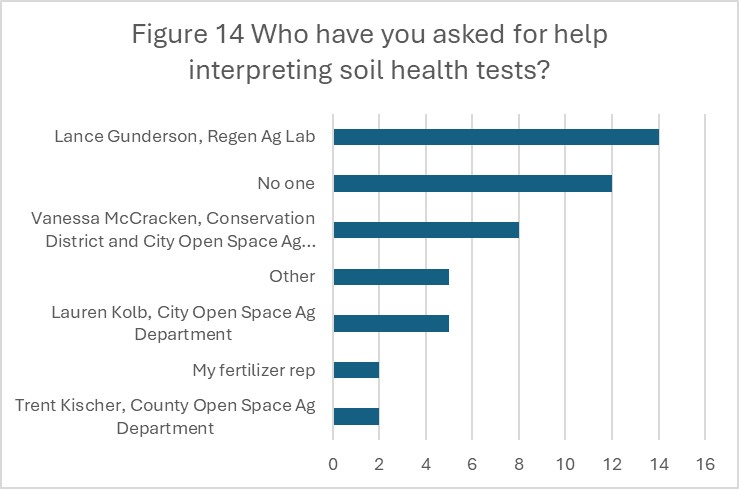
In our 2025 survey, only 28% of CSSHP survey respondents reported reaching out to fellow CSSHP growers for advice or information on soil health. However, 80% of respondents were able to identify one or more CSSHP grower or local expert whom they would go to for soil health advice in the future. 66% of respondents had asked a soil health expert for advice on interpreting their test results, a few asking several people. (Figure 14)
Please see Education sections for further information.
RESEARCH FINDINGS
#1 PROGRESS
#1A: CSSHP GROWERS HAVE INCREASED THEIR SOIL HEALTH PRACTICES.
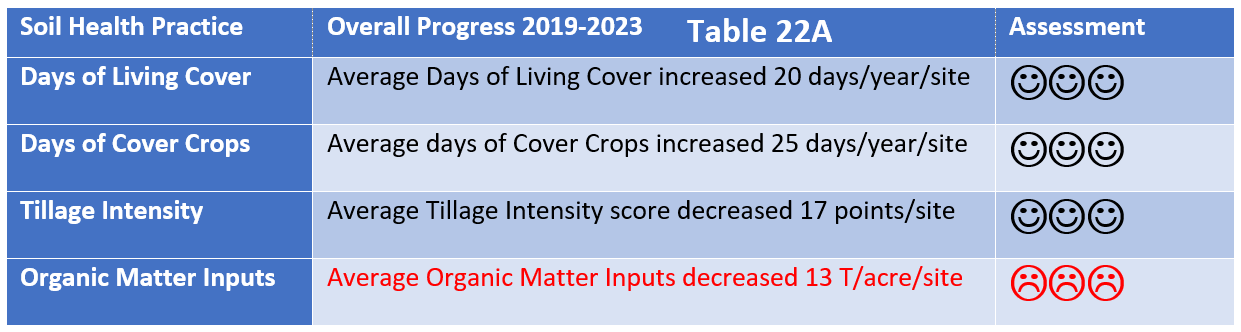
At the end of 2023, we had 5 years of data on the 51 sites which had been in the project since 2019, with data on both their management practices as well as their soil testing results. Figure 15 shows that the average Days of Living Cover of these 51 sites increased by 20 days since 2019.
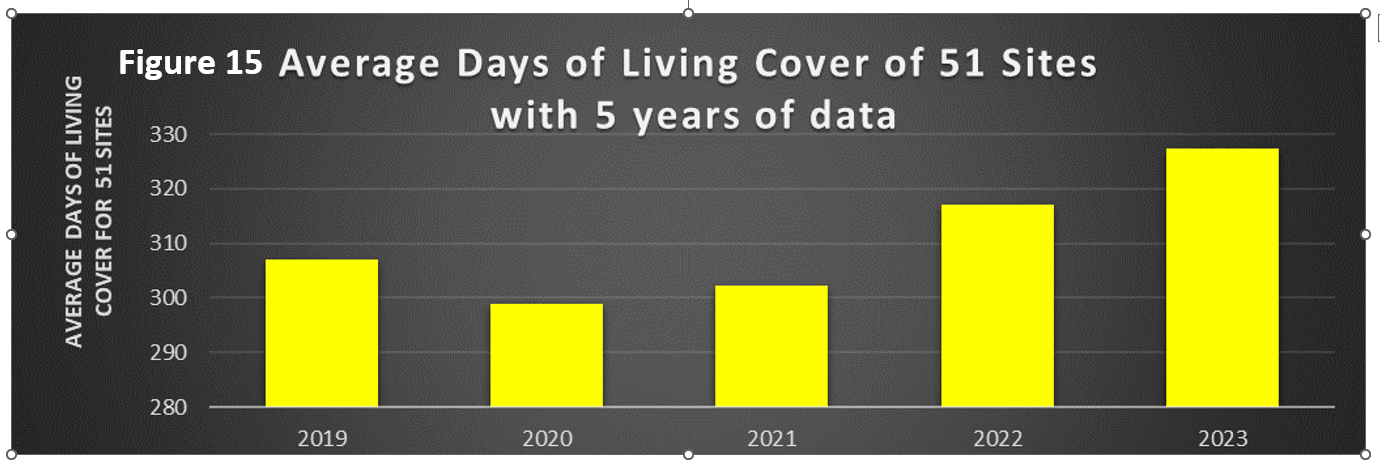
Our growers increased their Days of Living Cover by increasing their use of cover crops, converting annual crops to perennial systems, and incorporating more fall-planted small grains into their rotations.
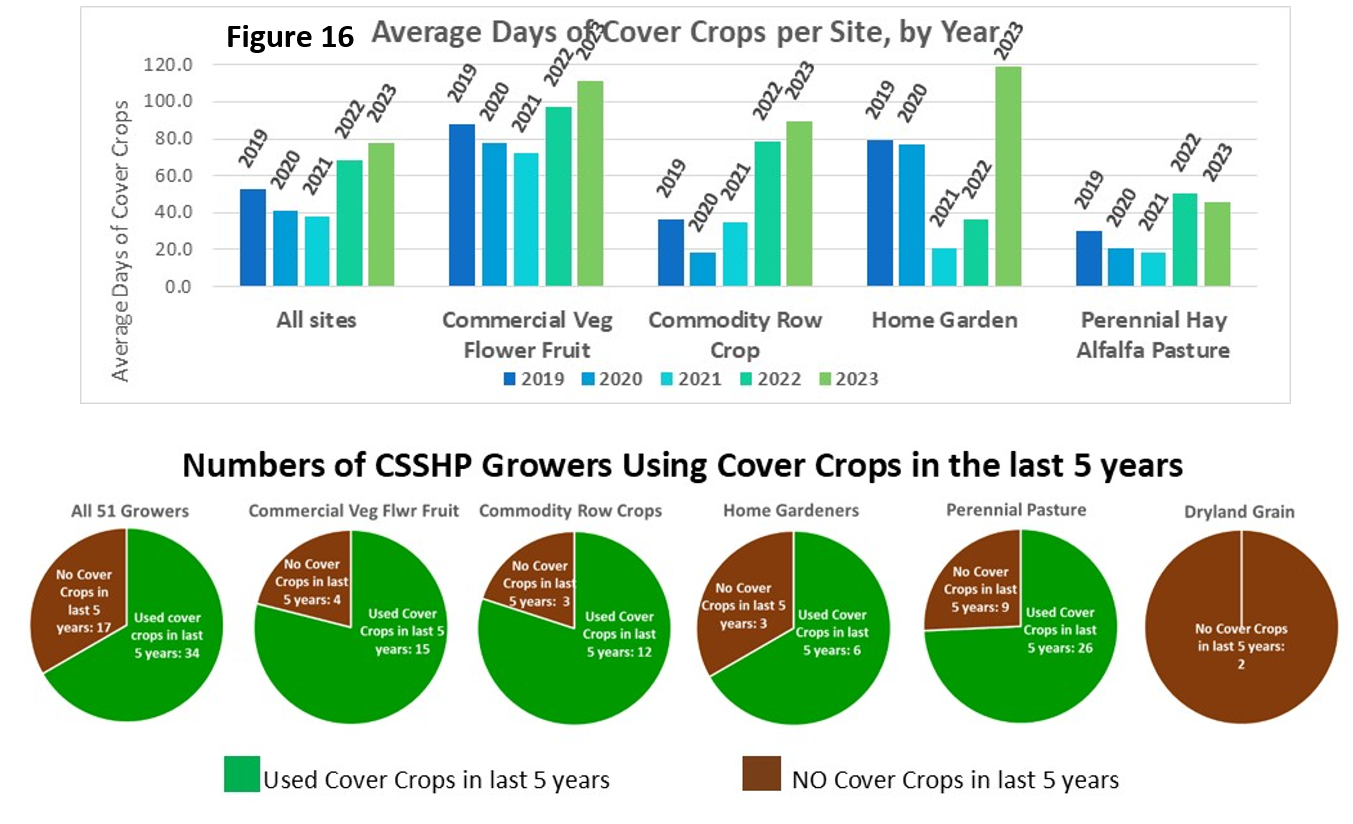
We examined the 200 sites for which we had cover crop data, and found that our growers’ Cover Crop Use increased for almost all our crop categories, including Commercial Veg/Flower/Fruit, Commodity Row Crops, and Home Gardens. Only when a rancher inter-seeded a cover into an existing pasture, or reseeded an annual field into a perennial crop did we credit a cover crop to that site, so we expected that cover crop use would be low for many of our established Perennial Hay/Alfalfa/Pasture sites. Dry-land grain sites, which depend on 420 days of fallow soil to store enough soil moisture for a biennial small grain crop, avoid cover crops because cover crops can deplete soil moisture. Our growers increased their days of cover crops on average by 25 days/site since 2019. (Figure 16)
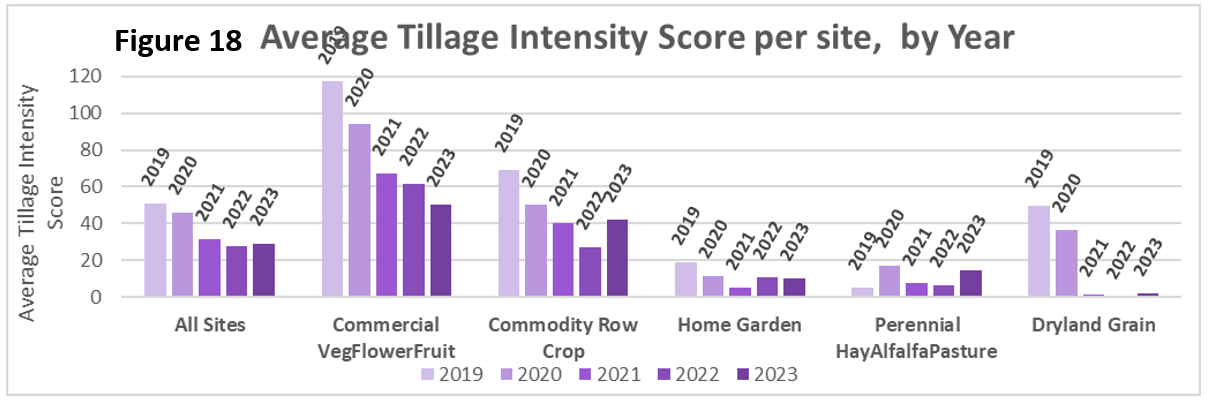
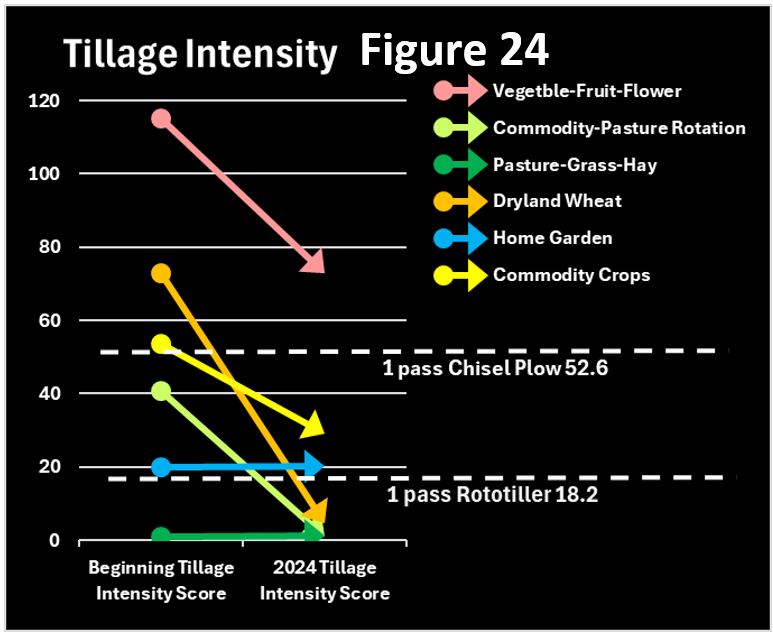
When we examined the Tillage Intensity of the 191 sites for which we had tillage data and grouped them into their 5 crop categories, we saw that 4 crop groups made very good progress in reducing their Tillage Intensity, with Commercial Veg/Flower/Fruit sites and Dry-land Grains making the most progress. Perennial Hay/Alfalfa/Pastures held steady with quite low Tillage Intensity scores. (Figure 18)
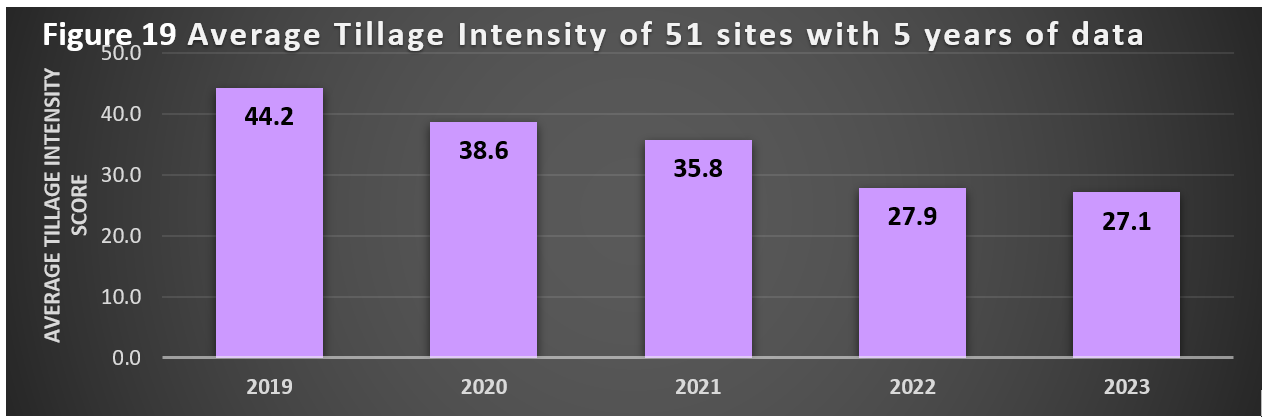
When we examined just the 51 sites for which we had 5 years of data, we saw the same trend of Tillage Intensity decreasing by 17 points over the last 5 years. (Figure 19)
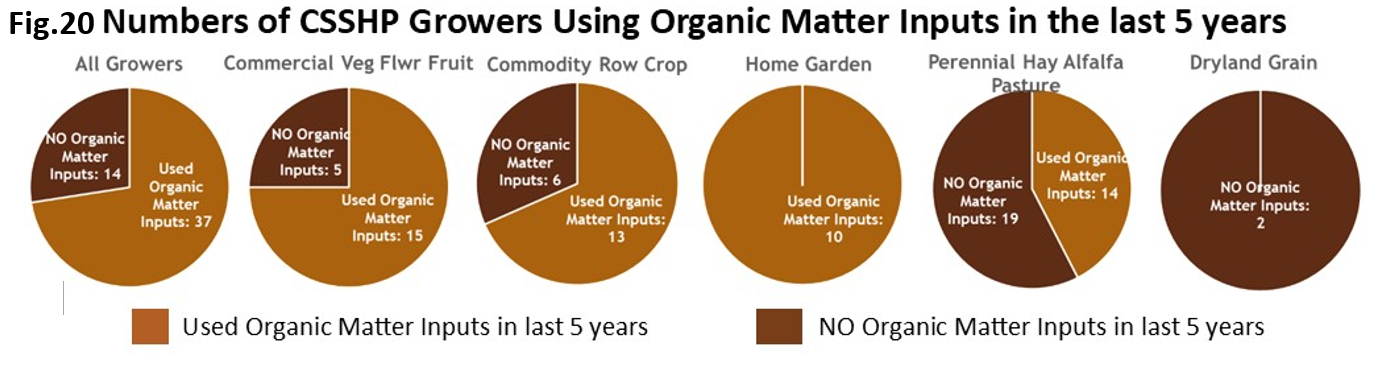
However, our news on Organic Matter Inputs was more mixed. The good news was that a majority of all our growers used organic matter inputs on their sites within the previous 5 years, with home gardeners leading the way. We only counted the organic matter inputs which were acquired off-site in this analysis. Manure deposited by grazing animals on-site, or clippings from on-site cover crops, were not counted as organic matter inputs here. Thus, perennial fields with aftermath grazing often showed as having no organic matter inputs, even though they may have had many days of grazing animals depositing manure and urine in their fields. (Figure 20)
However, the bad news was that when we examined our successive years of data and divided our sites into their different crop categories, we saw that only home gardeners increased their Organic Matter Inputs by 2023. All other crop categories saw a sharp decrease in Organic Matter Inputs. Commercial Veg/Flower/Fruit growers saw the largest decrease. Organic Matter Inputs decreased by 13T/acre on average since 2019. (Figure 21)
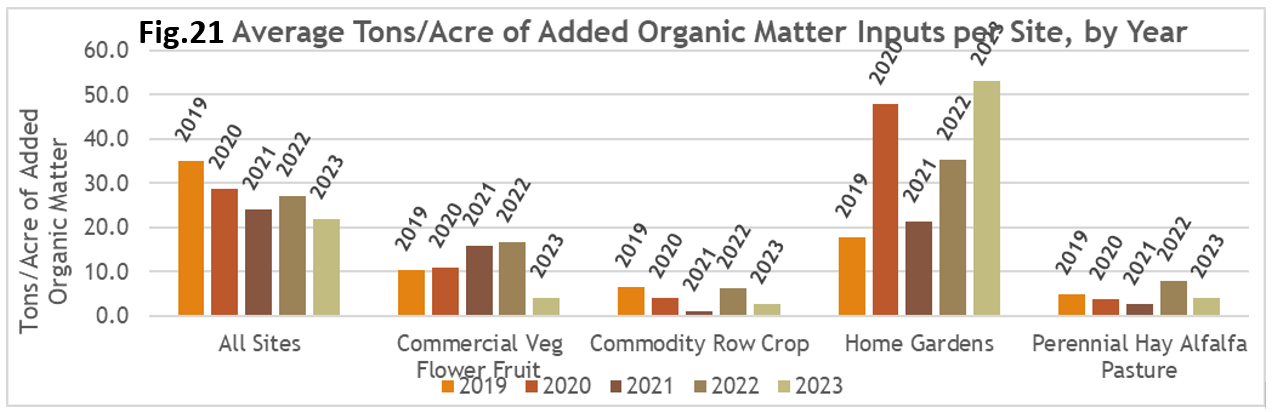
There were several possible causes of this decrease.
- We experienced an exceptionally wet May-June-July in 2023. Growers had a hard time planting, cultivating and harvesting between storms. They may not have wanted to or been able to get additional machinery into soggy fields to spread amendments.
- Our very tight labor market meant growers struggled all season to fill vacant positions. They may not have had enough workers to do things like spread amendments. Additionally, our tight labor market has increased labor costs sharply. This has affected Commercial Veg-Flower/Fruit growers the most as their crop category is the most labor intensive. Recent high labor costs may have consumed any profit that formerly paid for purchased amendments and rising fuel and hauling costs may have discouraged compost applications.
- Some growers with excessively high phosphorus levels may have decided to forego organic matter inputs and use cover crops instead, to avoid increasing their soil phosphorus to dangerous levels.
Table 22A summarizes our growers’ excellent progress incorporating soil health practices in 5 years:
#1B: LESSONS FROM 6 SITES WITH GREATEST SOIL HEALTH PROGRESS
In 2024, we ranked the sites with very little to no variability in their soil sampling depths according to how much progress they had each made in improving their soil health over the past 5-6 years. We then featured the highest-ranking site from each of the 6 crop categories represented in the CSSHP. Our 6 featured sites are those with the highest soil health progress ranking and lowest soil sampling depth variability in their respective crop categories. Figure 23 shows the progress each of our featured sites made during their time in the CSSHP.
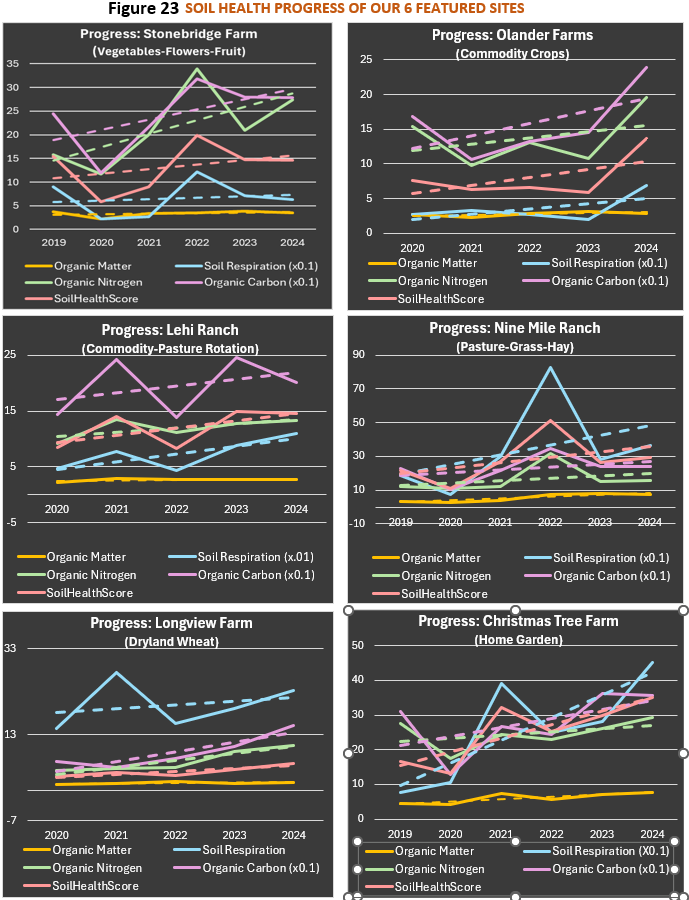
In Figure 23, solid lines show each site’s results over a 5–6-year period for 5 soil health measurements: soil organic matter, soil respiration, organic nitrogen, organic carbon, and an overall soil health score. There was a lot of variability year-to-year in sites’ lab values, so we also included the dotted trend lines, to represent the overall direction of each set of lab values. All the dotted trend lines showed an increase for every site, some increasing more than others. As expected, soil organic matter lines, the orange lines at the bottom of each graph, showed the smallest increases, since soil organic matter changes very slowly.
There were some common themes among the varied practices which these 6 growers used to improve their soil’s health.
- Supplemental irrigation water helps. 5 out of 6 of these growers (all except Dry-land Wheat) applied supplemental irrigation water. More water means more varied and bigger plants, healthier roots and soil microbes, and the ability to grow fall cover crops and to water grazing livestock year-round.
- Decreasing tillage intensity helps. All 6 growers decreased tillage intensity over 6 years, or maintained it at a previous very low level. (Figure 24) Less tillage means more and healthier soil microbes, especially more fungi, which feed more nutrients to crops.
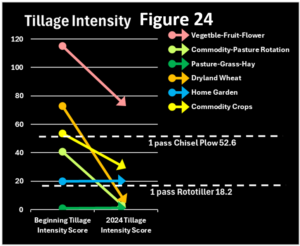
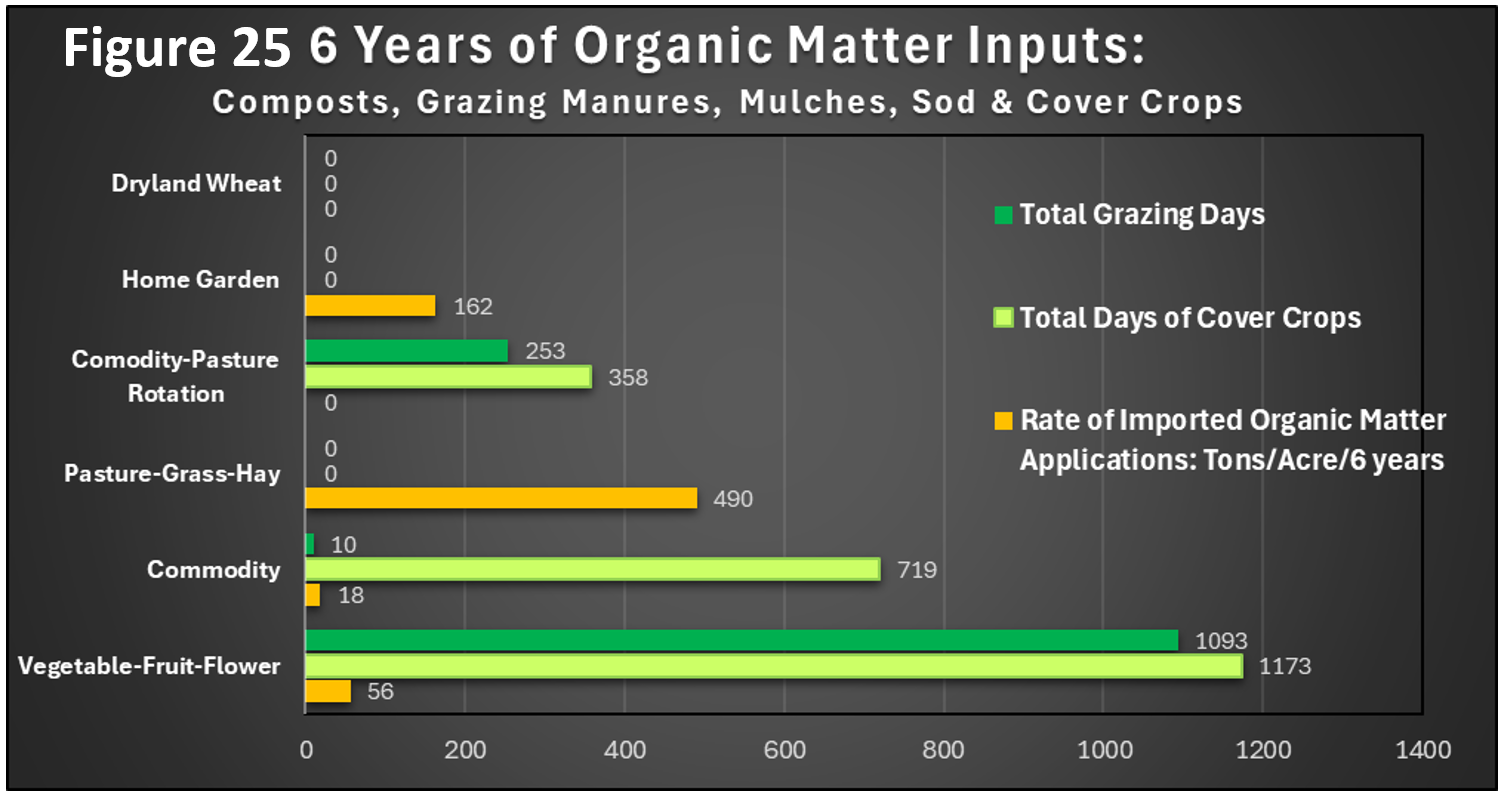
Figure 24 Tillage Intensity of 6 Sites - Organic Matter Inputs help. All 6 growers added or plan to add significant amounts of organic material to their soil, through imported amendments, grazing, cover crops and crop residues. (Figure 25) It may not matter how more organic matter gets into your soil, just that you get it there. Eastern Colorado soils tend to be low in organic matter to begin with. Our high altitude and short growing season mean there is not much excess organic material available on the Front Range, but our 6 CSSHP growers had each found creative ways to add organic matter economically.

Figure 25 6 Years of Organic Matter Inputs - Starting with soils in the “Poor” to “Good” range helps. None of these 6 growers started with soils that were in the “Excellent” range, where soils may have reached their carbon saturation point. It may be very difficult to improve soil health in “Excellent” soils. Some of our CSSHP growers who enrolled in the CSSHP with “Excellent” soils are discouraged because they aren’t seeing their soil health scores improve significantly, despite their best efforts. It may be that their soils have reached their carbon saturation point, and now they can only build deeper “Excellent” soil, just maintain and make more of, but not improve significantly, the “Excellent” soil they already have.
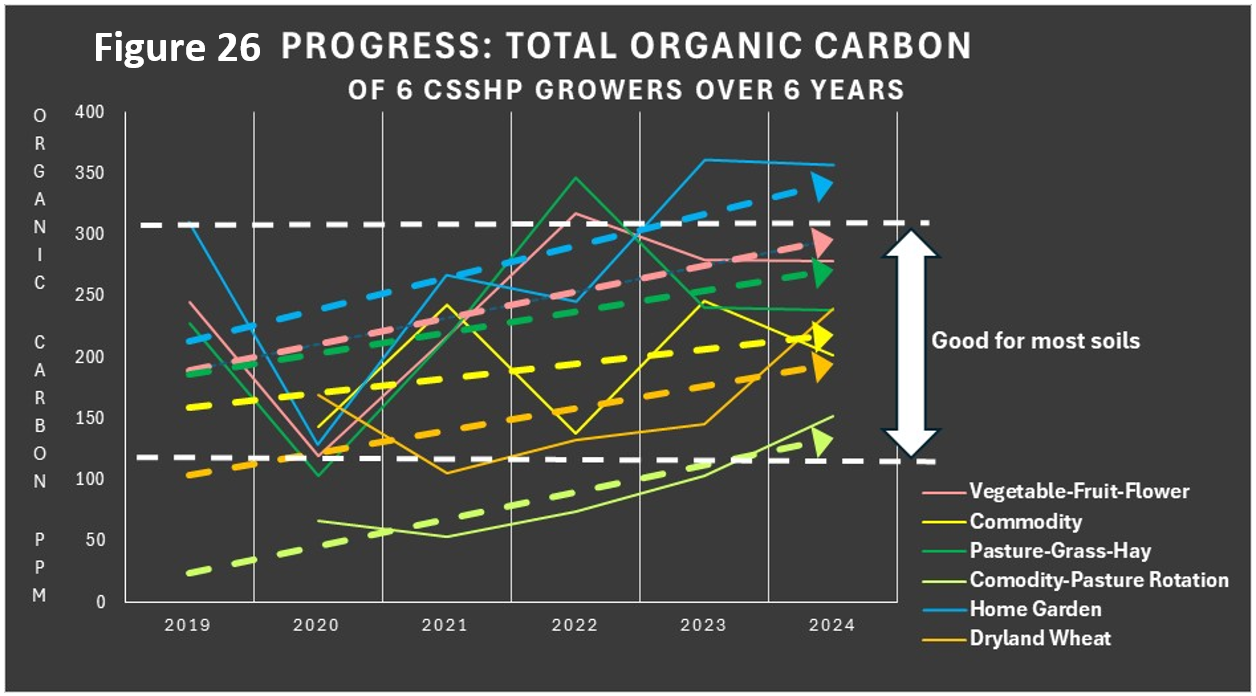
Most importantly, these 6 CSSHP growers all increased the Total Organic Carbon in their soils over the last 6 years of our project. (Figure 26) They took carbon out of the atmosphere and sequestered it in their soils. They turned CO2 gas into solid organic carbon which their soil microbes turned into more stable forms of soil organic matter. This carbon will persist in their soils and make their soils and crops more resilient in the face of coming droughts and floods. Even given Colorado’s high altitude, short growing season, poor shallow alkaline soils, and arid conditions, our CSSHP growers have shown that Colorado farmers and ranchers can remove carbon from the atmosphere to help draw down atmospheric CO2 levels. Colorado farmers and ranchers can join other growers from California, to Iowa, to Pennsylvania, in sequestering carbon in their soils.
#2 PLFA TESTING PROBLEMS IN 2023
In 2023, we saw illogical and precipitous drops in PLFA scores, but only on the soil samples our growers collected in the fall. The 3 graphs below illustrate this. Figure 27 and Figure 28 show the 2019 and 2021 PLFA results for total microbial biomass for all our sites, with each dot representing one site’s score and the date it was collected. (We provided PLFA tests only every odd numbered year.) There was a wide range of total microbial biomass scores in both spring and fall for all our sites in both 2019 and 2021.
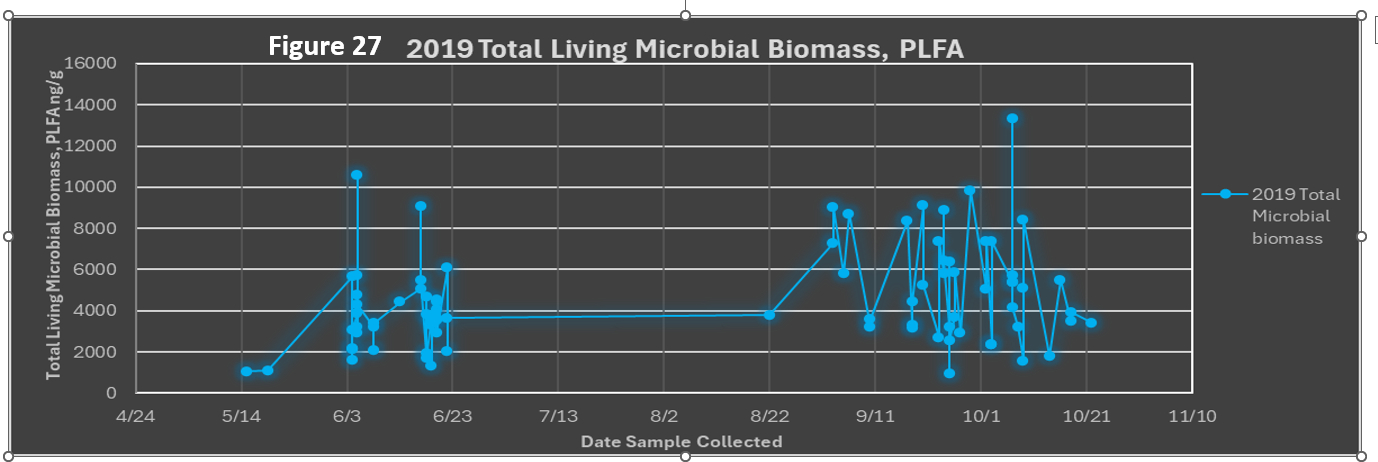
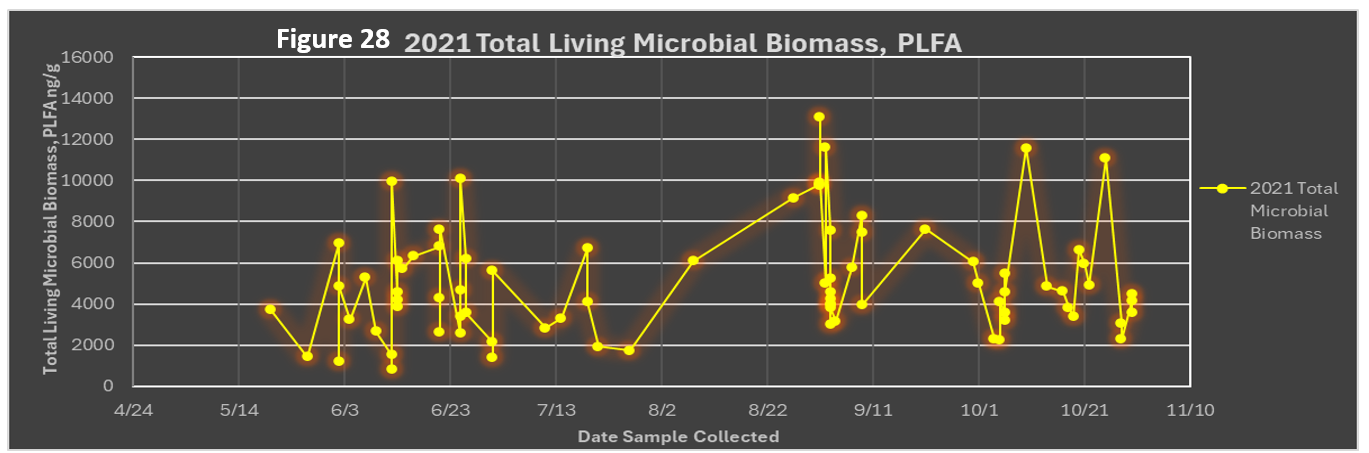
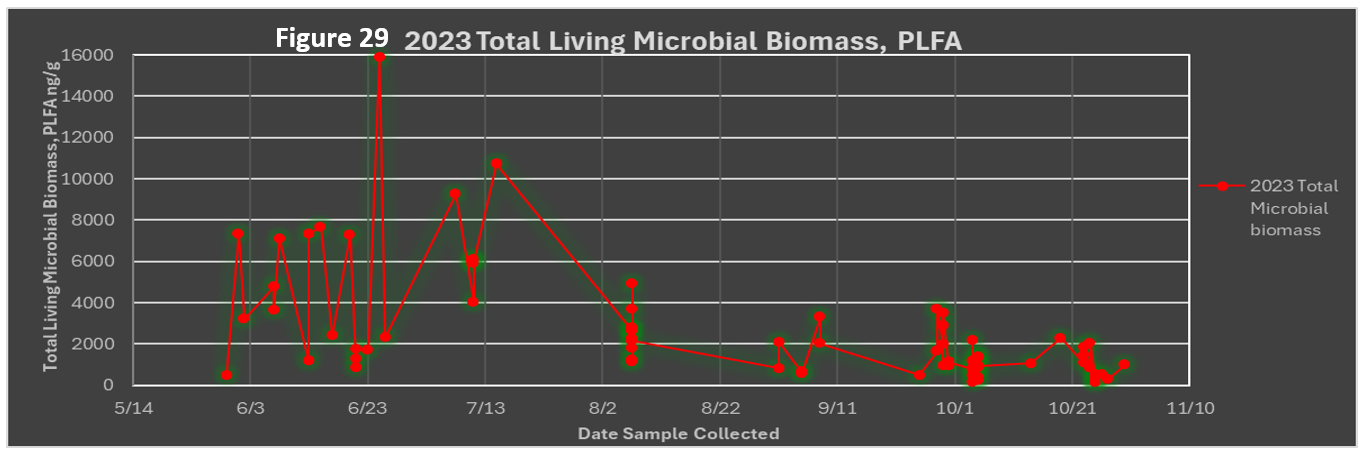
Figure 29 shows our sites’ total microbial biomass in 2023. This graph shows the same wide range of scores in the spring, but suddenly in the fall, all sites have very low scores.
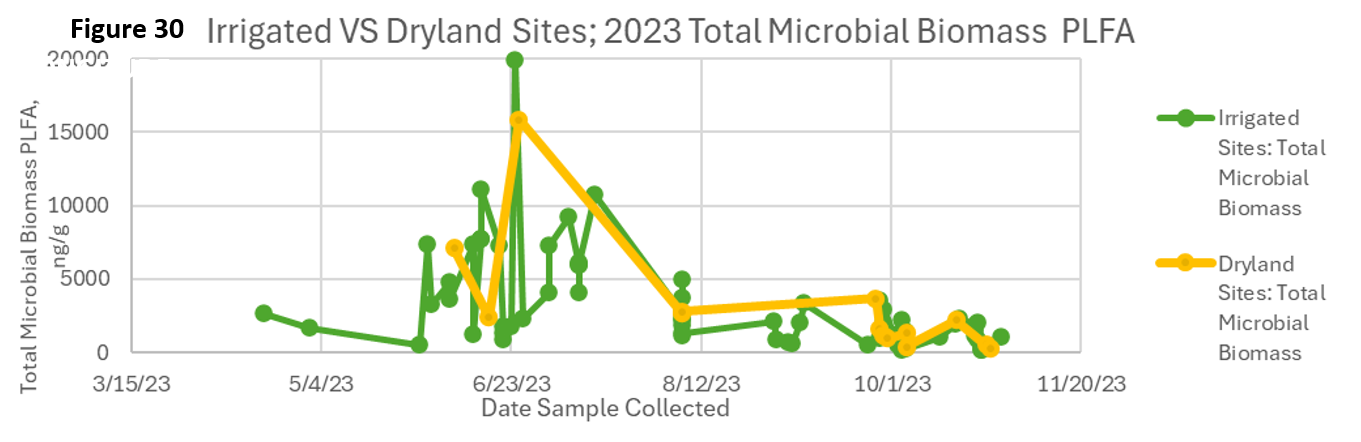
When we brought this to our lab’s attention, they initially suggested that the cause could be a very wet May-June-July followed by a very hot dry August-September-October. When soil microbial populations expand rapidly under favorable conditions like we experienced in May-June 2023, they can sometimes use up all their available resources, and then suddenly crash. If this were the cause of our problem, we would expect to see a difference in the drops in PLFA scores of dry-land fields, compared to fields which continued to receive supplemental irrigation water throughout the growing season. However, we did NOT see any difference between the total microbial biomass scores of our dry-land fields and our irrigated fields, as Figure 30 shows.
We also checked to see if the amount of time samples were stored in freezers, or if the type of crops grown in the field were correlated with the drop in scores. They were not. We checked the Haney test scores which were pulled from the same soil samples. Haney test results were all within normal ranges. Our sampling and shipping protocols had stayed exactly the same for the last 5 years. All this meant that the problem was most likely something that happened while the soil samples were in route to the lab, or at the lab itself.
Our lab bent over backwards to ascertain the cause of this problem. They re-ran samples and re-calibrated their machinery multiple times, tore apart then cleaned and reassembled their machines, substituted all new reagents, switched lab techs performing the test, sent samples to other labs, re-checked other clients’ samples and results, called other researchers for advice, and bought several new parts for their machines. Our lab finally isolated the problem to a combination of slight leakage within the gas chromatography machine, and an oven with variable inconsistent heat. The re-run results we received after these problems were fixed were more in line with previous years' results.
#3: SOIL PH CORRELATES WITH LOCATION
In 2022, we compared our sites’ soil pH with longitude (east-west location). We found that sites further east out on the plains tend to have higher pH than sites closer to the Front Range foothills and up in the mountains. (Figure 31) This could be due to several things.
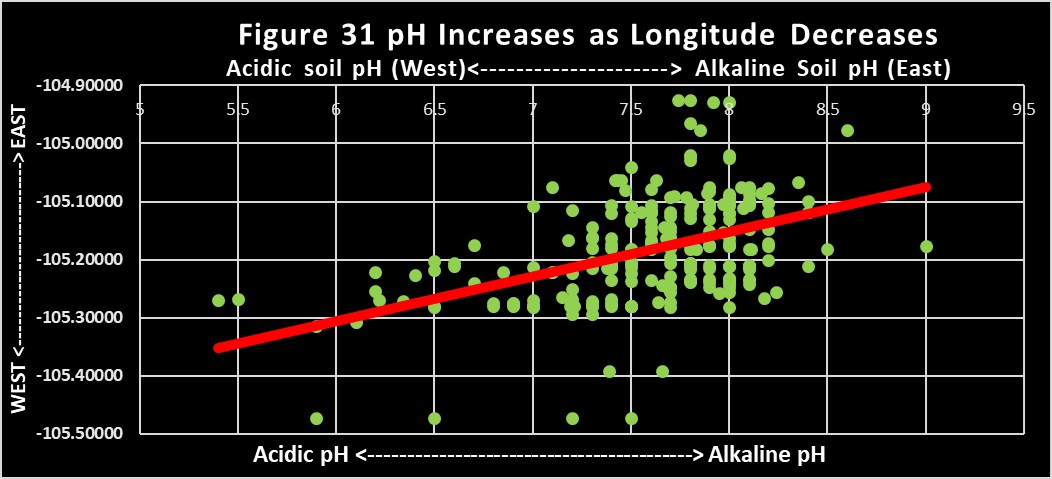
Precipitation is higher in the mountains and foothills than further out on the plains. Higher rainfall is associated with more acidic soils. Also, a site’s original parent soil material is more acidic in the mountains and foothills than on the plains. Furthermore, the pH of irrigation water can change soil pH with repeated applications. Irrigation water becomes more alkaline as it travels further east, picking up tail-water, salts and minerals. All this means that the location of a field might determine its soil pH as well as its soil health, since high soil pH has a significant detrimental effect on soil health.
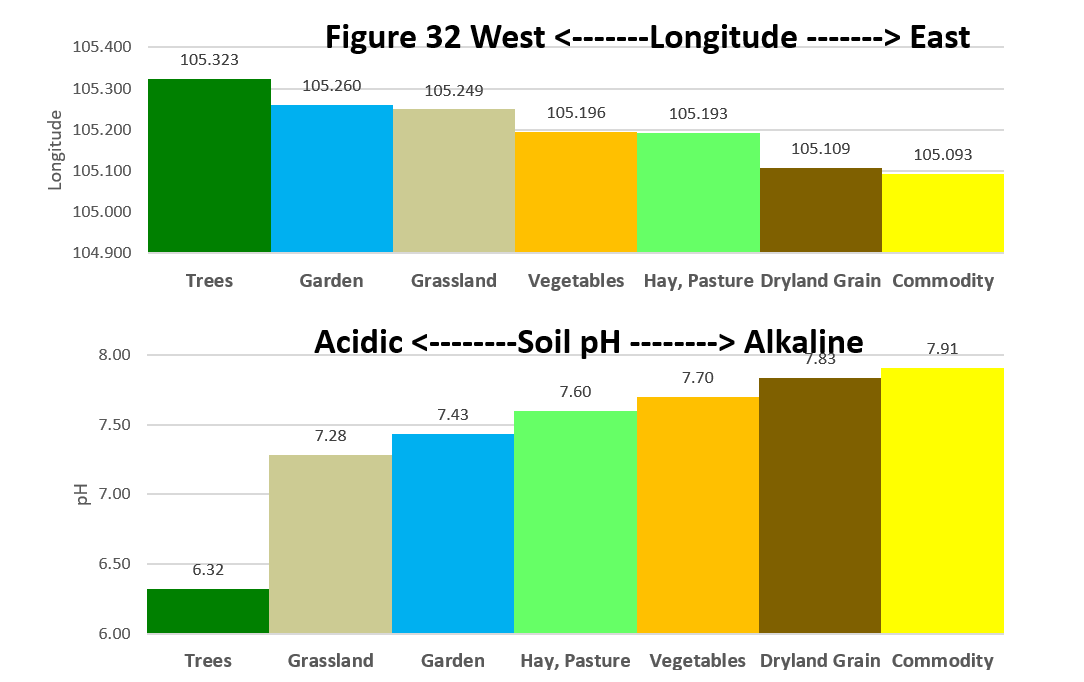
#4: Average pH and Location of 7 Different Crop Groups
We wondered if certain crop groups might be located further east or west, thus influencing their soil pH. We sorted our sites into 7 crop groups.
- Dry-land Grains : Dry-land wheat and millet, no irrigation, using a crop-fallow system.
- Commodity Row Crops: Irrigated crops like corn, triticale, wheat, hemp, beans, sugar beets, barley, millet, silage.
- Commercial Vegetable/Flower/Fruit : Irrigated vegetables, flowers and fruit, sold commercially.
- Perennial Hay/Alfalfa/Pasture: Irrigated perennial pasture systems of grass, hay and alfalfa.
- Home Gardens: Vegetables, flowers and fruit trees for home consumption.
- Non-farm Grasslands : Dry-land grasslands with no recent tillage or farming practices.
- Trees : Forests and tree farms.
We then calculated each group’s average longitude, and calculated the average pH for each of the 7 groups, as shown in the next Figure 32 . No surprise, trees are located to the west in our forests, with dry-land gains and commodity crops located to the east, where large sections of undeveloped agricultural lands remain. The order of the average pH of the 7 groups closely corresponds to their relative longitude. Figure 32 suggests that some crop groups face more of a disadvantage than others when it comes to soil health, since their location can determine their soil pH, which in turn can make improving their soil’s health more difficult.
#5: PREDICTING THE SOIL HEALTH OF DIFFERENT CROP GROUPS
In 2019-2021, CSSHP data analysis showed that more supplemental irrigation water, more days of living cover, more organic matter inputs, more grazing days and more use of cover crops can all improve a site’s soil health. We also showed that lower tillage intensity and a lower soil pH improves a site’s soil health. In 2022, we calculated the average use of each soil health practice for our 3 largest crop groups: 1) Hay/Pastures/Alfalfa, 2) Commercial Vegetables/Fruit/Flowers, and 3) Commodity Row Crops. Using Figure 34, can you predict which crop groups will have the lowest and highest soil health scores?
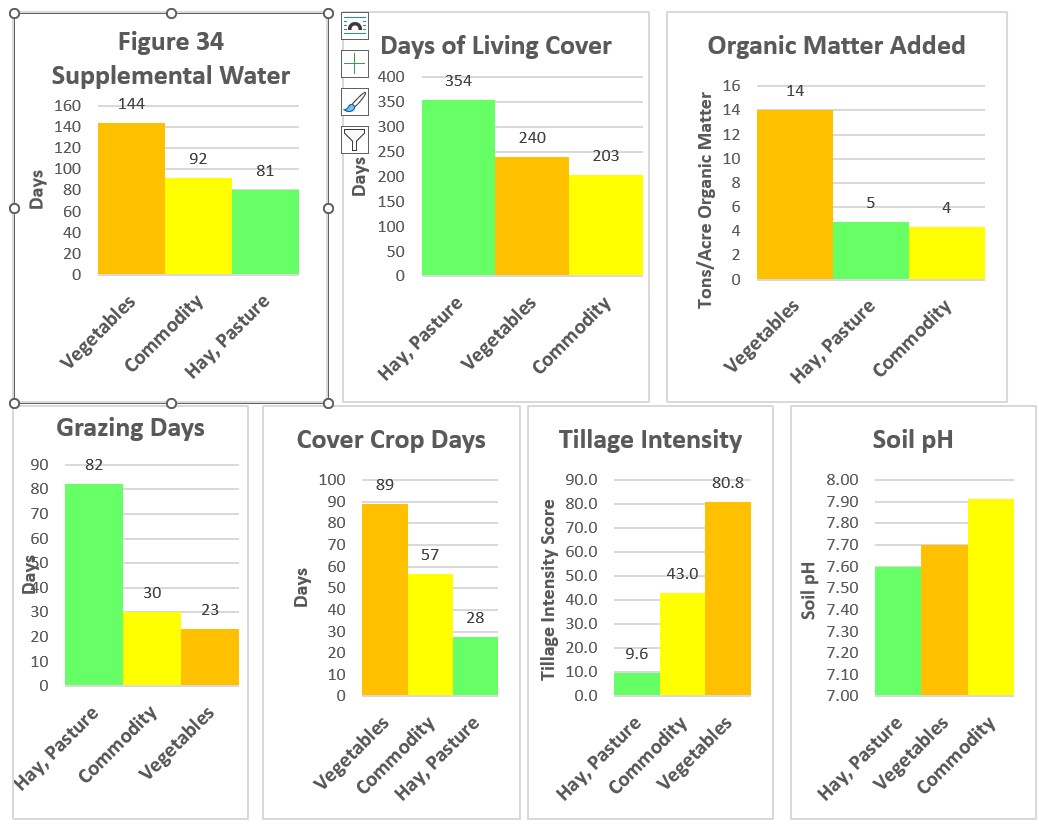
Table 35 shows the average soil health scores of each of these 3 groups, for Soil Organic Matter, Soil Respiration, Organic Nitrogen, Organic Carbon, Soil Health Score, Total Microbial Biomass, and Number of Fungi, using the Haney and PLFA soil health tests we compiled.
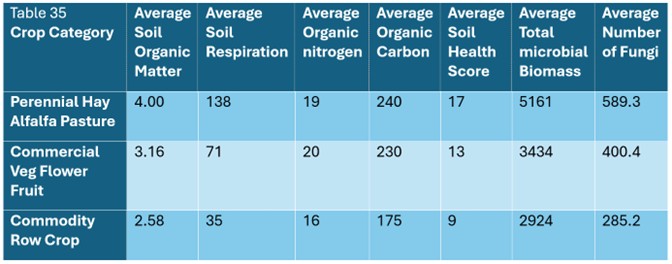
Perennial Hay/Alfalfa/Pastures : The Pasture group had the highest average soil health scores of these three crop groups. Although the Pasture group had lower supplemental water days and lower organic matter added, their very high days of living cover and very high grazing days, along with their very low tillage intensity and lower soil pH seemed to more than make up for their water challenges, in terms of soil health.
Commodity Row Crops : The Commodity crop group had the lowest average scores of these three groups. Although they had done an excellent job of reducing their tillage intensity, that fact alone could not make up for their high soil pH, lowest days of living cover and lowest organic matter added. They had only 2/3rds of the water availability as the Commercial Veg/Flower/Fruit group, which explained their lower days of cover crops that often require fall seeding and fall water. Inter-seeding cover crops aerially or when the main crop is still small were work-a rounds but not always practical. Low commodity prices meant the cost of additional organic matter inputs like compost and manure were hard to justify.
Commercial Veg/Flower/Fruit: The Commercial Veg group had the highest tillage intensity by far, but also triple the organic matter inputs of the other 2 groups. These huge organic matter inputs, along with their longer water season, greater use of cover crops, and lower pH overpowered their intense tillage and boosted their average soil health scores above the commodity crops’ averages. Their longer water season meant they could plant more fall cover crops and string together succession plantings for a longer growing season. Their high value vegetables meant that they could afford organic matter input costs and hauling fees.
#6: VARIABILITY: We continued to see a great deal of variability in our lab results when we compared sites with themselves year-to-year.
#6A: ORGANIC MATTER INPUTS & GRAZING ANIMALS INCREASE VARIABILITY:
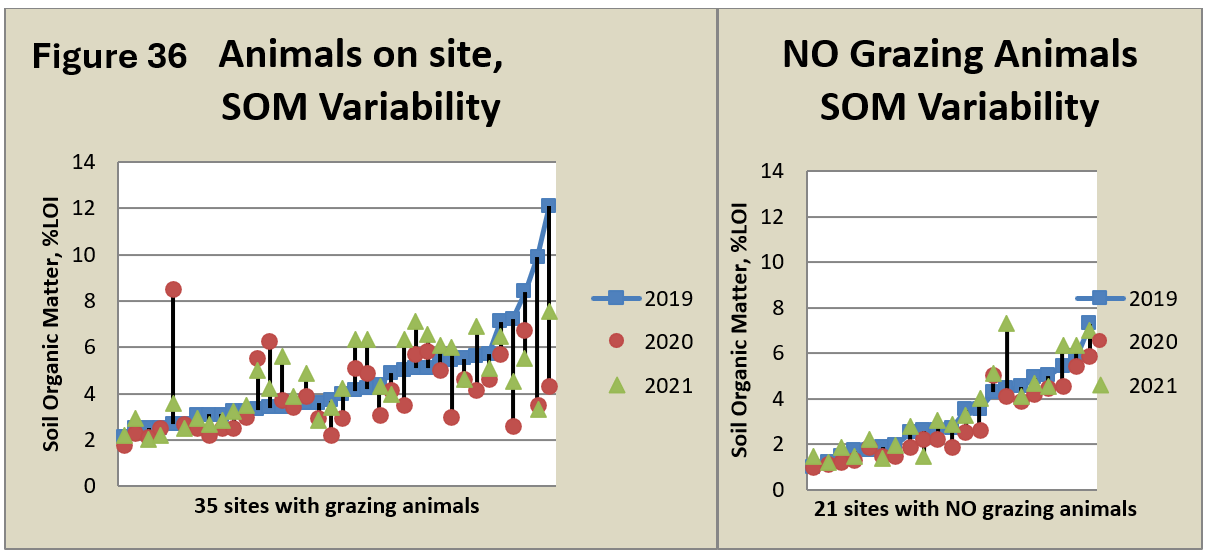
In 2021, we found that grazing animals on site coincided with increased variability in soil organic matter (SOM) data. In Figure 36, sites were divided into 2 groups: 35 sites with and 21 sites without grazing animals on-site at some point during the year. When the 3-year variability of soil organic matter data was compared between sites with and without grazing animals, sites with grazing animals clearly showed more variability in SOM data.
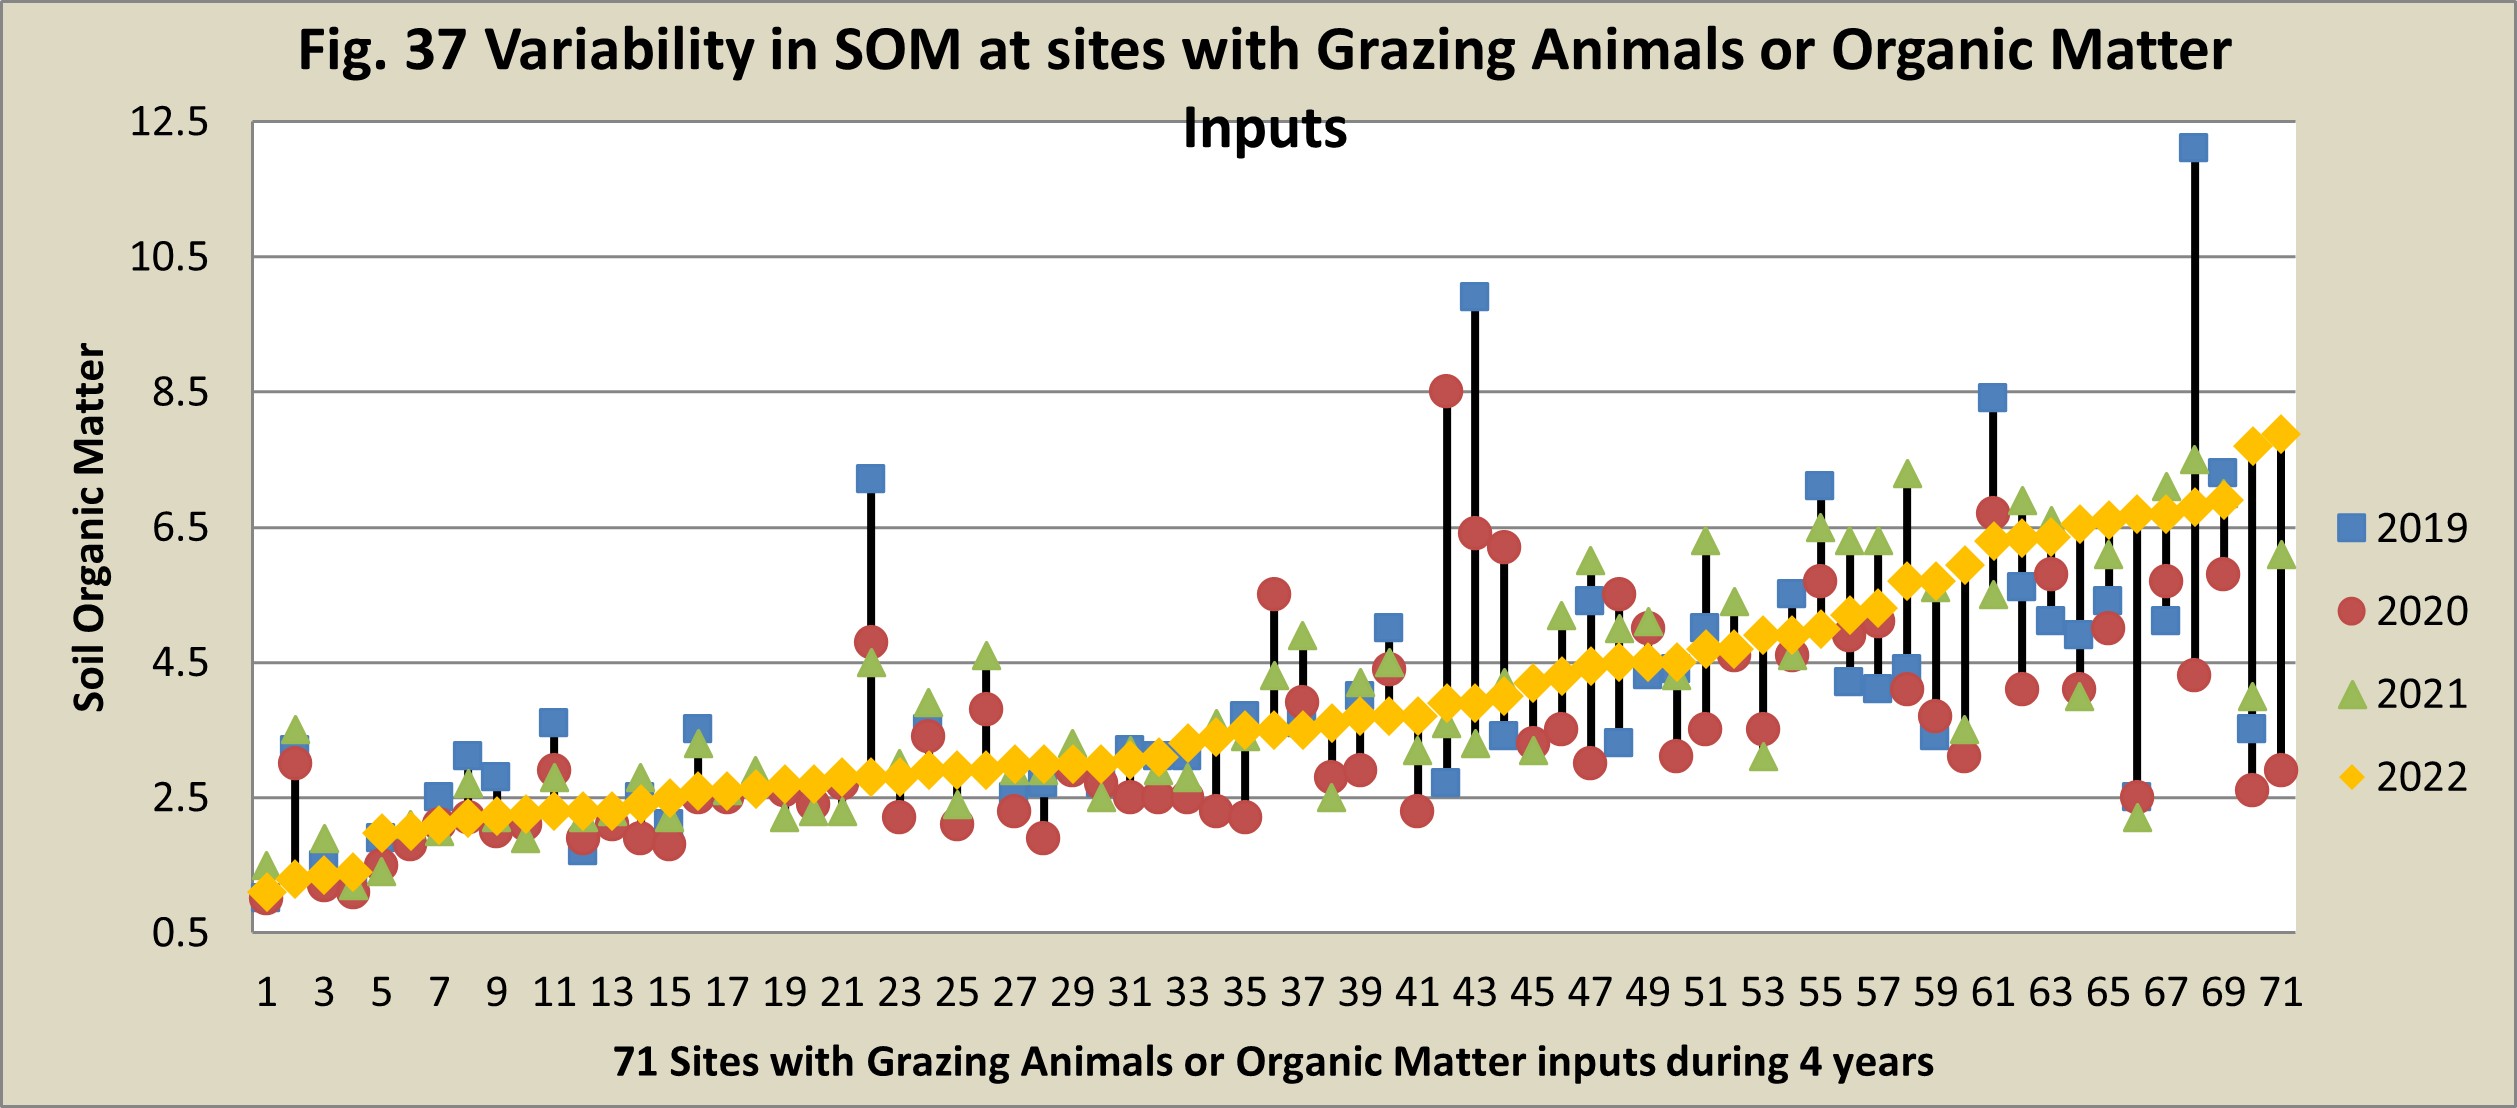
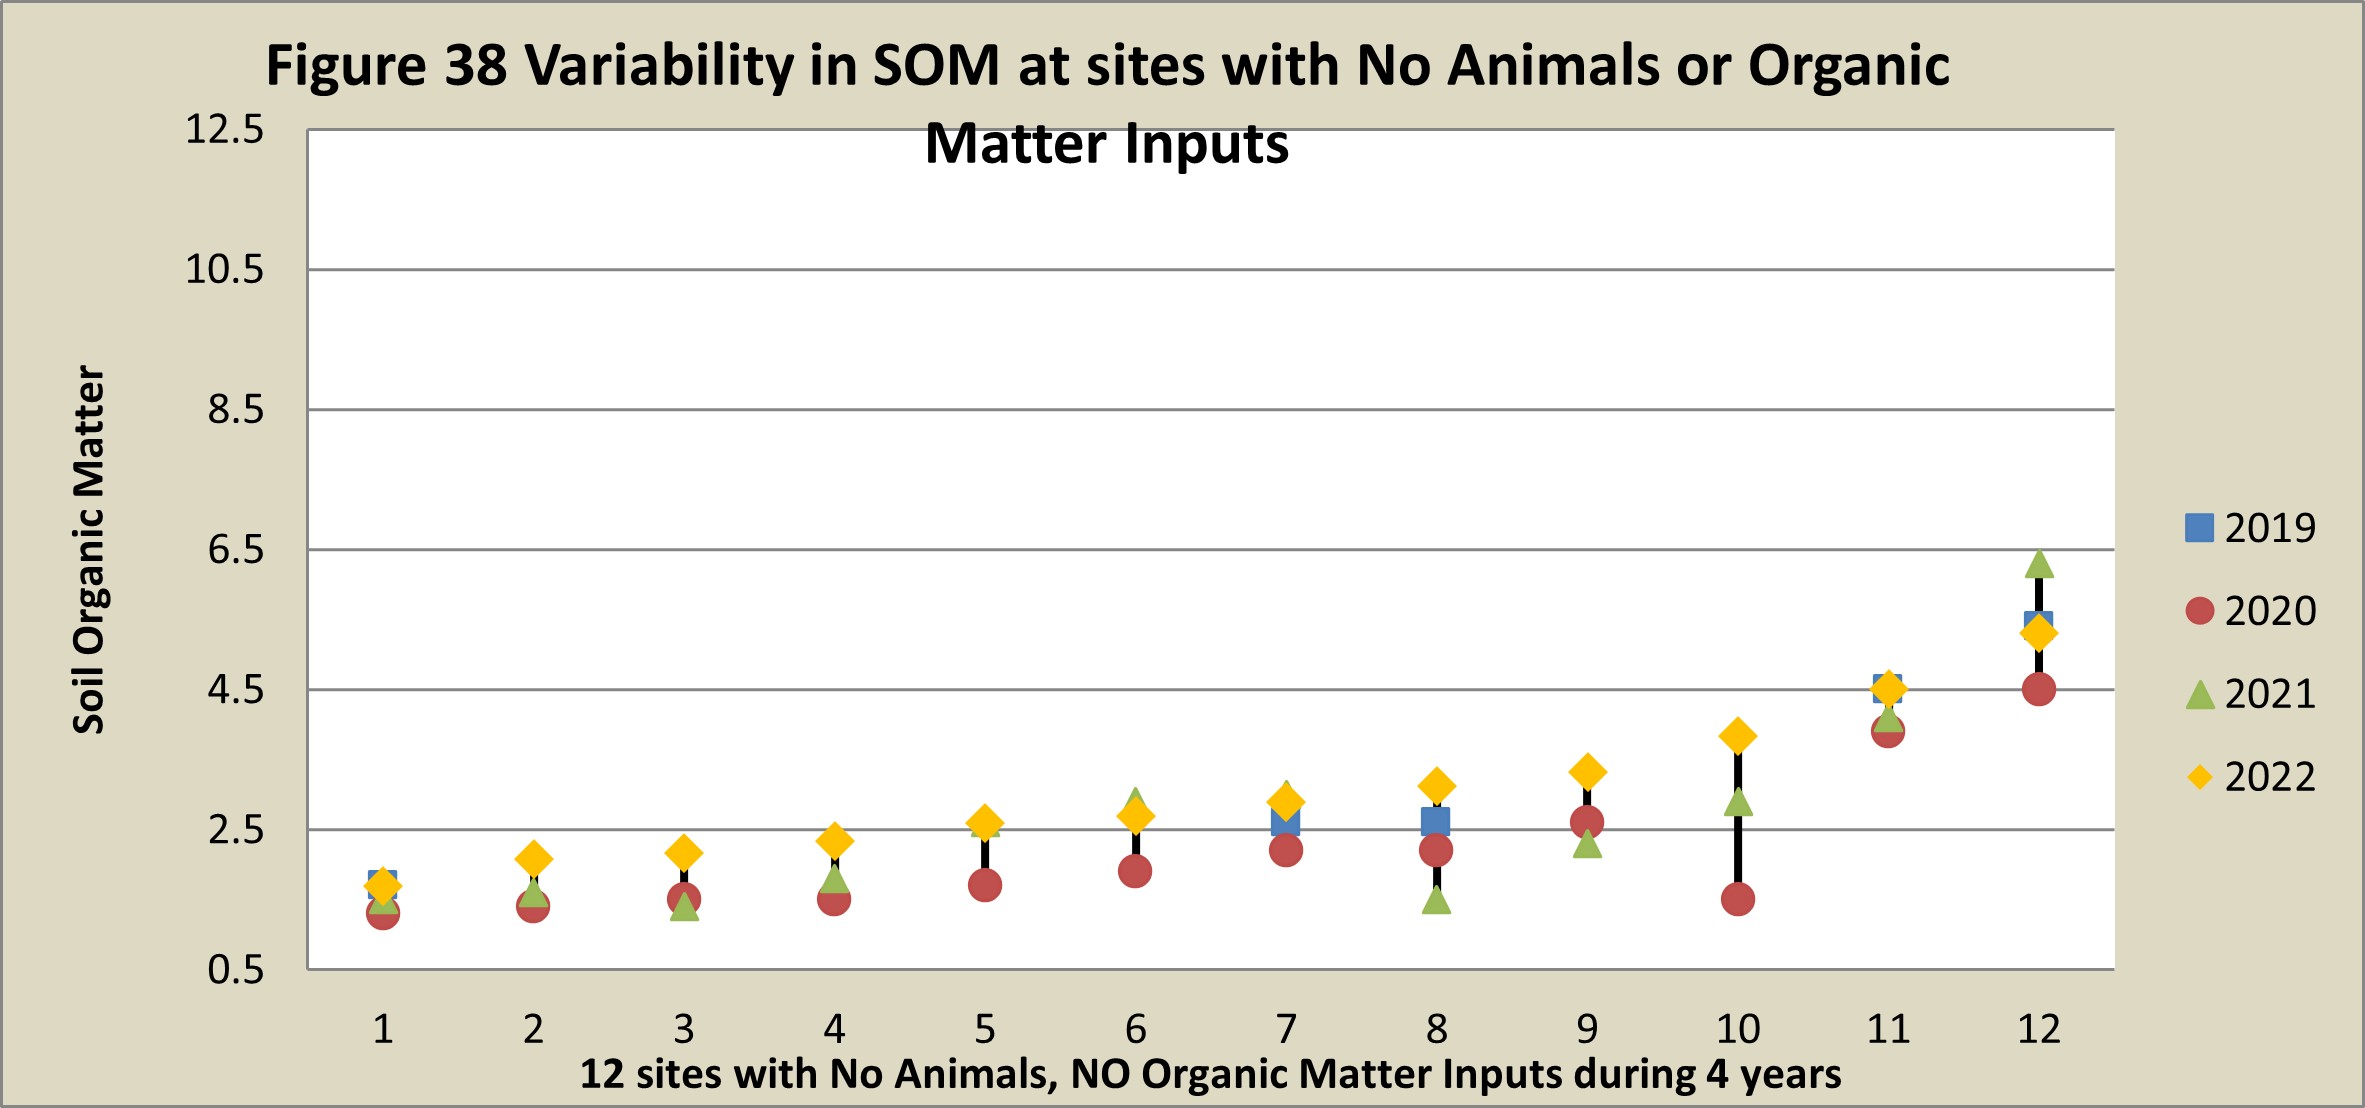
In 2022, we looked at the variability of sites with and without both grazing animals and organic matter inputs. In Figure 37, 71 sites with both grazing animals and organic matter inputs (OMI) were each represented by a quadruplet of data points connected by a vertical black line. Each square-circle-triangle-diamond-black-line combo represents the Soil Organic Matter (SOM) values for one site for 4 years. According to the literature, SOM is supposed to be quite stable and very difficult to change, and yet we saw large swings in individual sites’ SOM data, especially when grazing animals were present or organic matter was imported to the site, as is the case in the first graph below. We only had 12 sites in our study which had no grazing animals or imported organic matter for 3 or more years. Figure 38 shows that the variability in SOM values for these 12 sites was much less than for sites in the previous graph.
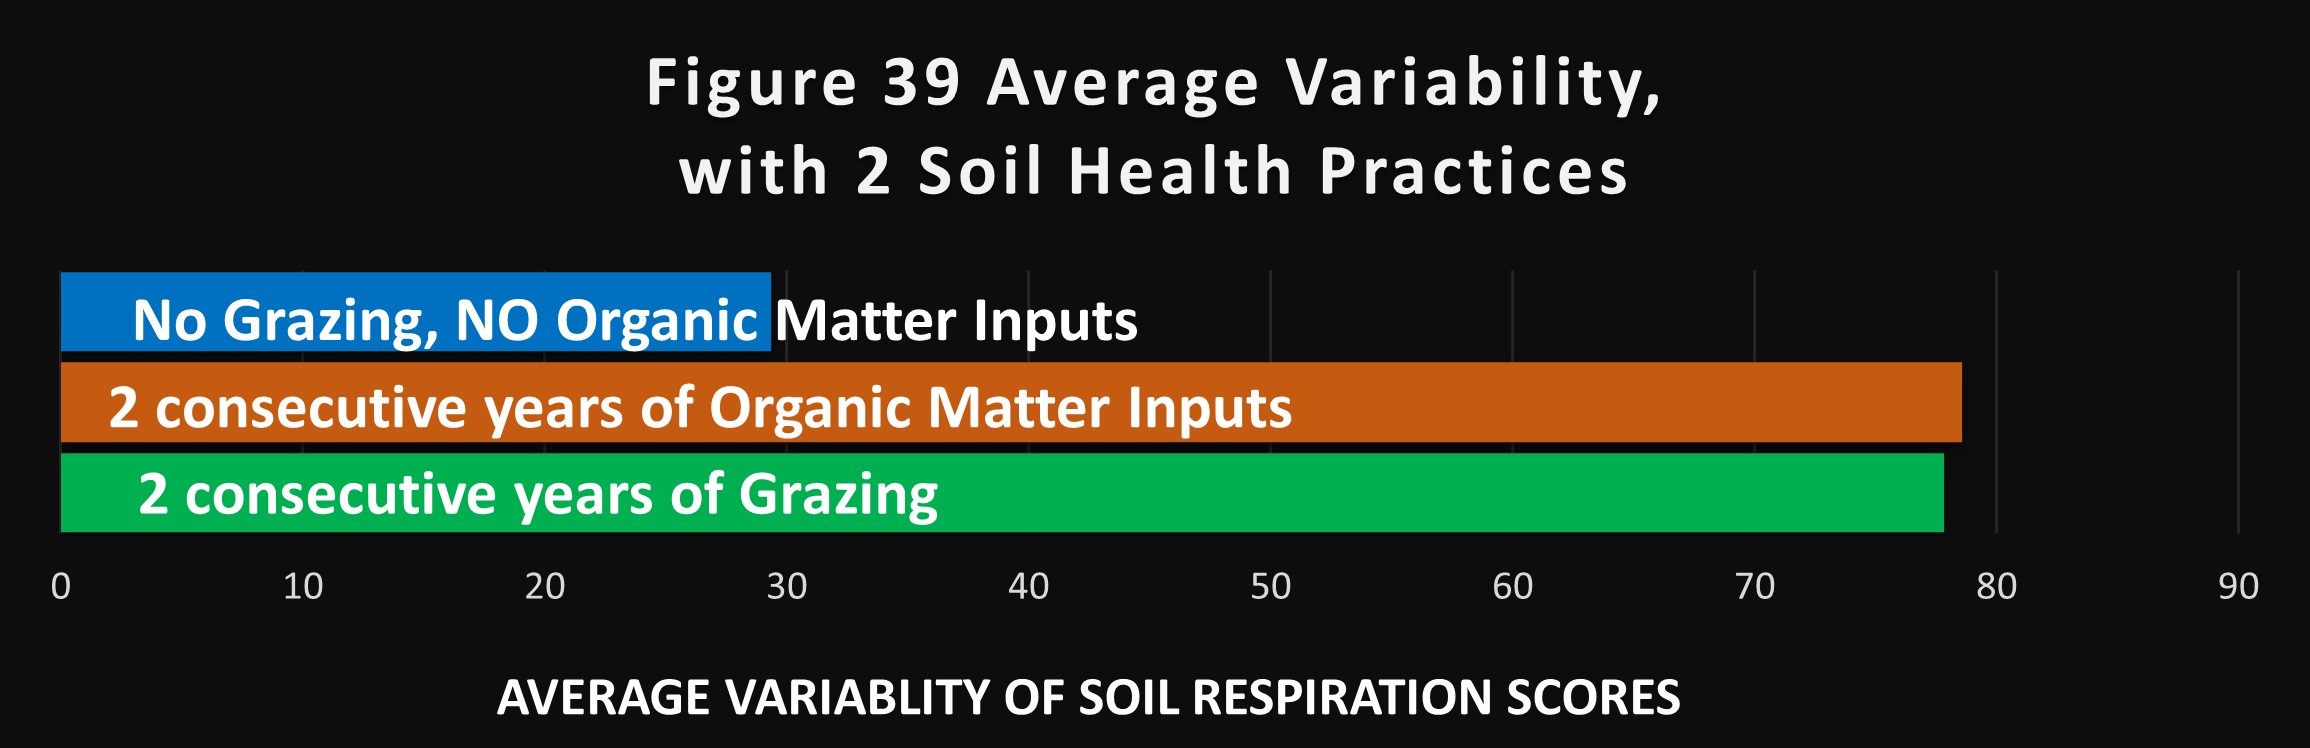
We then sorted our 93 sites into 3 groups and calculated the average variability for each group. Figure 39 shows that the groups which grazed animals or added organic matter to their sites for 2 consecutive years had approximately three times as much variability in their lab results as the group with NO grazing animals and NO organic matter inputs.
#6B: PAST PRACTICES CAN EXPLAIN SOME BIG VARIABILITY JUMPS
In 2023, we divided our sites into 4 crop categories (Commercial Veg/Flower/Fruit; Commodity Row Crops and Dry-land Grains; Home Gardens; and Perennial Hay/Alfalfa/Pastures) and examined each category’s variability. Figure 40, Figure 41, Figure 42 and Figure 43 show that an examination of past practices can often explain some of the exceptionally big jumps in variability which we see in every crop group.
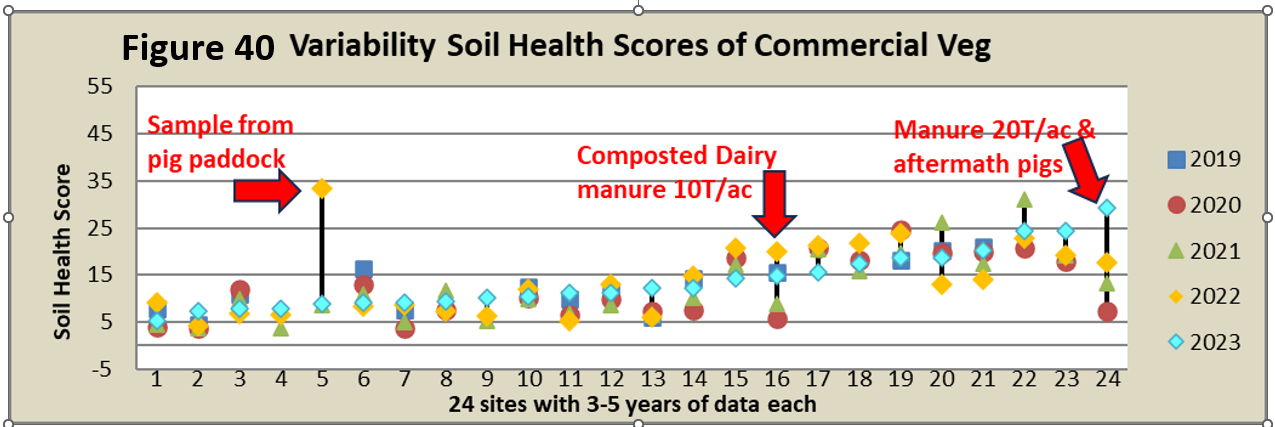
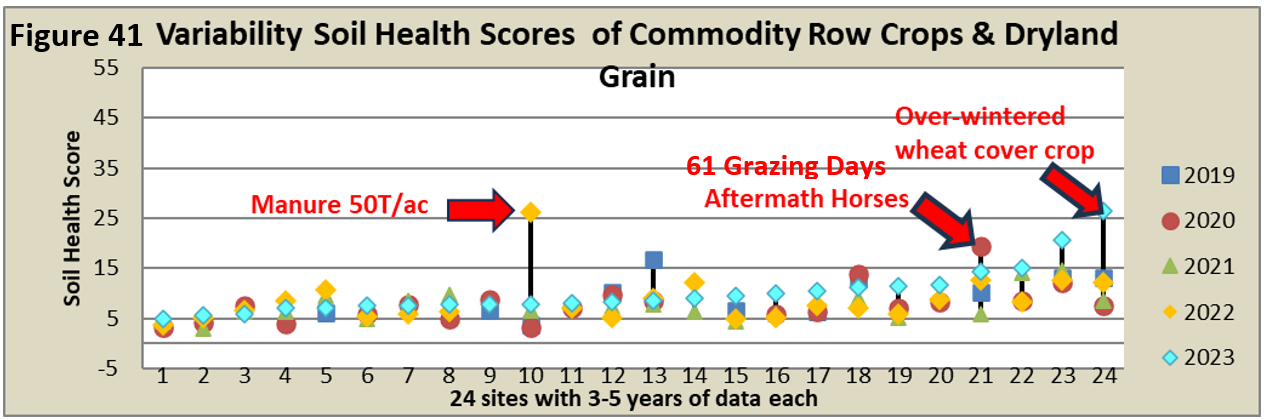
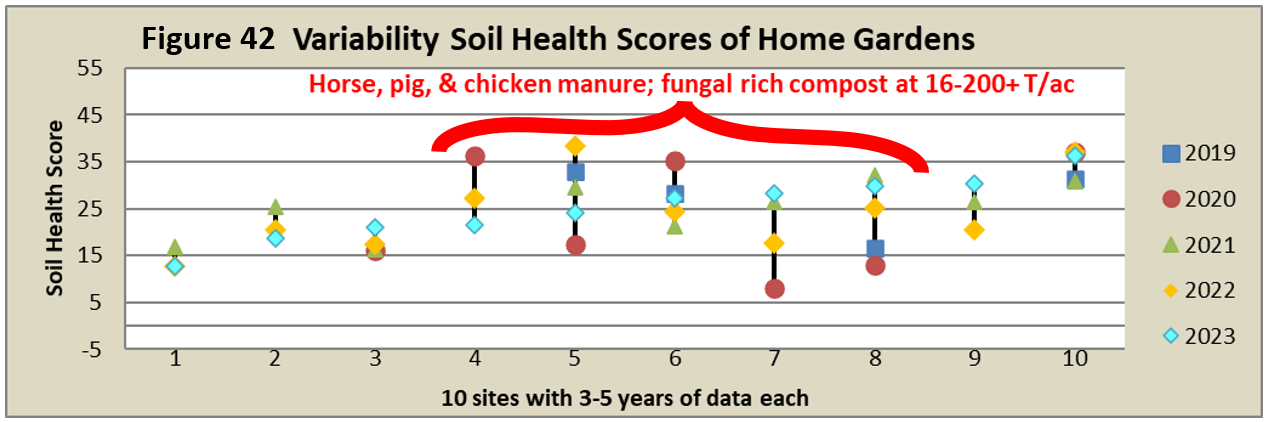
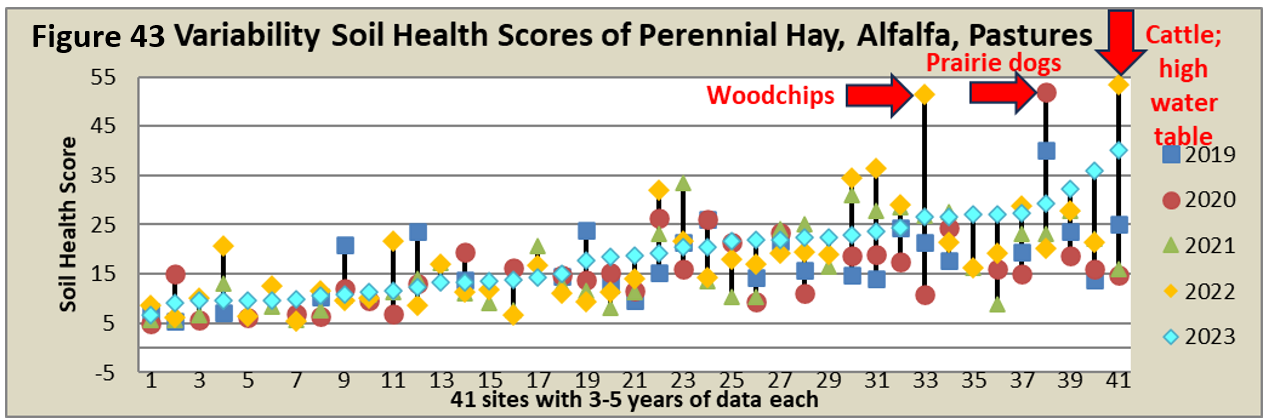
In these 4 Figures, each site’s 3-5 years of soil health scores are represented by a column of 3-5 colored data points connected by a vertical black line (a blue square for 2019, red circle for 2020, green triangle for 2021, yellow diamond for 2022, and aqua diamond for 2023). Each square-circle-triangle-diamond-black-ine combo represents the Soil Health Scores for one site for 3-5 years.
These 4 Figures show that Home Gardens and Perennial Hay/Alfalfa/Pastures had the most variable soil health scores year-to-year. In 2022, we showed that large amounts of organic matter inputs and more days of grazing animals increased variability. We also showed that home gardeners applied the highest rates of organic matter to their sites, and we know that grazing animals are usually found in pastures. Thus, it makes sense that Home Gardens and Perennial Hay/Alfalfa/Pastures would experience the greatest variability in Soil Health Scores.
#6C: CHANGING SOIL SAMPLE DEPTH CAUSES VARIABLE TEST RESULTS
Our growers were instructed to collect the same 8-inch-deep soil samples every year. They were supposed to collect several vertical cores or slices of the top 8 inches of their soil, across the area they are testing, and mix them all together. However, dried compacted soils, drought, faded memories, and farm staff turnover meant that often the samples we received were deeper or shallower than 8 inches. Over the years, we received and processed soil samples ranging from 3 to 18 inches deep. This is, after all, CITIZEN science.
Microbial life and organic matter are greatest in the top couple of inches of soil. When you collect a deeper soil sample (10-18 inches deep), you add more soil from deeper down where there is much less organic matter. That tends to “dilute” the amount of microbial life and organic matter that is in the top couple inches. That dilution from the deeper soil makes the lab’s reading of your soil organic matter drop. The inverse is also true. If you take a very shallow (3-4 inches deep) soil sample one year, it can look like you have made huge progress if you compare it with an 8-inch-deep sample from the previous year, because a much greater percent of the 3” sample is comprised of the top layer of soil where organic matter is the greatest.
Our data confirmed this effect. In Figure 44, we calculated how much soil sampling depths changed from year to year and compared that with how much soil organic matter (SOM) changed from year to year. Each data point in the graph represented the change in depth for one site over 2 consecutive years, plotted against the corresponding change in SOM. Most data points fell into the 2 colored quadrants where shallower soil samples had higher SOM, and deeper soil samples had lower SOM than last year’s sample. The red trend line confirmed that sample depth affects our SOM values.
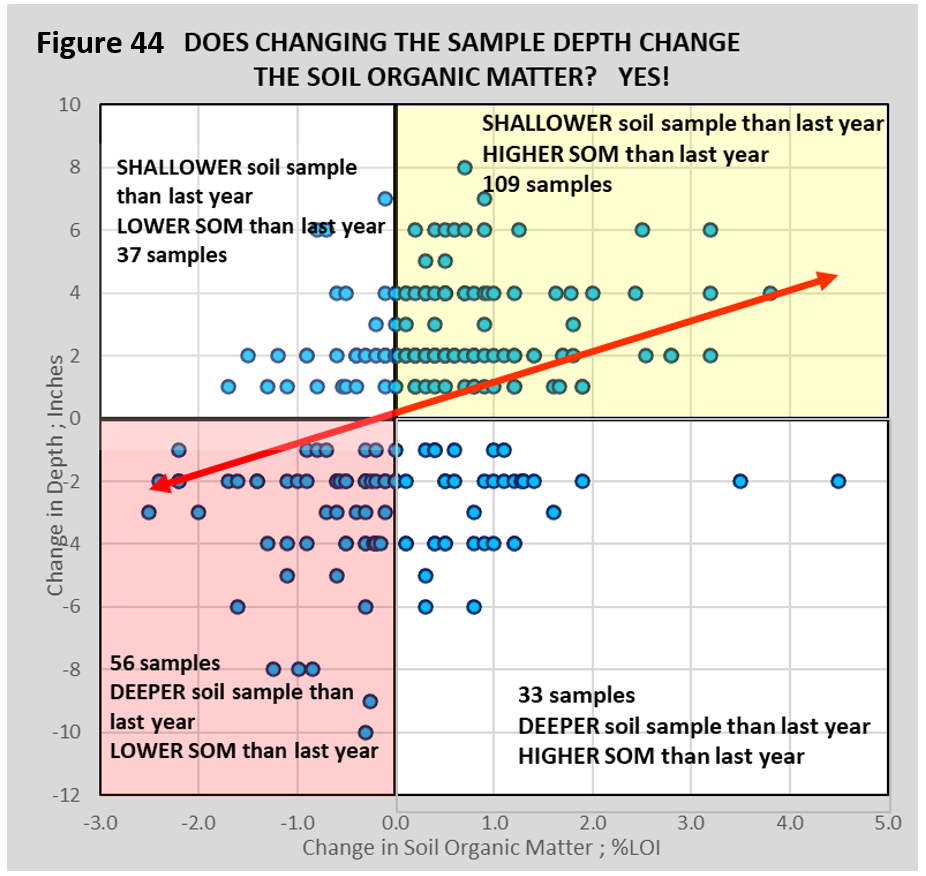
However, the data points in this graph were widely scattered, and 30% of the data points fell outside of these 2 colored quadrants. If sample depth were the only thing affecting SOM, you would have seen all the blue dot data points much more closely clustered around the red trend line, with very few data points in the two white quadrants. That is not what our data showed. That meant that other things besides sample depth (management, inputs, environmental factors, etc.) were also affecting the variability we saw in SOM.
#6D: CHARACTERISTICS OF HIGH VARIABILITY VS LOW VARIABILITY SITES
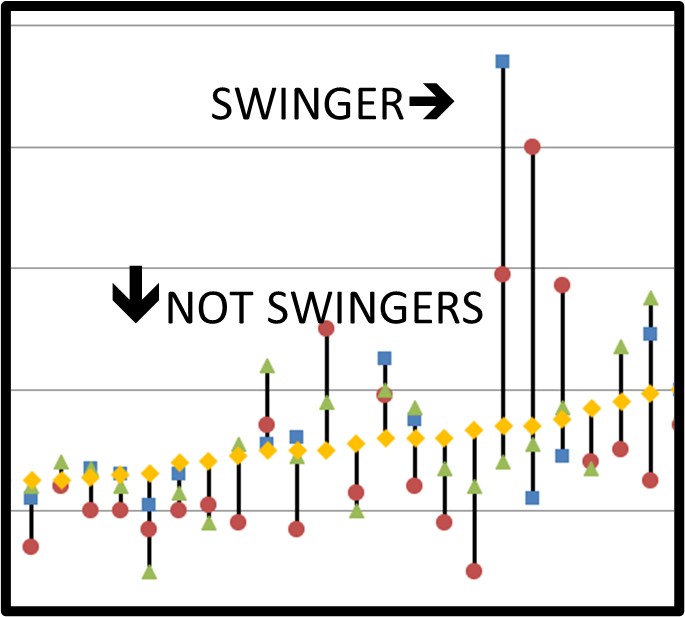
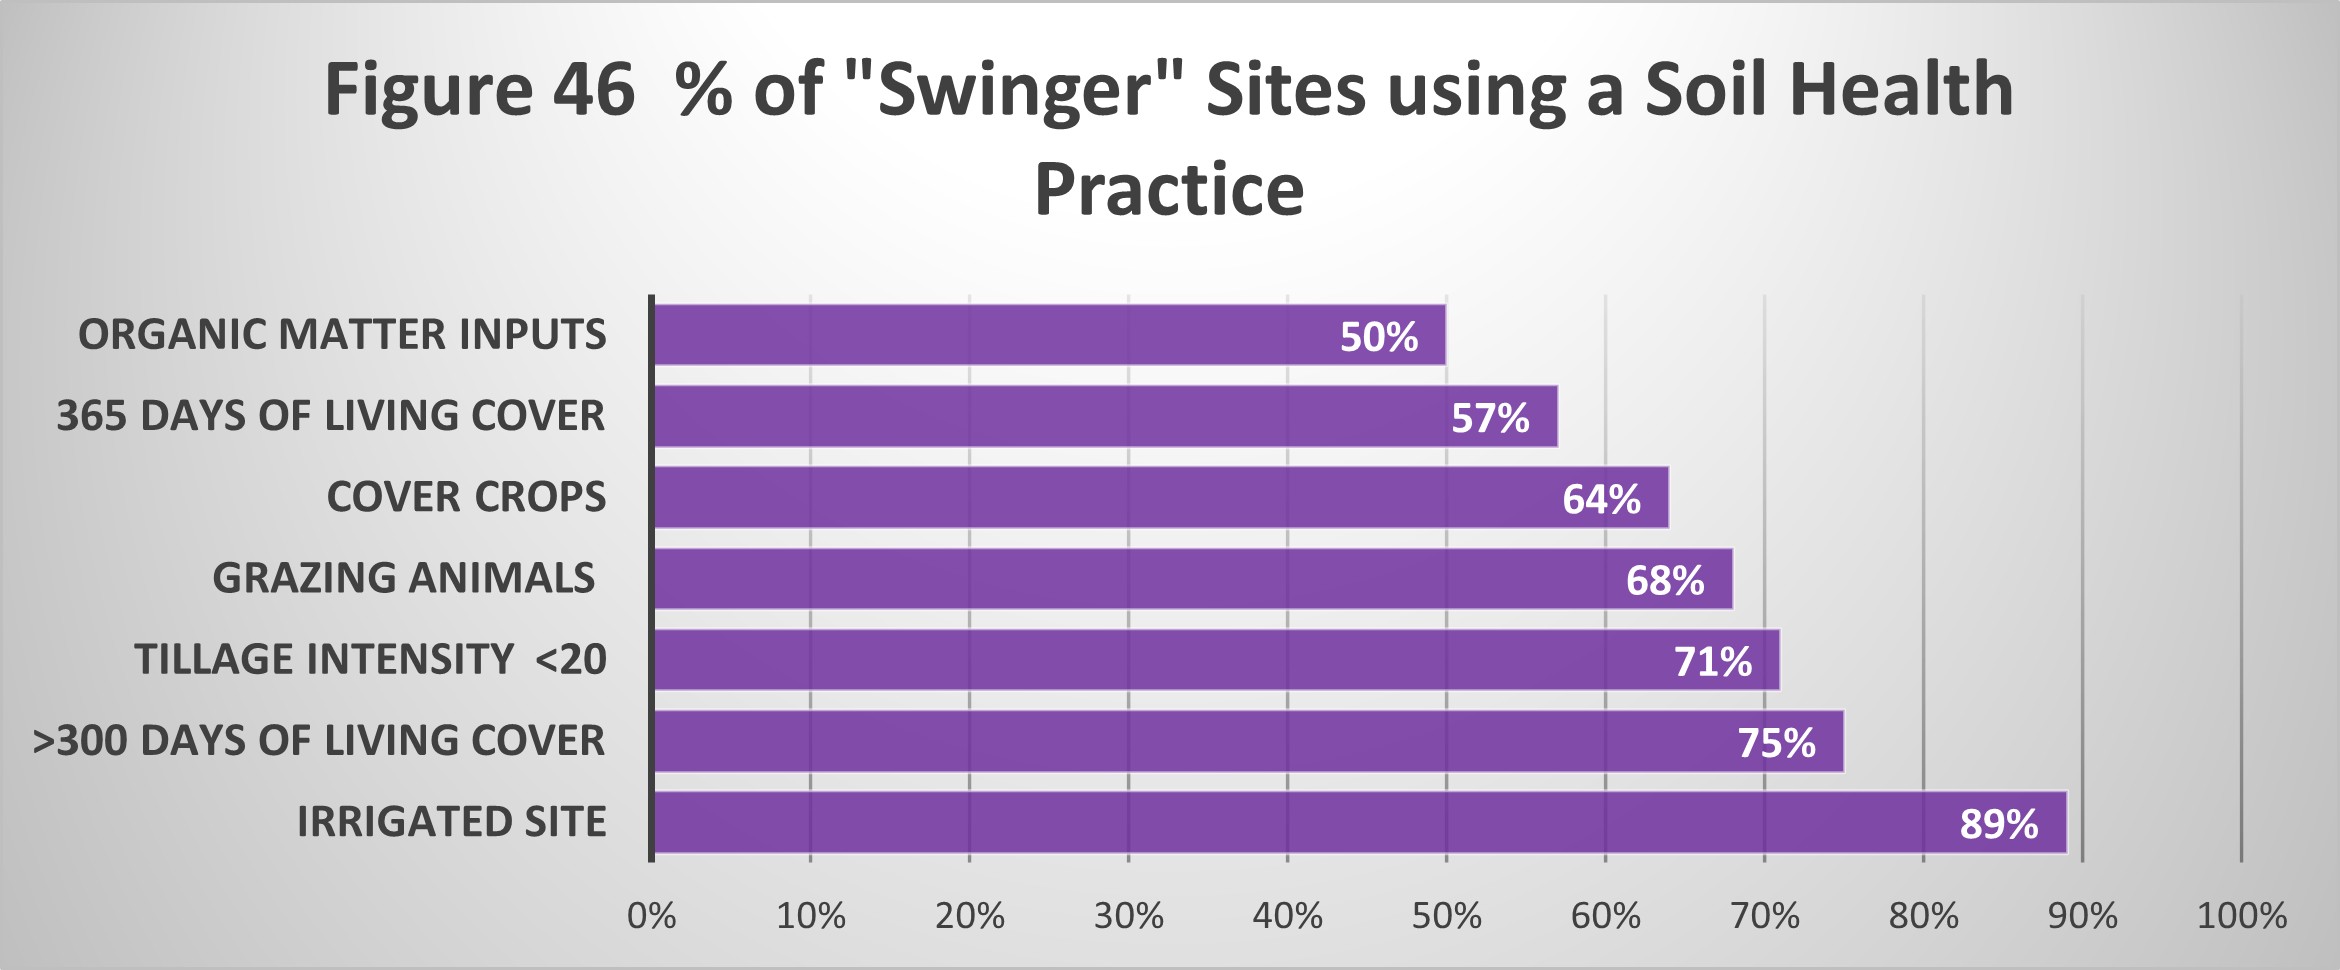
In 2022 we examined the 28 sites which had the most variability in their soil health scores. We called these sites our “Swingers”, and they were evenly split between organic and conventional growing methods. Over half the “Swinger” sites were pastures with the rest split evenly between home gardens and commercial vegetable sites. Their most common crop was grass hay with mixed vegetables coming in second. Their average water season was 127 days long. “Swinger” sites had an average soil health score of 27.6, which is very high, especially for Colorado. The growers of these “Swinger” sites were all Soiley Award winners or nominees. They had adopted many soil health practices, as you can see Figure 45 and Figure 46.
The lesson seemed to be that no good deed goes unpunished. It seemed that one result of adopting good soil health practices was a great deal of variability in soil health lab results. If you see your Haney test results bouncing around a lot, year-to-year, it does not necessarily mean that you are doing anything wrong. It may mean that you are doing many things right.
In 2023, we looked at the 103 sites for which we had 4+ years of data, and compared the sites with the most variable soil health scores (our Swingers) with the sites with the least variable scores (our Parked sites). We calculated the Percent Relative Range ((maximum score minus minimum score) divided by average score) of soil health scores for each site, and compared the 28 sites with the largest Percent Relative Range (our Swingers) with the 28 sites with the smallest Percent Relative Range (our Parked sites). Several significant differences became apparent, as shown in this Figure 47.
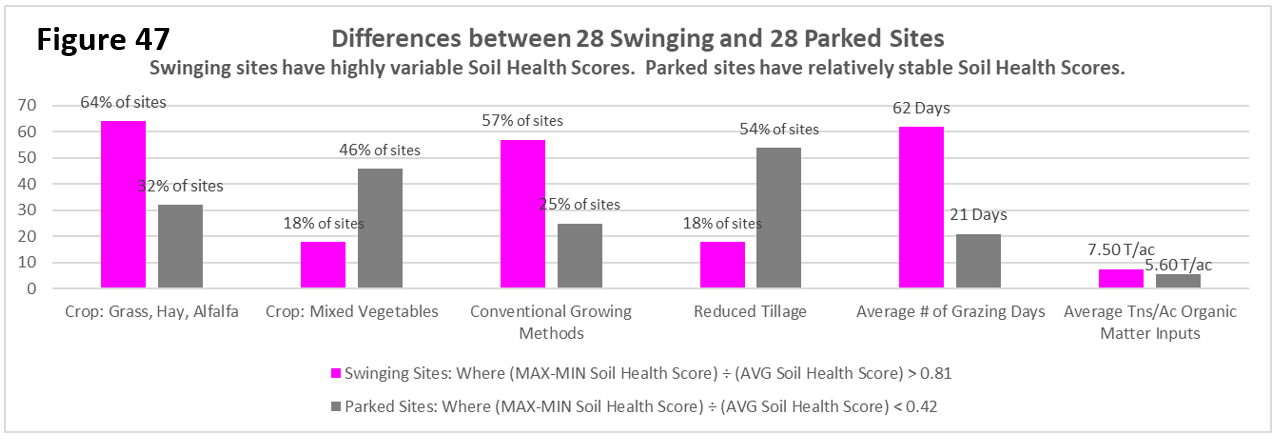
2/3rds of Swinging sites were pastures, and the majority of Swinging sites used conventional growing methods. Swinging sites also applied an average of 7.5 T/acre of organic matter inputs, almost half again as much as Parked Sites at 5.6 T/ac. Almost half of the Parked sites grew mixed vegetables and used reduced tillage. The most significant difference between the 2 groups was that Swinging sites had 3 times the number of average grazing days as Parked sites. While Swinging and Parked sites had the same numbers of sites with grazing animals, Swinging sites had animals grazing on-site for a much longer period of time. These findings supported our 2022 findings that more grazing animals and organic matter inputs increase variability.
Research outcomes
Our recommendations for sustainable agricultural production and future research:
-
- We have uncovered some intriguing trends in soil health testing results that warrant further investigation. (We did not have the statistical skills to definitively prove that these trends were true.) We hope others are able to investigate the following trends in more depth.
- More grazing days and greater organic matter inputs correlate with more variability in soil health test results.
- It is very difficult to improve the soil health scores of "Excellent" soils, but you can make more, deeper "Excellent" soil using soil health practices.
- We need a program to teach local Ag advisors how to interpret soil health tests and how to advise growers based on those results. In 2021 after receiving 3 years-worth of soil testing results, only half of our participating growers understood their test results and which actions were indicated. They were more interested in what actions they needed to take than their actual test results. It was hard for some of them to make the jump from a lab test result to a recommended action. Many of them needed someone to help them interpret their soil testing results and recommend actions. Their #1 desire was for an individual consult with a soil health expert who could interpret their tests and recommend practices. However, soil health testing is relatively new and many local Ag advisors are not familiar with the tests and don’t have experience interpreting them. We desperately need a soil health training program for Ag advisors at the local level.
- A 3-year-long project (which is all most grants fund) is just too short. Trust building is key to making a project like this work, and trust-building takes many years of persistent human contact. It is good that our project is 10 years long.
- Our soil testing program had some beneficial results for some growers, but its main benefit was as a catalyst for conversations. The testing provides an excuse for folks to get together and start the conversations, but the conversations are the important thing when you are trying to change practices.
- Conversations and information sharing between growers is where the real change happens. Our point of view has been and continues to be that our growers each have part of the answer to how to improve soil health. Getting them talking to each other and sharing their information is the key to success. It is the information sharing through annual meetings, farm field days, short videos of CSSHP growers discussing their solutions, photos of others’ fields, and more, where the change happens. It can take years of relationship-building before someone is comfortable sharing what hasn’t worked on their farm and asking for advice.
- We have found that water is key to improving soil health in the arid West. Western research should be focused on how to maximize water yield for Ag in a time of dwindling supplies. Much of Western Ag is supplied with Colorado River water, including our area, the Colorado Front Range. We all know that water travels uphill to money, so as Colorado River water becomes scarcer, Ag-water will be gobbled up by urban areas, leaving Ag with less supplemental irrigation water while climate-change-induced droughts and heat require more water for thirsty crops. If we want to improve our soil health rapidly in the West to cope with future droughts and floods, we need to maximize our water yield so that each bit of water provides the most beneficial use to the largest amount of land as possible.
- We have uncovered some intriguing trends in soil health testing results that warrant further investigation. (We did not have the statistical skills to definitively prove that these trends were true.) We hope others are able to investigate the following trends in more depth.
GRANTS AND COLLABORATORS: We secured a generous partnership grant from St. Vrain and Lefthand Water Conservancy District, and a small grant from the Boulder County Sustainability Food and Agriculture Fund, which we have used to expand our educational outreach. We receive an annual stipend from City of Boulder Open Space and Mountain Parks for our research with their lessees. We have also received 6 very generous anonymous private donations. We added 6 growers to our 47 growers and lost 4. We now have 49 growers participating in the project and will not accept any more growers unless others drop out.
Education and Outreach
Participation summary:
EDUCATIONAL OUTREACH
We have exceeded our educational outreach goals in some areas but not in others. Goals we have reached include:
- Website: In August 2022, we built, published and publicized our website, SoilHealthProject.org, which included our goals, processes, supporters, grower profiles, findings, articles, forms, and links to our videos on our You-Tube channel. SoilHealthProject.org garnered over 800 views in 2023 and over 600 views in 2024.
- Year-End Reports: In February 2022, 2023, 2024, and 2025, we distributed our Year-End reports to all our growers, advisors, donors, and supporters (179 people/groups). Our Year-End Reports included our annual progress, upcoming goals, stats, finances and research findings. 2022 YearEnd Report2_12_23; 2023 YearEnd Report2_7_24; 2024 YearEnd Report_2_17_25
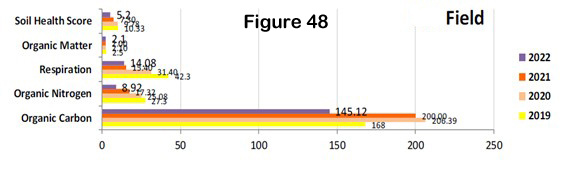
- Individualized Progress Reports: In February 2022, 2023, 2024, and 2025 we compiled and distributed individualized progress reports for each of our growers, showing them how their results compared with their peers on 10 soil health indicators and 3 soil health practices: Days of Living Cover, Tillage Intensity and Organic Matter Inputs. We also included Figure 48 showing them their changes over the 6 years of the project for 5 soil health indices: soil organic matter (SOM), respiration, organic nitrogen (WEON), organic carbon (WEOC), and soil health score.

Figure 48 Yearly Progress Graph - Soiley Underwear Challenge: In 2023, we held an underwear challenge, with a $500 cash prize for the most disintegrated pair of undies. Growers were encouraged to bury a pair of tidy whities and send in a photo of the deed to enter the contest. 13 growers entered the contest last summer. 4 couldn't find their buried undies in the fall. In all 12 pairs were successfully excavated and entered in the contest. 2024 Annual Meeting attendees voted for the most disintegrated pair, and awarded the $500 prize to the daughter of a CSSHP grower, 7 year-old Mae who says she will use the money to buy some pigs.
- Soiley Awards: Our annual Soiley Awards always included an educational component. For exaple, here is the announcement for our 2022 Soiley Award winner: "The Soil Organic Matter Award, goes to the grower with the highest soil organic matter this year. Soil Organic Matter helps form stable soil aggregates, improves water-holding capacity, and provides a slow release of nutrients. Our winner regularly applies homemade compost every spring, disturbs her soil as little as possible using only a broadfork, and regularly plants a fall cover of oats and clover…”
- Community Outreach:
- In July 2022, we reported on our progress to the St Vrain and Lefthand Water Conservancy District board meeting of approximately 30 growers and Ag professionals.
- In 2023, 2024, and 2025, we reported our annual findings to both the Boulder Valley and the Longmont Conservation District Boards, which included 12 of our leading growers, and 8 staff members.
- The CSSHP was featured in the Boulder Community Foundation Environmental Affinity Group’s winter newsletter in March 2024 that was sent to 235 people.
- In 2023, we displayed the soiled undies from the Soiley Underwear Challenge at Boulder's Soil Revolution Conference, along with signage describing each site where they were buried. We held a popular vote for the most disintegrated pair and 48 people filled out ballots. Approximately 300 people attended Soil Revolution in 2023 and saw the display.
- In 2024, we presented information to Ag professionals and farmers/ranchers about the CSSHP at a "Grant and Grow" workshop in Larimer County CO, a "Network Smart Extension Webinar" at UC Davis CA, and the Soil Health Advisory Committee of Larimer County CO.
- Farm Field Day in 2024: The CSSHP hosted a well-attended, hot and smokey Farm Field Day on 7/31/2024 at Michael Moss’s Kilt Farm and John Schlagel’s Niwot Farms. 41 farmers and ag professionals attended. Niwot Farms and Kilt Farm have taken very different approaches to improving their soil health and running their operations. A full report of the Farm Field Day is at Farm Field Day Report 7_31_2024. We toured the 2 farms, heard from each grower who answered many questions about their management, divided into small groups and dug small soil pits to score each farm’s soil using the Colorado NRCS Soil Health Cropland Resource Concern Assessment v. 1.8 (SoilHealthScoreCard Farm Field Day 2024), and after dinner conducted a slake test of 2 soil samples from each farm.
- Annual Meetings:
-
Our third annual meeting (2/22/22) for our participating growers and local Ag staff was both in person and on Zoom. 35 people attended. Outside speakers and CSSHP growers discussed various ways to maximize water yield, including:
- Christine Newton NRCS: Increasing water infiltration by increasing soil health.
- Sharcy Ray NRCS and Paul Schlagel: NRCS funding for water system upgrades and soil health initiatives.
- Joel Schneekloth CSU Extension and Michael Moss: Soil Moisture Monitoring Technology
- Sean Cronin SVLHWCD: Funding available from SVLHWCD for water system upgrades
- Jim Snow, Catherine Long Gates and Cody Oreck, Silver Lake Ditch: Lining Irrigation Ditches https://youtu.be/wMgcMM2TPXg
-
Our 4th Annual meeting (2/16/23) for our participating growers and local Ag staff was both in person and on Zoom. 32 people attended. 3 CSSHP growers discussed various soil health practices they are using, followed by lively Q&A sessions with attending growers. We were able to get voice recordings of our speakers from Zoom and made 3 amateur videos of our speakers from their slides and voice recordings. 2022 YearEnd Report2_12_23
- Jerry DeBruyne of Bar J Quarter Circle: NRCS Funding for Livestock Tire Tanks https://youtu.be/2wHeUlfWkQ4
- Bob Condon of Cottonwood Farms: Cover Crops for Pumpkins, https://youtu.be/-DKXKHAlCKQ
- Vanessa McCracken and Jules Van Thuyne of Van Thuyne Farms: 2021 and 2022 corn test plots,: https://youtu.be/d0RdEhnl9-g
-
Our 5th Annual Meeting on (2/20/2024) included presentations from 5 CSSHP growers on strategies they are using to improve their soil's health. The meeting was in-person only. 35 CSSHP growers and 6 Ag professionals attended. Attendees were very relaxed. Conversations were animated and extended. We made 5 videos of our speakers and published them on our You-Tube channel. 2023 YearEnd Report2_7_24
- Dave Asbury of Full Circle Farms: Boulder County’s Sustainability Grant Funding for Organic Grain Storage https://youtu.be/9p8NPj2sqVc
- Bill Howland of Nine Mile Ranch: Applying Wood chips to Hay fields to Improve Soil Health https://youtu.be/mDwNUo6n0hk
- Dan Murphy of Boulder Better Wagyu: Soil Health Upgrades to Neighbors’ Lands for Grazing Trade https://youtu.be/ab1t1Z9PKbE
- Larry Lempka of Los Rios Farm: Cover Crops and the Mysterious Disappearing Kochia https://youtu.be/-QDEeCrHs1o
- Zach Thode of Lehi Ranch: Results of a Corn-Intercropped-with-Alfalfa Grazing Experiment https://youtu.be/V8d9kY2VcKU
-
Our 6th Annual meeting on 2/26/25 included a panel on Rotational Grazing, led by Vanessa McCracken. 2024 YearEnd Report_2_17_25 3 CSSHP growers described their rotational grazing experiences and knowledge, including
- Jason Condon of Isabell Farm: Aftermath Grazing Contracts
- Karel Starek of The Golden Hoof: Adaptive Multi-Paddock Grazing
- Cameron Genter & Daphne Kingsly of Light Root Community Farm: Pasture Management
- Andy Steinert of Ft. Morgan NRCS spoke about “pH Challenges for Front Range growers and what to do about them”.
- 6 CSSHP growers described how they have made progress improving their soil health since they enrolled in the CSSHP, including Travis Rollins for Dryland Grains, Todd & Steve Olander for Commodity Crops, Zach Thode for Commodity-Pasture Rotation, Bill Howland for Grass-Hay-Pasture, John Martin & Kayann Short for Commercial Vegetables, and Elizabeth Black & Chris Brown for Home Gardens.
-
- Small Group Exercises; Practice Interpreting Soil Health Tests: At our growers' requests, we included small-group break-out sessions to practice interpreting soil health tests and gain a better understanding of what the lab results meant at our 2023 Annual Meeting. See Coolios Corn for an example of a soil health test that we used for practice interpretting.
Small Group Exercises Interpreting Soil Health Tests -
Videos: We now have 17 videos on our CSSHP You-Tube channel featuring CSSHP growers and other soil health speakers. We will be adding 3 more videos this summer of 3 speakers from our 6th Annual meeting. Our You-Tube channel got 9094 total views in 2022, over 19,000 views in 2023, and 6963 views in 2024. Our channel has 380 subscribers. Our top video in 2024 is Aerated Static Pile Composter at Long's Iris Gardens with just over 5000 views since its publication in 2023. Videos include the 9 listed above plus:
-
- Randy Pistachio on the Aerated Static Pile Composter at Long's Iris Gardens: https://youtu.be/i07WJRg-dYA
- Soil Erosion on Boulder OSMP Land with Prairie Dogs: https://youtu.be/T8772QvgDzA
- Elizabeth Black on Seedling Tree Survival Tips for Colorado's Front Range: https://youtu.be/SwBMO3zvJ4c
- Dale Strickler discusses cover crops for the semi-arid Front Range: https://youtu.be/lX8xxuKyNRw
- 4 CSSHP growers relate their experiences with cover crops: https://youtu.be/Zushgp1HQak
- Lance Gunderson explains the Haney soil test: https://youtu.be/buWErVOQSTw
- Lance Gunderson explains the PLFA soil test: https://youtu.be/ueD_4yvnWq0
- Jules Van Thuyne discusses water conservation for Colorado corn: https://youtu.be/vnPs8SgM5m4
We continue to search for more ways to increase information exchange between our growers. Strategies we have tried included introduction games, a slide show of growers' cover crop photos, an annually updated and distributed contact list of all CSSHP growers, potlucks, contests and humor. We also try to connect a grower with another grower who has dealt with a similar problem, when the opportunity arises.
Educational Goals we did not accomplish include:
-
- Recommended Action Reports for our growers: We were unable to complete this goal. When we ran this idea by local conservation district staff and other Ag professionals, they said that they were already overtaxed with their current work load and they could not take on any additional work. We will continue to try to find ways to address this need that our growers have expressed while working within the limitations of local resources.
- Public Outreach of Findings at the Soil Revolution Conference: Organizers of our local Soil Revolution Conference told us that the agenda had already filled with other speakers in 2022, 2023 and 2024.
-

CSSHP Growers Evaluations of the CSSHP
In March of 2024, we polled our 50 CSSHP growers, asking what has been helpful (or not) about our various CSSHP events. 34 CSSHP growers responded. See 2024 Poll Of CSSHP Growers for all responses. Highlights of responses include
- 91% of respondents said their knowledge about soil health had increased since they had been in the project.
- Growers rated CSSHP activities according to how helpful they had been. Our top 6 activities, in order of most to least helpful were:
- #1:Color-coded Haney and PLFA soil testing results
- #2: Annual Findings and graphs
- #3: Our website: SoilHealthProject.org
- #4: Individualized Year-End Progress Reports
- #5: CSSHP Every-Now-And-Then Email News
- #6: Socializing with other growers at CSSHP meetings
- Our least helpful activities according to our growers were:
- Outside speakers from out of state and government agencies
- Our first Farm Field Day in 2021 which few attended
- The underwear challenge
- The small group exercises interpreting soil tests
- Our Growers said the ways we could improve the CSSHP and make it more useful, in order of most to least helpful, were:
- #1: More individual consults with soil health experts
- #2: More CSSHP growers telling them about soil health successes/failures
- #3: More help with funding for soil health improvements
In March of 2025, we surveyed all participating CSSHP growers again about what they had learned from the CSSHP, their current soil health practices & beliefs, soil health grants they had applied for, and grower relations. All our CSSHP growers filled out a baseline questionnaire at the beginning of our project. Their initial questionnaires asked:
- What is the initial question that you want your soil health test(s) to answer?
- What is a soil health management change that you want to monitor with soil health testing?
Our 2025 survey asked our growers about these previous questions, to find out what our growers had learned and how we did. 36 growers responded. When reminded of their initial question, 86% said the information they got from the CSSHP soil tests and annual meetings helped them answer their initial question, and 14% said it partially helped. When reminded of the soil health management change that they wanted to implement at the beginning of the project, three quarters said they had implemented it and the other quarter said it had been partially implemented.
CSSHP Growers Evaluations of soil testing results
Our 36 poll respondents said they had learned the following from their soil test results:
- Initially my SOM increased rapidly, but it has stabilized somewhat recently. Last year's drought was probably a factor.
- Seeing the difference from one year to the next on the soil reports.
- Our soil in this test plot generally tests average to good, with some deficiencies
- The results provided insight into the trajectory and speed of changes when prairie dogs start colonizing a property or are removed from a property. The changes in the test results over time also aligned with observation of soil health when taking the samples (aggregation, bare ground).
- For the native grassland/wetland samples, we are unable to answer this question because of a lack of adequate replication by vegetation type and management practice but we anticipated this. We did, however, see some broad differences among native veg types and between native veg types and agricultural and prairie dog sites. Our analyses focused on soil carbon initially.
- Confirmed largely what we knew was happening or expected to be happening but with a more complete understanding.
- How high my pH was and the lack of some important nutrients.
- My practices, while may not be considered regenerative because I till, have slowly moved my soils forward. This data helped me verify the anecdotal data I see in production and presence on my farm.
- There are many more factors that influence soil health than just nutrient analysis
- It takes time, cover crops and water
- I think we've seen some variation across years, so the jury is still out but in general there wasn't a dramatic difference between areas that have seen forests treatments and those that haven't. We probably need to dig deeper into the reports and look for variations.
- My soil is pretty good for Colorado soil, and my work for the past 20 years has been worthwhile. While the pH is still quite high for a vegetable garden, the soil test results help me make adjustments to my soil practices to address the higher PH.
- The landscape fabric was preventing organic matter from getting into the soil underneath the fabric and the soil health indicators and SOM were significantly lower under the fabric than in the grass next to the fabric. In the vegetable garden I discovered that my current management was maintaining high soil health scores successfully.
- That it is a learning curve each year. The test results have really helped us to see what the trends are from year to year as well, like seeing if the practices we implement are working or not. The soil testing has really helped us with our management plans in growing both in and outside the greenhouse.
- We changed some of our practices to improve Microbiology.
- The soil health was not as good as I thought it would be.
- Many sites in our area are battling the same soil issues.
- I believe our soil is good for pasture but could be improved as some locations are irrigated pasture.
- I don't know that I still really have a baseline of understanding. I see a lot of variation in testing over time between my fields. I still find soil tests really confusing, but overall I have gotten better at seeing some trends and our farm has gotten better at consistent systems to improve our overall soil health.
- It is a slow process to make progress on soil improvement. Drought doubles the time.
- The answer is not a simple solution, soil science and improvement are a complex issue.
- I needed to balance my N and Phosphate input based on soils tests
- Whether improvement is achieved
- Our Organic matter is increasing on most of the property we manage
- Results explain OM and salinity
- What improved farming techniques can we use to improve soil health?
- All nutrients for the soil each year to see what we needed to add
- I learned that we had a phosphorus deficiency from relying on strictly green cover
- Learned that the data is still pretty subjective but still somewhat helpful
- More effective irrigation helps soil health a lot more than tillage hurts it.
- We found out a lot about soil composition and soil health
- There are many variables in soil health and production capacity. The most interesting thing for me was to learn about soil health across irrigated and not irrigated growing spaces.
- Yes, you can improve soil health
- I discovered that cover cropping was susceptible to all kinds of challenges despite my best efforts. Rats at the seed, late planting and hard winters killed seedlings, tarping was difficult, and the timing of turning in covers needed to be done before they got too big in the spring.
- We incorporated cover crops as a major change since kids could see the crops actually growing and ask about them. We don't have a detailed lesson plan yet for teaching as of yet, but we are getting there. We now have several years of soil test results so we can start incorporating a more detailed soil analysis into some of our programming. We are getting it together piece by piece and the soil test results are the backbone for getting this created.
- By improving our irrigation, we were able to increase cover crop effectiveness.
- This field had both Canada Thistle and Cheat Grass, growing alfalfa and cutting before the weeds went to seed really helped lower weed pressure.
- We use less chemical/fertilizer when basing practices on soil testing
- Communicating with local producers and overall research on regenerative agriculture and soil improvement tactics are important.
- Phosphorus is high for a lot of folks in our area. We can still be successful. I think overtime our compost source but also our farming practices will help with this.
- Still learning. Still refining and still testing. One major thing learned is that many people have differing opinions, but there are no test results. A small group applied for a SARE grant to get some tangible results on arid land and now it is time to fabricate the test as the grant was approved.
- I have more questions along with a lot of answers.
- Less phosphate. Added sulfur. Also started some 3-year rotations on 4 acres
- That we are making steady improvement
- There are no immediate results from any of the practices. It takes time to see the soil change. The hope is to reduce synthetic fertilizer with the use of compost, this is a slow transition also.
- A very short time has passed, but the trend shows improvement in soil health
- Soil health improved.
- Fertigation was a time saver
- That the addition of even a small amount of composted dairy manure to the green manuring practices we already used resulted in dramatic soil balance improvements.
- One of the most important factors is feeding microbial life
- Irrigation at the right time and amount helps soil health more than tillage hurts it.
- We learned the value of adding compost and we learned about other soil health principles
- Well, I won a Soiley award this year for biggest increase in organic matter. So, I learned that if you take an unirrigated plot, and add plants, water, and compost for two growing seasons, you can increase the organic matter in your soil significantly in a short period of time
- Kind of a mixed bag but do believe it is helping
When asked about what they had learned from the Haney test, growers said:
- grazing is important for the microbe counts
- I'm seeing some improvement.
- I have just been keeping track of the health, if it has increased or decreased over the years
- that cover cropping and composting practices and longer living root increase overall soil health scores
- These tests have been so valuable, but most valuable was about nutrients limiting primary productivity (mostly P, some K, S, Zinc)
- More info than I generally know what to do with but generally seeing improvement even over some rough weather years.
- How high the pH of my soil is and the lack of some important minerals and nutrients such as iron and zinc.
- There is great variability in testing and test results from different labs
- It's complicated, some values have improved, and others have gotten worse, for whatever reason
- We are improving, water helps!!
- Fairly consistent soil health scores across treated and untreated forest stands.
- It takes a long time to change the soil makeup. PH stays stubbornly high for years. Addition of manure to garden soil must be carefully managed.
- There's lots of variability of organic matter increase
- I have been doing a pretty good job of maintaining and improving my soil's health. Don't stress about the variability. Expect test results to jump around from year to year.
- YES! So much!
- General soil health information.
- It takes a long time to have major improvements.
- We need to be applying more product to lower pH
- That year-to-year soil results are not something that we should put a lot of weight on and its more important to track information across multiple years.
- Not sure, results are sort of inconsistent from what we see in the field, so I find the soil test results challenging to learn a lot from.
- How to evaluate the findings. How my soil improved with certain practices. The importance of the water cycle.
- Residual fertilizers in soils
- Efforts yield results
- How much nitrogen is available the soil, microbial potential and organic matter.
- shifts in carbon and nitrogen balance
- Detailed information about soil health and areas to improve
- That we needed to address that phosphorus deficiency
- feed the microbes, too many variables going on to draw specific conclusions. Trend line is useful
- What are the physical characteristics of my soil.
- Lots of great information, things that are just good to know about what nutrients are in our soil and at what quantities.
- I need more long term testing
- difficult to determine
When asked about what they had learned from the PLFA test, growers said:
- Results have been quite variable. May have to do with sample depth.
- our crop field was below average on fungi and bacteria
- These have been more of an "oh, ok", but haven't really influenced management decisions.
- Confirmed what was expected - maybe dropping the PLFAs.
- That I still have work to do on the soil biology on my farm.
- We are improving, water helps!!
- Drops in fungi and microbial activity across forested sites. Swings in moisture and temperatures may be at least partially to blame but 2 samples likely isn't enough to identify a trend.
- Fungi remain a challenge and it's hard to increase their numbers.
- Yes! So much!
- Specific results about microbiology.
- My soil is lacking some micro-nutrients
- Continued aeration is needed
- Not sure, results are sort of inconsistent from what we see in the field, so I find the soil test results challenging to learn a lot from.
- How to evaluate the findings. How my soil improved with certain practices. The importance of the water cycle.
- NPK differs compared to standard soil test and microorganism fungi
- Reduced fertility in soils
- Hard to interpret
- Community composition and reassurance of healthy populations
- Detailed information about soil health and areas to improve
- These are much more nuanced and are providing background information that continues to accumulate.
- Strive to add fungi
- What biological activity is going on in the soil.
- It's very helpful to have documented proof that we are improving our soil.
- I need more long term testing
- I need to spend some more time reviewing
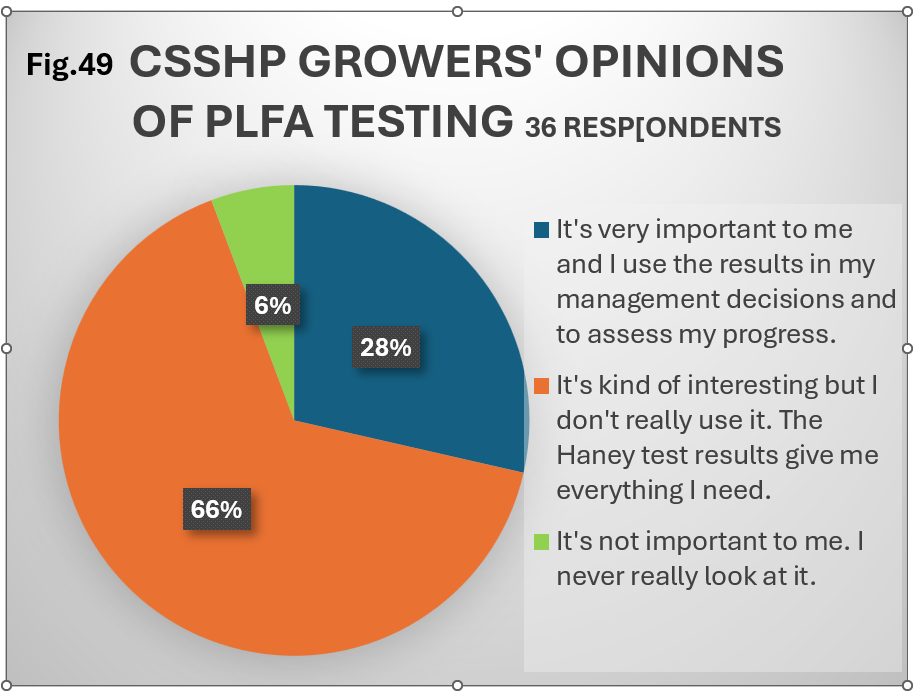
In general, most CSSHP growers find the Haney test more useful than the PLFA test, as Figure 49 shows. 28% of CSSHP growers use the PLFA to make management decisions, but most just find it “kind of interesting.” We plan to continue offering the PLFA every other year as long as funding allows.
HOW GROWERS USE THEIR SOIL TEST RESULTS AND PROGRESS REPORTS
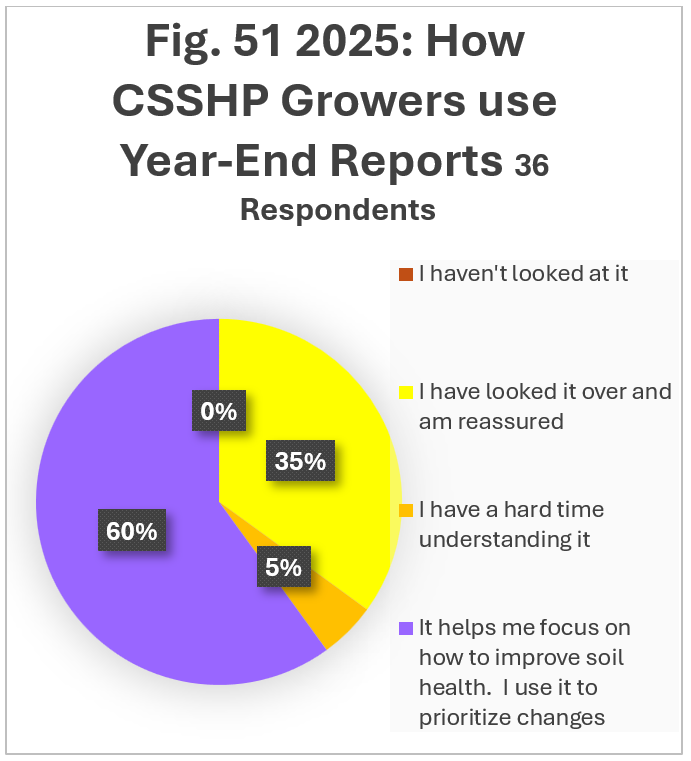
In 2025, CSSHP growers reported small but significant changes in how they use their soil test results and year-end progress reports, compared to how they used them in 2021. For the soil test results, more growers now prefer another soil test or consultant (14% now vs 5% previously), more growers have found someone to interpret the test for them and advise them (22% now vs 15% previously), fewer growers have a hard time understanding the soil test results and what to do (16% now vs 28% previously), slightly fewer growers have figured testing results out and know what to change (44% now vs 52% previously), and more growers don’t look at their test results (5% now vs 0% previously). For the year-end Progress Reports, fewer growers are not looking at their results at all (0% now vs 7% previously), fewer growers are having a hard time understanding their report (5% vs 10% previously), more growers are reassured that they are doing well compared to their peers (35% now vs 29% previously) and more growers are using their Progress Report to improve soil health and prioritize changes (60% now vs 54% previously). Figure 50 and Figure 51.
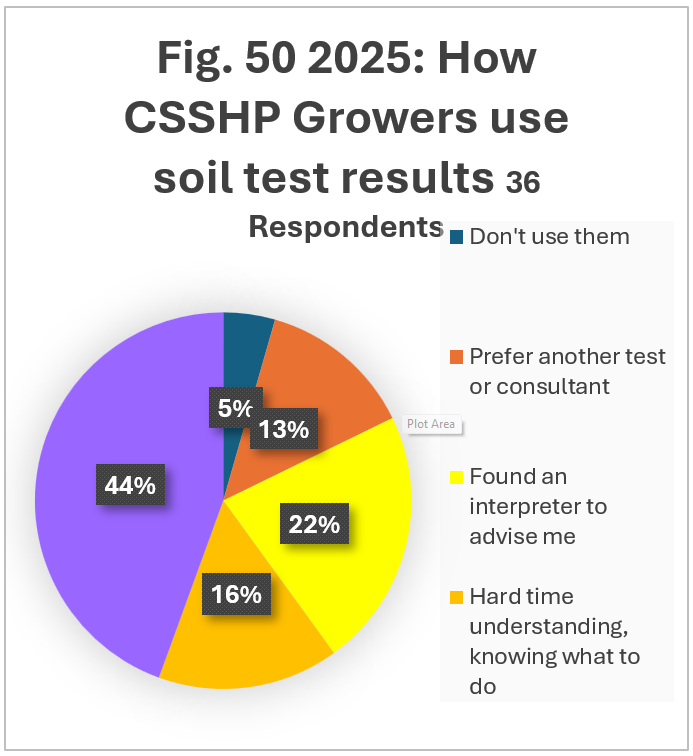
Some of these changes we see may be because after 6 years, our soil health testing is no longer the shiny new thing. Some growers may be going back to familiar testing methods. Growers may also be answering more honestly now. However, it is encouraging that the percentage of growers who don’t understand their tests and reports is decreasing, and the percentage of growers using their year-end Progress Reports to prioritize changes is increasing. The year-end Progress Reports focus more on practices, which may be why we have seen more positive changes in how growers use these reports than in how they use their soil testing results. Our growers have told us many times, in many ways that they want advice on practice changes.
Education and Outreach Outcomes
Educational Outcomes
CSSHP GROWERS’ CHANGES IN SOIL HEALTH PRACTICES
52 growers (all but 2 of our participating growers) reported changes in their soil health practices between 2022 and 2024. One grower did not make any changes at all, and one was already using many soil health practices and did not add any additional practices during the project. Changes are listed below, with each numeric listing representing one grower.
- Our use of manure has been validated by the test results. Approximately 22-25T per acre manure. We also Added 25T/A of Organic Compost another year.
- Leaving a field in no-till cover crop.
- Put compost down in November. More no till and vertical till. I didn’t harvest any straw this year; just stays on the field for organic material.
- Deep Mulch - 4-6" deep.
- Planted cover crops earlier this year but problem with rats digging up and eating seed. Changed to Green Cover seed for fall mix; Added summer straw mulch to most beds. Heavy leaf mulch on beds in fall. increase time between grass mowings. More turf and compost moved under landscape fabric. More mulch applied. Tarping of cover crops.
- Minimum till
- Cover crops and soil amendments such as chicken poo (in pellet form), cow/sheep manure, and moss. We are also more careful about when and how we do our tillage. We have also been doing more companion planting and natural insect mitigation measures. Marigolds with tomatoes for horn worms. We have also been more intentional about crop rotations within the greenhouse beds. Planted cover crops--vetch and pea on 1/24/24
- We have gone all in on cover cropping as that seems to give our best results. Stacked year-round cover crops. Mowed or crimped cover and drilled new seed into terminated cover.
- We increased cover crops, introduced animal grazing, and converted to perennial pastures. We added rotational grazing to the Site.
- Manure; rotational grazing
- I have attempted to plant grain crops with a standard grain drill with poor results. I do believe the soil has mellowed a bit, but this Spring I am taking delivery of a no till drill.
- Cover cropping 3/4 ac; leaf mold compost and amendments; inoculation with mycorrhizae; decrease P inputs; biochar, cover cropping in walkways; No-till planting in tunnels
- We are utilizing more organic fertilizers, I.E. utilizing fish poop from fish farms. We have been slowly reducing our use of herbicides. We continue to use the same sand and organic material mix. We are also utilizing a carbon-based organic acid to help feed and promote microbial activity in the soil. We started using a product called Green Fin. It is an organic fertilizer based off of fish manure. It has active bacteria that helps to boost the soil’s natural nitrogen cycle.
- In 2024 we spread a horse manure-based compost over our largest pasture. We intend on continuing this practice in the future. Flood irrigation and rotational grazing
- Got grant for soil amendments, mineral balancing, ph balancing and compost but they might not be applied on this field
- Compost spreading and grazing
- Applied less fertilizer. Cut out a couple of acres of invasive Russian Olives. Using a thick bed of wood chips to prevent regrowth from the roots and stumps.
- Last year I started using a growth regulator and I am going to start using my fertigation system more. I have made sure to be more consistent with aeration and slicing. Pulled cores in the fall. Running the Aerway twice a year instead of once a year.
- Less tillage. Attempted to mow a cover crop, solarize and use as a mulch to plant transplants into- was not successful. We tried planting a cover crop, mowing it down, not tilling, and then planting the winter squash transplants into that. Switched over this area to permanent no till beds, used for the first time this year. Planted a cover crop, tried to terminate by crimping and then planted into it. Using high quality compost at end of season.
- increased cover cropping to improve soil health. We attempted a summer warm season cover crop planted in mid-May 2024, but due to drought conditions the cover crop did not germinate, so we summer fallowed, disced and planted fall cover crop of rye/wheat and peas and radish.
- There has been a lot more support for removing prairie dogs from irrigated fields and support for reinvesting in these properties to improve soil health. Keyline plowing on contour to enhance water infiltration, overseeding with perennials, cover crops and legumes. Compost addition. Humic, fulvic and kelp added
- I added 5 Variety Cover Crop; Attempted scheduled grazing and now moving to implement; Compost Tea Extract, Heavy Straw on beds, No Till and planted with no till drill; Summer Cover Crop Mix Triticale, oats, wheat, hairy vetch, turnips, radish,
- For non-agricultural sites or sites not recently restored, we have continued our management practices of not applying additives (compost, fertilizer) or conducting soil disturbances such as tilling. New adaptive management practices are limited to weed management and grazing management. We have managed grazing based on multiple factors including vegetation condition, cattle availability, seasonal climate conditions and substrate/soil conditions.
- Addition of compost and livestock manure as well as increased minimum tillage practices; manure and grazing and no-till planting; Livestock grazing.
- Increased cover cropping: reduced tillage of all kinds. Diversified cover cropping. Increased use of compost and compost tea; ADDED GRAZING PASSES ON INTERCROPPED COVER; Introduced perennial seed mix to a portion of test area Blue Grama, Buffalograss, Sideoats Grama, Western Wheatgrass, Sand Dropseed; Limited weeding/tillage to 4" or so on either side of iris rows; mowed in between rows; minimized disturbance with no-till drill seeding; minimized soil disturbance to area a few inches either side of iris rows and mowed in between rows; only harvested part of the iris rows to minimize area disturbed; Spot seeding nutrient scavenging covers where iris dug out without moving/tilling/disturbing entire field.
- Still doing cell grazing but not as much
- No tilling for the restoration area and adding elemental sulfur to decrease ph long term. I am also adding chelated iron and chelated zinc to some areas such as my orchard and eventually if I decide to plant anything else in other areas.
- I have continued my practices with more resolve. Multiple cover crops in one year; We added nature safe fertilizers to our fertility program.
- Use less fertilizer; adjusted fertilizer based on soil tests no phosphate; planted triticale to 50% of back field to let that section rest
- That continual amendments (manure compost application) bring improvement to soil health; Dairy manure woodchip compost overlay; Manure/wood chip application in November following oat harvest.
- The last 5 years have resulted in many changes, not specifically based on the soil test, but the overall information about regenerative ag and the growers in CSSHP. Minimum, no-till; Vermicast tea application; Cover crops planted on most acres not in alfalfa; compost applications on 1000's of acres; Cows grazed on multiple fields either corn stalks or fall planted cover crops; Applications of: Compost, HyprGrow, Pantego Thrive, Rhizolizer, Chitosan, Citric Acid, HyprGerm, GrazingHi-Energy Hay Custom Formulated Organic Fertilizer Application; Custom Mix Biological Liquid from Elevate
- introduce cattle grazing, then mowing; improved irrigation management, and done some no-till drill seeding of cover crop
- Cardboard strips around trunks for coddling moth; myceliated wood chips in December; doughnut mounds around trees in orchard to inoculate soil; spray human remains, liquid essence from water cremation and gazed 16 sheep in rotational pattern through orchard
- Rotational grazing on 30 acres and a one-acre test plot planted with Aggressive Drylands mix
- Compost application in spring; pig manure compost
- No till, crop rotation and keep stubble in the field. Millet added to rotation, now wheat millet fallow rotation. Millet and Wheat stubble to be left on field, not harvested as was done in past.
- Undertook prairie dog removal; Planted a cover crop with modest success. Grazed animals. Mulched with cottonwood grind from dying trees we had to take down on the property.
- Applying compost on house pasture, using less commercial fertilizer on other pastures; Same as last year, 1/2 compost, soil sample area=compost
- Pivot-bio 40 microbial inoculant for increasing soil N
- 10T compost in fall
- Longer cover crop season
- Cover crop planted 9/30/22; no till; strip till instead of no-till
- Continued with cover crop (70% grass; 30% legume) followed by addition of composted dairy manure to the spring planted sections.
- Sheep bale grazing and winter wheat cover crop.
- Applied wormcast tea with humic and fulvic acids and microbial inoculants when performing the Yeomans rip and plant. Have made some adjustments to grazing protocols and focused less on soil chemistry.
- Less annual crops and more perennial crops; less tillage, more grazing. Alfalfa interseeded in skip row corn; Companion Cash Cropping; Cover crop Cut 1st cutting rather than grazed; Grazed 2nd cutting, drought; Hay and dormant graze; Reseeded after changing from sideroll to pivot
- Sorghum and volunteer wheat for grazing
- We are still just getting going, but I have begun to focus much more on cover crops, and this has made a big difference in soil structure and soil and water retention. We apply compost at a higher rate, and we have learned to deal with a highly productive field that is intensively grazed by elk
- Cover crop fall 2021, then terminated in June with tarps, planted next crop into residue. Cover crop mix from Green Cover Seed; compost
- Use of cover seed. Smarter irrigation (instead of several times a little bit each time we switched to a couple times a growing season for a much longer run each time). Concentrated on getting water to dry spots using NuFlex; In October, sprayed with 24DB. Kills all the weeds but not grass. Killed thistle but not alfalfa.
- In our forested areas we really haven't made changes to our operations as it relates to soils. Treatment areas see chipping, decreased tree cover, and higher vegetative cover post treatment which could have an impact on soil conditions. Forest thinning, grazing to control tall oat grass, reseeding with native grasses in disturbance areas.
- Less manure, more cover crops and an attempt to keep a living root in the soil.
Recommendations for education and outreach:
1. Our main recommendation is: Make sure you have plenty of TIME to accomplish your desired changes. Change takes a very long time in most cases. We have trialed various methods of reaching and involving our growers to further the goal of changing practices and developing soil health leaders, including
- Asking for advice individually or through group polling
- Awarding prizes of cover crop seed gift certificates
- Asking growers to speak on panels at our annual meetings
- Making videos of growers discussing different soil health related subjects
- Sidestepping the organic versus conventional controversy
- Being as transparent as possible about all project matters including finances
- Admitting mistakes, errors and lack of knowledge when they occur
- Sharing some personal information
- Injecting humor where possible
It is unclear how effective any of these strategies have been.
What has made the most difference is TIME. The fact that this project has continued for 6 years with 4 years left to go, the fact that I am still around and still doing all the things I said I was going to do, the fact that I am old and have lived in this community for many years and don't seem to be heading off anywhere else, all these things all together have very slowly built up a small level of trust. Our most recent annual meeting was much more relaxed. Growers were interacting more with each other and generally having a good time. It was a very encouraging sign. Trust in the project, the process, and fellow growers is a necessary first step before other project goals such as information sharing, practice change and leadership development are realized. Trust takes time.
2. Think carefully about your meetings' goals and whether or not the physical and temporal set up of the project supports those goals. Does the physical set-up of the room, the tables, the invited participants, and the agenda support your goals? For instance, our goal was to get growers to share information, so it was important to not have many Ag professionals, outside speakers or members of the public at our meetings. That would have discouraged candid conversations between growers. We had to schedule in free time during our meetings for conversations between growers. We had to fight the tendency of wanting to fill every free moment with a speaker, as that would have stifled those important conversations. When we changed the physical configuration of our tables, chairs, food, and speaker locations, it increased the amount of information sharing at our meetings.
Cover Cropping
Organic Matter Inputs
Reducing tillage
The importance of water for soil health in our arid west
Rotational Grazing
Keeping a living root in soil and keeping the soil covered