Final Report for GNC09-116
Project Information
Beneficial insects and their provision of ecosystem services are at risk of decline in agroecosystems, and an important approach for conserving these insects in resource-limited habitats is to meet their ecological requirements. Previous research has shown that providing areas of flowering plants that bloom throughout the season supply beneficial insects with the resources they need, but little is
known about the importance of wildflower plot size for supporting wild bees, insect natural enemies, or the ecosystem services these insects provide. At the Trevor Nichols Research Center in Fennville, MI, we established wildflowers of equal proportions of flowers from a group of 12 native, perennial species in plots with sizes ranging from 1-100 m2. In these plots we found native bee density responds positively to increasing wildflower plot size, which corresponded to an increase in seed set of three wildflower species within the plots. We also found that natural enemy density, group richness, and diversity of natural enemy groups increased with plot size. The density of insect herbivores was lower in all flower plots than in the control samples, whereas the diversity of herbivore groups was significantly higher in flower plots. Comparing population growth of sentinel soybean aphids among plot sizes, aphid colonies were smaller as plot size increased, resulting in higher biocontrol service index values. Providing beneficial insects with flowering resources resulted in significantly greater densities of native bees and natural enemies as well as increased pollination and pest control than in smaller flower plots or mown grass areas. Our results indicate that the beneficial insects are sensitive to the area of floral resources in the environment, even at relatively small scales.
Therefore, larger wildflower plots are more suitable for the conservation of beneficial insects and their provision of ecosystem services.
Introduction:
Populations of beneficial insects and their provision of ecosystem services, including pollination and biological control, are at risk of decline, particularly in agroecosystems (Biesmeijer et al. 2006; Landis et al. 2008). These declines are particularly due to the scarcity of native and flowering plants, insecticide use, and loss or fragmentation of habitat (Landis, Wratten & Gurr 2000; Goverde et al. 2002b; Carvell et al. 2006). Consequently there has been growing interest in developing approaches to conserve beneficial insects and these strategies often involve integrating floral resource patches into farmland (Bianchi, Booij & Tscharntke 2006; Kremen & Chaplin-Kramer 2007; Isaacs et al. 2008; Letourneau & Bothwell 2008).
Flowering plants can provide necessary resources for beneficial insects in agricultural landscapes including nectar, pollen, and nesting sites. Vegetation structure and flower abundance have been shown to be key factors for insect species richness, abundance, and species composition (Zurbrügg & Frank 2006), so manipulation of the habitat in field margins or around cropped areas by establishing flowering plants and grasses can increase beneficial insect populations in agricultural systems (Long et al. 1998; Kells, Holland & Goulson 2001; Rebek, Sadof & Hanks 2005). A well-designed flowering border adjacent to a field will provide necessary resources for pollinators and natural enemies of crop pests during periods when pest numbers and crop flowers are low, thus maintaining high populations of predators, parasites, and bees supported by provision of nutrients throughout the season (Landis, Wratten & Gurr 2000; Ahern & Brewer 2002; Büchi 2002; Sanchez, Gillespir & McGregor 2003; Wanner, Gu &; Dorn 2006; Wanner et al. 2006). Research has shown that using flowering plant strips adjacent to fields helps support beneficial insects in agricultural landscapes, but much of this work has been done with non-native, annual or biennial flowering plants (Baggen & Gurr 1998; Dufour 2000; Carreck & Williams 2002). Although annual flowers often bloom within one growing season, they commonly require annual sowing, making it costly to properly maintain a well-established flowering strip of annual flower plants (Fiedler & Landis 2008; Tuell et al. 2008). Hence there have also been projects in the North Central Region to help support beneficial insects using native perennial flowering plants that are adapted to the local environment and are less likely to become invasive within adjacent crop fields (Fiedler & Landis 2007a; Fiedler & Landis 2007b; Tuell et al. 2008).
When farmers have been approached about integrating flowering plant strips adjacent to their cropland a common question is asked: “how big do the flowering plant strips need to be?” It is expected that insect population density will be greater in larger habitat patches that have more resources to support populations (Slobodkin, 1980), but few studies have examined this pattern in relation to beneficial insects. Beneficial insects respond positively to the addition of flowering resources in farmland, but different insect taxa respond to these manipulations in varying ways (Fraser et al., 2008; Osborne et al., 2008; Tscharntke et al., 2008), and may also respond to habitat at different scales. Meyer et al. (2007) and Olson and Andow (2008)found that larger grassland habitat areas resulted in greater insect abundance and diversity. In a study by Heard et al. (2007), landscape composition influenced bee abundance, but flower patch size had no effect. Conversely, Meyer et al. (2007) observed that increasing flowering strip size increased abundance and diversity of pollinators. In terms of insect natural enemies, there has been a documented positive response to the size of host patch size (Bach, 1988b; Olson & Andow, 2008), but there is little information on the response of natural enemies or herbivorous insects as a function of wildflower patch size. For many farmers, cropland equates to money, so it is likely not an easy decision for farmers to dedicate potential cropland to flowering plant strips. Better understanding of how beneficial insects and their services respond to the size of wildflower plots will assist farmers’ decision-making for beneficial insect conservation. This project is designed to determine the impact of wildflower plot size on attracting beneficial insects and the subsequent response of pollination and biological control, so that these strips are justifiably cost-effective for farmers.
This research project has three main objectives: 1) Determine the response of beneficial insects to the size of wildflower plots, 2) determine the effect of wildflower plot size on pollination and biocontrol within the plots, and 3) use our results to increase producer and public awareness of using native flowering plants to support beneficial insects in farmland.
Note: The objectives have changed slightly from the initial proposal. We had issues with the establishment of native annual plants and we had to replace the original objective of determining whether native flowering plots composed of a mixture of annual and perennial wildflowers will support beneficial insects earlier and remain established longer than those strips composed of only perennial or annual wildflowers.
Cooperators
Research
In the fall of 2008 at the Trevor Nichols Research Center in Fennville, Michigan, a 1 ha grass field was prepared with twenty-five square plots of varying size. The square plots were mowed and then sprayed with 1% glyphosate herbicide at 206.7 L/ha (Touchdown®, Syngenta Crop Protection, Inc. Greensboro, NC) twice in the late summer to reduce the growth of weeds. At first vegetative growth in 2009, the same herbicide was applied to all plots two weeks before wildflower seedlings were planted. The plots were not tilled in order to prevent the exposure of dormant weed seeds.
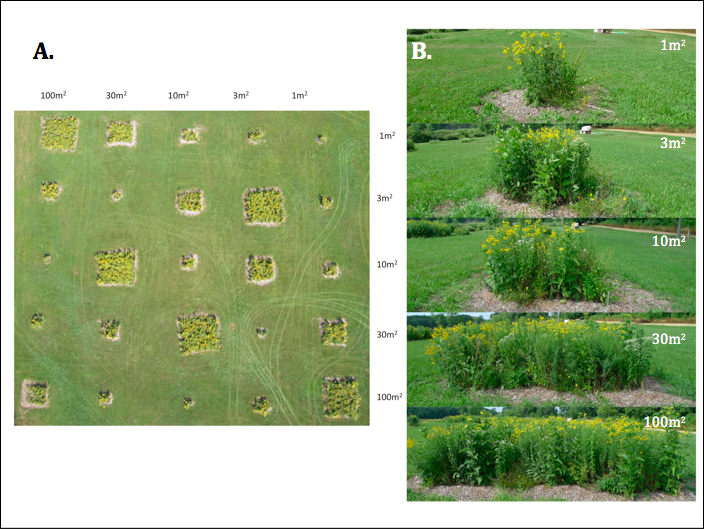
The twenty-five square shape plots ranged in size, consisting of a logarithmic series of five size treatments with five replicates each: of 1, 3, 10, 30, and 100 m2. These plots were arranged in a 5 x 5 grid of 15 x 15 m cells, with the center of each plot positioned in the center of a grid cell. To control for landscape variation, the different sized plots were arranged within the grid using a Latin- square design (Fig. 1).
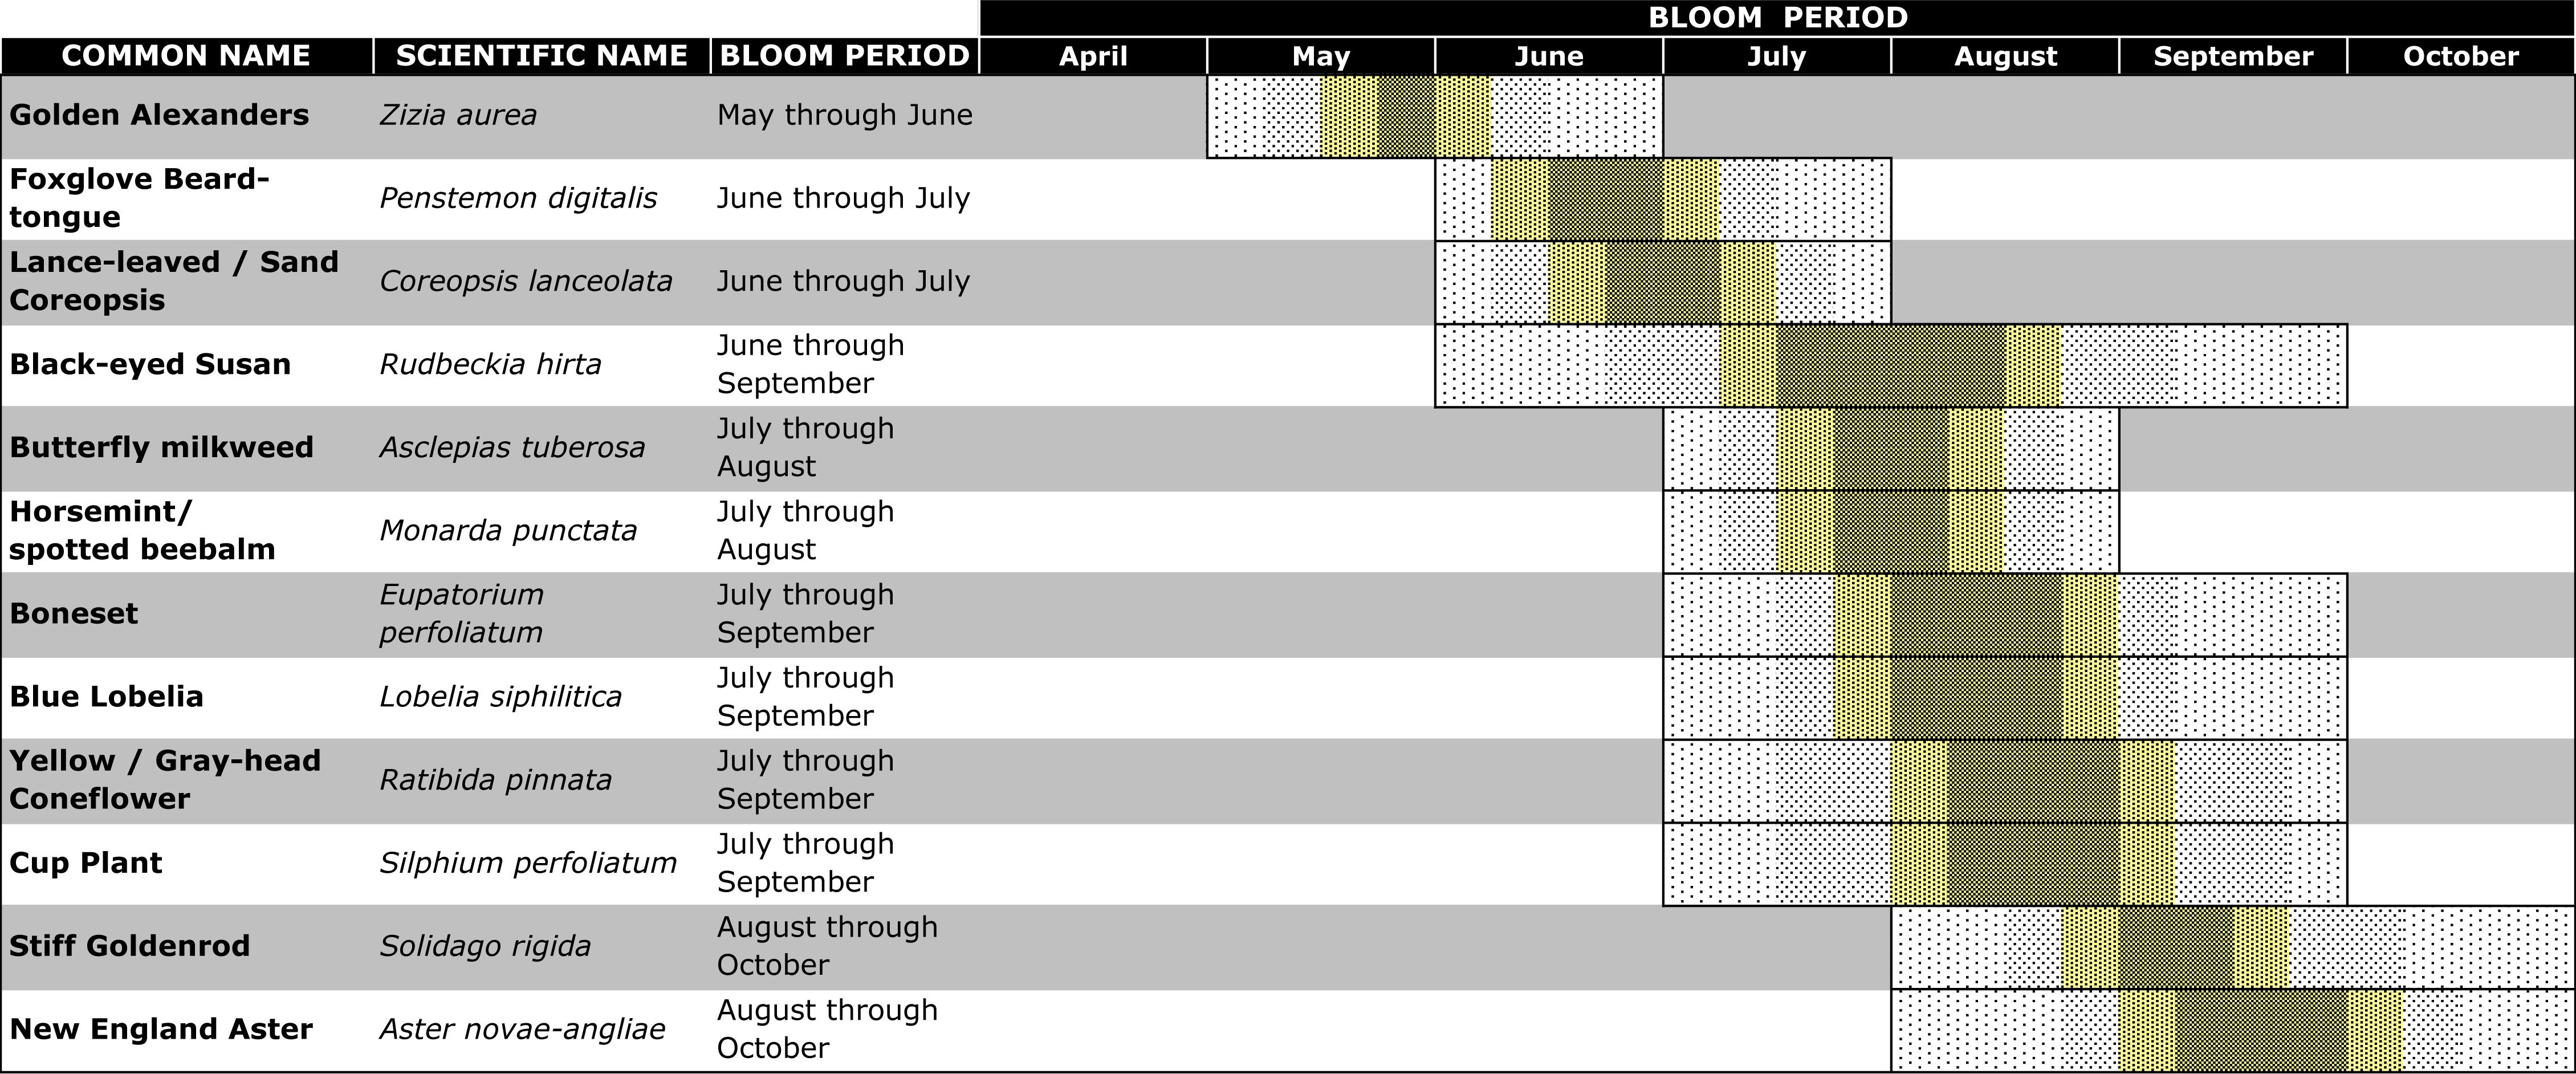
Twelve species of native, perennial wildflowers were selected for their known attractiveness to natural enemies and that had overlapping bloom periods that spanned May through October (Fiedler & Landis, 2007). One-year-old plants (Wildtype Native Plant Nursery, Mason, Michigan) of these species (Table 1) were planted in mid-May 2009. The 12 different species were planted 30-45 cm apart within square groupings of 12 seedlings, with the relative position of each species randomized within every grouping. With this design, to maintain the same relative abundance of species across the experiment, 1 m2 plots had 1 grouping of 12 seedlings (1 from each species), the 3 m2 plots had 4 groupings (48 seedlings), 10 m2 plots had 9 groupings (108 seedlings), 30 m2 plots had 25 groupings (300 seedlings), and 100 m2 plots had 64 groupings (768 seedlings). To combat weed growth, a 5 cm depth of wood chips was added to the plots after planting. The grass surrounding the plots was mowed approximately once a month during the summer for the duration of this project, and five locations within the grassy areas and away from the plots served as the negative controls.
Pollinators:
In 2011 to measure the effect of wildflower plot size on the insect pollinators we selected three native flower species that had three different bloom periods; early-season bloom (sand coreopsis), mid-season bloom (cup plant), and late-season bloom (New England aster). During each of the three different bloom times, on three separate warm, calm, and sunny days between 10:00 and 16:00 h, a 1 m2 area within each plot was sampled for 5 minutes counting and identifying the insects that visited the flowers within the 1 m2 area. With the exception of honey bees (Apis mellifera) and bumble bees (Bombus spp.), all other bees and Syrphidae were identified to family.
Insect natural enemies and herbivores:
From May through September 2010 each of the twenty-five wildflower plots were sampled in random order. Once a month on warm, calm, and sunny days between 10:00 and 16:00 h, a 1 m2 area within each plot was sampled four times for 30 seconds using a modified reversed-flow leaf blower (BG 56 C-E; Stihl, Waiblingen, Germany) with a fine white mesh bag (150 m, The Cary Company, Addison, IL) placed over the intake to capture insects (Fiedler 2006). Five, 30-second negative control samples were also taken in the same manner from the grassy areas. Sampling focused on flowering portions of the plants where available, and the samples were placed in a cooler, returned to the laboratory, and frozen. Insects were later separated from plant matter and identified to major taxonomic groups using standard keys (Borror & White 1998; Johnson & Triplehorn 2005). This approach resulted in collection of both native pollinators and insect natural enemies.
The effect of plot size on pollination services:
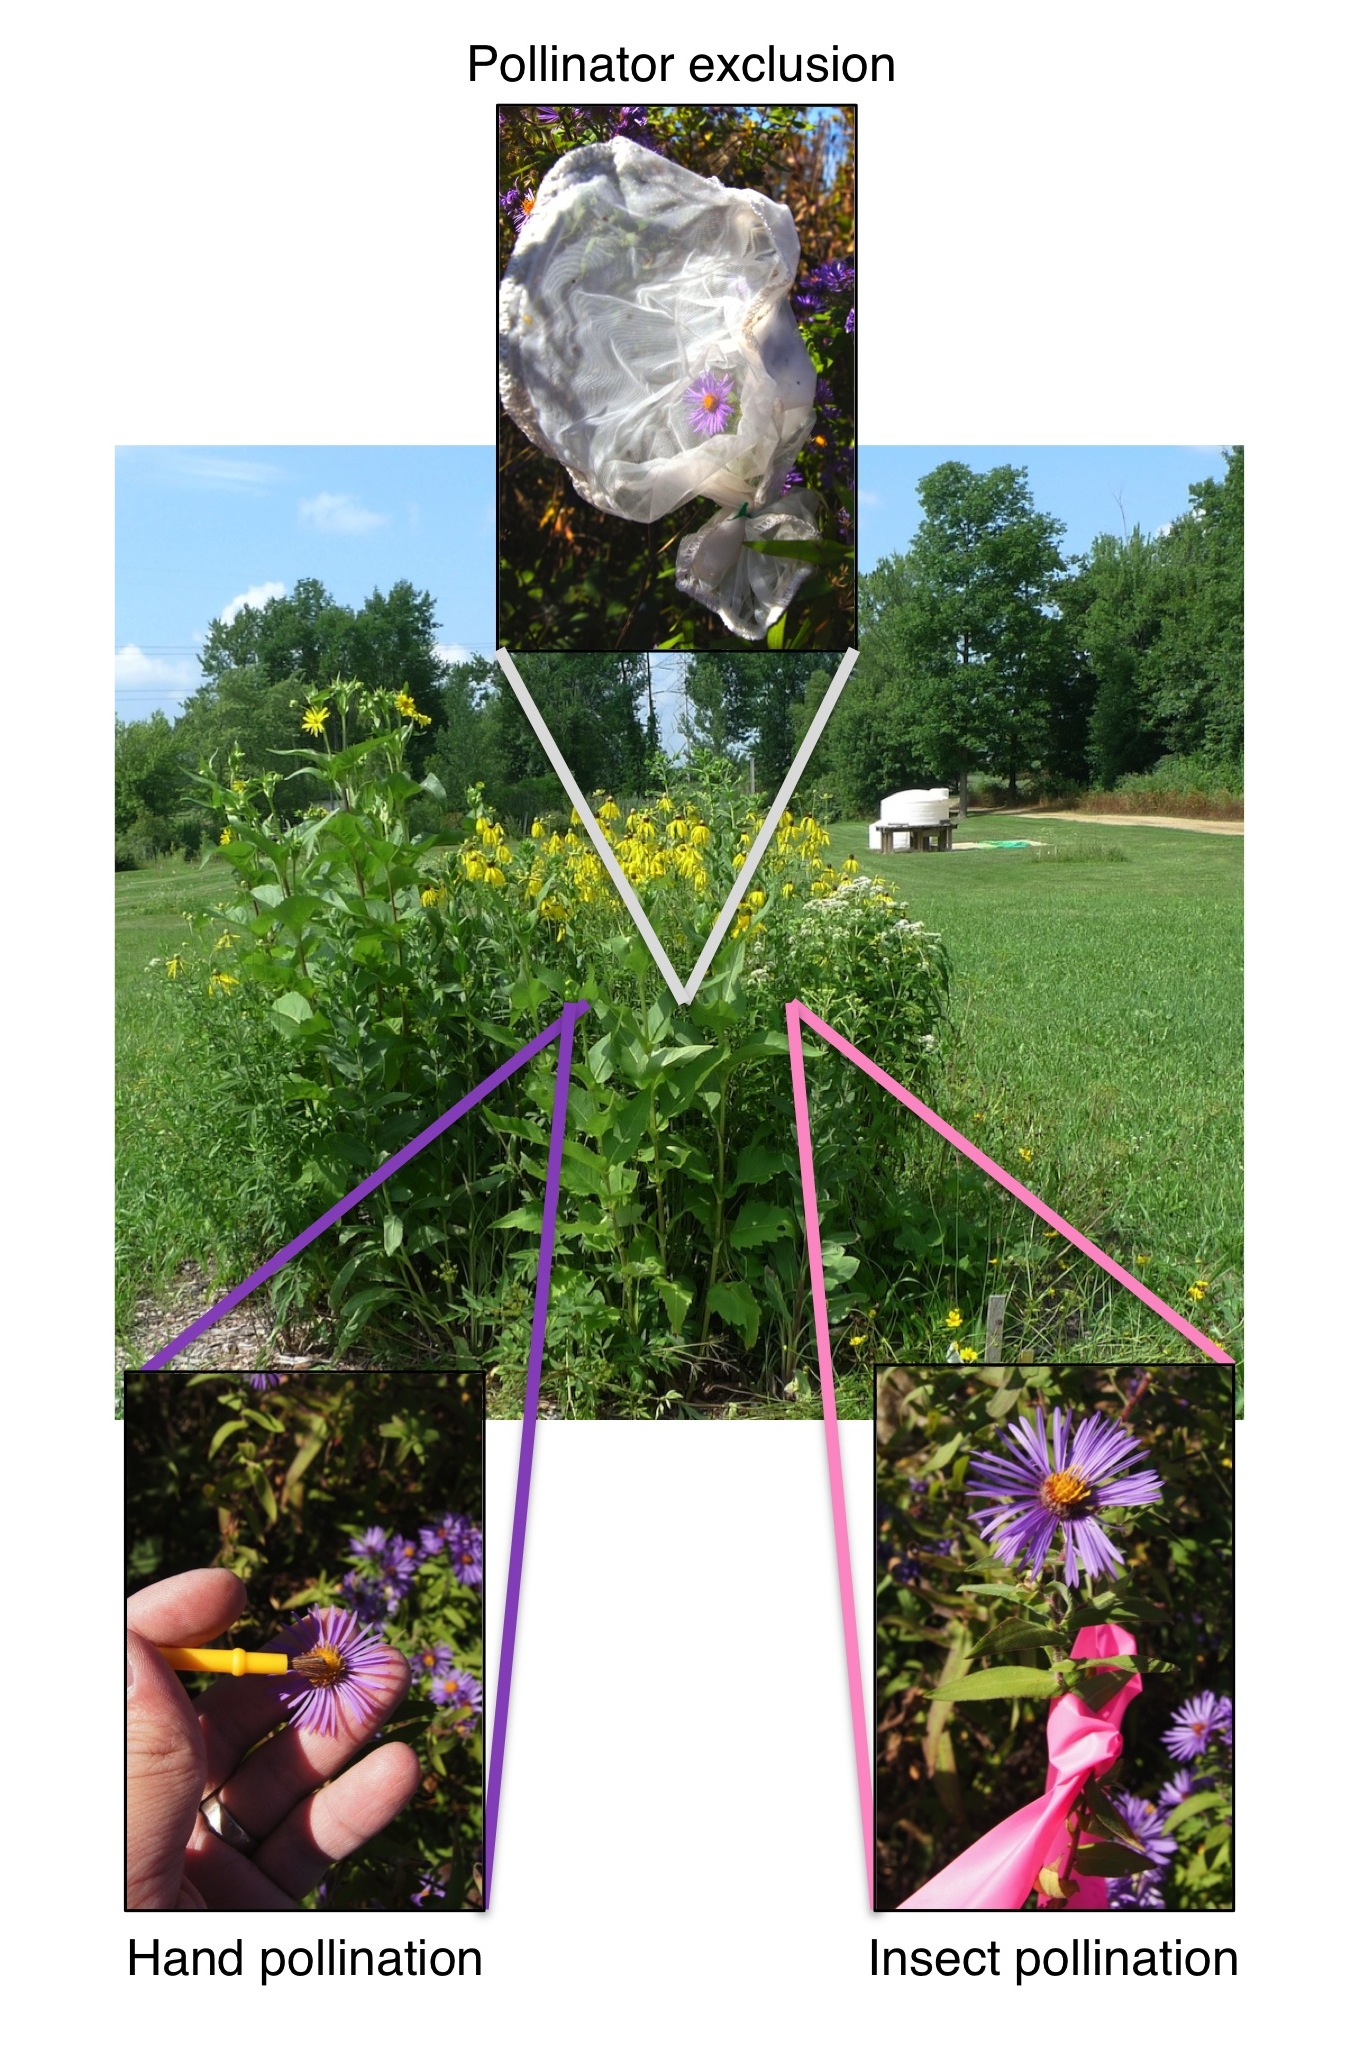
To measure the effect of wildflower plot size on the pollination of wildflowers we selected three flower species that had three different bloom periods; early-season bloom (sand coreopsis), mid-season bloom (cup plant), and late-season bloom (New England aster). At each of the 25 wildflower plots we tagged six unopened flower buds, designating two buds for each of three treatments to test for pollination limitation: restricted pollination, hand pollination and open pollination. To determine if plants could produce viable seeds in the absence of insect visitors, buds tagged for restricted pollination were then enclosed with a fine mesh bag (150 m, The Cary Company, Addison, IL), and remained untreated for the duration of the procedure. Buds designated for hand pollination were also bagged, while those intended for open pollination remained unbagged and untreated. When the flowers began to bloom in the hand pollination treatment, we applied collected pollen to the open flowers using a paintbrush. We carried out hand pollination three times in a span of one week, only unbagging the flowers during the hand-pollination process (Figure 2). After the flowers set seed, each of the six seed heads from each of the 25 plots were then collected and allowed to dry. To determine female reproductive success of the treatments, we opened each bud and recorded the number of viable mature seeds inside. We were then able to compare the increase in pollination due to insect visitation by subtracting the number of mature seeds found in the bagged flowers form the number of mature seeds in the unbagged flowers.
The effect of plot size on biological control services:
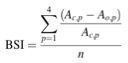
To determine the effect of wildflower plot size on biological control services, in 2009 and 2010, two groups of 25 soybean plants were placed in the wildflower plots for each of two repetitions of the following experiment. In July and again in August of 2009, to test the background level of predation among plot sizes before flowers started blooming, pairs of soybean plants were infested with a combination of 10 (four adult, three mid-instars, and three early instars) apterous soybean aphids and placed near the center of each of the 25 wildflower plots for two weeks. One of the plants (the control) from the pair of soybean plants in each plot was covered completely, including the pot, with a fine nylon mesh (150 m hole size, The Cary Company, Addison, IL) to exclude all natural enemies from the aphids, and the other soybean plant was left uncovered to allow for predation of aphids (Fox et al., 2004; Gardiner et al., 2009). The pots were painted with fluon (Insect-a-slip, Bioquip Products Inc., Rancho Dominguez, CA) to keep ground dwelling arthropods off the potted plants. The number of aphids on each plant was counted after two weeks. To test the response of predation to plot size after the flowers had started blooming this experiment was repeated again in July and August of 2010. To determine the magnitude of biological control services provided in 2009 (before flowering) and in 2010 (after flowering), we calculated the relative aphid suppression in different size plots by expressing the change in aphid numbers on open and caged plants as a proportion of aphid abundance in the absence of predators for each plot. The resulting biocontrol services index (BSI) can vary from zero to one, with values increasing as the level of aphid predation increases: (see attached equation) where Ac is the number of aphids on the caged plant on day 14, Ao is the number of aphids on the open plant on day 14, p is the plot, and n is the number of replicates for a given plot (Gardiner et. al., 2009).
Analysis:
Pollinator density and wildflower pollination: The density of insect pollinators and seed number were compared among plot sizes separately for each of the three bloom periods (early, mid, and late-season) using analysis of variance (ANOVA; JMP, Version 8, SAS Institute Inc., Cary, NC). Pollinator density and seed number were further compared among plot size by Student’s t test with the alpha level corrected post hoc via the Bonferroni method ( = 0.01) (Zar, 1999). Insect natural enemies, herbivores, and biological control: The density, richness, and diversity (Shannon-Wiener Index) of unique taxonomic groups of natural enemies and herbivores were compared among plot sizes using analysis of variance (ANOVA) with data averaged from each month during the growing season (May through September) (JMP, Version 8, SAS Institute Inc., Cary, NC). Insect density and group diversity were further compared among treatments by Student’s t test with the alpha level corrected post hoc via the Bonferroni method ( = 0.01) (Zar 1999). Each observed taxonomic group of natural enemies were also analyzed using ANOVA and Student’s t test to determine if specific groups of insects responded positively to wildflower plot size. The biological control experiment was conducted twice over a two-month timeframe, so the data were pooled and averaged for these months, and the BSI values and aphid abundance were compared among plot sizes using ANOVA. Biocontrol services index values and aphid abundance were then compared among plot sizes using
Student’s t test with the alpha level corrected post hoc via the Bonferroni method ( = 0.01) (Zar 1999). We performed simple linear regression using natural log transformed (loge+1) data to determine the relationship between aphid abundance on open plants and the populations of natural enemies.
In order to improve producer and public awareness of using flowering plant diversity in farms to conserve beneficial insects including natural enemies and pollinators, we presented at numerous extension meetings and conferences during the past year. These presentations included information about using wildflower plantings to support beneficial insects and current results from this SARE funded project.
- Table 1. List of native Midwestern annual wildflowers and their bloom periods planted at the Trevor Nichols Research Center in Fennville, Michigan, USA.
- Figure 1. A.) An aerial photograph of the wildflower plantings at the Trevor Nichols Research Center showing the different sizes, 2010. B.) Ground level photographs of the different sized flower plots, 2010.
- Figure 2. Picture depicting pollination methods for determining the effect of wildflower plot size on pollination services.
- Equation: Biocontrol services index
Pollinators:
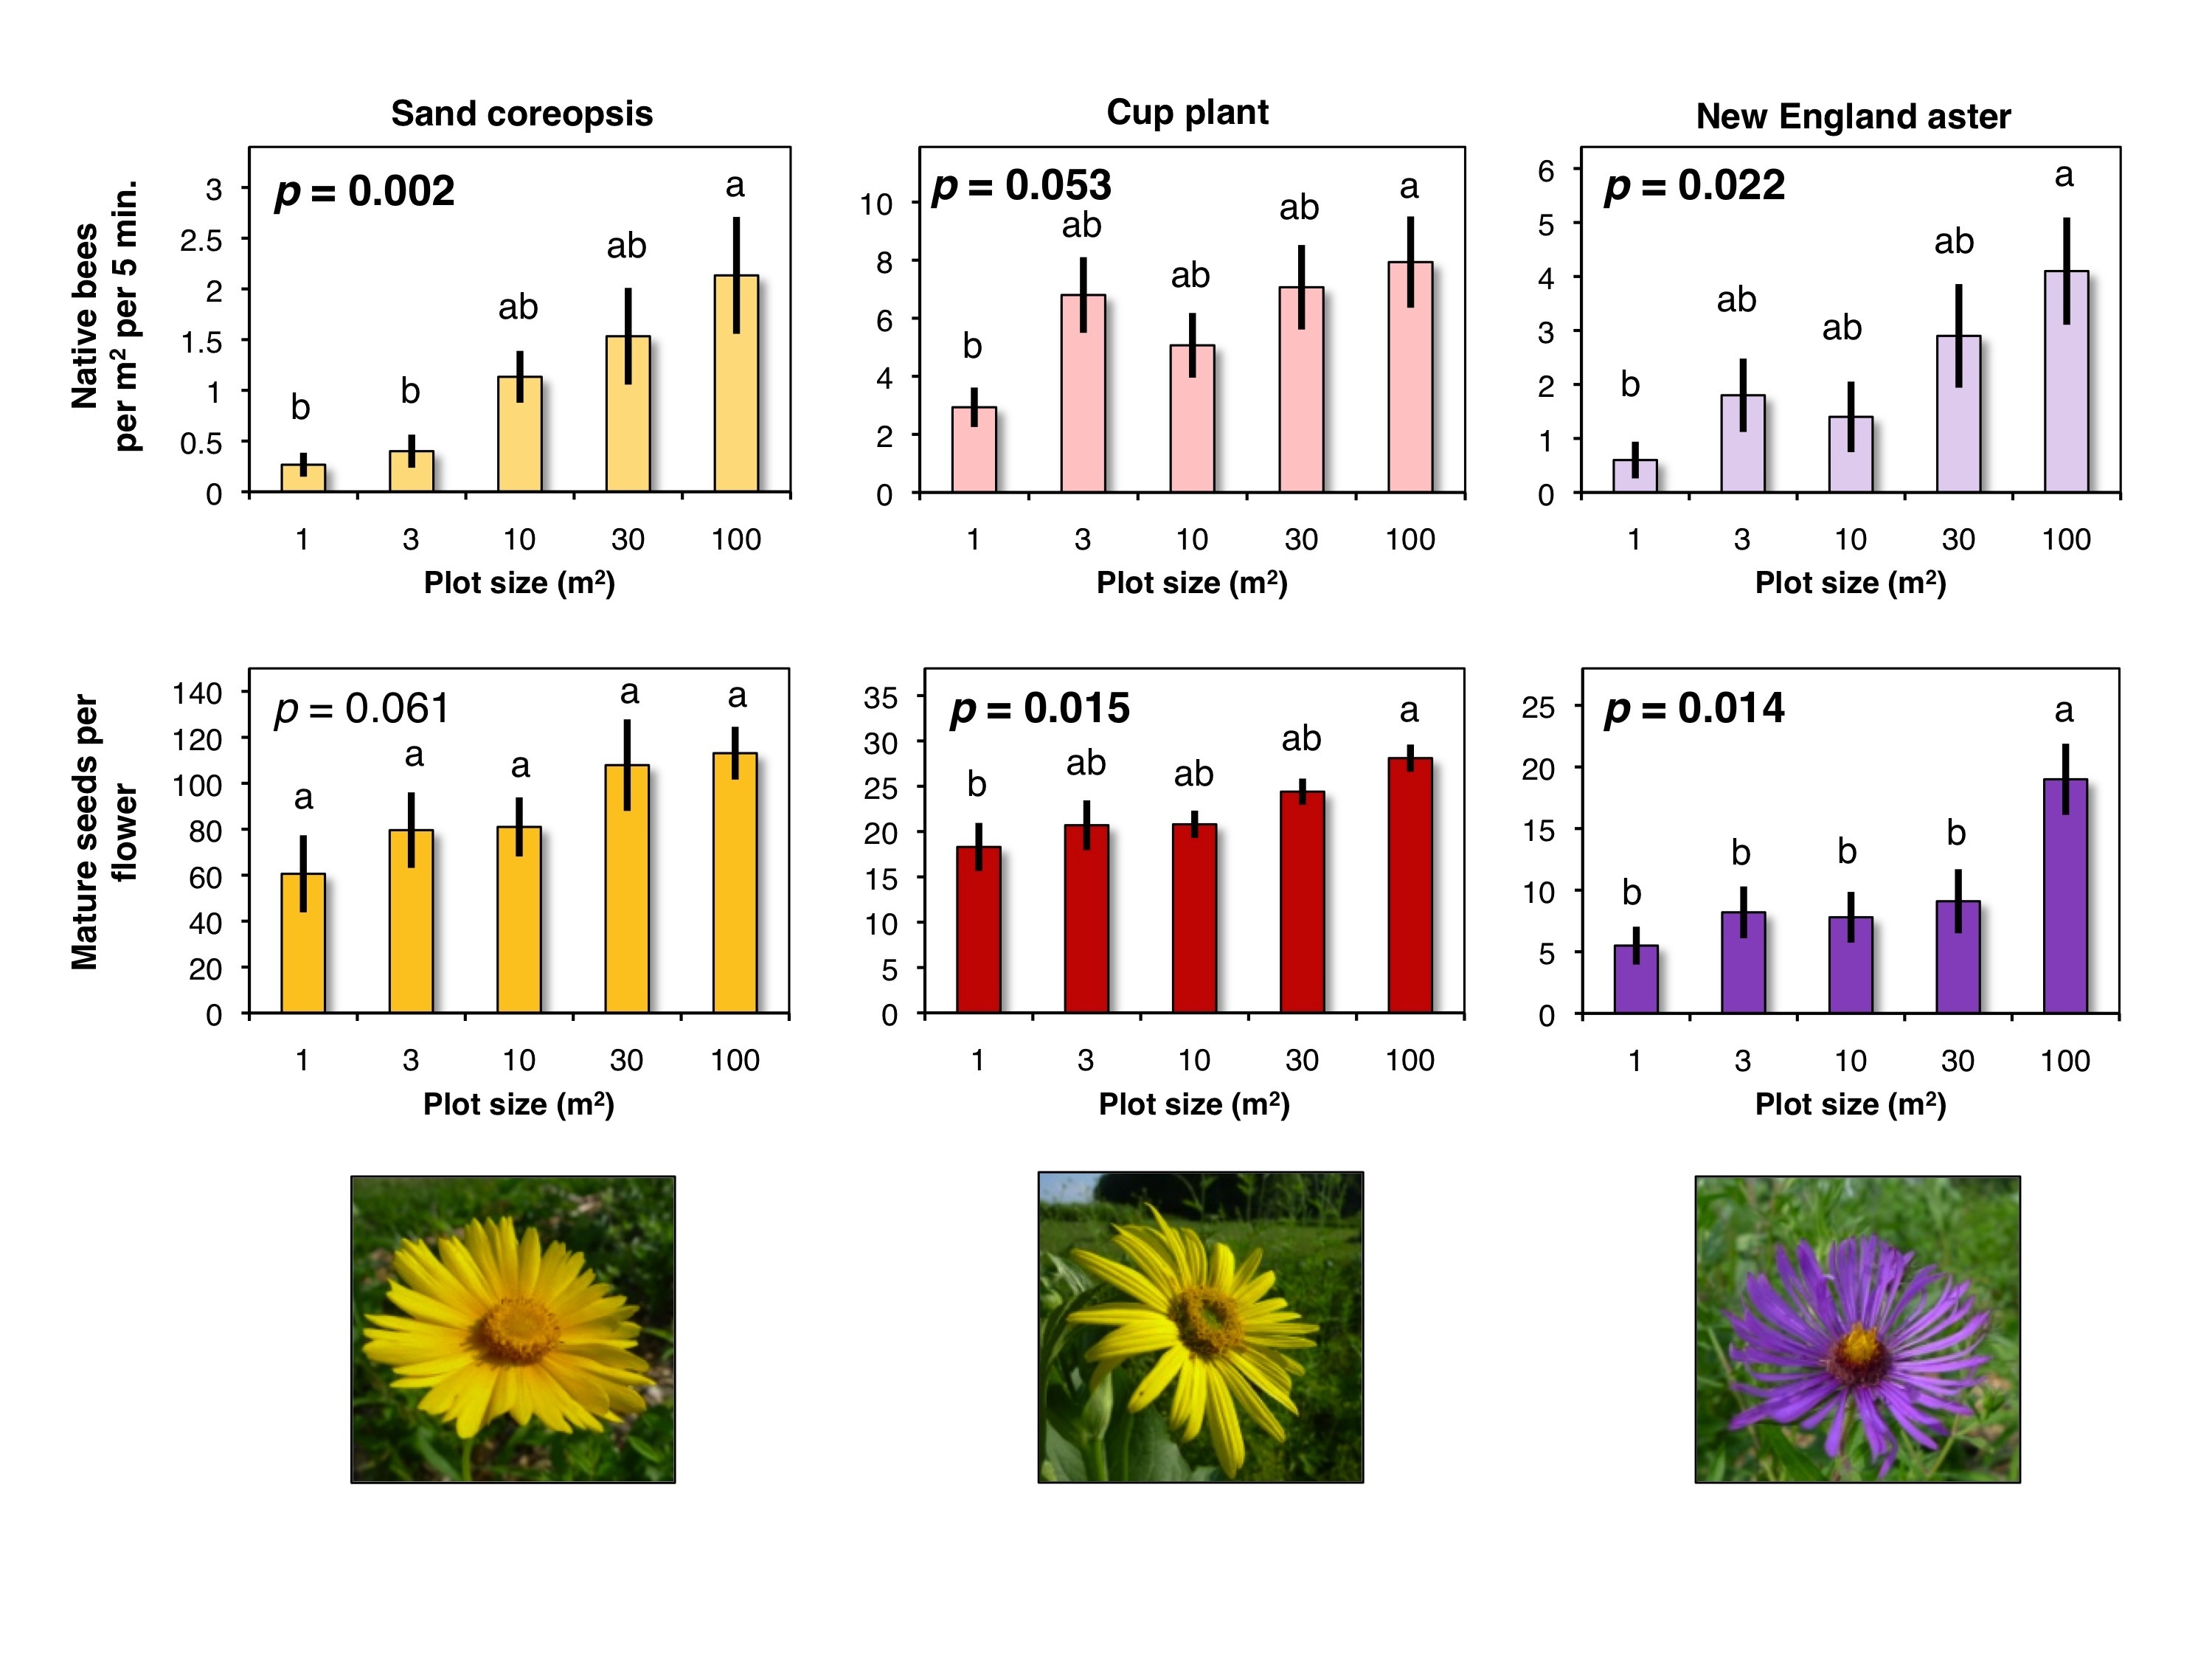
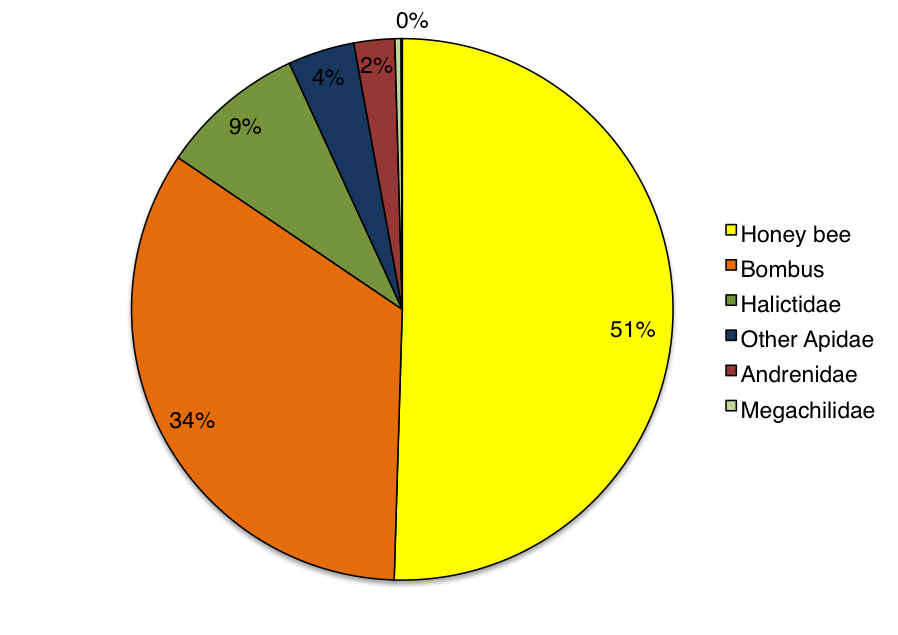
Honey bees were the most abundant pollinator observed visiting wildflower plots, but we also observed a diverse group of native bees (non-honey bees) visiting flowers in the different sized plots (Figure 3). When comparing only the native bees visiting wildflowers, we found that for each of the three bloom periods (early, mid, and late-season), the density of native bees visiting flowers in 1m2 areas increased with increasing wildflower plot size (Figure 4). The largest wildflower plantings, 100m2, had significantly higher densities of native bees in early (F4, 70 = 4.58, P = 0.002) and late-season periods (F4, 70 = 3.19, P = 0.022), but not quite statistically significant for the mid-season observations (F4, 70 = 2.47, P = 0.053). These results indicate that native bees are sensitive to the size of wildflower plantings and that they respond positively to the increase in area of floral resources.
Insect natural enemies:
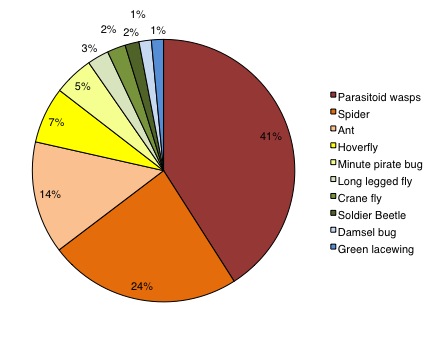
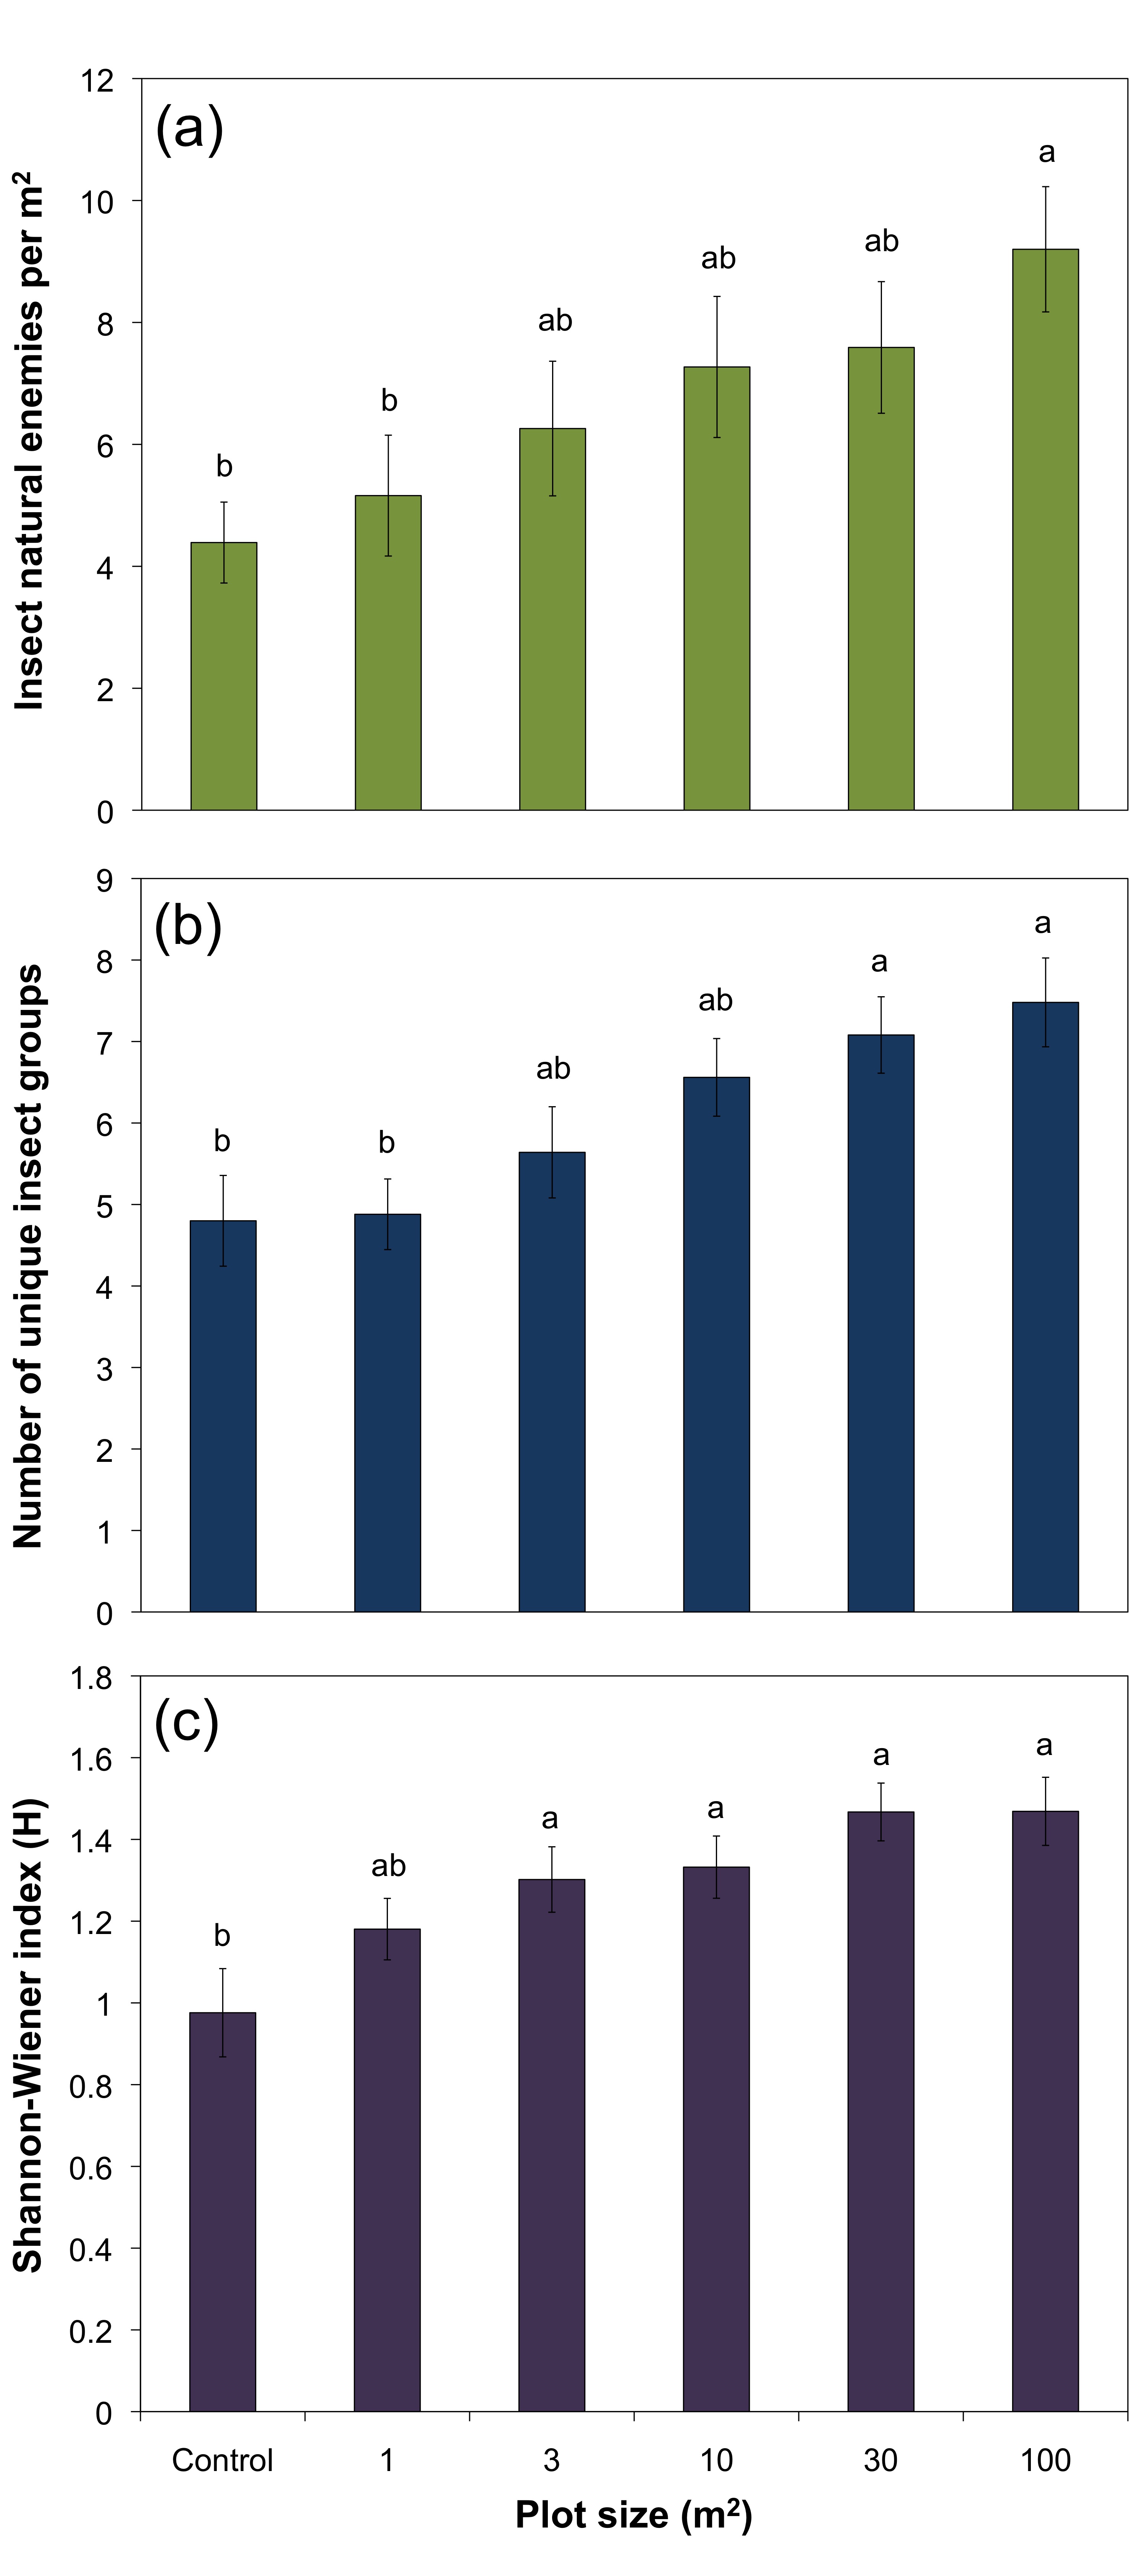
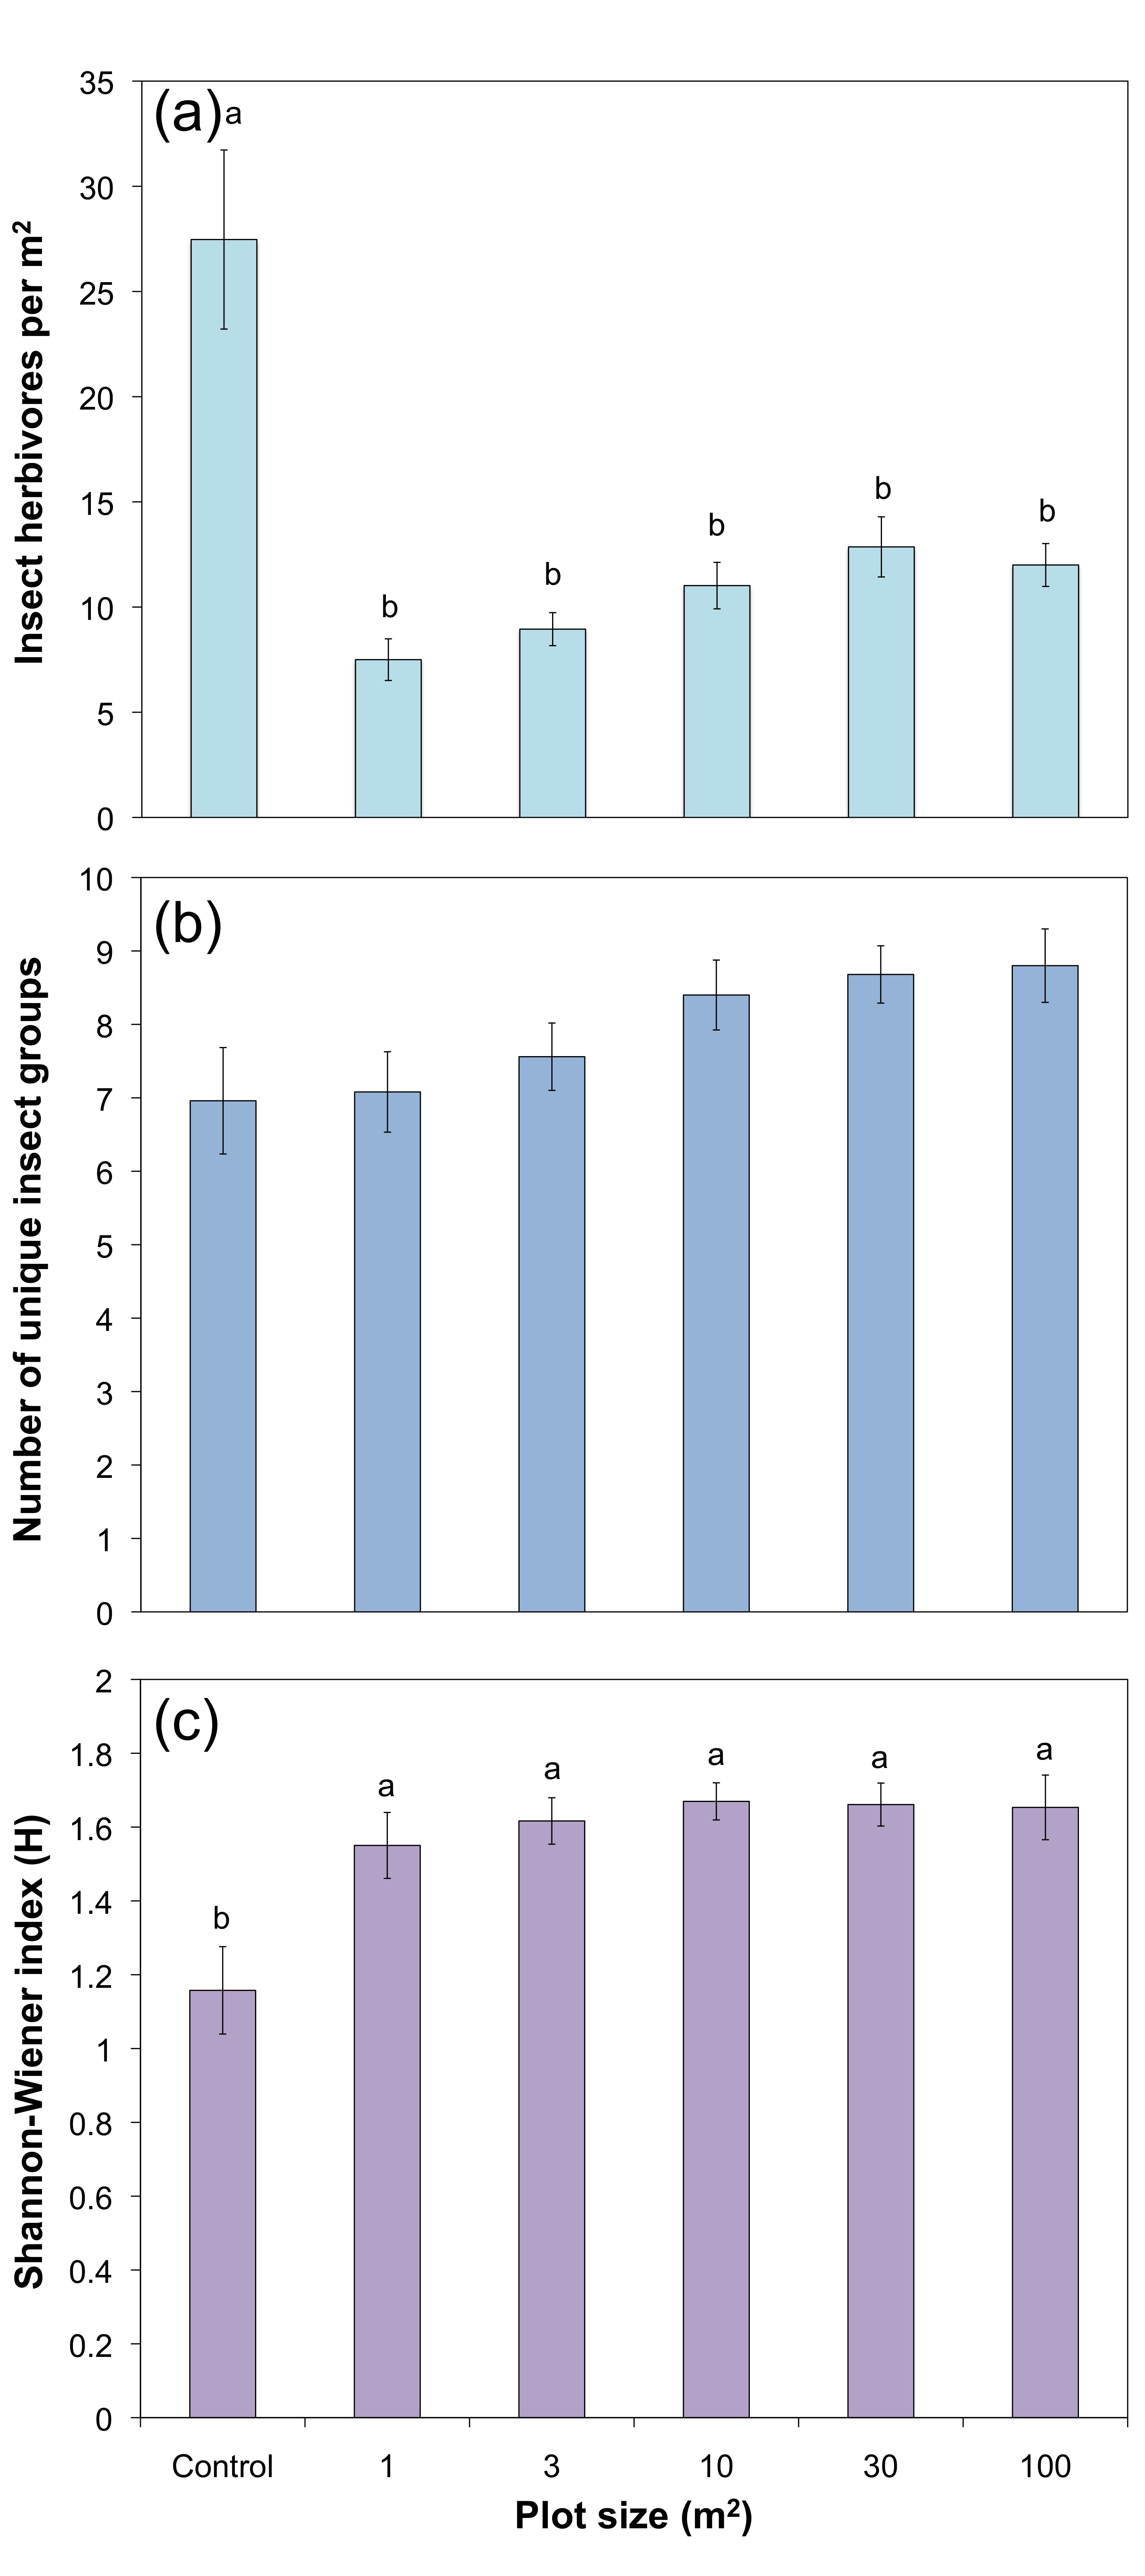
The majority of insect natural enemies captured in the wildflower plots included parasitic wasps, spiders, and ants, with other notable collected natural enemies being hoverflies and minute pirate bugs (Figure 5). There was an increase in the density (insects/m2) of insect natural enemies with increasing plot size (Figure 6a). The density of natural enemies was almost twice as high in the 100 m2 plots compared with the 1 m2 plots (F5, 144 = 3.39, P = 0.0063). Natural enemy group richness increased significantly across treatments (F5, 144 = 4.99, P = 0.0003), with 30 and 100 m2 plots having significantly more unique natural enemy groups than the 1 m2 plots or the control (Figure 6b). The trend of natural enemy group diversity increased across treatments and was significantly higher in all flower plots greater than 1 m2 compared to the grassy control plots (Figure 6c; F5, 144 = 5.09, P = 0.0003), but did not differ significantly among the different flower plot sizes. Both predator and parasitoid insects responded positively to plot size. The density of predaceous insects increased with plot size and differed significantly from the control samples (F5, 144 = 3.07, P = 0.011).
Parasitoid density also increased significantly with plot size (F5, 144 = 3.29, P = 0.0076) with significantly more parasitoids being collected in 100 m2 compared to the control, 1 m2, and 3 m2 samples.
Insect herbivores:
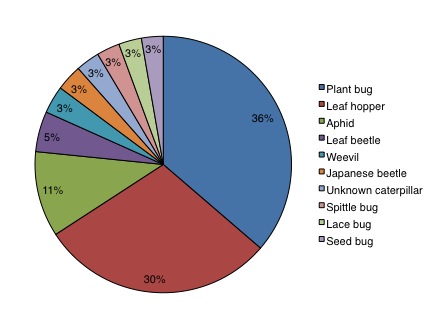
Plant bugs, leaf hoppers, and aphids were the primary insect herbivores captured in the wildflower plots (Figure 7). The density of insect herbivores was lower on all flower plots than on the control plots (Figure 8a; F5, 144 = 13.02, P < 0.0001), but did not differ significantly among flower plot sizes. Conversely, herbivore group richness (Figure 8b; F5, 144 = 2.41, P = 0.039) and diversity (Figure 8c; F5,144 = 5.94, P < 0.0001) were significantly higher in all flower plots compared to the grassy control plots, but neither showed significant difference among flower plot sizes.
The effect of plot size on pollination services:
We found that for each of the three wildflower species (sand coreopsis, cup plant, and New England aster) there was an increase in pollination (# of mature seeds) with increasing wildflower plot size (Figure 4). The largest wildflower plantings, 100m2, had significantly greater numbers of mature, fertilized seeds than the smallest 1m2 plots for cup plants (F4, 45 = 3.46, P = 0.015) and New England asters (F4, 45 = 5.27, P = 0.014). Although not quite statistically significant, the numbers of mature seeds of sand coreopsis in the largest plots were greater than those in collected in the smallest plots (F4, 70 = 2.47, P = 0.053). The increasing seed set with wildflower plot size corresponded to the increase in observed native bees visiting flowers during the same time period (Figure 4).
Hand-pollination and bagged treatments resulted in very few mature seeds. This indicates the importance of insect pollination of those three native wildflower species. Also, larger areas with more flowers provide habitat that support higher densities of native bees, which leads to better pollination of the flowers in those habitats.
The effect of plot size on biological control services:
In 2009, in the absence of blooming wildflowers, aphid populations on open soybean plants after two weeks in the field ranged from 15 to 189 aphids per plant and 30 to 203 aphids per plant on caged plants. After wildflower establishment, in 2010 aphid populations on open soybean plants ranged from seven to 24 aphids per plant and ranged from 54 to 288 aphids per plant on caged plants after two weeks in the field. Winged soybean aphids were not observed in either year on open or in caged treatments, suggesting no crowding response.
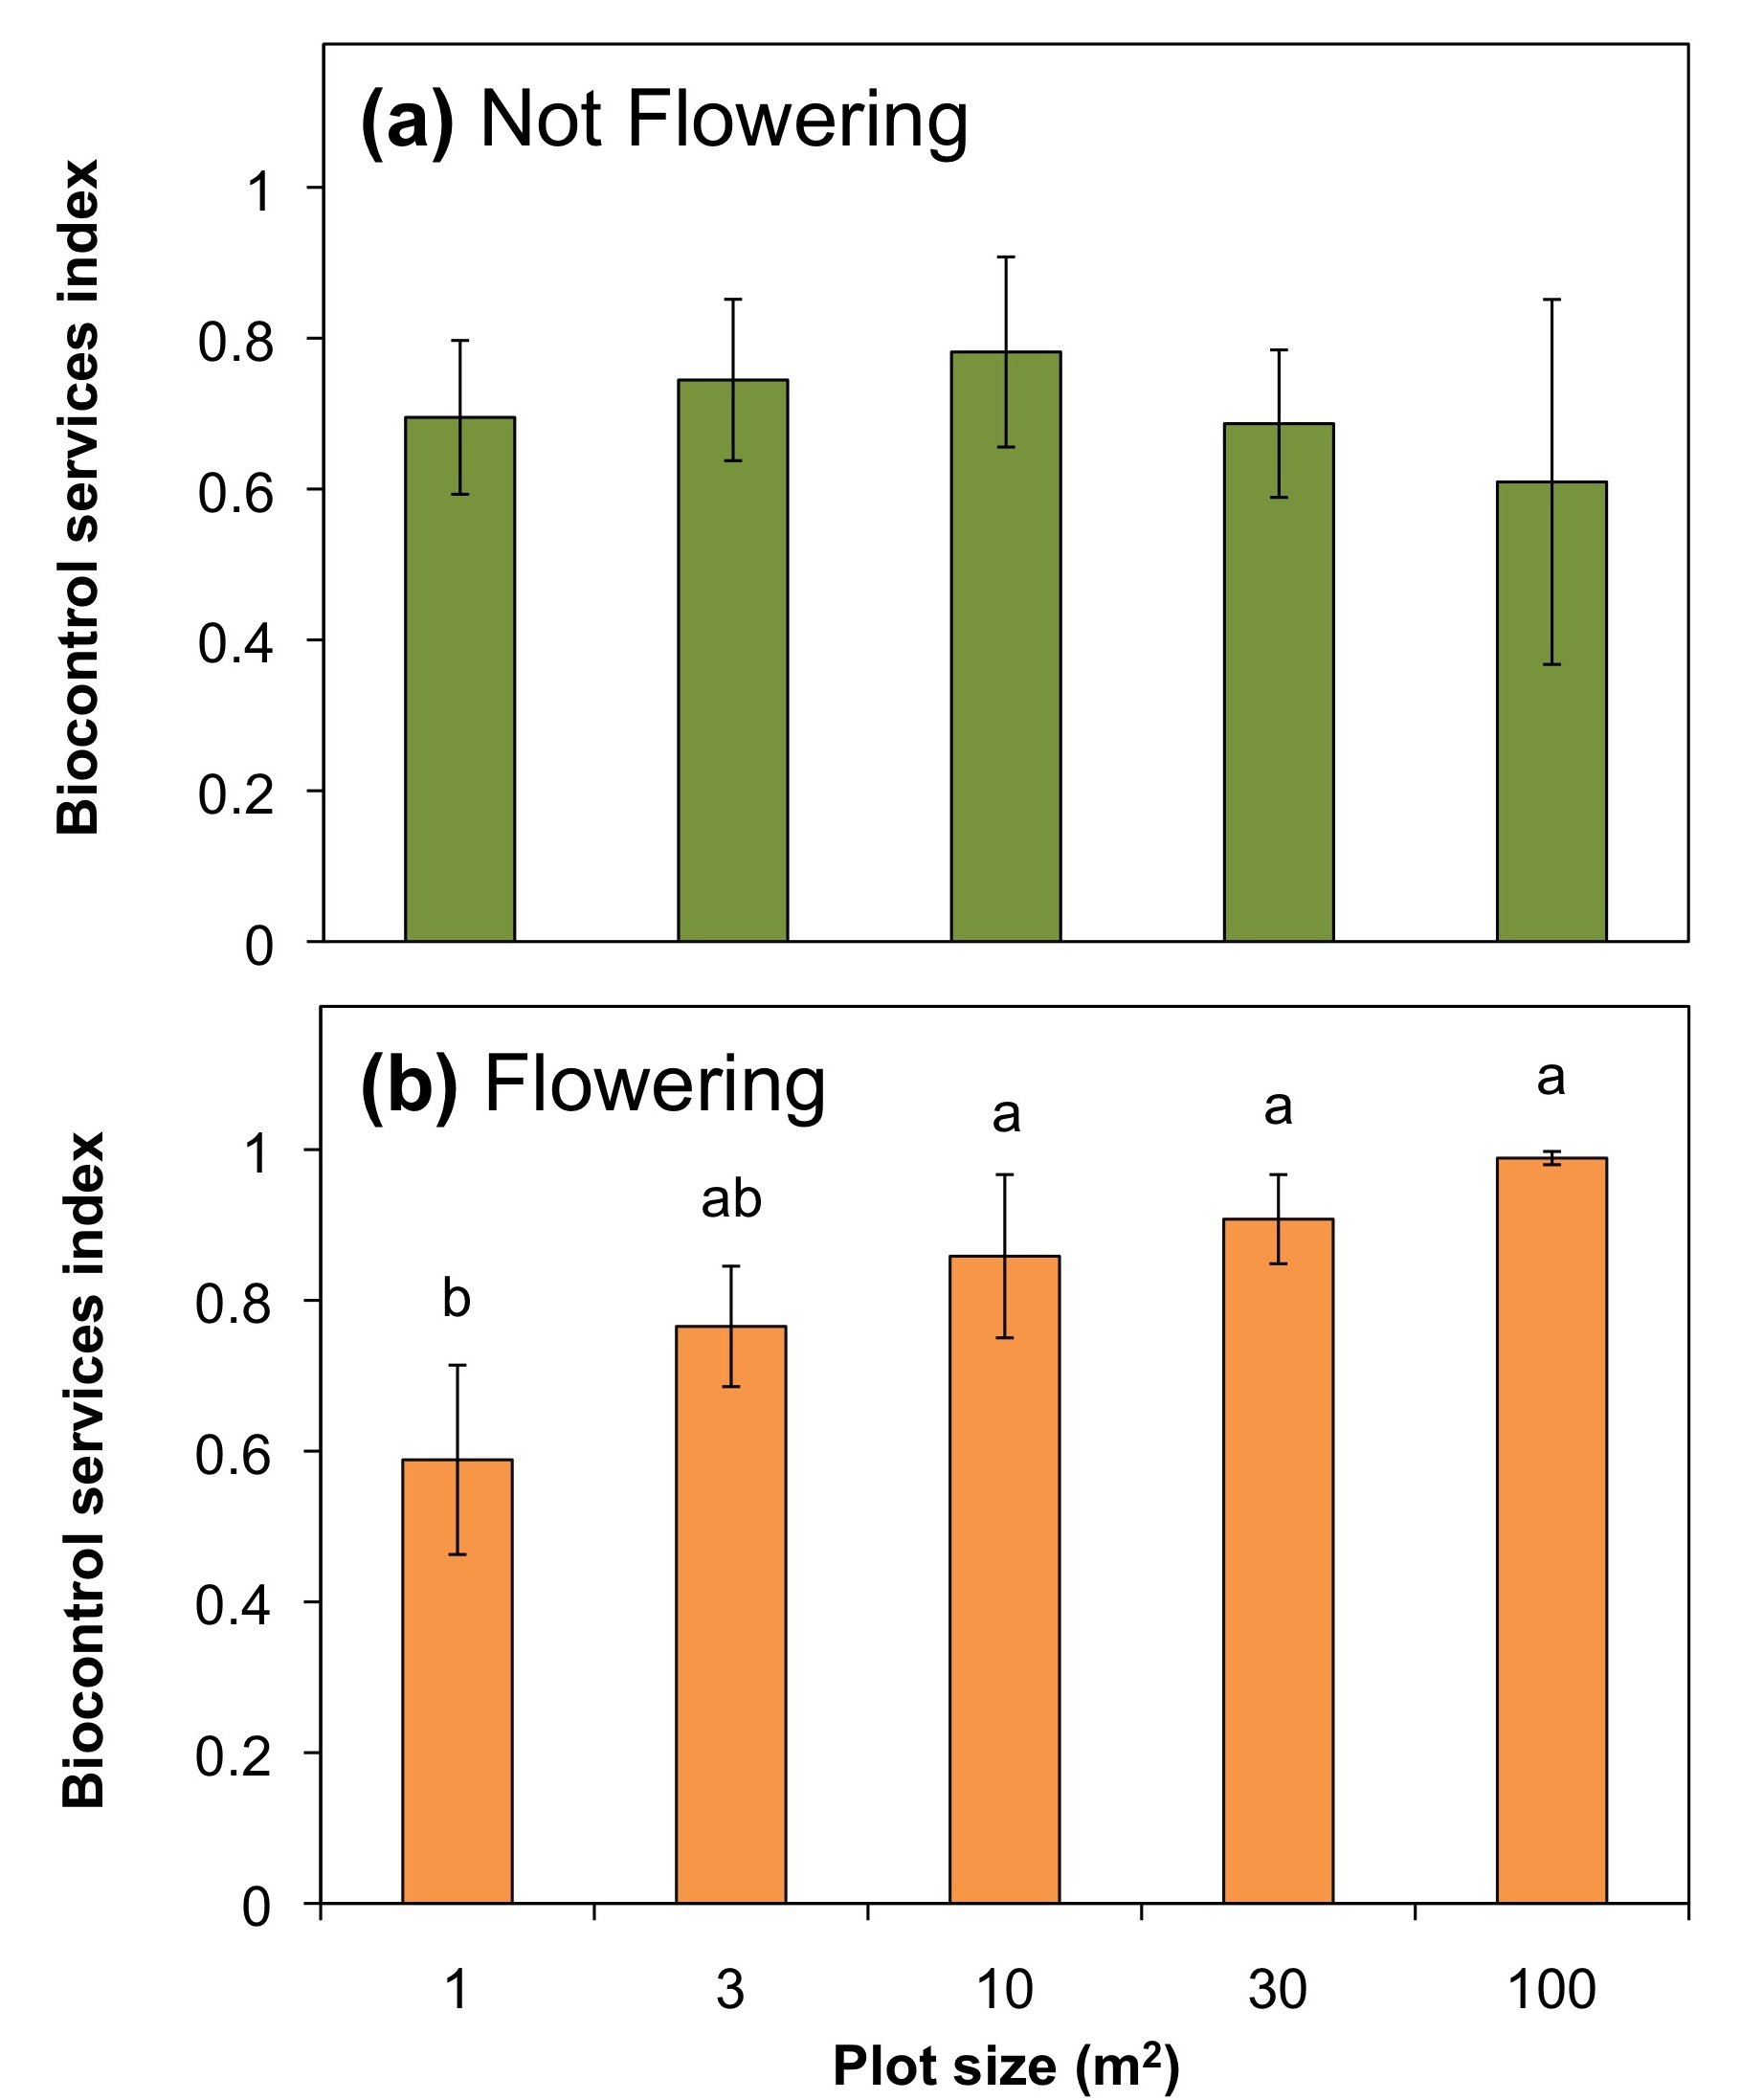
In 2009, aphid abundance on open sentinel soybean plants was not significantly different than those that were caged (F1,98 = 3.78, P = 0.055). Also, neither aphid abundance (F4,45 = 0.94, P = 0.45), nor the BSI value differed significantly among the wildflower plot sizes in 2009 (Figure 9a; F4, 27 = 0.25, P = 0.91). In 2010 with the presence of flowers, the average BSI among all 25 plots was significantly higher than that of 2009 (2010, 0.85 ±; 0.036 and 2009, 0.69 ± 0.052; F1, 71 = 6.31, P = 0.014). Also, in 2010 after two weeks in the flower plots, aphid colony sizes were much lower on the exposed soybean plants compared to the control plants with the mesh cages (F4, 45 = 57.4, P < 0.0001). There was no significant difference in aphid abundance on caged plants among wildflower plot sizes (F4,45 = 3.65, P = 0.832), but as plot size increased the aphid abundance on open plants decreased. Only the open plants in the 100 m2 plots had significantly fewer aphids remaining after two weeks than those in the 1 m2 plots. With increasing plot size there was also an increase in the biological control services index. Plots 10 m2 and larger had significantly greater biological control of soybean aphids than those in the 1 m2 plots (Figure 9b; F5, 44 = 5.62, P = 0.0011). The BSI values were also positively correlated with the density of predaceous insects (r = 0.374, F1, 48 = 29.43, P < 0.0001).
In this study we show that the density, richness, and diversity of natural enemy groups increase with increasing wildflower plot size, and the density of predaceous insects collected in the wildflower plots was also positively correlated with biocontrol services within the plots. Insect herbivore density, on the other hand, did not increase with plot size, particularly when compared to mown grass control areas. This suggests that larger wildflower plantings can selectively support higher densities of beneficial insects and their ecosystem services, which is a promising outcome for potential application wildflower plantings to support insects in agricultural settings to help increase crop yield and regulate pest populations.
As evidence of the benefits of wildflower plantings for enhancing beneficial insects and their services to crops has accumulated throughout this project, growers’ interest in insect conservation has increased. At a blueberry grower meeting in 2009, 18% of those in attendance had an area of their farm dedicated to beneficial insect conservation. At a 2012 grower meeting 90% of the surveyed growers responded that they were somewhat or very likely to implement wildflower plantings at their farms to help conserve beneficial insects. One of our grower cooperators has independently implemented a third wildflower planting at his farm. Two of our other grower cooperators who produce blueberry and cherry are also preparing to establish more wildflower plantings at their farms.
Ahern, R.G. & Brewer, M.J. (2002) Effect of different wheat production systems on the presence of two parasitoids (Hymenoptera: Aphelinidae; Braconidae) of the Russian wheat aphid in the North American Great Plains. Agriculture, Ecosystems, and Environment, 92, 201-210.
Baggen, L.R. & Gurr, G.M. (1998) The influence of food on Copidosoma koehleri (Hymenoptera:Encyrtidae), and the use of flowering plants as a habitat management tool to enhance biological control of potato moth Phthorimaea operculella (Lepidoptera:Gelechiidae). Biological Control, 11, 9-17.
Bianchi, F.J.J.A., Booij, C.J.H. & Tscharntke, T. (2006) Sustainable pest regulation in agricultural landscapes: a review on landscape composition, biodiversity and natural pest control. Proceedings of the
Royal Society of London Series B, 273, 1715-1727.
Biesmeijer, J., Roberts, S., Reemer, M., Ohlemüller, R., Edwards, M., Schaffers, A., Potts, S., Kleukers, R., Thomas, C., Settele, J. & Kunin, W. (2006) Parallel Declines in Pollinators and Insect-Pollinated Plants in Britain and the Netherlands. Science, 313, 351-354.
Borror, D.J. & White, R.E. (1998) A Field Guide to Insects: America North of Mexico, 2 edn. Houghton Mifflin Harcourt, New York.
Büchi, R. (2002) Mortality of pollen beetle (Meligethes spp.) larvae due to predators and parasitoids in rape fields and the effect of conservation strip. Agriculture, Ecosystems, and Environment, 90, 255-263.
Carreck, N.L. & Williams, I.H. (2002) Food for insect pollinators on farmland: insect visits to flowers of annual seed mixtures. Journal of Insect Conservation, 6, 13-23.
Carvell, C., Roy, D., Smart, S., Pywell, R., Preston, C. & Goulson, D. (2006) Declines in forage availability for bumblebees at a national scale. Biological Conservation, 132, 481-489.
Dufour, R. (2000) Farmscaping to enhance biological control. (http://www.attra.org/attrapub/PDF/farmscaping.pdf).
Fiedler, A.K. (2006) Evaluation of Michigan native plants to provide resources for natural enemy arthropods. MS, Michigan State University.
Fiedler, A.K. & Landis, D.A. (2007a) Attractiveness of Michigan native plants to arthropod natural enemies and herbivores. Environmental Entomology, 36, 751-765.
Fiedler, A.K. &; Landis, D.A. (2007b) Plant characteristics associated with natural enemy abundance at Michigan native plants. Environmental Entomology, 36, 878-886.
Fiedler, A.K. & Landis, D.A. (2008) Maximizing ecosystem services from conservation biological control: the role of habitat management. Biological Control, 45, 254-271.
Fox, T.B., Landis, D.A., Cardoso, F.F. & DiFonzo, C.D. (2004) Predators suppress Aphis glycines Matsumura population growth in soybean. Environmental Entomology, 33, 608-618.
Gardiner, M.M., Landis, D.A., Gratton, C., DiFonzo, C.D., O'Neal, M.E., Chacon, J.M., Wayo, M.T., Schmidt, N.P., Mueller, E.E. & Heimpel, G.E. (2009) Landscape diversity enhances biological control of an introduced crop pest in the north-central USA. Ecological Applications, 19, 143-154.
Ghazoul, J. (2007) Challenges to the uptake of the ecosystem service rationale for conservation. Conservation Biology, 21, 1651-1652.
Goverde, M., Schweizer, K., Baur, B. & Erhardt, A. (2002a) Small-scale habitat fragmentation effects on pollinator behaviour: experimental evidence from the bumblebee Bombus veteranus on calcareous grasslands. Biological Conservation, pp. 293-299.
Goverde, M., Schweizer, K., Baur, B. & Erhardt, A. (2002b) Small-scale habitat fragmentation effects on pollinator behaviour: experimental evidence from the bumblebee Bombus veteranus on calcareous grasslands. Biological Conservation, 104, 293-299.
Isaacs, R., Tuell, J.K., Fiedler, A., Gardiner, M. & Landis, D. (2009) Maximizing arthropod-mediated ecosystem services in agricultural landscapes: the role of native plants. Frontiers in Ecology and the Environment, 7, doi:10.1890/080035.
Isaacs, R., Tuell, J.K., Fiedler, A.K., Gardiner, M. & Landis, D.A. (2008) Maximizing arthropod-mediated ecosystem services in agricultural landscapes: the role of native plants. Frontiers in Ecology and the Environment, 7, 196-203.
Johnson, N.F. & Triplehorn, C.A. (2005) Borror and DeLong's Introduction to the Study of Insects, 7 edn. Brooks Cole, Belmont, CA.
Kells, A., Holland, J. & Goulson, D. (2001) The value of uncropped field margins for foraging bumblebees. Journal of Insect Conservation, 5, 283-291.
Kleijn, D. & Sutherland, W. (2003) How effective are European agri-environment schemes in conserving and promoting biodiversity? Journal of Applied Ecology, 40, 947-969.
Kremen, C. & Chaplin-Kramer, R. (2007) Insects as providers of ecosystem services: crop pollination and pest control. Insect conservation biology: Proceedings of the Royal entomological Society’s 23rd Symposium (eds A. Stewart, T. New & O. Lewis), pp. 349-382. CABI Publishing, Wallingford, UK.
Landis, D.A., Gardiner, M.M., van der Werf, W. & Swinton, S.M. (2008) Increasing corn for biofuel production reduces biocontrol services in agricultural landscapes. Proceedings of the National Academy of
Sciences of the United States of America, 105, 20552-20557.
Landis, D.A., Wratten, S.D. & Gurr, G.M. (2000) Habitat management to conserve natural enemies of arthropod pests in agriculture. Annual Review of Entomology, 45, 175-201.
Lavandero, I.B., Wratten, S.D., Didham, R. & Gurr, G.M. (2006) Increasing floral diversity for selective enhancement of biological control agents: A double-edged sward? Basic and Applied Ecology, 7, 236-243.
Letourneau, D.K. & Bothwell, S.G. (2008) Comparison of organic and conventional farms: challenging ecologists to make biodiversity functional. Frontiers in Ecology and the Environment, 6, 430-438.
Long, R.F., Corbett, A., Lamb, C., Reberg-Horton, C., Chandler, J. & Stimmann, M. (1998) Beneficial insects move from flowering plants to nearby crops. California Agriculture, 52, 23-26.
Meyer, B., Gaebele, V. & Steffan-Dewenter, I.D. (2007) Patch size and landscape effects on pollinators and seed set of the horseshoe vetch, hippocrepis comosa, in an agricultural landscape of central Europe.
Entomologia Generalis, pp. 173-185.
Rebek, E.J., Sadof, C.S. & Hanks, L.M. (2005) Manipulating the abundance of natural enemies in ornamental landscapes with floral resource plants. Biological Control, 33, 203-216.
Sanchez, J.A., Gillespir, D.R. & McGregor, R.R. (2003) The effects of mullein plants (Verbascum thapsus) on the population dynamics of Dicyphus hesperus (Heteroptera:Miridae) in tomato greenhouses. Biological Control, 28, 313-319.
Sotherton, N.W. (1998) Land use changes and the decline of farmland wildlife: An appraisal of the setaside approach. Biological Conservation, 83, 259-268.
Tuell, J.K., Fiedler, A.K., Landis, D.A. & Isaacs, R. (2008) Visitation by wild and managed bees (Hymenoptera: Apoidea) to Eastern U.S. native plants for use in conservation programs. Environmental
Entomology, 37, 707-718.
Van Buskirk, J. & Willi, Y. (2004) Enhancement of farmland biodiversity within set-aside land. Conservation Biology, 18, 987-994.
Wanner, H., Gu, H. & Dorn, S. (2006) Nutritional value of floral nectar sources for flight in the parasitoid wasp, Cotesia glomerata. Physiological Entomology, 31, 127-133.
Wanner, H., Gu, H., Gunther, D., Hein, S. & Dorn, S. (2006) Tracing spatial distribution of parasitism in fields with flowering plant strips using stable isotope marking. Biological Control, 39, 240-247.
Zar, J.H. (1999) Biostatistical analysis, 4th edn. Prentice Hall, Upper Saddle River, NJ.
Zurbrügg, C. & Frank, T. (2006) Factors Influencing Bug Diversity (Insecta: Heteroptera) in Semi-Natural Habitats. Biodivers Conserv, 15, 275-294.
- Figure 5. The top ten most abundance insect natural enemies collected via vacuum sampling in wildflower plots (N=8402).
- Figure 6. (a) Density of insect natural enemies (mean ± standard error of the mean (SE)) for the different sized flower plots. (b) Insect natural enemy group richness (mean ± SE) for the different sized wildflower plots. (c) Shannon-Wiener diversity index of insect natural enemy groups (mean ± SE) for the different sized flower plots. Bars within a graph with the same letter are not significantly different (ANOVA, followed by comparisons for each treatment using Student’s t with Bonferroni correction, a = 0.01).
- Figure 7. The top ten most abundance insect herbivores collected via vacuum sampling in wildflower plots (N=4536).
- Figure 9. Biocontrol Services Index values (mean ± SE) for predation of soybean aphid, Aphis glycines, colonies placed in wildflower plots that varied in size from 1-100 m2. (a) 2009. There was no significant difference among treatments. (b) 2010. Bars with the same letter are not significantly different (ANOVA, followed by comparisons for each treatment using Student’s t with Bonferroni correction, a = 0.01).
- Figure 4. The top row of bar graphs are the comparison of native bee abundance with wildflower plot size during three different periods that correspond to the bloom periods for three different wildflower species; sand coreopsis (early-season), cup plant (mid-season), and New England aster (late-season). The bottom row of graphs compare the number of mature seeds among different sized wildflower plots for the same three native flower species; sand coreopsis, cup plant, and New England aster.
- Figure 3. The total bee community observed visiting wildflower plots in 2011 (N=673).
- Figure 8. (a) Density of herbivorous insects (mean ± SE) for the different sized flower plots. (b) Insect herbivore group richness (mean ± SE) for the different sized wildflower plots. There was no significant difference amongst treatments. (c) Shannon-Wiener diversity index of insect herbivore groups (mean ± SE) for the different sized flower plots. Bars within a graph with the same letter are not significantly different (ANOVA, followed by comparisons for each treatment using Student’s t with Bonferroni correction, a = 0.01).
Educational & Outreach Activities
Participation summary:
The natural enemy and biological control portion of this project has been published in the journal Ecological Entomology: Blaauw, B. and Isaacs, R. (2012) Wildflower plot size influences attraction of natural enemies and their delivery of ecosystem services. Ecological Entomology, 37: 386-394.
In collaboration with a professor from Rutgers University, we used the knowledge gained from this project to help write a book chapter on habitat manipulation to help support beneficial insects in agricultural ecosystems: Cesar Rodriguez-Saona, Brett R. Blaauw and Rufus Isaacs (2012). Manipulation of Natural Enemies in Agroecosystems: Habitat and Semiochemicals for Sustainable Insect Pest Control. In Integrated Pest Management and Pest Control - Current and Future Tactics, Eds. M. L. Larramendy and S. Soloneski. pp 89-126. InTech.
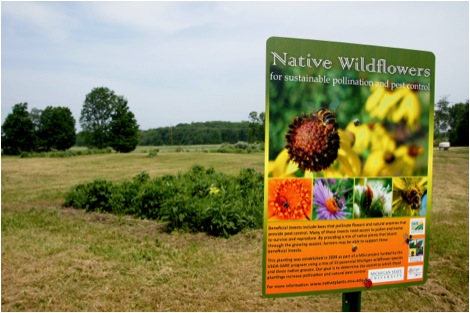
The well established “Native Plants and Ecosystem Services” website from Michigan State University (http://nativeplants.msu.edu/) is continually updated with information on native plants of Michigan and how they can be used to help support ecosystem services, including information and images gained from this project. We also created an informational sign that introduces readers to this project and to the concept of beneficial insect conservation and placed it at our wildflower plots at the Trevor Nichols Research Center in Fennville, MI (Figure 11).
The following are the authors, titles of presentations, and the meetings we presented results and information from this SARE funded project at:
Presented a talk on the conservation of beneficial insects to elementary students at Washington Elementary’s Science Day in Charlotte, MI on February 23, 2012.
Brett R. Blaauw and Rufus Isaacs. 2012. The effect of native wildflower planting size on beneficial insects and their ecosystem services. Science, Practice & Art of Restoring Ecosystems Conference in East Lansing, MI.
Brett R. Blaauw and Rufus Isaacs. 2011. Enhancing Natural Enemies in Crops Using Flowering Plants. Great Lakes Fruit, Vegetable and Farm Market EXPO in Grand Rapids, MI. Invited oral presentation.
Brett R. Blaauw and Rufus Isaacs. 2011. Conserving Native Bees in Blueberry and Other Small Fruit. Great Lakes Fruit, Vegetable and Farm Market EXPO in Grand Rapids, MI. Invited oral presentation.
Presented a talk, “Enhancing Beneficial Insects with Wildflowers,” at the Michigan’s Stewardship Network’s, “Please Bug Me!” workshop at Calvin College on June 18, 2011.
Presented at and helped arrange two meetings: Conserving Beneficial Insects for Pest Suppression and Crop Pollination supported by USDA-SARE, MSU Extension, and Michigan Agricultural Experiment
Station. These two meetings were designed to help growers learn to identify native bees and natural enemies, establish and maintain wildflower plantings, update on current MSU-SARE research, and inform
on cost sharing opportunities that exist to help establish habitats for beneficial insects.
o September 2nd, 2010. Suttons Bay, MI.
o September 9th, 2010. Trevor Nichols Research Complex in Fennville, MI.
Presented a talk on biocontrol and pollination of blueberries to elementary students at Galewood Elementary’s Science Day in Charlotte, MI on November 3, 2009.
Presented a talk on “Native plant conservation strips for sustainable pollination and control in fruit crops,” at Michigan’s Organic Tree Fruit Grower Association’s Organic Apple Field Day at Almar Orchard in
Flushing, MI on June 25, 2009.
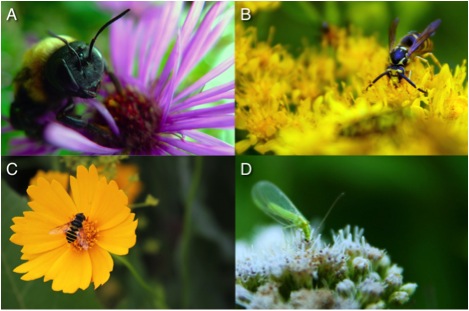
At those talks we also made sure to explain to people that all insects are not bad and that good insects do exist. We did this by describing our project and the importance of pollination and biological control, and also by showing pictures of actually beneficial insects visiting our wildflower plots (Figure 12). That approach helps people identify beneficial insects as well as understand that insects are not necessarily gross or scary.
- Figure 11. Example of an informational project sign placed at wildflower plantings and designed as an introduction to the project for visitors to Michigan State University’s Trevor Nichols Research Center.
- Figure 12. Examples of beneficial insects observed visiting wildflowers in the size plots at Trevor Nichols Research Center. A.) a carpenter bee on New England aster, B.) a wasp feeding on stiff golden rod flowers, C.) a hoverfly visiting a sand coreopsis flower, and D.) a green lacewing feeding on boneset flowers.
Project Outcomes
After reviewing the early results from this project, two of our grower cooperators have established or are in the process of establishing another wildflower planting their farms. While presenting at extension and grower meetings we have also received reports of other growers not attached to this project who are currently working with NRCS to establishing wildflower plantings at their farms. This includes one grower who has established an estimated 40 acres of pollinator habitat at his farm within the past couple of years and will soon be working on a project with the Berry Crop Entomology Lab at MSU on the effects of this type of habitat on native bees. Also, Esther Durnwald of the Michigan Wildflower Farm, who provides native wildflower seed for restoration projects, has observed an increase over the past few years in the interest from clientele in purchasing wildflower seeds that can be used to help support insect pollinators. Resulting from this interest, she now produces and sells pollinator specific seed mixes to growers and the public who are interested in supporting beneficial insects.
The results from this project provide evidence supporting the hypothesis that beneficial insects and their services can be supported and potentially enhanced with the addition of larger wildflower plantings. However, direct evidence of insects visiting wildflower plantings and then traveling into adjacent crops is
lacking, and we cannot yet answer the question of how far into a crop field we can expect these beneficial insects to travel. The knowledge we gained from this SARE funded project was crucial in supporting a successful $25 thousand proposal to MSU’s Project GREEEN led by Dr. Isaacs and Brett Blaauw to focus on using inexpensive immuno-marking methods to answer questions related to the distribution of both beneficial and pest insects in agricultural landscapes in response to wildflower plantings.
Economic Analysis
The major cost of establishing a conservation strip is the initial investment in native wildflower plants. This project used one year old plants, which cost nearly $2 a plant. For our largest wildflower plots of 100m2, which had 768 seedlings, it would cost nearly $1,500 to establish such a plot, and that does not include the cost of labor to plant those seedlings. Using seedlings would be well over $10,000 per acre, so for a farm setting, establishing a wildflower planting using seedlings may not be economically feasible.
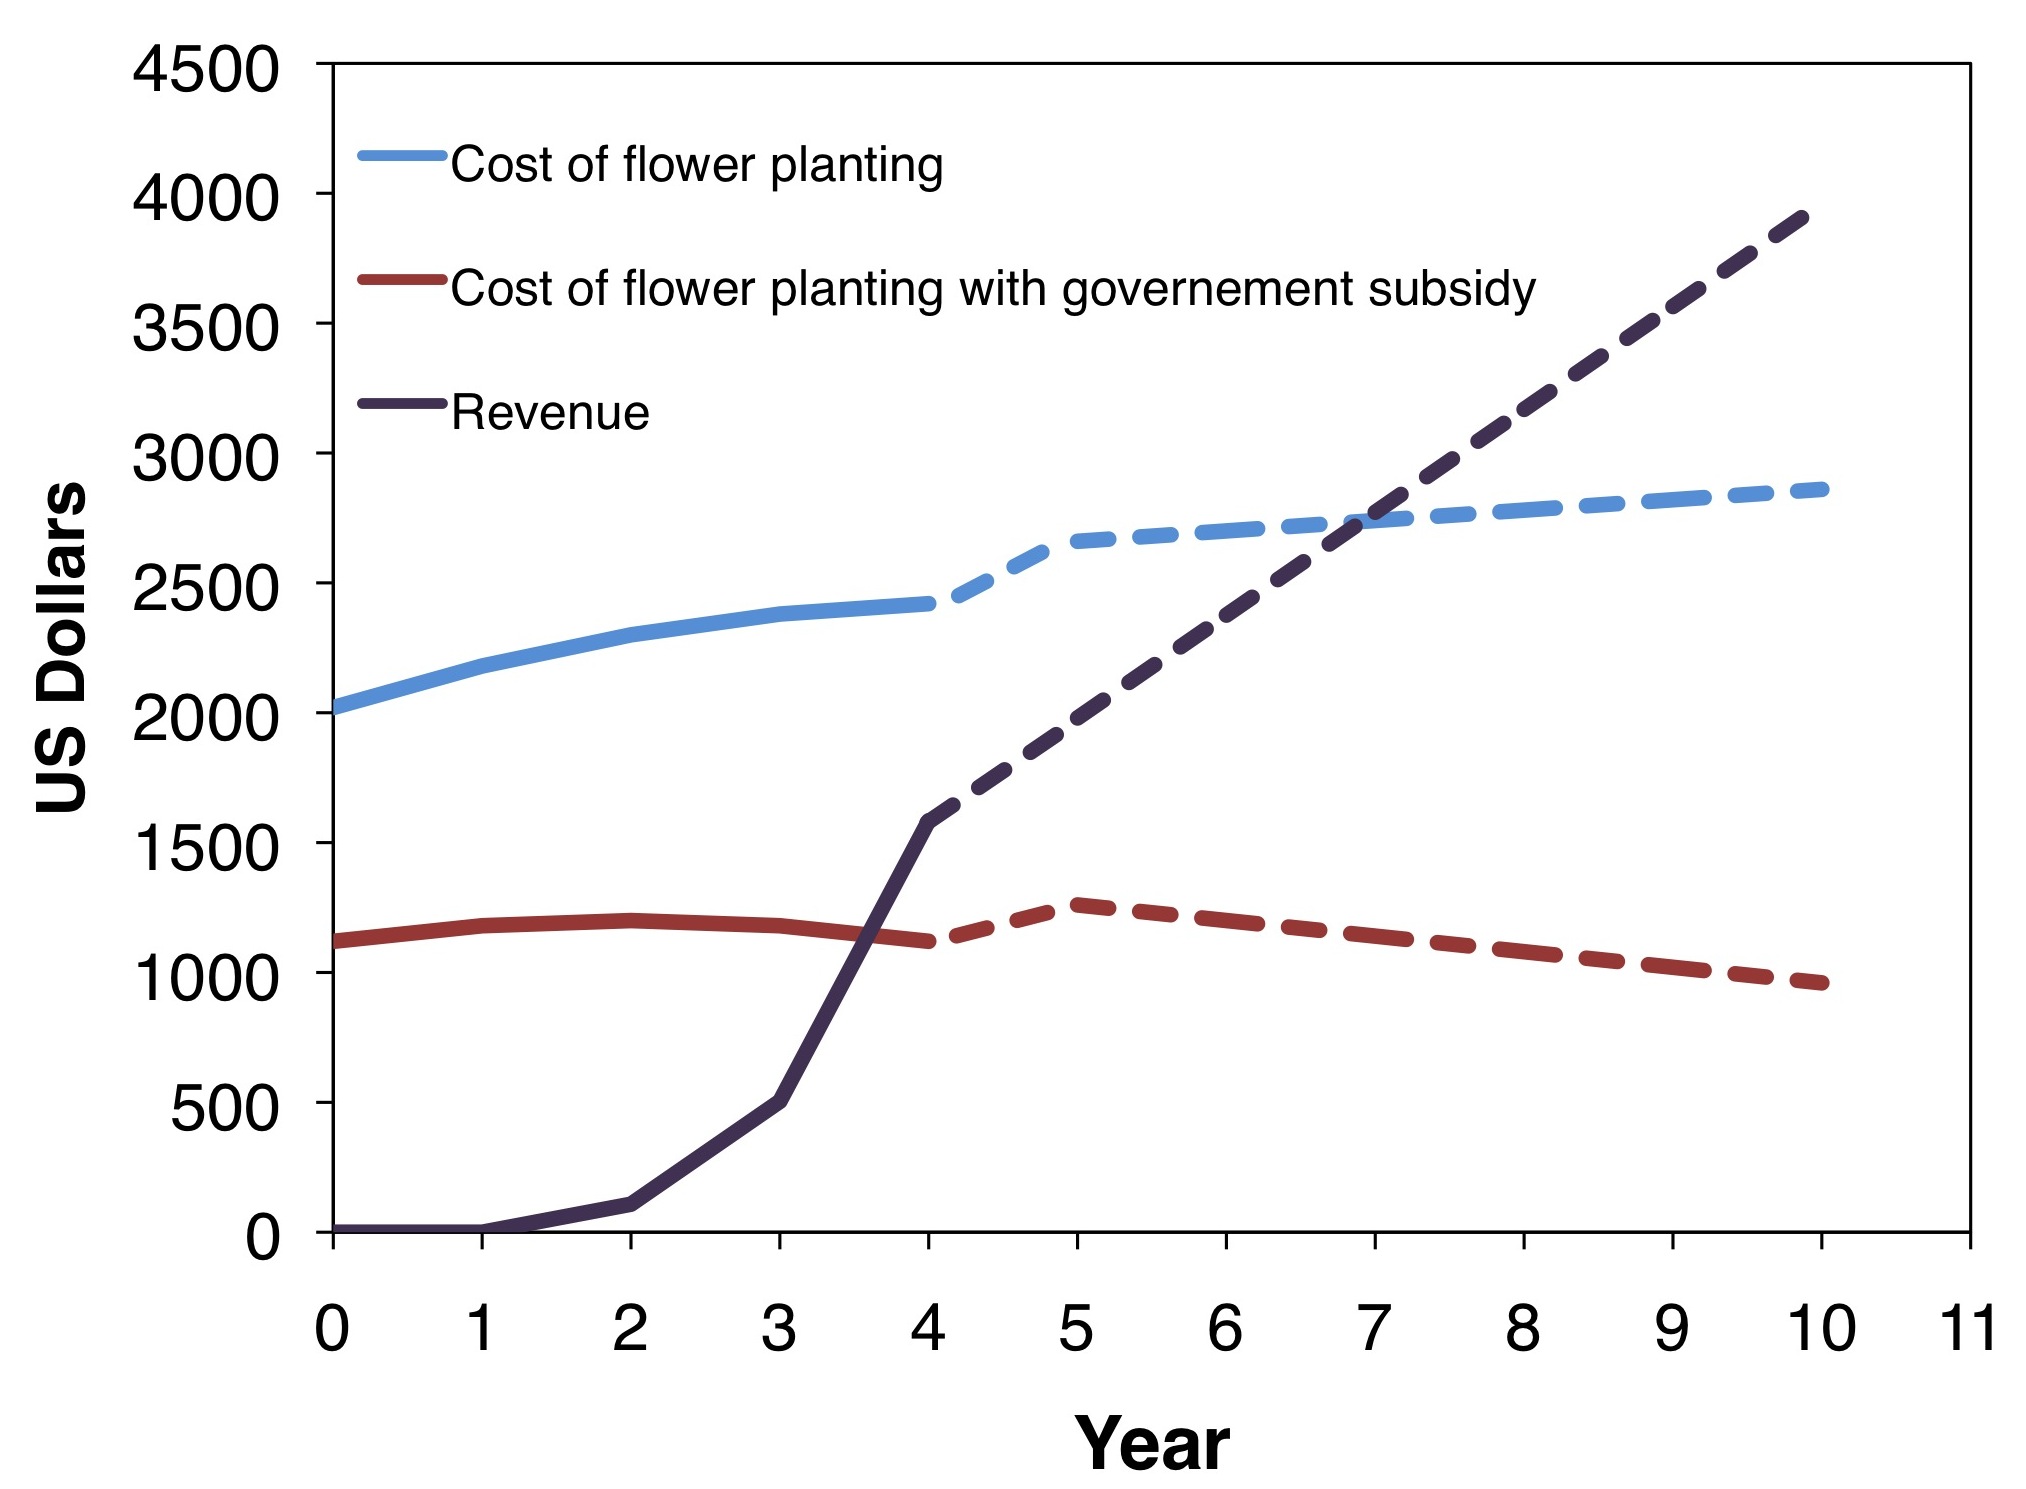
With that in mind, for another SARE funded project (LNC08-297) we established wildflower plantings in agroecosystems using seeds. The wildflower seed mix used in that project cost a sum of $875 per acre for a total of four pounds of seed. On an average, with that approach, the initial cost of establishing a wildflower planting for the first year including site preparation, seeds and seeding, and site maintenance would be roughly $1,200 per acre. This is a costly first step, but on an average, the expenses due to site maintenance during the second and third years drop to roughly $120 per acre and even smaller in year three at about $37 per acre. It is also important to note that there are incentive payments available through government agencies to help cover the cost of establishing these plantings. The data from that SARE funded project (LNC08-297) also showed that within a few years these plantings could potentially pay for themselves. For example, using estimated yield data from a 10 acre blueberry farm next to a 2 acre wildflower planting during the four years of this project, we were able extrapolate out to 10 years of cumulative costs and revenue incurred from establishing the planting (Figure 10, see above). With the benefits from adjacent floral resources on crop yield, an unsubsidized farm of 10 acres with a 2 acre wildflower planting could pay off the establishment and maintenance costs of these plantings within seven years after planting (Figure 10). With a 90% government subsidy (similar to Michigan’s CRP-SAFE program), such a planting may see revenue within the first four years after planting. It is important to continue to improve our understanding of the costs and benefits of these wildflower plantings on crop production in order to help growers better decide whether to adopt this approach at their own farms.
Farmer Adoption
Convinced by the early results from this project, one of our apple grower cooperators has began work on establishing another wildflower planting at his farm in the spring of 2011. Currently, one of our blueberry grower cooperators is working with NRCS to establishing another conservation strip at his farm. Also, our native wildflower seed provider, Esther Durnwald from Michigan Wildflower Farm, has observed an increase over the past few years in the interest from clientele in purchasing wildflower seeds that can be used to help support insect pollinators.
Across Michigan, there is increasing adoption of wildflower plantings for pollinators, in part through the USDA Farm Service Agency SAFE program for pollinators. This now has over 1000 acres enrolled in forbrich plantings for supporting bees on fruit and vegetable-producing farmland.
Areas needing additional study
We can conclude that pollinators and insect natural enemies, as well as their pollination and biological control services are sensitive to the area of wildflower plantings, even at a relatively small scale. The largest wildflower planting tested in this study (100 m2) was comparatively small in terms of the scale of habitat plantings being established on farms for beneficial insect conservation, so future examination of larger habitat patches would help determine the response of natural enemies to broader ranges of habitat patch size. Also, while it is important to understand how insects respond to habitat size, growers are more concerned with how these plantings can help support beneficial insects and their services in a farm setting. Therefore, additional work is needed to further understand the importance of wildflower planting layout and distribution within the agroecosystem, and the subsequent response by beneficial insects. Along similar lines, it is also important to determine how the surrounding landscape affects beneficial insects and their services to the crops. An increased understanding of insect dispersal and behavior to and from wildflower plantings will help better understand the best placement of these habitats and what insects may benefit the most from their establishment in agroecosystems.