Final Report for GNC13-169
Project Information
In the first study, we measured biomass yield and nutrient uptake in alley cropping agroforestry systems consisting of four herbaceous perennial crops and two short-rotation woody crops (SRWC) at Empire, MN, a site with a history of biosolids application. Alley systems consisted of herbaceous perennials switchgrass, prairie cordgrass, ‘Rush’ intermediate wheatgrass, and an 11-species native polyculture planted between rows of ‘NM6’ poplar and ‘Fish Creek’ willow. Alley cropping with poplar maximized biomass yields (13.5 Mg ha-1 yr-1), irrespective of herbaceous crop. Poplar – intermediate wheatgrass systems had among the highest N, P, and K uptake (477, 62, and 301 kg ha-1, respectively). NM6 poplar outperformed Fish Creek willow over the first four years. Intermediate wheatgrass showed the greatest potential for N, P, and K uptake in alley cropping systems, though the native polyculture and prairie cordgrass also performed well and are better choices for sites with occasional flooding.
In the second study, we evaluated changes in SOC, and C sequestration and nutrient accumulation in root biomass in perennial alley cropping systems over four years at Empire, Minnesota. Accumulation of C and N was greater in poplar than willow alley cropping systems, and greater in alleys with prairie cordgrass than any other herbaceous crop. Intermediate wheatgrass and prairie cordgrass fine root biomass, C sequestration, and nutrient accumulation were generally greater in willow than poplar alleys. The majority of C sequestered and nutrients accumulated were in SRWC, with the largest pool being fine roots. SRWC and herbaceous crop selection did not influence SOC, though SOC declined from 2010 to 2013. The NM6 poplar – prairie cordgrass system had among the highest C sequestration and nutrient accumulation.
In the third study, we found that competition for light and soil water substantially reduced native polyculture and prairie cordgrass yield up to 2.4 m from willow rows at Empire, but competition for soil nitrate was not evident. Competition for soil moisture occurred up to at least 2.4 m from tree rows in these alley systems, depending on seasonal water availability. The relative impact of competition was similar for prairie cordgrass and a native polyculture, though the former had slightly higher yields overall.
Over the first four years of study, NM6 poplar – intermediate wheatgrass and NM6 poplar – prairie cordgrass alley cropping systems performed best overall in terms of biomass yield; nutrient accumulation and removal; and C sequestration in belowground biomass. NM6 poplar – native polyculture systems performed nearly as well, except that they sequestered less C.
Introduction:
Recently, increasing the “perennialization” of agriculture in the US Midwest has become an issue of national attention due to a variety of concerns such as water quality and regulation, decline of pollinators, control of pests and pathogens, C emissions, and resilience to climate change (Boody et al. 2005; Jordan and Warner 2010; Asbjornsen et al. 2013). Agroforestry, the intentional integration of woody perennials with crops or livestock, has been promoted as one approach to perennialization that can help address environmental concerns and provide a wide range of goods and services to society, including C sequestration, nutrient retention, and lignocellulosic feedstocks for bioindustrial applications (Holzmueller and Jose 2012; Bardhan and Jose 2012; Ehret et al. 2015). Agroforestry systems have shown potential for production of C neutral or negative biomass feedstocks for energy and fuel production using perennial herbaceous and short rotation woody crops (SRWC) (Gamble et al. 2014; Ehret et al. 2015; Lamerre et al. 2015; Gamble et al. 2016). Energy and fuels derived from such systems could displace more C-intensive fossil fuels (Holzmueller and Jose 2012), and the combined effects of C sequestration and fuel substitution could substantially improve GHG mitigation and offsets relative to other land use options (Jose and Bardhan 2012).
In the US Midwest, agroforestry systems such as alley cropping and riparian buffers show particular promise for biomass feedstock production due to their potential adaptability, both spatially and logistically, to modern farming systems (Holzmueller and Jose 2012; Jose and Bardhan 2012). Widely spaced tree rows in alley cropping systems lend well to the high degree of mechanization present in modern farming, while perennial biomass crop-based buffers strips could fit strategically into lowland or floodplain agricultural sites to protect waterways. However, little is known about how spatially integrating woody and herbaceous perennial crops will affect biomass production, C sequestration, and nutrient accumulation in such systems.
Riparian buffers composed of woody and herbaceous perennial vegetation can sequester substantial nutrient loads (Schultz et al. 1995; Lee et al. 2003; Schoonover et al. 2005). However, nutrients sequestered in riparian vegetation are, over time, mineralized through decomposition and could enter waterways (Vanek 1991; Jaynes and Isenhart 2014). Therefore, the efficiency of nutrient removal could be enhanced through repeated harvest of aboveground vegetation. Certain perennial biomass crops could be well suited to this niche due to their rapid growth rates, high productivity in lowland or floodplain agricultural sites, and nutrient export offsite with repeated harvesting (Pallardy et al. 2003; Tufekcioglu et al. 2003; Lee et al. 2009; Thelemann et al. 2010; Fortier et al. 2010b; Wilson et al. 2014; Zilverberg et al. 2014).
Short rotation woody crops (SRWC) such as hybrid poplar (Populus spp.) and shrub willow (Salix spp.) are ideal for biomass production and nutrient sequestration in temperate regions because they are easily propagated, quick to establish, fast growing, high yielding, and can be harvested many times before replanting. Poplars and willows have been used to remediate nutrients in municipal wastewater (Holm and Heinsoo 2013), biosolids (Heller et al. 2003; Börjesson and Berndes 2006; Felix et al. 2008), landfill leachate (Zalesny et al. 2008), and have been used in riparian buffers to intercept nutrient flows from upland sources (Tufekcioglu et al. 2003; Lee et al. 2003; Young and Briggs 2005; Young and Briggs 2007; Fortier et al. 2010a; Jaynes and Isenhart 2014). Herbaceous perennial crops such as native grasses and native grass-forb-legume polycultures have also been promoted as suitable biomass crops for lowland or marginal sites (Wilson et al. 2014; Zilverberg et al. 2014), though less is known about their nutrient sequestration potential since they are often promoted and utilized as low-input crops. However, data on nutrient removal from harvested plant material is important for effective design and management of any cropping system, including biomass systems. In buffer strips that are used to manage nutrients from agricultural fields, or systems designed to manage wastes like biosolids or manure, crops with low nutrient use efficiency and high nutrient removal are desirable.
Few studies have assessed the potential of perennial biomass crops as C and nutrient sinks in the riparian zone. Fortier et al. (2010a) assessed nutrient accumulation in a variety of poplar clones in southern Quebec, while Tufekcioglu et al. (2003) assessed N accumulation in poplar and switchgrass buffers in Iowa. In both cases, the buffers were not explicitly managed as biomass production systems, though each showed greater potential for nutrient accumulation in poplar or switchgrass buffers relative to cool-season grass or unmanaged buffers. To our knowledge, no studies have assessed the biomass production, C sequestration, and nutrient uptake potential of integrated woody and herbaceous perennial biomass cropping systems. Little is known about appropriate species combinations that optimize productive potential of SRWC and herbaceous biomass crops when grown in agroforestry configurations.
Roots play an important role as C and nutrient sinks in perennial bioenergy systems. In shrub willow bioenergy systems in New York, Pacaldo et al., (2013) found that root C accounted for 69% of total C sequestered. In a switchgrass bioenergy production system in Washington, root C accounted for 47% of total C sequestered (Collins et al. 2010). In addition to C, a substantial portion of the nutrients in bioenergy crops can be found in the roots. Translocation of nutrients from aboveground to belowground plant components during the dormant season influences nutrient harvest, which has implications for nutrient cycling, fertilizer requirements, long term productivity, and C sequestration. Quantifying nutrient accumulation in the belowground biomass that remains in-field following aboveground biomass harvest is important for understanding plant nutrient cycling and will provide insights as to the ability of various perennial biomass crops to act as nutrient sinks.
The objectives of the first study were to determine the best pairing of perennial woody and herbaceous crops to maximize biomass yield and nutrient uptake in alley cropping systems at the Empire field site. The objectives of the second study were to: 1) quantify root C, and root nutrient accumulation of alley cropped SRWC and herbaceous perennial crops; 2) determine the spatial distribution and relative allocation of belowground biomass C within alley systems; and 3) quantify changes in SOC and total system C (belowground biomass C + SOC) associated with alley cropped SRWC and herbaceous perennial crops. The objective of the third study was to evaluate the spatiotemporal variation in PAR, soil water potential, and soil NO3 in these alley cropping systems, and to use these data to explain observed patterns in herbaceous crop yield
Cooperators
Research
The study was established in May and June 2010 on a stream terrace near Empire, MN (Figure 1). The previous cropping system was continuous corn. Annual spring applications of municipal biosolids from 2000 to 2010 prior to establishment of the experiment resulted in very high levels of P and K at this site (Table 1). The experimental design was a randomized complete block in a split-plot arrangement. Three replicates were established at Empire and Granada, and two replicates were established at Fairmont. Two SRWC were randomly assigned to 38.1 m by 36.6 m whole plots and four herbaceous crops were randomly assigned to 12.2 m by 9.1 m subplots within each whole plot. Woody crops were established in multi-row strips, with a 15.2 m alleyway between strips and a 1.5 m unsown buffer between trees and herbaceous crops on each side of the alley (Figure 2). Woody crops were ‘NM6’ poplar (Populus maximowiczii x P. nigra) and ‘Fish Creek’ willow (Salix purpurea). Herbaceous crops were a local, lowland-ecotype switchgrass (Panicum virgatum L.), prairie cordgrass (Spartina pectinata Bosc ex Link), a mixture of Pioneer Brand ‘54V48’ alfalfa and ‘Rush’ intermediate wheatgrass (Thinopyrum intermedium [Host] Barkworth and Dewey cv. Rush), and an eleven species native tallgrass-forb-legume polyculture (Table 2).
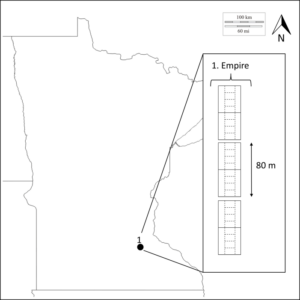
Fig 1. Location of study site within Minnesota. Inset shows number and orientation of replicates. For each replicate, whole plot boundaries are denoted by solids lines and subplot boundaries by dashed lines.
Table 1. Selected site and soil characteristics at Empire, Minnesota
|
Characteristic |
Empire |
|
Latitude, Longitude |
44.7178, -93.0975 |
|
Landform |
Stream terrace |
|
Soil classification |
Cylinder loam (fine-loamy over sandy or sandy-skeletal, mixed, superactive, mesic aquic hapludolls) |
|
Soil organic matter (g kg-1)† |
52 |
|
Soil pH |
5.5 |
|
Soil total N (g kg-1) |
2.6 |
|
Soil C/N |
11.35 |
|
Soil NO3- (mg kg-1) |
25.4 |
|
Soil Bray P (mg kg-1) |
964 |
|
Soil NH4OAc-K (mg kg-1) |
236 |
|
Previous management |
Continuous corn with biosolids |
|
Alley orientation (rep 1, 2, 3) |
0º, 0º, 0º |
|
No. days flooded (rep 1, 2, 3) |
0, 7, 0 |
†Soil samples collected in May 2010
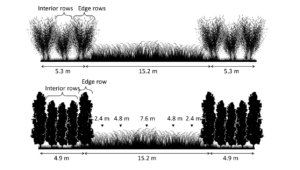
Fig 2. Fish Creek willow (top) and NM6 poplar (bottom) alley cropping system configuration and herbaceous crop sample locations with distance from tree rows. At Empire, sampling distances are denoted as either west or east of the center of the alley.
Table 2. List of species planted in the native polyculture treatment
|
Common Name |
Latin name |
Functional group |
|
Canada wild rye |
Elymus Canadensis L. |
Grass |
|
Switch grass |
Panicum virgatum L. |
Grass |
|
Big bluestem |
Andropogon girardii Vitman |
Grass |
|
Partridge pea |
Chamaecrista fasiculata Michx. |
Legume |
|
Purple prairie clover |
Dalea pupureum Vent. |
Legume |
|
Canada milkvetch |
Astragalus canadensis L. |
Legume |
|
Showy tick-trefoil |
Desmodium canadense L. |
Legume |
|
Wild bergamot |
Monarda fistulosa L. |
Forb |
|
Maximilian Sunflower |
Helianthus maximiliani Schrad. |
Forb |
|
Smooth blue aster |
Symphyotrichum leave (L.) Á. Löve & D. Löve var. laeve |
Forb |
|
Yellow coneflower |
Ratibida pinnata (Vent.) Barnhart |
Forb |
A local ecotype prairie cordgrass was planted at Fairmont and Granada. At Empire, ‘Red River’ prairie cordgrass was planted. Switchgrass and native polyculture seed were grown or collected in Minnesota and were purchased from Feder Prairie Seed Company (Blue Earth, MN). Alfalfa and intermediate wheatgrass seed were purchased from Albert Lea Seed House (Albert Lea, MN), and the initial mixture was 64 % alfalfa and 36 % intermediate wheatgrass by seed count.
Willows were established following guidelines in the Willow Biomass Producer’s Handbook (Abrahamson et al. 2002) in three twin rows on either side of the alley, with 75 cm between rows, 60 cm between plants within a row, and 150 cm between twin rows. This resulted in a planting density of 7,596 willows ha-1 when accounting for area occupied by herbaceous crops. Poplars were established in five rows on either side of the alley, at 1.2 m within and between rows (Debell et al. 1996; Debell et al. 1997; Benomar et al. 2012). This resulted in planting density 3,402 poplars ha-1 when accounting for area occupied by herbaceous crops. Following established management guidelines, willows were coppiced following the first growing season, while poplars were not coppiced (Herve and Ceulemans 1996; Volk 2002). Pre-coppice willow biomass was not added to first rotation biomass estimates.
By late 2011, alfalfa-intermediate wheatgrass subplots at Empire and Granada contained no alfalfa. Therefore, this treatment will be referred to hereafter as “intermediate wheatgrass”. At Fairmont, no herbaceous treatments were successfully established in 2010. In 2011, the native polyculture was established in all subplots at Fairmont; therefore results from this site do not include switchgrass, prairie cordgrass, or intermediate wheatgrass treatments. Native polyculture biomass harvest was not conducted at Fairmont until 2012 and 2013. In mid-June 2012 and 2013, switchgrass, prairie cordgrass, and intermediate wheatgrass plots at Granada and Empire were sprayed with 0.32 L a.i. ha-1 clopyralid [3,6-dichloro-2-pyridinecarboxylic acid, monoethanolamine salt] to control broadleaf weeds. A detailed description of crop establishment and management in 2010 and 2011 can be found in Gamble et al., (2014).
Field and laboratory methods
In November 2013, willow yield was determined from a 2.8 m2 area (1 twin row comprising six trees) along the tree-crop interface (edge rows) and in the center of the hedgerow (interior rows) on each side of the alley for each willow – herbaceous crop combination, for a total of 192 trees in each replicate. Poplar yield was determined by harvesting a 4.5 m2 area (3 trees) in each of the first (edge), second, and third (center) rows from the tree-crop interface on each side of the alley for each poplar – herbaceous crop combination, for a total of 144 trees in each replicate. Trees were chipped and weighed to determine aboveground wet leafless biomass yield. Wood chip subsamples were then dried to a constant weight at 60 ºC to calculate biomass yield on a dry weight basis.
Biomass yield of herbaceous alley crops was measured in fall of 2010 - 2013 following a killing frost (0º C). Herbage biomass was harvested from a 2.78 m2 area (0.91 m x 3.05 m) with a flail-type forage harvester to a 10 cm stubble height in the alley center (7.6 m from the nearest tree) and at both edge positions (2.4 m from tree rows). In 2013, two additional samples were collected; each located between the alley center and alley edge positions at 4.8 m from tree rows. In all years, herbaceous samples were weighed following harvest to obtain fresh weights and 1000 g sub-samples were dried to a constant weight at 60 ºC to calculate biomass yield on a dry weight basis. Weed biomass was manually separated from crop biomass in dried sub-samples to obtain weed free biomass yield estimates.
For both woody and herbaceous biomass, dried subsamples were ground with a Wiley mill (Thomas-Wiley Mill Co., Philadelphia, PA, USA) to pass a 1 mm screen, and then reground with a cyclone mill. Nutrient concentrations were determined with inductively coupled plasma (ICP) mass spectroscopy following digestion with HNO3 and H2O2 (Gavlak et al. 2003), except for N, which was determined via dry combustion and a Perkin- Elmer 2400 CHNS analyzer (Perkin – Elmer Inc., Waltham, MA, USA) by Brookside Laboratories, Inc. (New Bremen, OH, USA).
Herbaceous biomass yield and nutrient uptake are reported on a subplot basis (Mg or kg ha-1) for each year and were then summed over years to obtain cumulative biomass yield and nutrient uptake. Biomass yield and nutrient uptake of SRWC are reported on a per-tree basis, and were then converted to a whole plot basis. These estimates were weighted according to the area that each component occupied within the alley system as follows: 51% of land area in SRWC for poplar systems, 53% of land area in SRWC for willow systems, and 47 to 49% of land area in herbaceous crops depending on SRWC. These weights assume the 1.5 m unsown buffer on either side of the alley as part of the woody crop area. Weighted values were then summed to obtain cumulative alley system yield and nutrient uptake for each tree-crop combination (alley system yield and alley system nutrient uptake, hereafter).
Soil cores were collected prior to initiation of the study in May 2010, and again in November 2013. Cores were collected in four depth increments (0 – 15 cm, 15 – 30 cm, 30 – 60 cm, and 60 – 90 cm), except at Empire, where a gravel layer prevented collection of samples in the 60 – 90 cm increment. In 2010, soil cores (1.5 cm diameter) were collected by hand near the center of each plot and composited by depth increment. In 2013, soil cores were collected with a hydraulic probe truck equipped with a high relief bit (4.1 cm diameter) to minimize soil compaction. In each subplot, cores were collected at 0 m (between trees within the first row), 1 m, 3.5 m, and 6 m from the tree row in the herbaceous alley. At each sampling location, residue was brushed aside to expose mineral soils, and three cores were collected and composited by depth increment. Subsamples of each composite were passed through a 2 mm sieve to remove roots, which were then returned to the composite sample. The subsamples were air-dried, ground using a mechanical grinder and ball mill, and analyzed by Agvise Laboratories (Benson, MN, USA) for total C and N content using an elemental analyzer (Model NA 1500 NC, Carlo Erba/Fisons Instruments, Milan, Italy) . In 2013, additional soil cores were collected from the center of each plot to calculate soil bulk density. The cores were dried to a constant weight at 35ºC. Dry weights were determined and soil bulk density was calculated as the ratio of the oven dried mass of soil to the core volume. The SOC stock was determined on an equivalent mass basis and was calculated by multiplying the SOC concentration by soil bulk density and the soil depth of each layer (Ellert and Bettany 1995).
A hydropneumatic root washer was used to remove soil from plant biomass in composite samples (Gillisons Variety Fabrication; Smucker et al., 1982). The washed biomass was collected on a 0.41 mm sieve, cleaned of any non-organic debris, and then dried to a constant weight at 35ºC. Dry biomass was manually sorted into SRWC and herbaceous crop fine root (< 2 mm diameter) and small + coarse root (> 2 mm diameter) size classes, and dry weights for each SRWC or herbaceous crop x size class were determined for each sample. Some samples included herbaceous crowns and rhizomes, which were included in the belowground biomass sample. Standing fine and small root biomass are expressed on an area basis.
Coarse root, small root, and belowground root stool biomass was determined for each SRWC by excavating one representative tree of each species in the center row of each replicate using an air knife in April 2015. For poplar, a 1.2 × 1.2 m square centered on each sample tree was excavated to a depth of 60 cm. For willow, a 0.6 × 1.1 m rectangle centered on each sample tree was excavated to a depth of 60 cm. It was assumed that roots of surrounding trees within the sample area compensated for roots of the measured tree that were outside the sampled area. The roots were collected, hand washed to remove soil, dried at 60 °C, then divided into belowground root stool, coarse root (> 5 mm) and small root (2 – 5 mm) fractions and weighed. Dried root and stool fractions were ground with a Wiley mill (Thomas-Wiley Mill Co., Philadelphia, PA, USA) to pass a 1 mm screen, and then reground with a cyclone mill. Root mineral concentrations were determined with inductively coupled plasma (ICP) mass spectroscopy following digestion with HNO3 and H2O2 (Gavlak et al. 2003) except for C and N, which were determined via dry combustion and a Perkin- Elmer 2400 CHNS analyzer (Perkin – Elmer Inc., Waltham, MA, USA) by Brookside Laboratories, Inc. (New Bremen, OH, USA). Fine and small root biomass samples were combined by SRWC or crop type for mineral and C analysis.
Total carbon and nutrient stocks were calculated as the sum of SOC, SRWC root, and herbaceous crop root pools on the subplot level. Aboveground woody stem and grass biomass were not included in this calculation, as these pools represent C and nutrients exported off site. Herbaceous crown C is included in estimates of belowground biomass, primarily as small and coarse roots (2 – 5 mm diameter).
A Decagon AccuPar LP-80 Ceptometer (Decagon Devices Inc., Pullman, WA) was used to measure incident photosynthetically active radiation (PAR, 400-700 nm) and leaf area index (LAI) in the alleys. Diurnal transmission of incident PAR was measured above the herbaceous crop canopy at five locations in a transect across the alley every two hours from 09:00 to 17:00 hours on 18 and 19 July, 2013. Ten random samples were measured and the average recorded in the center of the alley, and at 2.4 and 4.8 m from tree rows on either side of the alley under cloudless conditions. Incident PAR outside the alley system was also measured one meter above the ground before and after measuring for each transect. Data collected outside the alley system displayed a concave shape when plotted against time, and were thus fit to a nonlinear quadratic function (data not shown). This function was used to estimate incident PAR outside the alley system for each minute throughout the sampling period. Relative PAR was calculated as (Ic/Io) where Ic is the incident photosynthetically active radiation (PAR) at the top of the herbaceous canopy within the alley and Io is the modelled PAR in open conditions.
LAI, defined as the projected leaf area per unit ground area was measured for herbaceous crops during late-July 2013. LAI measurements were taken in the center of the alley and at both tree-crop interfaces (2.4 m from tree rows). A measurement consisted of a simultaneous reference measurement above the canopy and the average of ten below-canopy readings. All measurements were taken at ground level either early in the morning or late in the afternoon to allow for diffuse light conditions (Tharakan and Volk 2005).
Soil matric potential
Soil matric potential (water potential, hereafter) and soil temperature were monitored continuously throughout the 2013 growing season using MPS-2 dielectric water potential sensors paired with EM50 data loggers (Decagon Devices, Pullman, WA). Sensors were buried 15 cm below the soil surface, and data loggers were programmed to record hourly from 31 May to 25 October 2013. In each instrumented plot, five sensors were installed in a transect across the alley. One sensor was installed between willow twin rows on each side of the alley, one sensor was installed in the center of the herbaceous plot (7.6 m from the nearest tree row), and two sensors were placed at intermediate positions within the plot, 2.4 m from tree rows on either side of the alley. Hourly matric potential readings were averaged by day and grouped by season for analysis (spring, 25 May to 21 June; summer, 22 June to 22 September; and fall, 23 September to 25 October).
Soil nitrate
Soil cores were collected in November 2013 in three depth increments (0 – 15 cm, 15 – 30 cm, 30 – 60 cm). Cores were collected with a hydraulic probe truck equipped with a high relief bit to minimize soil compaction (40.8 mm ID probe tip). In each sub-plot, cores were collected at four distances from the tree row: 0 m (immediately adjacent to trees), 1 m, 3.5 m, and 6 m from the tree row. At each sampling location, three cores were collected and composited by depth increment to increase sample volume. The samples were sent to a commercial laboratory (Agvise Laboratories, Benson, MN, USA) where they were air-dried, ground using a mechanical grinder and ball mill, and analyzed for NO3 – N.
Statistical analysis
For above-ground yield and nutrient uptake responses, mixed effects models were used to test for main effects and interactions between whole plot treatments (SRWC), subplot treatments (herbaceous crop), and sampling distance from the tree-crop interface. Maximum likelihood ratio tests using nested null and alternative hypothesis models were performed to verify the significance of fixed effects (Pinheiro and Bates 2000; Johnson and Omland 2004). Where significant effects were observed, Tukey’s test was used for mean separation at α = 0. 05. Mixed effects analyses were conducted with the ‘lme4’ package (Bates et al. 2015) in program R (R Core Team 2013).
We used mixed-effects analysis of variance to explain variation in SOC; tree and crop fine and small root biomass; C sequestration and nutrient accumulation in root biomass; and system C sequestration and nutrient accumulation. For SRWC coarse roots, small roots, and root stool, we assessed differences in biomass, nutrient concentration, and nutrient accumulation between SRWC at each site using t-tests. We used logistic regression to explain variation in the relative allocation of biomass within SRWC, within herbaceous crops, and within the alley system (fraction of biomass in SRWC vs. herbaceous crops), treating the fraction of biomass allocated to each pool as a binomial response.
To evaluate spatial variation in biomass yields, we expressed sampling distance as the ratio of distance from the tree row to tree height (D/H, hereafter) to account for the potential combined influence of these factors. Initial data exploration included plotting biomass yield against D/H. The herbaceous biomass yield response to D/H showed a concave pattern, suggesting that a nonlinear quadratic function should be fit and tested against other models. We then compared nonlinear models to the linear form and also to a model without D/H (intercept-only) using maximum likelihood ratio tests (Johnson and Omland 2004). After determining the best- fit model for the effect of D/H on biomass yield, we added the categorical variable “crop type” and an interaction term with D/H to determine if the effect of D/H was the same for both crops. We compared the best-fit model with the crop type covariate to one without using the maximum likelihood ratio test.
To assess the availability of growth resources within alley systems, response variables included relative PAR, water potential, and soil NO3. Mixed effects ANOVA was used to test the effects of crop, distance from the tree row, and soil depth on fall residual soil nitrate. For water potential and soil temperature, mixed effects ANOVA was used to test for main effects of sub-plot treatments (native polyculture and prairie cordgrass), and distance from the tree-crop interface within Fish Creek willow whole plots for each season. For relative PAR, mixed effects ANOVA was used to for effects of sampling time of day and distance from the tree-crop interface. Each response was analyzed by site, except soil water potential, which was analyzed by site and season. For all analyses, effects of replicates were considered random. To account for spatial autocorrelation occurring as a result of sampling at multiple, systematic locations within the same subplot, we allowed the effect of distance from the tree-crop interface to vary by subplot by nesting distance within subplot as a random effect.
To assess the effects of PAR, water potential, and soil NO3 on herbaceous biomass yield, linear mixed effects models were constructed treating the effects of PAR, water potential and soil NO3 as fixed, and the effects of replicate, tree, crop, and subplot as random. All two- and three-way interactions between explanatory variables were tested. Since soil NO3 and biomass yield were assessed at different distances, we assumed that the 6 m NO3 sample corresponded to the 7.6 m biomass sample, while the mean of the 1 m and 3.5 m NO3 samples corresponded to the 2.4 m biomass sample. We tested for multicollinearity among predictors using the “vif” function in “usdm” package with program R (Naimi 2013). Linear mixed effects models, mixed effects ANOVA, and logistic regressions were fit using the ‘nlme’ and ‘lme4’ packages with program R (Pinheiro et al. 2013; R Core Team 2013; Bates et al. 2015). Where significant (P < 0.1) effects were found, Tukey’s Honestly Significant Difference (HSD) test for multiple comparisons was used to determine differences between means.
Results
Alley system (tree + crop) yield and nutrient uptake
Alley system yield was 35% greater for poplar than willow alley cropping systems at Empire (Table 3). Alley system yield did not vary based on herbaceous crop type, and herbaceous crop yields were similar in poplar versus willow alley cropping systems. Nitrogen uptake in harvested biomass was greater for poplar – intermediate wheatgrass (477 kg N ha-1) and poplar – native polyculture systems (444 kg N ha-1) than all other systems except poplar – prairie cordgrass (396 kg N ha-1). The poplar – switchgrass system had the lowest N uptake of all poplar systems (249 kg N ha-1), which was similar to all willow – herbaceous crop combinations (average of 259 kg N ha-1). Phosphorus uptake in harvested biomass was greater for poplar – intermediate wheatgrass (61.8 kg P ha-1) and poplar – native polyculture (61.2 kg P ha-1) than all other systems except poplar – prairie cordgrass (52.0 kg P ha-1). The poplar – switchgrass system had the lowest P uptake of all poplar systems (33.1 kg P ha-1), which was similar to the average of all willow – herbaceous crop combinations (38.6 kg P ha-1). Potassium uptake in harvested biomass was 51% greater in poplar than willow alley systems, when averaged across herbaceous crop types. In both poplar and willow alleys, K uptake was greater with intermediate wheatgrass (234.4 kg ha-1), native polyculture (220.2 kg ha-1), and prairie cordgrass (221.5 kg ha-1) than with switchgrass (114.9 kg ha-1).
Table 3. Cumulative aboveground biomass yield and nutrient uptake (and 95% CI) by fraction in alley cropping systems at Empire, Minnesota from May 2010 to November 2013
|
|
Yield (Mg ha-1) |
|
N uptake (kg ha-1) |
|
P uptake (kg ha-1) |
|
K uptake (kg ha-1) |
||||
|
Fraction |
Willow alleys |
Poplar alleys |
|
Willow alleys |
Poplar alleys |
|
Willow alleys |
Poplar alleys |
|
Willow alleys |
Poplar alleys |
|
Tree |
30.9 (2.6) |
43.4 (4.4) |
|
140.8 (13.1) |
232.9 (37.5) |
|
20.3 (1.3) |
29.6 (4.7) |
|
56.4 (8.3) |
113.1 (14.9) |
|
Crop |
9.7 (2.3) |
10.7 (2.5) |
|
117.5 (33.6) |
143.6 (39.7) |
|
18.4 (4.5) |
21.0 (5.6) |
|
106.4 (32.0) |
132.1 (35.8) |
|
Sum |
40.7 b† |
54.1 a |
|
258.3 (31.3) |
376.5 (66.2) |
|
38.7 (4.3) |
50.7 (8.9) |
|
162.7 b |
245.1 a |
† Within sites and responses, means with the same letter are not different, α = 0.05. At Empire, statistical comparisons between systems were not made for N and P uptake due to significant SRWC x herbaceous crop interactions.
Woody biomass yield and nutrient uptake
Poplars consistently had greater biomass per tree than willows. At Empire, willow and poplar biomass was 48% and 197% greater, respectively, for edge row than interior row trees (Table 4). Nitrogen concentration was greater in edge row (5.6 g kg-1) than interior row poplar trees (4.7 g kg-1). There was no difference between row positions for willows, with an average N concentration of 4.8 g kg-1. Phosphorus concentration of harvested woody biomass was similar for willows and poplars, with averages of 0.68 g kg-1. There was no effect of row position on P concentration of aboveground woody biomass. Potassium concentration was greater in poplar (2.6 g kg-1) than willow (1.7 g kg-1) biomass. Nutrient uptake was 197 – 236% greater in edge row than interior row poplars and 43 – 52% greater in edge row than interior row willows.
Table 4. Aboveground leafless biomass yield and nutrient uptake of alley cropped SRWC after four years at Empire, Minnesota
|
Woody crop |
Row position |
kg DM plant-1 |
g N plant-1 |
g P plant-1 |
g K plant-1 |
||||
|
Fish Creek |
Edge rows |
4.6 |
c† |
21.8 |
c |
3.2 |
c |
8.0 |
c |
|
willow |
Interior rows |
3.1 |
d |
15.2 |
d |
2.1 |
d |
5.4 |
d |
|
NM6 poplar |
Edge rows |
21.4 |
a |
116.3 |
a |
15.0 |
a |
55.2 |
a |
|
|
Interior rows |
7.2 |
b |
34.6 |
b |
4.8 |
b |
18.6 |
b |
† Within columns and sites, means with the same letter are not different, α = 0.05
‡For NM6 poplar, the weighted mean was calculated as 40% edge rows and 60% interior rows; for Fish Creek willow it was calculated as 66.6% edge rows and 33.3% interior rows
Herbaceous biomass yield and nutrient uptake
Total 4-year biomass yields at Empire were highest for the native polyculture and prairie cordgrass (Table 5). Herbaceous biomass yield varied by crop within each year, except in 2010. In 2011, prairie cordgrass and the native polyculture yielded more than other crops. Switchgrass yield declined each year, and yielded less than all other crops from 2011 to 2013. Yield was similar among the three other crops in 2012, but in 2013 the native polyculture yielded less than intermediate wheatgrass and the native polyculture. With the exception of switchgrass, all crop yields increased from 2010 to 2011, and then declined from 2011 to 2012. Yield of prairie cordgrass and the native polyculture continued to decline from 2012 to 2013. Switchgrass yield decline at Empire coincided with annual increases in weed biomass (data not shown), despite annual herbicide applications from 2011 – 2013 to control broadleaf weeds. We observed delayed emergence timing of switchgrass compared to other species, which resulted in opportunities for early emerging weed species to dominate and interfere with switchgrass growth. Herbaceous crop yields did not differ between poplar and willow alleys.
Table 5. Yield of alley-cropped herbaceous biomass in each of four years at Empire, Minnesota
|
Site |
Crop |
2010‡ |
2011 |
2012 |
2013 |
Total |
||||
|
|
|
–––––––––––––––––––Mg ha-1––––––––––––––– |
||||||||
|
Empire |
Intermediate wheatgrass |
4.8 |
ns |
8.0 |
b† |
4.7 |
a |
4.6 |
a |
22.1 |
|
Native polyculture |
4.3 |
ns |
10.7 |
a |
5.6 |
a |
2.8 |
b |
23.4 |
|
|
Prairie cordgrass |
4.0 |
ns |
10.4 |
a |
6.4 |
a |
5.0 |
a |
25.8 |
|
|
Switchgrass |
5.1 |
ns |
2.3 |
c |
1.1 |
b |
0.1 |
c |
8.6 |
|
† Within years and sites, means with the same letter are not different, α = 0.05
‡ 2010 and 2011 yield data from Gamble et al. (2014).
From 2010 to 2013, average concentrations of N, P, and K in herbaceous biomass varied by crop at Empire were greatest for intermediate wheatgrass, though the native polyculture had similar P concentration (Table 6). Nutrient uptake also varied by crop. Switchgrass had the lowest N, P, and K uptake of all herbaceous crops. Nitrogen uptake was greatest for intermediate wheatgrass, while P and K uptake were similar for intermediate wheatgrass, the native polyculture and prairie cordgrass.
Table 6. Mean nutrient concentration and cumulative nutrient uptake of alley-cropped herbaceous biomass at Empire, Minnesota
|
|
N |
|
P |
|
K |
|||||||||
|
Crop |
g kg-1 |
kg ha-1 |
|
g kg-1 |
kg ha-1 |
|
g kg-1 |
kg ha-1 |
||||||
|
Intermediate wheatgrass |
18.0 |
a† |
399.1 |
a |
|
2.4 |
a |
52.7 |
a |
|
15.3 |
a |
350.6 |
a |
|
Native polyculture |
14.4 |
b |
345.6 |
b |
|
2.0 |
a |
50.8 |
a |
|
11.1 |
b |
287.4 |
a |
|
Prairie cordgrass |
10.0 |
c |
276.3 |
b |
|
1.7 |
b |
47.3 |
a |
|
10.3 |
b |
299.0 |
a |
|
Switchgrass |
11.8 |
bc |
99.4 |
c |
|
1.9 |
b |
15.4 |
b |
|
10.4 |
b |
86.4 |
b |
† Within columns and sites, means with the same letter are not different, α = 0.05
SRWC root biomass, C, nutrients, and distribution
Woody crop root biomass was not affected by the herbaceous alley crop. Carbon and nutrient content was greatly influenced by root biomass as the C, N, P, and K concentration was consistent over SRWC within location. However, C, N, P, and K concentration varied by biomass pool. Fine and small roots had lower C and higher N, P, and K concentrations than all other pools, when averaged across SRWC types (Table 7). Coarse root and root stool C and nutrient concentrations were generally similar, except for P and K.
Total root biomass, C, N, and K were greater for poplar than willow, while P in root biomass was similar between SRWC (Table 8). Coarse root biomass was greater for poplar (2,991 kg ha-1) than willow (896 kg ha-1), but small root and root stool biomass were similar between SRWC (averages of 586 kg ha-1 and 1,797 kg ha-1, respectively). Fine root biomass was also similar for poplar (5,242 kg ha-1) and willow (4,062 kg ha-1).
Fine roots comprised the largest fraction of belowground biomass for both SRWC (Figure 3). The fraction of poplar biomass in root stool and coarse roots was similar, but greater than the fraction in small roots. For willow, a greater fraction of biomass was found in the root stool than in coarse roots or small roots. Poplars allocated a larger fraction of belowground biomass to coarse roots than willows.
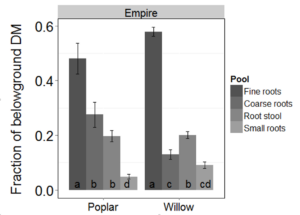
Fig 3. Relative allocation of belowground NM6 poplar and Fish Creek willow biomass by pool and site. Error bars represent one standard error of the mean. Bars with the same letter are not different (α = 0.1).
Herbaceous crop root biomass, C, nutrients, and distribution
Root nutrient concentrations at Empire varied by crop, with the exception of P. Prairie cordgrass had among the highest C and lowest nutrient concentrations of all crops. Intermediate wheatgrass had greater total root biomass than the native polyculture and switchgrass, but had root biomass similar to prairie cordgrass (Table 9). The native polyculture had lower total root biomass than prairie cordgrass, but was similar to switchgrass. Intermediate wheatgrass and prairie cordgrass had greater belowground C than the other two crops. Nitrogen, P, and K in root biomass was similar for all crops. Small and coarse root biomass was greatest for prairie cordgrass (1,576 kg ha-1) and similar for all other crops (average of 160 kg ha-1). The fine root fraction of the herbaceous crops was affected by the SWRC (i.e., a herbaceous crop by SRWC interaction), but for the other root fractions the responses were similar for both SWRC.
Intermediate wheatgrass and prairie cordgrass had greater fine root biomass when grown in willow versus poplar alleys (Table 10). Within poplar alleys, intermediate wheatgrass had greater fine root biomass than prairie cordgrass and switchgrass. Within willow alleys, intermediate wheatgrass had greater fine root biomass than all other crops, and the native polyculture had lower fine root biomass than all crops except switchgrass. For all crops, fine roots represented a larger fraction of belowground biomass than small and coarse roots. Small and coarse roots represented 33% of belowground prairie cordgrass biomass but only 1 – 7% of total belowground biomass for all other crops at this site.
Soil organic carbon
In 2013, total mass of SOC to 60 cm depth was similar for all alley cropping systems at Empire, averaging 102.1 Mg C ha-1. There was no effect of SRWC, herbaceous crop, or distance from the SRWC row on SOC. However, there were changes in SOC from 2010 to 2013. SOC declined 0.41% over soil depths, with declines in each depth increment. Decline was greatest in the 0 – 15 cm increment and lowest in the 30 – 60 cm depth increment (Table 11).
System C and nutrients
Total carbon stock (SOC + SRWC root C + herbaceous crop root C) was similar for all alley cropping systems, averaging 108.2 Mg C ha-1 (396.7 Mg CO2 eq ha-1) at Empire. Carbon sequestration varied by SRWC and herbaceous crop, but was not affected by their interaction. Carbon sequestration was greater in poplar (23.7 Mg CO2 – e ha-1) than willow (20.9 Mg CO2 – e ha-1; F = 2.86, P = 0.09) alley cropping systems, irrespective of herbaceous alley crop. Prairie cordgrass alleys had higher C sequestration (25.0 Mg CO2 – e ha-1) than those with the native polyculture (20.4 Mg CO2 – e ha-1) or switchgrass (20.8 Mg CO2 – e ha-1; F = 9.86, P = 0.02). Intermediate wheatgrass alleys sequestered 23.2 Mg CO2 – e ha-1 which was similar to all other systems at this site.
Total (aboveground + belowground) nutrient accumulation was greatest for the NM6 poplar – intermediate wheatgrass, NM6 poplar – native polyculture, and NM6 poplar – prairie cordgrass systems, and generally lowest in systems with switchgrass (Figure 4). For the systems with the highest nutrient accumulation, a larger fraction of N (73%), P (64%), and K (77%) was found in above- than belowground biomass (Table 12). The majority of N, P, and K accumulated in belowground biomass remains on site, and over time, can be mineralized through decomposition of roots and returned to soil. Thus, only the fraction of nutrients in aboveground biomass is exported off-site during biomass harvest. Maximum nutrient export rates were for the NM6 poplar – intermediate wheatgrass alley system at 117 kg N ha-1 yr-1, 15 kg P ha-1 yr-1, and 75 kg K ha-1 yr-1. For comparison, N and P export for corn treated with swine manure averaged 151 kg N ha-1 yr-1 and 30 kg P ha-1 yr-1 on a loam soil in southern Quebec (Chantigny et al. 2008). This suggests than N and P export at Empire may be greater from continuous corn than perennial biomass alley cropping. If nutrients stored in belowground biomass are included, total nutrient accumulation in perennial alley cropping systems would likely exceed that of corn cropping systems. However, nutrient removal in corn was not estimated for this study.
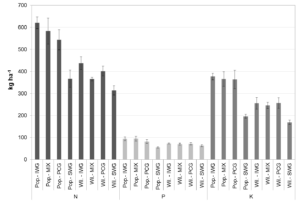
Fig 4. Total N, P, and K accumulation in above- and belowground biomass over four years at Empire, Minnesota. Error bars represent one standard error of the mean. “Pop.” = NM6 poplar; “Wil.” = Fish Creek willow’; “IWG” = intermediate wheatgrass; “MIX” = native polyculture; “PCG” = prairie cordgrass; “SWG” = switchgrass.
Table 12: Aboveground, belowground, and total nutrient accumulation in selected alley cropping systems at Empire, Minnesota
|
|
System |
Aboveground |
Belowground |
Total |
|||
|
N |
Poplar-Int. wheatgrass |
116.9 |
(1.1) |
38.3 |
(6.8) |
155.2 |
(6.6) |
|
Poplar-Native poly. |
108.3 |
(5.6) |
37.4 |
(10.0) |
145.7 |
(14.7) |
|
|
Poplar-Prairie cordgrass |
94.3 |
(8.2) |
41.5 |
(4.6) |
135.8 |
(11.4) |
|
|
P |
Poplar-Int. wheatgrass |
15.2 |
(0.2) |
8.3 |
(2.2) |
23.5 |
(2.0) |
|
Poplar-Native poly. |
15.0 |
(0.6) |
8.6 |
(2.2) |
23.7 |
(2.6) |
|
|
Poplar-Prairie cordgrass |
12.9 |
(0.9) |
7.5 |
(1.3) |
20.4 |
(2.2) |
|
|
K |
Poplar-Int. wheatgrass |
75.2 |
(0.9) |
7.7 |
(4.5) |
94.1 |
(3.6) |
|
Poplar-Native poly. |
69.1 |
(4.2) |
8.4 |
(4.8) |
91.4 |
(8.2) |
|
|
|
Poplar-Prairie cordgrass |
68.1 |
(5.3) |
9.7 |
(5.6) |
90.7 |
(10.4) |
Spatial variation in herbaceous crop productivity
At Empire, herbaceous biomass yield response to distance from the tree row to tree height (D/H) showed a concave pattern (Figure 5). A mixed effects model that included a quadratic polynomial term for the effect of D/H and a term for crop best predicted herbaceous crop yield (Table 13). Yield of both prairie cordgrass and the native polyculture increased from 0.25 to 1.14 D/H, and then declined slightly from 1.15 to 1.52 D/H. Yield of prairie cordgrass was greater than that of the native polyculture over the range of observed D/H. Leaf area index was similar for prairie cordgrass (5.5 ± 0.8) and the native polyculture (4.7± 0.5), but varied by distance from the tree row. When averaged across crops, LAI was greater in the center of the alley (5.5 ± 0.6) than adjacent to tree rows (average of 3.8 ± 0.3).
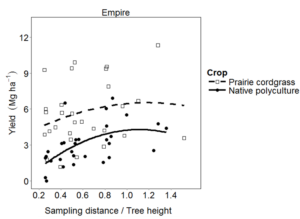
Fig 5. 2013 biomass yield of prairie cordgrass and native polyculture crops with respect to distance from the tree and tree height (D/H) at Empire and Granada, MN.
Soil water potential
In spring, average daily water potential was similar for all crops and distances from the tree row at both sites, averaging -9.6 kPa at Empire. In summer, average daily water potential varied by crop and distance from the tree row. Soil water potential in prairie cordgrass alleys was highest in the center of the alley (7.6 m; Table 14). In native polyculture alleys, water potential was lower in the center of the alley than at either 2.4 m east or west. Water potential was higher in the eastern than the western willow rows, but both rows had lower water potential than in prairie cordgrass alleys. In contrast, water potential in the center of the native polyculture alley was similar to that of the west willow row.
In fall, average daily water potential varied by crop and distance from the tree row at both Empire. Soil water potential at Empire was similar for all distances from the tree row in prairie cordgrass alleys. In native polyculture alleys, water potential was lower in the center of the alley than at either 2.4 m west or east. Willow rows had lower water potential than in crop alleys, except in the center (7.6 m) of native polyculture alleys.
Relative PAR
Relative PAR varied by distance from the tree row and time of day. Compared to the center of the alley, relative PAR was reduced along the eastern edge of the alley during the morning and reduced along the western edge of the alley in the afternoon (Figure 6). The western half of the alley received most of its PAR during the morning when the eastern half was shaded. This pattern was reversed in the afternoon when the western half was shaded and the eastern half received a greater amount of PAR. During midday, shading was similar between the furthest east and furthest west sampling distances and relative PAR was similar at the central three sampling distances.
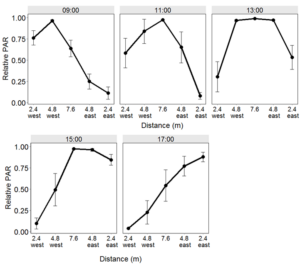
Fig 6. Diurnal relative PAR in Empire alley cropping systems with distance from the tree row on July 18, 2013. Error bars represent one standard error of the mean.
Soil nitrate
Fall residual NO3-N at Empire varied by soil depth with distance from the tree row (Figure 7). At 0 – 15 cm and 15 – 30 cm depths, NO3-N generally increased with distance from the tree row, whereas at 30 – 60 cm depth, no effect of distance was observed. Soil NO3-N decreased with depth, except at 0 m, where it was similar at all depths. At other distances, NO3-N was lower at 30 – 60 cm than at 0 – 15 cm depth. At 6 m from tree rows, NO3-N was also greater at 15 – 30 cm compared to 30 – 60 cm.
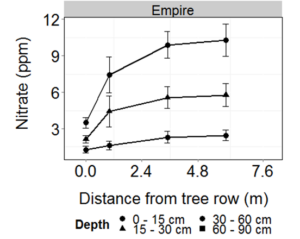
Fig 7. 2013 fall residual nitrate with distance from the tree row and soil depth in alley cropping systems at Empire, MN. Error bars represent one standard error of the mean.
Effects of light, water, and N availability on biomass yield
Given the observed yield reductions observed for both herbaceous crops at Empire, linear mixed effects models were constructed to assess the effects of PAR, water potential, and soil NO3 on herbaceous biomass yield. A mixed effects model that included terms for soil water potential and PAR best estimated herbaceous crop yield (Table 15). Including terms for soil NO3-N and all two- and three-way interactions between water potential, PAR, and soil NO3-N did not improve model fit. Model estimated herbaceous biomass yield responded positively to increasing PAR and water potential. Over the range of observed PAR, model estimated crop yield varied by 3.7 Mg DM ha-1. For every 100 μmol m-2 s-1 increase in PAR, model estimated herbaceous crop yield increased by 623 kg DM ha-1. Over the range of observed water potential, model estimated crop yield varied by 5.2 Mg DM ha-1. For every 20 kPa increase in average daily water potential, model estimated herbaceous crop yield increased by 1,038 kg DM ha-1.
Discussion
Alley system yield and nutrient uptake
Yield and nutrient uptake were maximized by NM6 poplar – intermediate wheatgrass alley cropping systems at Empire. Woody biomass comprised 71% to 84% of system yield across sites and treatments, suggesting that SRWC selection is important for maximizing yields in similarly designed alley systems. In our analysis, herbaceous crop selection had no effect on system level yield, though differences in herbaceous crop yield were observed on the subplot level. The native polyculture and prairie cordgrass were among the highest yielding crops over the four years of study, suggesting these crops are well suited to alley cropping.
Combined SWRC and herbaceous biomass yields of alley cropping systems ranged from 6.5 to 13.5 Mg ha-1 yr-1 for poplar alley systems and from 7.6 to 10.2 Mg ha-1 yr-1 for willow alley systems. These yields compare well to other biomass production systems. For comparison, shrub willow – grassland alley cropping systems yielded only 4 Mg ha-1 yr-1 in Lower Saxony, Germany. Monocultures yields of herbaceous biomass crops in Minnesota range up to 11.6 Mg ha-1 yr-1 for prairie cordgrass, 9.2 Mg ha-1 yr-1 for switchgrass (P. virgatum L. cv. Sunburst), and 7.6 Mg ha-1 yr-1 for native polycultures (Johnson et al. 2013). Woody crop yields range up to 18.3 Mg ha-1 yr-1 for SX67 willow (S. miyabeana), 12.5 Mg ha-1 yr-1 for ‘9882-41’ willow (S. purpurea), 13.2 Mg ha-1 yr-1 NM6 poplar, and 15.3 Mg ha-1 yr-1 for D125 cottonwood (P. deltoides; Thelemann et al., 2010; Johnson et al., 2013). Thus, alley system yields reported here were similar to monoculture yields of SRWC.
In terms of nutrient uptake, our alley systems compare well to other riparian vegetation. For instance, Peterjohn and Correll (1984) estimated vegetation N uptake of riparian forests in Maryland as 77 kg N ha−1 y−1. This is less than our observed maximum N uptake rates of 111 and 119 kg N ha-1 yr-1 for poplar – native polyculture and poplar – intermediate wheatgrass alley systems at Empire. In southern Quebec, Fortier et al. (2010a) found nutrient uptake in hybrid poplar riparian buffers to range from 15 – 128 kg N ha-1 yr-1, 1.7 – 13.7 kg P ha-1 yr-1, and 8 – 97 kg K ha-1 yr-1 after 6 years of growth, depending on site and clone. The maximum P uptake we observed was in poplar – native polyculture and poplar – intermediate wheatgrass alley systems, both at just over 15 kg P ha-1 yr-1. The maximum K uptake observed in the present study was for alley systems (poplar or willow) that included intermediate wheatgrass, at 59 kg K ha-1 yr-1, which is lower than values reported by Fortier et al. (2010a). However, they include nutrients in live leaf biomass, which explains higher maximum N and P uptake estimates than in the present study. Tufekcioglu et al. (2003) estimated immobilization of N in riparian poplar (Populus × euroamericana ‘Eugenei’) and switchgrass vegetation as 37 and 16 kg N ha-1 yr-1, respectively, which is lower than our estimates for these crops.
Belowground biomass C, nutrients, and soil carbon
NM6 poplar - prairie cordgrass and NM6 poplar – intermediate wheatgrass alley cropping systems had the highest C sequestration and nutrient accumulation in root biomass. Belowground SRWC biomass was generally a larger C and nutrient sink than herbaceous crop root biomass, though there were exceptions. Initial allocation of land area was 49% SRWC in willow systems and 47% SRWC in poplar systems. SRWC roots accounted for 67 – 88% of sequestered C in alley cropping systems, except in willow – intermediate wheatgrass and willow – prairie cordgrass systems, where SRWC comprised about half of sequestered C. In systems where relative biomass allocation remained similar to initial land allocation, SRWC and herbaceous crops appear to be equally exploiting belowground resources. In the remaining systems, lateral extension of SRWC roots into the crop alley resulted in competition for water and nutrients and at Empire, also resulted in reduced biomass yields of herbaceous alley crops (Gamble et al. 2016).
In both poplar and willow alleys, intermediate wheatgrass had among the highest fine root biomass of all crops. Prairie cordgrass had the greatest small and coarse root biomass due to its thick mat of rhizomes in the top 15 cm of soil. Alleys with prairie cordgrass had among the highest C accumulation but had generally lower nutrient accumulation than intermediate wheatgrass and the native polyculture due to lower nutrient concentrations. Although not statistically significant, there was evidence that poplars had greater fine root biomass when grown with prairie cordgrass than any other crop (data not shown), which could explain why system C sequestration was still high in this treatment despite lower prairie cordgrass fine root biomass in poplar versus willow alleys.
No significant differences were detected in SOC among tree or crop species or tree-crop combinations (alley systems) four years after establishment. Others have observed short-term changes in SOC under perennial bioenergy crops. For instance, Zan et al., (2001) found increased SOC under shrub willow production versus switchgrass and continuous corn after only four years on fine sandy loam soil in southern Quebec. More commonly, however, effects of species on SOC are not observed until 7 - 10 years after crop establishment (Ceotto and Di Candilo 2011).
Following conversion from annually tilled to perennial systems, temporal patterns of SOC often show an initial decrease in soil C during the first 5 years, and then an increase to net C gains coincident with greater above- and belowground plant litter inputs (Deng et al. 2014). Soil organic carbon declined at all sampled depths at Empire from 2010 to 2013, with the greatest loss of SOC in the 0 – 15 cm increment. Two years after converting an annual tilled field to perennial grassland, Steinbeiss et al., (2008) found a net C loss, but by year 4, C stocks had exceeded initial values. These changes in SOC are quite rapid, though research suggests that the size of the initial SOC pool affects the rate and magnitude of change due to management. Soils with SOC near their expected maximum may not increase in SOC as quickly as or as much as soils that have relatively low SOC (Sartori et al. 2006). Conversely, soils with relatively high SOC tend to decrease in SOC more rapidly than those with relatively low SOC following disturbances such as tillage or reduced residue inputs (Sartori et al. 2006). Initial SOC pools at Empire were relatively high due to annual spring biosolids applications from 2000 - 2010. Thus, initial losses in SOC were substantial, and a period longer than 4 years is likely required before SOC exceeds initial values in alley cropping systems at the Empire site.
Tree-crop interactions
Shrub willow – grassland alley cropping systems have shown short-term potential for biomass production, C sequestration, and nutrient accumulation. However, long-term provision of these goods and services depends on the persistence and vigor of both the woody and herbaceous components of the system. At Empire, competition with willows for light and soil water substantially reduced prairie cordgrass and native polyculture biomass yield 2.4 m from tree rows, and had a moderate effect on yield up to 4.8 m from trees. Predictably, competition for N was not evident at Empire, where prior biosolids additions resulted in high antecedent organic and inorganic N. Competition for N has been found to be minimal or absent when standard rates of fertilizer N are applied in other temperate alley cropping systems (Jose et al. 2000; Miller and Pallardy 2001; Zamora et al. 2006).
Interestingly, competition for soil water influenced herbaceous crop yield at Empire. This was somewhat surprising given the shallow water table at this site and higher than average precipitation in 2013. However, hydrophytic species such as willow generally have high rates of evapotranspiration (ET) and low water use efficiency compared to both C3 and C4 perennial grasses (Jørgensen and Schelde 2001). Thus, we expected water use by willow to reduce soil water availability to herbaceous alley crops in the zone of tree and crop root overlap. We observed evidence of this during the summer. In willow-prairie cordgrass alleys at Empire, water potential was lower along the tree-crop interface relative to the center of the alley. This pattern suggests that competition for soil moisture between willows and herbaceous crops will occur up to at least 2.4 m from tree rows in these alley systems, depending on seasonal water availability.
There was a 57% reduction in PAR along the tree-crop interface (2.4 m) and a 21% reduction in the center of the alley. Lin et al (1999) found that many C3 forage species can tolerate up to 50% shade without significant reductions in yield, while yields of C4 forages were reduced under these conditions. At Empire, yields were reduced where PAR reduction exceeded 50%, even for C3 intermediate wheatgrass (Gamble et al. 2016). At Granada, reduction in PAR was over 75% at the southern edge of the alley, but curiously, no reduction in yield was apparent. Gillespie et al (2000) found that maize (Zea mays L.) yield was not impacted by up to 41% shade in black walnut (Juglans nigra L.) and red oak (Quercus rubra L.) alley cropping systems if belowground competition was eliminated. Lin et al (1999) found yield of both C3 and C4 forages reduced under 80% shade.
Shading within the alley also played a facilitative role for herbaceous crops during certain periods at each site. For example, at Empire, higher water potentials adjacent to tree rows relative to the center of native polyculture alleys suggest plant water use was higher in the open than in the shelter of tree rows. Greater leaf area in the center of the alley partially explains these findings, as this likely resulted in greater ET at this position. However, we observed similar patterns in summer moisture availability at Granada with no differences in leaf area or biomass yield. Water potential in both native polyculture and prairie cordgrass alleys was greater along the southern edge of the alley than in the center. Thus, there was higher water use per unit leaf area in the center versus the southern edge of the alley, which suggests that shading played a facilitative role for both herbaceous crops under these circumstances. This is not surprising for the native polyculture, which contained a high proportion of C3 species such as Canada wild rye (Elymus candensis L.) and wild bergamot (Monarda fistulosa L.). Cool season (C3) species can benefit from moderate shading due to their low light saturation point and low water-use efficiency (Kephart et al. 1992; Lambers et al. 2008). In contrast, C4 species such as prairie cordgrass have a higher light saturation point, higher optimum temperature for photosynthesis, and higher water use efficiency than C3 species (Kephart et al. 1992; Taiz and Zeiger 2010). This is evident in the fact that across sites, seasons, and alley positions, soil water potential was generally lower under native polyculture than prairie cordgrass plots in this study. However, it appears that even prairie cordgrass, a C4 species, was the benefactor of facilitative shading during the summer at Granada.
Management interventions and alternative system designs could reduce competition in these systems and further improve productivity. Similar alley systems should be planted to west-east or northwest-southeast alley orientations to minimize competition for light. Alternatively, if a north-south orientation is used, an alley width greater than 15.2 m would also reduce competition for light. However, this would likely result in lower alley system yields since the ratio of woody to herbaceous crop area would decrease. Additional modifications such as utilizing agricultural subsurface tile drainage water, alternative harvest regimes, or evaluating additional woody and herbaceous crops should be considered to improve yield, on-farm utility, and ecosystem services from these systems.
Educational & Outreach Activities
Participation summary:
Peer reviewed publications:
-Gamble JD, Johnson GA, Current DA, Wyse DL, Sheaffer CC. (2016) Species pairing and edge effects on biomass yield and nutrient uptake in perennial alley cropping systems. Agron J doi: 10.2134/agronj2015.0456
-Gamble JD, Johnson GA, Sheaffer CC, Current DA, Wyse DL (2014) Establishment and early productivity of perennial biomass alley cropping systems in Minnesota, USA. Agrofor Syst 88 (1): 75-85
-Gamble JD, Johnson GA, Current DA, Wyse DL, Sheaffer CC. (in review). Belowground carbon sequestration and nutrient accumulation potential of perennial biomass alley cropping systems.
Invited Posters:
-Gamble JD, Johnson G; Sheaffer CC, Current DA, Wyse DL. Changes in belowground carbon pools after conversion to perennial biomass alley cropping in Minnesota. Presented at the 14th North American Agroforestry Conference. Ames, Iowa. June 3, 2015
Invited Presentations:
-Gamble JD, Johnson G, Current DA, Wyse DL, Sheaffer CC. Spatial effects on productivity and mineral uptake in perennial biomass alley cropping systems in Minnesota. Presented at the 14th North American Agroforestry Conference. Ames, Iowa. June 3, 2015
Outreach:
-Integrating herbaceous and woody perennials for nutrient treatment: a bioenergy approach. Rural Advantage / UMN Extension Workshop: Addressing Water Quality Issues in Elm Creek - Farmer Led Solutions. Knights of Columbus Hall, Fairmont, MN. February 5, 2015
-Alley cropping with perennial biomass crops. Rural Advantage 3rd Crop Walk-N-Talk: Third crops for energy, food production, and wind protection. Southern Research and Outreach Center, Waseca, MN. September 16, 2014
-Integrating herbaceous and woody perennials for production and conservation benefits on the farm. University of Minnesota Extension workshop: Using Perennial Plantings to Improve Water Quality. Knights of Columbus Hall, Fairmont, MN. June 24, 2014
-Riparian alley cropping for perennial biomass production in the Elm Creek Watershed. Elm Creek Agricultural Meeting sponsored by Rural Advantage and University of Minnesota. Knights of Columbus Hall, Fairmont, MN. March 11, 2014
-Herbaceous and woody perennials in agroforestry. Rural Advantage / UMN Extension Field Day Empire, MN, speaker / presenter. August 26, 2013
Project Outcomes
Over the first four years of study, NM6 poplar – intermediate wheatgrass and NM6 poplar – prairie cordgrass alley cropping systems performed best overall in terms of biomass yield; nutrient accumulation and removal; and C sequestration in belowground biomass. NM6 poplar – native polyculture systems performed nearly as well, except that they sequestered less C. However, generally poor coppice ability of NM6 poplar may limit long-term productivity in poplar alley systems. Intermediate wheatgrass showed the greatest potential for N, P, and K uptake in alley cropping systems, though the native polyculture and prairie cordgrass also performed well and are better choices for sites with occasional flooding.
Converting to perennial biomass alley cropping can result in short-term SOC losses, but net C gains should be realized over the long-term due to rapid accrual in belowground biomass. Species selection did not influence SOC, but influenced C sequestration and nutrient accumulation in plant biomass. The majority of C sequestered and nutrients accumulated were found in SRWC roots, with the largest pool being fine roots.
Our research also provides a basis for understanding the effects of spatially integrating herbaceous and woody biomass crops into an alley cropping system. Competition for light and soil water substantially reduced native polyculture and prairie cordgrass yield up to 2.4 m from willow rows at Empire, but competition for soil nitrate was not evident. The relative impact of competition was similar for prairie cordgrass and a native polyculture, though the former had slightly higher yields overall. Quantifying edge effects on SRWC productivity is important for accurately quantifying system yield and nutrient uptake, and C sequestration in agroforestry systems.
Collectively, our results show that after four years of production, NM6 poplar and prairie cordgrass were among the best SRWC and herbaceous crop choices for biomass production, C sequestration, and nutrient accumulation in alley cropping systems. However, competition may limit the stand longevity of herbaceous crops, which could reduce the utility of these systems for biomass production and ecosystem services over time. Further consideration should be given to management interventions and alternative system designs to reduce competition in these systems and improve productivity. Similar alley systems should avoid north-south row orientation to minimize shading. Additional modifications such as utilizing agricultural subsurface tile drainage water for irrigation, alternative harvest regimes, or evaluating additional woody and herbaceous crops should be considered to improve yield, on-farm utility, and ecosystem services from these systems
Abrahamson LP, Volk TA, Kopp RF, et al (2002) Willow biomass producer’s handbook. New York College of Environmental Science and Forestry. Syracuse, NY, USA
Asbjornsen H, Hernandez-Santana V, Liebman M, et al (2013) Targeting perennial vegetation in agricultural landscapes for enhancing ecosystem services. Renew Agric Food Syst 29:101–125. doi: 10.1017/S1742170512000385
Bardhan S, Jose S (2012) The potential for floodplains to sustain biomass feedstock production systems. Biofuels 3:575–588.
Bates D, Maechler M, Bolker B, Walker S (2015) lme4: Linear mixed-effects models using Eigen and S4. version 1.1-9, https://CRAN.R-project.org/package=lme4.
Benomar L, DesRochers A, Larocque GR (2012) The effects of spacing on growth, morphology and biomass production and allocation in two hybrid poplar clones growing in the boreal region of Canada. Trees 26:939–949. doi: 10.1007/s00468-011-0671-6
Boe A, Owens V, Gonzalez-Hernandez J, et al (2009) Morphology and biomass production of prairie cordgrass on marginal lands. GCB Bioenergy 1:240–250. doi: 10.1111/j.1757-1707.2009.01018.x
Boody G, Vondracek B, Andow DA, et al (2005) Multifunctional agriculture in the United States. Bioscience 55:27–38. doi: 10.1641/0006-3568(2005)055
Börjesson P, Berndes G (2006) The prospects for willow plantations for wastewater treatment in Sweden. Biomass and Bioenergy 30:428–438. doi: 10.1016/j.biombioe.2005.11.018
Ceotto E, Di Candilo M (2011) Medium-term effect of perennial energy crops on soil organic carbon storage. Ital J Agron 6:33. doi: 10.4081/ija.2011.e33
Chantigny MH, Angers DA, Bélanger G, et al (2008) Yield and Nutrient Export of Grain Corn Fertilized with Raw and Treated Liquid Swine Manure. Agron J 100:1303. doi: 10.2134/agronj2007.0361
Collins HP, Smith JL, Fransen S, et al (2010) Carbon sequestration under irrigated switchgrass (Panicum virgatum L.) production. Soil Sci Soc Am J 74:2049. doi: 10.2136/sssaj2010.0020
Debell D, Clendenen G, Harrington C, Zasada J (1996) Tree growth and stand development in short-rotation Populus plantings: 7-year results for two clones at three spacings. Biomass and Bioenergy 11:253–269. doi: 10.1016/0961-9534(96)00020-7
Debell DS, Harrington CA, Clendenen GW, Zasada JC (1997) Tree growth and stand development of four Populus clones in large monoclonal plots. New For 14:1–18.
Deng L, Liu G Bin, Shangguan ZP (2014) Land-use conversion and changing soil carbon stocks in China’s “Grain-for-Green” Program: A synthesis. Glob Chang Biol 3544–3556. doi: 10.1111/gcb.12508
Ehret M, Bühle L, Graß R, et al (2015) Bioenergy provision by an alley cropping system of grassland and shrub willow hybrids: biomass, fuel characteristics and net energy yields. Agrofor Syst 89:365–381. doi: 10.1007/s10457-014-9773-7
Ellert BH, Bettany JR (1995) Calculation of organic matter and nutrients stored in soils under contrasting management regimes. Can J Soil Sci 75:529–538. doi: 10.4141/cjss95-075
Felix E, Tilley DR, Felton G, Flamino E (2008) Biomass production of hybrid poplar (Populus sp.) grown on deep-trenched municipal biosolids. Ecol Eng 33:8–14. doi: 10.1016/j.ecoleng.2007.10.009
Fortier J, Gagnon D, Truax B, Lambert F (2010a) Nutrient accumulation and carbon sequestration in 6-year-old hybrid poplars in multiclonal agricultural riparian buffer strips. Agric Ecosyst Environ 137:276–287. doi: 10.1016/j.agee.2010.02.013
Fortier J, Gagnon D, Truax B, Lambert F (2010b) Biomass and volume yield after 6 years in multiclonal hybrid poplar riparian buffer strips. Biomass and Bioenergy 34:1028–1040. doi: 10.1016/j.biombioe.2010.02.011
Gamble JD, Johnson G, Sheaffer CC, et al (2014) Establishment and early productivity of perennial biomass alley cropping systems in Minnesota, USA. Agrofor Syst 88:75–85. doi: DOI 10.1007/s10457-013-9657-2
Gamble JD, Wyse DL, Johnson G, et al (2016) Species pairing and edge effects on biomass yield and nutrient uptake in perennial alley cropping systems.
Gavlak R, Horneck D, Miller RO, Kotuby-Amacher J (2003) Soil, plant and water reference methods for the western region.
Gillespie A, Jose S, Mengel D (2000) Defining competition vectors in a temperate alley cropping system in the midwestern USA: 1. Production physiology. Agrofor Syst 48:25–40.
Gillitzer PA, Wyse DL, Sheaffer CC, et al (2012) Biomass production potential of grasslands in the oak savanna region of Minnesota, USA. BioEnergy Res 6:131–141. doi: 10.1007/s12155-012-9233-z
Heller MC, Keoleian GA, Volk TA (2003) Life cycle assessment of a willow bioenergy cropping system. Biomass and Bioenergy 25:147–165. doi: 10.1016/S0961-9534(02)00190-3
Herve C, Ceulemans R (1996) Short-rotation coppiced vs non-coppiced poplar: A comparative study at two different field sites. Biomass and Bioenergy 11:139–150. doi: 10.1016/0961-9534(96)00028-1
Holm B, Heinsoo K (2013) Municipal wastewater application to short rotation coppice of willows – treatment efficiency and clone response in Estonian case study. Biomass and Bioenergy 57:126–135. doi: 10.1016/j.biombioe.2013.08.001
Holzmueller E, Jose S (2012) Biomass production for biofuels using agroforestry: potential for the North Central Region of the United States. Agrofor Syst 85:305–314. doi: 10.1007/s10457-012-9502-z
Jaynes DB, Isenhart TM (2014) Reconnecting tile drainage to riparian buffer hydrology for enhanced nitrate removal. J Environ Qual 43:631–638. doi: 10.2134/jeq2013.08.0331
Johnson GA, Wyse DL, Sheaffer CC (2013) Yield of perennial herbaceous and woody biomass crops over time across three locations. Biomass and Bioenergy 58:267–274. doi: 10.1016/j.biombioe.2013.10.013
Johnson JB, Omland KS (2004) Model selection in ecology and evolution. Trends Ecol Evol 19:101–8. doi: 10.1016/j.tree.2003.10.013
Jordan N, Warner KD (2010) Enhancing the multifunctionality of US agriculture. Bioscience 60:60–66. doi: 10.1525/bio.2009.60.1.10
Jørgensen U, Schelde K (2001) Energy crop water and nutrient use efficiency. Prepared for the International Energy IEA Bioenergy Task 17, Short Rotation Crops.
Jose S, Bardhan S (2012) Agroforestry for biomass production and carbon sequestration: An overview. Agrofor Syst 86:105–111. doi: 10.1007/s10457-012-9573-x
Jose S, Gillespie A, Seifert J (2000) Defining competition vectors in a temperate alley cropping system in the midwestern USA: 3. Competition for nitrogen and litter decomposition dynamics. Agrofor Syst 48:61–77.
Jungers JM, Clark AT, Betts K, et al (2015a) Long-term biomass yield and species composition in native perennial bioenergy cropping systems. Agron J 107:1627–1640. doi: 10.2134/agronj15.0014
Jungers JM, Fargione JE, Sheaffer CC, et al (2013) Energy potential of biomass from conservation grasslands in Minnesota, USA. PLoS One 8:1–11. doi: 10.1371/journal.pone.0061209
Jungers JM, Sheaffer CC, Lamb J a. (2015b) The effect of nitrogen, phosphorus, and potassium fertilizers on prairie biomass yield, ethanol yield, and nutrient harvest. BioEnergy Res 8:279–291. doi: 10.1007/s12155-014-9525-6
Kephart KD, Buxton DR, Taylor SE (1992) Growth of C3 and C4 perennial grasses under reduced irradiance. Crop Sci 32:1033–1038.
Lambers H, Chapin III FS, Pons TL (2008) Plant Physiological Ecology, Second Edi. Springer New York
Lamerre J, Schwarz K-U, Langhof M, et al (2015) Productivity of poplar short rotation coppice in an alley-cropping agroforestry system. Agrofor Syst 89:933–942. doi: 10.1007/s10457-015-9825-7
Lee DK, Owens VN, Boe A, Koo BC (2009) Biomass and seed yields of big bluestem, switchgrass, and intermediate wheatgrass in response to manure and harvest timing at two topographic positions. GCB Bioenergy 1:171–179. doi: 10.1111/j.1757-1707.2009.01008.x
Lee KH, Isenhart TM, Schultz RC (2003) Sediment and nutrient removal in an established multi-species riparian buffer. J Soil Water Conserv 58:1–8.
Lin CH, Graw RLMC, George MF, Garrett HE (1999) Shade effects on forage crops with potential in temperate agroforestry practices. 109–119.
Mangan ME, Sheaffer C, Wyse DL, et al (2011) Native perennial grassland species for bioenergy: establishment and biomass productivity. Agron J 103:509–519. doi: 10.2134/agronj2010.0360
Miller AW, Pallardy SG (2001) Resource competition across the crop-tree interface in a maize-silver maple temperate alley cropping stand in Missouri. Agrofor Syst 53:247–259.
Naimi B (2013) usdm: Uncertainty analysis for species distribution models. R package version 1.1-12. http://CRAN.R-project.org/package=usdm.
Pacaldo RS, Volk TA, Briggs RD (2013) Greenhouse gas potentials of shrub willow biomass crops based on below-and aboveground biomass inventory along a 19-year chronosequence. Bioenergy Res 6:252–262.
Pallardy S, Gibbins D, Rhoads J (2003) Biomass production by two-year-old poplar clones on floodplain sites in the Lower Midwest, USA. Agrofor Syst 59:21–26.
Peterjohn W, Correll D (1984) Nutrient dynamics in an agricultural watershed: observations on the role of a riparian forest. Ecology 65:1466–1476.
Pinheiro J, Bates D (2000) Mixed-effects models in S and S-PLUS. Springer Verlag New York LLC, New York, NY
Pinheiro J, Bates D, DebRoy S, et al (2013) nlme: Linear and Nonlinear Mixed Effects Models. In: R Packag. version 3.1-111.
R Core Team (2013) R: A language and environment for statistical computing. R Foundation for Statistical Computing, Vienna, Austria. URL http://www.R-project.org/.
Rivest D, Cogliastro A, Bradley RL, Olivier A (2010) Intercropping hybrid poplar with soybean increases soil microbial biomass, mineral N supply and tree growth. Agrofor Syst 80:33–40. doi: 10.1007/s10457-010-9342-7
Sartori F, Lal R, Ebinger MH, Parrish DJ (2006) Potential soil carbon sequestration and CO2 offset by dedicated energy crops in the USA. CRC Crit Rev Plant Sci 25:441–472.
Schoonover JE, Williard KWJ, Zaczek JJ, et al (2005) Nutrient attenuation in agricultural surface runoff by riparian buffer zones in southern Illinois, USA. Agrofor Syst 64:169–180. doi: 10.1007/s10457-004-0294-7
Schultz RC, Colletti JP, Isenhart TM, et al (1995) Design and placement of a multi-species riparian buffer strip system. Agrofor Syst 29:201–226. doi: 10.1007/BF00704869
Smucker AJM, Mcburney SL, Srivastava AK (1982) Quantitative seperation of roots from compacted soil profiles by the hydropneumatic elutriaiton system. Agronomy 74:500–503.
Steinbeiss S, Beßler H, Engels C, et al (2008) Plant diversity positively affects short-term soil carbon storage in experimental grasslands. Glob Chang Biol 14:2937–2949. doi: 10.1111/j.1365-2486.2008.01697.x
Taiz L, Zeiger E (2010) Plant physiology, 5th edn. Sinauer Assoc, Sunderland, MA
Tharakan P, Volk T (2005) Morphological traits of 30 willow clones and their relationship to biomass production. Can J For Res 431:421–431. doi: 10.1139/X04-195
Thelemann R, Johnson G, Sheaffer C, et al (2010) The effect of landscape position on biomass crop yield. Agron J 102:513–522. doi: 10.2134/agronj2009.0058
Tufekcioglu A, Raich JW, Isenhart TM, Schultz RC (2003) Biomass, carbon and nitrogen dynamics of multi-species riparian buffers within an agricultural watershed in Iowa, USA. Agrofor Syst 57:187–198.
Vanek V (1991) Riparian zone as a source of phosphorus for a groundwater-dominated lake. Water Res 25:409–418. doi: 10.1016/0043-1354(91)90077-4
Volk T (2002) Alternative methods of site preparations and coppice management during the establishment of short-rotation woody crops. PhD dissertation. State University of New York. Syracuse, NY
West B, Welch K, Galecki A (2014) Linear mixed models: a practical guide using statistical software. CRC Press
Wilson DM, Heaton EA, Schulte LA, et al (2014) Establishment and short-term productivity of annual and perennial bioenergy crops across a landscape gradient. BioEnergy Res 7:885–898. doi: 10.1007/s12155-014-9409-9
Young EO, Briggs RD (2005) Shallow ground water nitrate-N and ammonium-N in cropland and riparian buffers. Agric Ecosyst Environ 109:297–309. doi: 10.1016/j.agee.2005.02.026
Young EO, Briggs RD (2007) Nitrogen dynamics among cropland and riparian buffers: soil-landscape influences. J Environ Qual 36:801–14. doi: 10.2134/jeq2006.0270
Zalesny JA, Zalesny RS, Wiese AH, et al (2008) Sodium and chloride accumulation in leaf, woody, and root tissue of Populus after irrigation with landfill leachate. J Sustain For 27:303–327. doi: 10.1080/10549810802256262
Zamora DS, Jose S, Nair PKR, Ramsey CL (2006) Interspecific competition in a pecan – cotton alleycropping system in the southern United States : Production physiology. Can J Bot 1686–1694. doi: 10.1139/B06-130
Zan C, Fyles J, Girouard P, Samson R (2001) Carbon sequestration in perennial bioenergy, annual corn and uncultivated systems in southern Quebec. Agric , Ecosyst Environ 86:135–144.
Zilverberg CJ, Johnson WC, Owens V, et al (2014) Biomass yield from planted mixtures and monocultures of native prairie vegetation across a heterogeneous farm landscape. Agric Ecosyst Environ 186:148–159. doi: 10.1016/j.agee.2014.01.027
Economic Analysis
NA
Farmer Adoption
Given the current lack of markets for cellulosic biomass, no farmer adoption of these or similar systems has been noted as a result of this research. However, farmer interest in perennial bioenergy crops was keen at outreach and extension events, suggesting that some adoption would occur given appropriate economic circumstances.
Areas needing additional study
Further consideration should be given to management interventions and alternative system designs to reduce competition in these systems and improve productivity. Alternative designs such as wider alleys, different alley orientations, and different tree-row configurations should be considered. Furthermore, modifications such as utilizing agricultural subsurface tile drainage water for irrigation, alternative harvest regimes, or evaluating additional woody and herbaceous crops should be considered to improve yield, on-farm utility, and ecosystem services from these systems.