Final Report for GNC15-203
Project Information
In the Midwestern US, subsurface tile drainage systems facilitate the transport of excess fertilizer nutrients like nitrogen (N) and phosphorus (P) to adjacent streams, where they are then transported downriver causing numerous environmental problems including contaminated drinking water, algal blooms, and subsequent hypoxic “dead zones” after the blooms die and decompose. Planting cover crops is a conservation tool that can be used to reduce N and P loss via tile drains by retaining excess N and P on agricultural fields during Winter and Spring when fields are normally bare. The goal of this project was to quantify the water quality benefits of implementing cover crops at the watershed-scale. Cover crops were planted on ~70% of croppable acres in the Shatto Ditch Watershed (Kosciusko Co., IN). We collected water samples from tile drain outlets and stream sites every 14 days in order to accurately determine how cover crops reduce nitrogen and phosphorus exports from agricultural fields. We communicated our results to potential adopters/promoters of cover crops by attending meetings and field days with the goal of facilitating adoption of large-scale cover crop implementation throughout the region. We evaluated the progress of our water quality monitoring by continuously conducting water chemistry analysis, data processing, and meetings with our partners. The outcomes of this project provide quantitative data about the water quality benefits of cover crops to farmers and resource managers.
Introduction:
Over the past 150 years, much of the Midwestern United States has undergone extensive land use changes as vast wetlands and prairies have been converted to productive cropland. However, the tile drainage systems that keep soils dry and maintain productive agriculture also significantly impact adjacent stream channels. Excess fertilizer nutrients like nitrogen (N) and phosphorus (P) enter streams via tile drains and are then transported downriver causing numerous environmental problems including contaminated drinking water, downstream algal blooms, and subsequent hypoxic “dead zones” after the blooms die and decompose. For example, reported drinking water violations for excess N have doubled in the last decade and created high-profile news stories like those from Toledo, OH and Des Moines, IA. Additionally, >50% of the excess N runoff that is causing the recurring dead zone in the Gulf of Mexico has been linked to fertilizers applied to row-crop agriculture in the Midwestern US (Alexander et al. 2008). In order to reduce non-point source pollution draining from row-crop agriculture to downstream streams and rivers, we need to effectively prevent nutrient loss from fields at the watershed scale.
The planting of cover crops as a landscape-level best management practice is gaining popularity in the North Central Region. According to the most recent SARE Cover Crop Survey Report, cover crop adoption and acreage has increased dramatically in recent years (CTIC 2016). Historically, cover crops have been planted after cash crop harvest to reduce soil erosion, decrease soil compaction, increase soil organic matter, and suppress weed growth (Lal et al. 1991). Cover crops also provide an additional benefit to water quality. Cover crop growth during winter and spring, when fields are normally bare, immobilizes excess N and P in the soil reducing N and P export toadjacent streams and ditches (Ranells and Wagger 1997). Previous research at the field-scale has shown that cover crops can significantly reduce nutrient export from tile drainage in agricultural fields (Kaspar et al. 2007). However, few studies have linked the implementation of watershed-scale BMPs such as cover crops to improvements in stream water quality. The objective of this project is to quantify the water quality benefits of implementing cover crops at the watershed-scale.
References:
Alexander, R.B., Smith, R.A., Schwartz, G.E., Boyer, E.W., Nolan, J.V., and Brakebill, J.W. 2008. Differences in phosphorus and nitrogen delivery to the Gulf of Mexico from the Mississippi River Basin. Environ. Sci. Technol. 42: 822-830.
Conservation Technology Information Center. 2016. Report of 2015-2016 Cover Crop Survey. Joint publication of the Conservation Technology and Information Center and the North Central Region Sustainable Agriculture Research and Education Program.
Kaspar, T.C., Jaynes, D.B., Parkin, T.B., and Moorman, T.B. 2007. Rye cover crop and gamagrass strip effects on NO3 concentration and load in tile drainage. Journal of Environmental Quality 36: 1503-1511.
Lal R., Regnier, E., Eckert, D.J., Edwards, W.M., and Hammond, R. 1991. Expectations of cover crops sustainable agriculture. pp.1-11. In W.L. Hargrove (ed.) Cover crops for clean water. Proc. Int. Conf., Jackson, TN. 9-11 Apr. 1991. Soil and Water Conserv. Soc. Am., Ankeny, IA.
Ranells, N.N. and Wagger, M.G. 1997. Nitrogen-15 recovery and release by rye and crimson clover cover crops. Soil Sci. Soc. Am. J. 61: 943-948.
Learning Outcomes: Quantify the water quality benefits of watershed-scale planting of cover crops
- In general, we found that tile drains from fields without cover crops had higher nitrate and phosphorus concentrations than tile drains from fields without cover crops. This indicates the potential for cover crops to significantly reduce nitrate and phosphorus export from tile drains.
- We also found a relatively strong correlation between tile drain export and watershed export that indicates reducing tile drain N and P inputs will have a positive impact on water quality in the watershed and reduce nutrient export downstream.
Action Outcomes: Disseminate the results of the project to a wide audience using the education and outreach framework established in our USDA Conservation Innovation Grant (CIG) project and continued with our USDA Regional Conservation Partnership Program (RCPP) project
- We used our established network of partners to reach a large audience of local and regional stakeholders. We attended and presented at numerous meetings, field days, and conferences that increased the visibility of the project and will hopefully promote adoption of large-scale cover crop planting throughout the Midwest.
Cooperators
Research
Objective 1:
Experimental Site: The Shatto Ditch Watershed (SDW) is a 3,300-acre agricultural watershed located in Kosciusko County, IN that drains ~2,400 croppable acres in a typical corn-soybean rotation. Soils in SDW are somewhat poorly drained and an estimated 95% of the watershed is tile-drained. The actual ditch is a first-order stream (~5 mi long) and is surrounded by 3 m buffer strips along the majority of stream length. The Shatto Ditch has a flashy discharge and elevated average nutrient concentrations, characteristic of other agricultural streams in the Midwestern US.
Sampling Regime: We employed a comprehensive sampling regime to quantify the impacts of implementing cover crops at the watershed-scale on reducing nutrient export from SDW. As part of a USDA Conservation Innovation Grant (CIG), we collected pre-cover crop data from October 2012 - August 2013. Cover crops were then planted on approximately ~70% of croppable acres in Fall 2013, 2014, and 2015, and we collected post-cover crop data from October 2013 - September 2016.
As part of the comprehensive sampling regime, I collected 3 replicate water samples at 7 longitudinally-distributed stream sites and a representative subset of ~25 tile drains every 14 days. Each tile drain and stream sample was stored on ice until returning to the laboratory where samples were frozen until water chemistry analysis. We quantified dissolved ammonium (NH4+-N) using the phenol-hypochlorite method (Soloranzo 1969), nitrate (NO3--N) using the cadmium reduction method (APHA 1995), and soluble reactive phosphorus (SRP) using the ascorbic acid method (Murphy and Riley 1962) on a Lachat Flow Injection Autoanalyzer (Lachat Instruments, Loveland, CO., USA). At each stream and tile drain site, I also measured instantaneous discharge (L/s) and collected ancillary data including temperature, conductivity, and pH.
Objective 2:
To achieve this outcome, we worked within the collaborative model established through our USDA CIG and USDA RCPP projects. Over the course of these projects we have developed strong partnerships with the Kosciusko County Soil and Water Conservation District (SWCD), USDA Natural Resource Conservation Service (NRCS), and The Nature Conservancy (TNC). These partners have facilitated communication with local and regional producers and provided technical assistance regarding implementation of practices and education. These collaborative relationships created an outreach "framework" that provided ample opportunities for me to present the results of this project to various audiences. Throughout the year, I was regularly invited to present the results of this project at meetings and field days around the state. Additionally, I sought out opportunities to reach diverse audiences by presenting at a range of conference types that included farmers, industry representatives, and scientists as audience members.
References:
APHA. 1995. Standard methods for the examination of water and wastewater. 19th edition. American Public Health Association, Washington, D.C., USA.
Murphy, J., and Riley, J.P. 1962. A modified single solution method for the determination of phosphate in natural waters. Analytica Chimica Acta 27: 31-36.
Solorazano, L. 1969. Determination of ammonia in natural waters by the phenolhypochlorite method. Limnology and Oceanography 14: 799-801.
Overarching Milestones:
- This NCR-SARE grant funded an additional summer of monitoring (July-September 2016), which allowed us to maintain the "long term" nature of our comprehensive sampling by completing a third year of monitoring in the SDW. This will ultimately contribute to the overall success of the project.
- While this funding ended as of August 31, 2016, we did not complete data collection for Summer 2016 until September 30, 2016 according to the definition of a "water year". Nevertheless, I collected and analyzed >1,000 water chemistry samples using our routine monitoring regime during this NCR-SARE funding.
- I analyzed all remaining water chemistry samples in October 2016 and am currently working to complete data processing and statistical analyses.
- The results of this data (Summer 2016) would not make sense without the context of the larger USDA CIG project. As such, the results presented below relate to the objectives of both this grant and the USDA CIG project. Over 4 years, this project has generated >10,000 samples; therefore, this data is preliminary and should not be used, re-created, or presented outside of this report.
Learning Outcomes: Preliminary Results of Objective 1
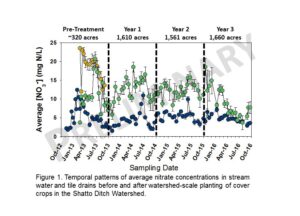
Temporal Patterns of Nitrate Concentrations (Figure 1)
- Generally, average nitrate (NO3--N) concentration in the stream varied slightly from year to year with average NO3--N ranging from 4.5 mg L-1 to 5.5 mg L-1. The timing and magnitude of maximum [NO3--N] also varied slightly from year to year; however, maximum values typically occurred during the Winter or Spring when snowmelt and storm events are common. For example, maximum [NO3--N] occurring in Winter (~12 mg L-1) during the pre-treatment year and in Spring (~10 mg L-1) during Year 1 and 2 of cover crop planting.
- We are still actively processing SRP data, but temporal patterns seem to follow similar patterns with average stream concentrations varying little from year to year and maximum concentrations occurring during the Spring.
- Average [NO3--N] from tile drains follow similar temporal patterns as the stream water with highest concentrations occurring during the Winter and Spring. However, NO3--N is always higher in tile outlet water than the stream water indicating the role of tile drains as “hot spots” of nutrient transport to agricultural streams.
- During the Spring of the pre-treatment year, average [NO3--N] in tile drains from fields without cover crops (~18 mg L-1) was higher than tile drains from field without cover crops (~12 mg L-1). Average [NO3--N] from tile drains with cover crops in Years 1-3 of cover crop planting remained similar ranging from ~12 to 14 mg L-1.
- Again, we are continuing to process SRP data; however, we have found a similar pattern of decreased [SRP] in tile drain from fields with cover crops compared to tile drains from fields without cover crops.
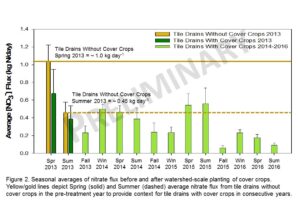
Seasonal Patterns of Nitrate Concentration and Impacts on Nitrate Export (Figure 2)
- The temporal patterns in tile drain [NO3--N] highlight the variation contributed by environmental factors that change seasonally. As such, it is important to consider seasonal patterns of [NO3--N].
- Again, average [NO3--N] from tile drains was generally highest in Winter and Spring (Figure 1). Additionally, the range in tile drain [NO3--N] was also highest during these times ranging from 0.1-40.9 mg L-1 in Winter and 0.1-48.9 mg L-1 in Spring over the course of the project.
- Patterns in concentration are useful, but do not tell the complete story; therefore, it is also important to consider tile flow to calculate flux or mass loss (kg day-1). Generally, we found that average NO3--N flux from tile drains also varied by season and was typically highest in the Winter and Spring (Figure 2).
- During the pre-treatment year, average NO3--N flux from tile drains without cover crops was ~30 % higher than flux from tile drains with cover crops. Similarly, average NO3--N from tile drains without cover crops was higher than tile drains with cover crops during the Summer, but only by ~15%.
- Average NO3--N flux in tile drains from fields with cover crops was relatively low during Spring 2014, 2015, and 2016 ranging from 0.18 to 0.47 kg day-1 or ~30-80% lower than average flux from tile drains without cover crops in Spring .
- These results suggest that cover crops have the potential to significantly reduce nitrate flux from tile drain outlets, particularly during critical times of the year when snowmelt and storm events are common.
- Again, we are still actively processing SRP data; this project generated >10,000 water chemistry samples, which is why sample analyses and data processing takes a considerable amount of time.
Action Outcomes: Results from Objective 2 (Details in Table 1)
- Over the course of this year, I have actively participated in 15 outreach events that reached diverse audiences.
- I presented at 10 outreach events that provided direct interaction with farmers including field days sponsored by individual farmers, the Soil Health Partnership Program, and The Nature Conservancy. At these field days, I was able to present preliminary results to audience and address questions and concerns during questions. Many of these events were particularly rewarding due to these interactions.
- I coordinated a town hall meeting in the Shatto Ditch Watershed where I presented some of the final results to the farmers who have participated in this project over the last 4 years. In addition, I attended and answered questions at a town hall meeting in the new watershed (Kirkpatrick Ditch) engaged through the RCPP project.
- I submitted abstracts to two scientific meetings that were accepted for presentation. Presenting at these meetings greatly increased the reach of this project at a regional and national level. I also won “Best Oral Presentation” at one of the meetings (Indiana Water Resources Association Annual Meeting) and was invited to speak at the American Water Resources Association national meeting as a result.
Future Directions:
- We are combining water chemistry data and stream discharge data from the SDW collected from 2012-2016 to estimate total annual N and P export from the watershed before and after cover crops. We are using a novel modeling technique in order to minimize uncertainty and distinguish an effect of cover crops on watershed N and P export in a real-world context.
- We are also working to quantify the amount of N and P exported during storms, which has been a "frequently asked question" during many of our presentations.
Educational & Outreach Activities
Participation summary:
- The manuscript for this work is in preparation. I am currently completing data analyses and writing with a goal of submitting the manuscript to a peer-reviewed journal by Winter 2017.
- We recently created a website that outlines all of our work on these projects. The website can be found at http://www.indianawatershedinitiative.com/. There is a page dedicated to "Outputs" and PDF's of the outreach materials that we hand out at meetings and field days can be found there.
Project Outcomes
Learning Outcomes: Objective 1
- Preliminary results indicate that there is a positive linear relationship between summed tile drain NO3--N flux (kg day-1) and watershed NO3--N export (kg day-1) suggesting that decreasing tile drain inputs has the potential to reduce N export from the watershed as a whole.
- This linear relationship suggests that watershed-scale planting of cover crops has the potential to reduce watershed N export and may have a positive impact on water quality in downstream systems.
Action Outcomes: Objective 2
- The number of and diversity in meetings that I have attended or presented at will hopefully increase the visibility and scope of the project.
- We have generally received very positive feedback after our presentations and meetings, but we do not have a way of quantifying the impact or influence of our outreach.