Final report for GNC16-218
Project Information
Cover crops are increasingly being included in lists of best management practices for water quality, but their adoption among non-organic farmers has been slow. One approach to increasing the use of cover crops is to provide evidence that farmers can use them while either breaking even on costs or even gaining a cost benefit. A potential cost saving from cover crops is from a nitrogen credit—nitrogen from cover crop residues could offset nitrogen needed from fertilizer, lowering this input cost (and gaining environmental benefits at the same time). Measuring nitrogen credits from cover crops requires research on the decomposition of their residues under the following crop. Because organic matter decomposition rates vary widely based on soil type, temperature, moisture, background nutrient levels, and microbial community composition, as well as on the biochemical composition of the plant residue, decomposition must be measured locally in order to make reliable recommendations to local farmers. This study will measure the decomposition rates and nutrient release timing of two common cover crops (cereal rye and field pennycress) under two nitrogen rates (0 lbs/acre and MRNT 150 lbs/acre) in a soybean/corn rotation in Rosemount and Waseca, Minnesota. This data will be used to develop evidence-based Minnesota Agricultural Extension cover crop recommendations (including optimal nitrogen rates and optimal timing of cover crop termination for nutrient release).
Concrete outcomes from this research include:
- A Minnesota Agricultural Extension publication regarding the nitrogen credit from select cover crops (in lbs N/acre) in a corn/soybean rotation, including recommendations on date of cover crop termination, and optimal nitrogen rates that will be available to farmers.
- A journal article in a peer-reviewed journal.
- A poster or oral presentation at a relevant conference.
Research
Table 1. Location information for the six trials conducted at two research and outreach centers in Minnesota in 2016-2017.
|
|
Soil Series |
Soil Texture |
Cover Crop |
Corn Planting |
|||
|
Location |
Sand |
Silt |
Clay |
Seeded |
Terminated |
||
|
|
|
--------%-------- |
|
|
|
||
|
Rosemount |
Lindstrom |
23 |
55 |
22 |
9/2 |
5/15 |
5/31 |
|
Waseca |
Canisteo |
28 |
39 |
33 |
9/1 |
4/29 |
5/7 |
Initially, we planned to use cereal rye and medium red clover as our two cover crop species. However, because of poor winter survival and spring regrowth of the clover, there was insufficient biomass. Therefore, we elected to substitute field pennycress, which was part of the companion study conducted on the same plots, and which is also physiologically distinct from cereal rye. Additionally, less agronomic research has been conducted on pennycress than red clover, so this research will potentially have a larger scientific impact with pennycress than red clover.
On 4/28/17 and 5/3/17 two (0.5 meter)2 quadrats of rye and pennycress biomass were collected from plots at the Waseca and Rosemount research locations (respectively). At the same time, biomass was collected from the edges of plots and placed in large mesh bags. The plant material from the quadrats was dried in 140° C ovens, weighed, ground, and submitted to the University of Minnesota’s Research Analytical Laboratory (RAL) for analysis of total carbon and nitrogen content. A sub-sample of the biomass collected from plot edges was weighed, dried at 140° C, ground, submitted to RAL for combustion and ICP analysis of macro and micro-nutrients, and reserved for analysis in the UMN forages lab for lignin and hemicellulose determination.
Within several days of biomass collection, fields were sprayed with glyphosate. Fields were disked on 5/8/17 and chisel plowed 5/11/17 (Waseca) and on approximately 5/24/17 (Rosemount), and corn was planted on 5/12/17 (Waseca) and 5/31/17 (Rosemount). In order to replicate the field conditions as closely as possible, the remaining biomass was spread between two layers of mesh bags on racks near a large door allowing access to fresh air and breezes. It was allowed to air dry. On 5/3/17 (Waseca) and 5/5/17 (Rosemount), the biomass was roughly chopped into approximately 4-6 inch pieces. The remaining biomass was stuffed into 1mm mesh bags approximately 10 inches x 10 inches, each weighing 20.00 +/- 0.05 g (for rye) and 45.00 +/- 0.05g (for pennycress). A portion of the biomass was weighed, dried at 140° C, and weighed again to determine moisture content.
Table 2: Burial and removal dates for mesh litter bags in 2017.
|
Location |
Burial |
Removal 1 |
Removal 2 |
Removal 3 |
Removal 4 |
Removal 5 |
Removal 6 |
|
Rosemount |
5/31 |
6/12 |
6/26 |
7/18 |
8/8 |
8/31 |
10/26 |
|
Waseca |
5/15 |
5/30 |
6/12 |
7/3 |
7/31 |
8/23 |
10/13 |
Mesh bags were buried in May once field conditions allowed. Three bags of rye and pennycress were reserved from each site to determine moisture content at time of burial and to analyze for any nitrogen lost to volatilization while air drying. In each location, bags were buried in plots that had rye and pennycress treatments, and which received either 0 lb N/ac or 150 lb N/ac (as EDTA coated urea on 5/15/17 (Waseca) and 5/31 (Waseca)), with three replications. In each plot, six bags were buried at a depth of six inches, with small field flags attached to mark the location, in row four of each six row plot. One bag from each plot was retrieved on dates spread across the growing season (see Table 2).
In the field, the majority of excess soil and infiltrating plant roots were removed from the mesh bags. They were placed in labeled paper bags and dried in 140° C ovens. Bags were then stored at room temperature until February, when we began processing the samples. Samples were again placed in 140° C ovens to remove all moisture. In order to remove soil from the plant material, mesh bags are then rinsed with warm water from a kitchen sink style sprayer. This removes most of the remaining soil from the samples. Mesh bags are then re-dried at 140° C, then weighed and ground.
Plant material was analyzed for macro and micro-nutrient content at RAL. Nitrogen and carbon content was determined by combustion; Al, B, Ca, Cd, Cr, Fe, K, Mg, Mn, Na, Ni, P, Pb, and Zn were determined by ICP. Additionally, plant samples were analyzed by Rock River Lab for ADF, aNDF, hemicellulose, and lignin content, using wet chemistry methods.
Data was analyzed in RStudio (2016) using the linear mixed effects (lme) and nonlinear least squares (nls) functions.
Table 3: Spring cover crop data. Letters represent least significant differences within location, from an analysis including five cover crop treatments. Only pennycress and rye are included here.
|
Location |
Cover |
Biomass (kg/ha) |
N (kg/ha) |
C:N |
S (kg/ha) |
|
Rosemount
|
Rye |
4741 a |
112.7 a |
19 a |
9.11 a |
|
Pennycress |
2239 b |
69.80 a |
13 b |
8.56 a |
|
|
Waseca
|
Rye |
3119 a |
77.73 b |
18 a |
6.20 b |
|
Pennycress |
3533 a |
100.0 a |
15 b |
11.1 a |
Table 4: Average nutrient content in cover crop biomass in mg/ha at time of termination. Nutrient content was analyzed from homogenized bulk samples, and total cover crop biomass was estimated in individual plots.
|
Location |
Cover |
Al |
B |
Ca |
Cd |
Cr |
Cu |
Fe |
K |
Mg |
Mn |
Na |
Ni |
P |
Pb |
Zn |
|
Rosemount
|
Pennycress |
23.14 |
1.19 |
0.96 |
0.04 |
0.03 |
0.31 |
23.09 |
2357 |
252 |
2.81 |
2.29 |
0.17 |
265 |
0.05 |
1.76 |
|
Rye |
86.00 |
2.65 |
5.36 |
0.05 |
0.10 |
6.81 |
139.72 |
41856 |
3229 |
47.33 |
50.97 |
1.27 |
4606 |
1.04 |
24.26 |
|
|
Waseca |
Pennycress |
15.76 |
1.21 |
1.22 |
0.04 |
0.03 |
0.64 |
18.59 |
4027 |
336 |
3.46 |
3.58 |
0.11 |
643 |
0.06 |
3.13 |
|
Rye |
1.58 |
0.06 |
0.14 |
0.00 |
0.00 |
0.28 |
3.49 |
1699 |
65 |
1.25 |
0.66 |
0.04 |
304 |
0.02 |
0.98 |
Table 5: Plant tissue composition at termination and burial. Letters represent Least Significant Differences within the response variable. Two outliers were removed from nitrogen analysis.
|
Location |
Cover |
N (%) |
C (%) |
C:N |
||
|
|
|
|
Termination |
Burial |
Termination |
Burial |
|
Rosemount |
Rye |
4.3 a |
45 a |
45 a |
10 cde |
10 cde |
|
|
Pennycress |
3.9 b |
43 c |
42 d |
11 bcd |
11 bc |
|
Waseca |
Rye |
3.6 b |
44 ab |
43 c |
13 a |
11 b |
|
|
Pennycress |
4.5 a |
43 bc |
41 e |
10 e |
9 f |
Table 6: Cell wall composition of plant tissue at time of termination. Letters represent Least Significant Differences within each column.
|
Cover |
Lignin (%) |
Hemicellulose (%) |
ADF (%) |
aNDF (%) |
|
Rye |
3.1 b |
18 a |
25 a |
43 a |
|
Pennycress |
5.0 a |
4.2 b |
20 b |
24 b |
Details of cover crop composition in the field at termination are given in Table 1 and Table 2. The C:N ratio was higher for rye than for pennycress, but both are below 20, indicating that net nitrogen mineralization from decomposition should occur. In Waseca, pennycress had a greater composition of sulfur, which is expected given that pennycress is in the brassica family. Although we did not test for glucosinolates, it is possible that higher levels of these chemicals in pennycress tissue could slow decomposition given their toxicity to soil microbes.
We tested plant tissue for nitrogen and carbon content at termination and burial to determine if any nitrogen is being lost during this period (see Table 5). Small differences in C:N ratio seem to be driven by a loss of carbon rather than nitrogen. These results don't suggest that significant nitrogen volatilization occurred, although biomass dried in the lab may not perfectly reflect what is occurring to biomass dried in the field.
Hemicellulose and lignin content of cell walls have been shown to impact decomposition rates. As lignin is the most recalcitrant fraction, higher levels in pennycress suggest this species will decay more slowly (see Table 6). However, higher levels of hemicellulose (which is also fairly difficult to decompose) were found in rye. The differences in cell wall composition between cover crop species were consistent across both locations. Because of our sampling method, we were not able to include these variables as covariates in our analysis of decomposition.
Table 7: Statistical significance of models for decomposition (percent remaining over time) of plant biomass and nutrient content for first three removal times.
|
Loc |
Y |
Cover |
N Rate |
Days |
Cover*N |
Cover*Days |
N*Days |
C*N*D |
Corr |
|
R |
Bio |
|
|
**** |
|
**** |
|
|
1 |
|
W |
Bio |
*** |
** |
**** |
|
**** |
|
|
3 |
|
R |
%N |
*** |
** |
**** |
|
**** |
|
|
3 |
|
W |
%N |
*** |
NA |
**** |
NA |
**** |
NA |
NA |
1 |
|
R |
CN |
*** |
** |
** |
*** |
* |
|
|
3 |
|
W |
CN |
** |
NA |
** |
NA |
**** |
NA |
NA |
3 |
|
R |
%Al |
|
|
**** |
|
*** |
|
|
1 |
|
W |
%Al |
*** |
*** |
**** |
*** |
**** |
|
|
4 |
|
R |
%B |
|
|
**** |
|
**** |
* |
|
4 |
|
W |
%B |
*** |
*** |
**** |
*** |
**** |
|
|
4 |
|
R |
%Ca |
* |
|
**** |
|
**** |
|
|
2 |
|
W |
%Ca |
** |
** |
**** |
** |
**** |
|
|
4 |
|
R |
%Cd |
|
|
**** |
|
** |
|
|
3 |
|
W |
%Cd |
* |
* |
**** |
|
*** |
* |
|
2 |
|
R |
%Cr |
* |
* |
**** |
|
**** |
|
* |
4 |
|
W |
%Cr |
*** |
*** |
**** |
** |
**** |
|
|
4 |
|
R |
%Cu |
|
|
**** |
|
*** |
|
|
1 |
|
W |
%Cu |
|
|
**** |
|
** |
|
|
3 |
|
R |
%Fe |
* |
|
**** |
|
**** |
|
|
4 |
|
W |
%Fe |
** |
* |
**** |
|
**** |
|
|
3 |
|
R |
%K |
* |
|
**** |
|
** |
|
|
4 |
|
W |
%K |
** |
|
**** |
|
**** |
|
|
1 |
|
R |
%Mg |
|
|
**** |
|
**** |
|
|
2 |
|
W |
%Mg |
*** |
**** |
**** |
**** |
**** |
|
|
4 |
|
R |
%Mn |
* |
|
**** |
|
*** |
|
|
1 |
|
W |
%Mn |
|
*** |
**** |
|
|
|
|
4 |
|
R |
%Na |
|
|
* |
|
|
|
|
3 |
|
W |
%Na |
*** |
*** |
**** |
* |
**** |
**** |
*** |
4 |
|
R |
%Ni |
* |
|
**** |
|
*** |
|
|
1 |
|
W |
%Ni |
|
|
**** |
|
* |
|
|
4 |
|
R |
%P |
*** |
|
**** |
** |
|
|
|
4 |
|
W |
%P |
|
|
**** |
|
* |
|
|
1 |
|
R |
%Pb |
** |
|
**** |
* |
*** |
|
|
3 |
|
W |
%Pb |
** |
** |
**** |
|
** |
|
|
3 |
|
R |
%Zn |
|
|
**** |
|
*** |
|
|
1 |
|
W |
%Zn |
** |
|
**** |
|
** |
|
|
1 |
Loc=Location; Y=response variable; Significance: *=<.1, **=<0.05,***=<0.01,****=<0.001; Corr=Residual correlation structure: 1=none, 2=1st order autoregressive, 3=compound symmetry, 4=unstructured.
Table 8: Estimates of coefficients and their standard errors for decomposition curves of the form: Y~a+b*e^c*days since burial. Only models that were able to fit a curve are included.
|
Y |
Location/ Treatment(s) |
a (SE) |
b (SE) |
c (SE) |
|
% Biomass remaining
|
Ros/Penny |
19.80 (0.957)**** |
80.23 (1.49)**** |
-0.146 (0.00904)**** |
|
Ros/Rye |
9.996 (2.11)**** |
90.34 (2.83)**** |
-0.0931 (0.008993)**** |
|
|
Was/Rye |
-18.85 (14.91) |
120.70 (14.32)**** |
-0.0310 (0.00734)**** |
|
|
Was/Penny |
8.748 (2.853)*** |
91.61 (3.725)**** |
-0.0852 (0.00974)**** |
|
|
Was/0N |
-5.441 (9.056) |
106.5 (9.291)**** |
-0.0472 (0.00977)**** |
|
|
Was/150N |
8.287 (6.634) |
92.46 (7.478)**** |
-0.0610 (0.0125)**** |
|
|
%P remaining
|
Ros/Penny/150N |
35.56 (3.458)**** |
64.713 (3.936)**** |
-.06547 (0.01023)**** |
|
Ros/Rye/150N |
8.726 (16.659) |
93.587 (16.85)**** |
-0.0487 (0.02134)** |
|
|
Ros/Rye/0N |
12.41 (8.00) |
87.24 (8.33)**** |
-0.053 (0.0126)*** |
|
|
Ros/Pen/0N |
28.96 (7.33)*** |
71.61 (7.33)**** |
-0.047 (0.0116)*** |
|
|
Was/Rye |
4.247 (2.722) |
95.51 (3.41)**** |
-0.077 (0.0075)**** |
|
|
Was/Pen |
6.68 (2.10)*** |
93.36 (2.99)**** |
-0.707 (0.0109)**** |
|
|
%N remaining
|
Ros/150N |
9.436 (1.916)**** |
90.79 (2.921)**** |
-0.130 (0.0123)**** |
|
Ros/0N |
8.333 (1.834)**** |
91.87 (33.22)**** |
-0.129 (0.0120)**** |
|
|
Ros/Rye |
8.491 (1.353)**** |
91.78 (1.941)**** |
-0.1106 (0.006672)**** |
|
|
Ros/Pen |
8.808 (1.812)**** |
91.35 (2.851)**** |
-0.1520 (0.0163)**** |
|
|
Was/Pen |
6.685 (2.100)*** |
93.36 (2.994)**** |
-0.1071 (0.01087)**** |
|
|
Was/Rye |
-1.811 (4.887) |
102.5 (5.205)**** |
-0.06022 (0.007261)**** |
|
|
%K remaining
|
Ros/Rye |
0.4961 (0.7071) |
99.50 (1.177)**** |
-0.2108 (0.0125)**** |
|
Ros/Pen |
1.682 (1.219) |
98.31 (1.902)**** |
-0.1467 (0.009493)**** |
|
|
Was/Rye |
0.6429 (.01579)**** |
99.36 (0.2624)**** |
-0.2119 (0.004313)**** |
|
|
Was/Pen |
0.5302 (0.1054)**** |
99.47 (0.1790)**** |
-0.2664 (0.006602)**** |
|
|
%Cu remaining |
Ros/Rye |
23.07 (23.25) |
80.90 (22.22)*** |
-0.03569 (0.02118)
|
Significance: *=<.1, **=<0.05,***=<0.01,****=<0.001.
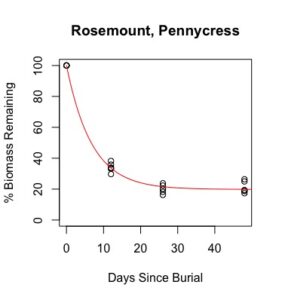
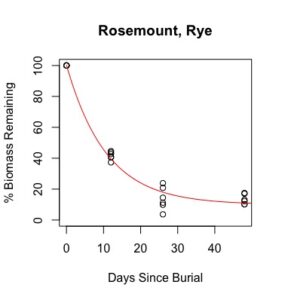

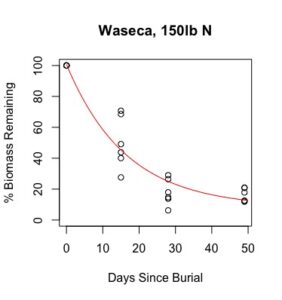
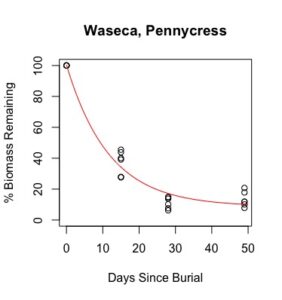
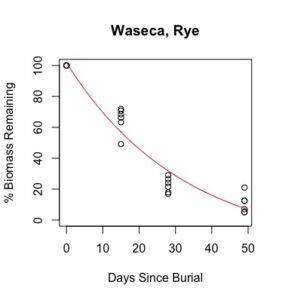
Figure 1: Decomposition curves for decomposition of biomass (as dry matter). Details of the fitted curves are given in Table 7.
There was sufficient plant material for nutrient analysis by plot only for the first three of six removal times. The effect of cover crop and nitrogen rate on decomposition of total biomass and nutrient release over this time period was tested for each location. (There was also insufficient biomass to analyze nitrogen in three plots from Waseca in the third removal time, so the effect nitrogen rate could not be analyzed for nitrogen decomposition and C:N.) Details of treatment significance for the release of each nutrient and total biomass are given in Table 7. Elevated levels of metals (compared to unburied plant material) likely result from incomplete removal of soil from the plant material prior to analysis. This is difficult if not impossible to avoid with a mesh litter bag methodology. Decomposition curves were not able to be fitted to most nutrients, likely as a result of this soil contamination. However, cover crop tissue content for these nutrients was not great enough to cause a deficiency in corn (see Table 4), so the timing of their release from decomposing plant material is less relevant to growers than the release of macronutrients nitrogen, phosphorous, and potassium (sulfur was not analyzed).
Details of decomposition curves are given in Table 8. The first coefficient, "a", represents the value of Y (percent remaining) at which the curve plateaus, so a higher value of "a" indicates incomplete decomposition during the growing season. The "b" coefficient is simply (100-a). The third coefficient, "c", is the natural log of the decomposition constant. The more negative the value of "c", the faster the rate of decomposition. Figures of the plotted decomposition curves are given for biomass decomposition (see Figure 1). Fertilizer nitrogen rate was only significant in Waseca, and there was no interaction between cover crop and nitrogen rate. The estimates of plateau values for both nitrogen rates were not significantly different from zero, indicating complete decomposition. The decomposition constants indicate a slightly faster decomposition where nitrogen fertilizer was applied, which may come from a "priming effect" where extra nitrogen spurs microbial activity in the soil. Decomposition of plant biomass differed between cover crops in both locations. Although decomposition was more rapid in pennycress tissue, the plateau values are higher for pennycress. Importantly, however, across treatments and locations at least 70 percent of plant tissue had decomposed within a month of burial (ie, by the time period when corn nitrogen demand is highest). Biomass decomposition was the dominant driver of nutrient release, so it is not surprising that nitrogen and phosphorus release was also rapid. Potassium, which is present in plant tissue as a water-soluble ion was released even more quickly, as expected.
Table 9: Critical values (in lb N/ac) from corn grain yield response curves for three cover crop treatments in 2017.
|
Location |
None |
Pennycress |
Rye |
|
Rosemount |
87 |
97 |
132 |
|
Waseca |
147 |
162 |
191 |
In agronomic research, environmental variability means that results often vary between years, so we must be cautious generalizing from a single year's data. We can conclude that at least under certain conditions, rye and pennycress cover crops will decompose and mineralize nitrogen, phosphorous, and potassium quickly enough that corn deficiencies are unlikely. Nevertheless, corn grain yields from the larger study indicate that greater nitrogen fertilizer applications may be necessary to maximize corn yields following these cover crops compared to no cover crop (See Table 9). In this year, maximum yield potential was similar among cover crop treatments in Waseca but lower following cover crops in Rosemount compared to the control. Given the rapid decomposition of cover crop biomass and mineralization of nitrogen, the impact on corn yield from cover crops may be caused by some factor other than nitrogen cycling. Further studies of this kind will aid in our understanding of the impact of cover crops on nutrient cycling, and will allow better recommendations to growers interested in incorporating cover crops in their corn-soybean rotations.
Educational & Outreach Activities
Participation summary:
This research was presented at the 2018 annual meeting of the Agronomy Society of America and Crop Science Society of America in Baltimore, in November 2018. Approximately 50 people attended the oral presentation, which was comprised mainly of students and academic faculty.
This research was presented as a poster at the 2018 North Central Soil Fertility Conference in Des Moines, IA, in November 2018. Approximately 200 people were present, and were a mix of farmers, crop consultants, students, and academic faculty. This poster was also presented at the University of Minnesota Extension Service's 2018 Crop Pest Management Short Course in Minneapolis in December. This course was attended by 200-300 individuals, mainly agricultural professionals.
Project Outcomes
At the time of this report, no journal articles or extension materials have been published. However, we still plan to produce these documents, which will hopefully reach both academic and non-academic audiences. The results from this project add to our understanding of the impact of winter annual cover crops on corn production in the upper Midwest. Although there has not been data from enough site years to make specific recommendations to growers, this project will influence the guidance given on cover crop management. Uncertainty about the impact of cover crops on cash crop yields is one factor behind the low adoption of cover crops in Minnesota, so the results from this project may help reduce this uncertainty and perhaps influence farmer adoption of this conservation tool.
Thanks to this project, I have gained experience in the mesh litter bag methodology and have learned a number of lessons that will allow me to obtain more data in future projects (ie, the amount of biomass to put into mesh litter bags, and taking plot-specific samples for initial plant composition analysis for use as a covariate in analysis). This project has also allowed me to learn new skills in data analysis, specifically how to apply non-linear models.