Final report for GNC19-274
Project Information
Project Title: Improving irrigation and fertilizer management strategies across the Wisconsin Central Sands under a changing climate
The Wisconsin Central Sands (WCS), a region characterized by its sandy soils, is a major vegetable producer in Wisconsin. Due to the sandy soil, regular irrigation is required - making the region prone to leaching and groundwater contamination. High levels of nitrate in groundwater across the WCS have been heavily documented, as well as the resulting human health impacts. However, it is unclear how nitrate (N) levels vary spatially and temporally across the region. As a result, there is additional uncertainty in determining how to credit the N applied through irrigation water, which is pumped from groundwater, in nitrogen management plans. Additionally, it is crucial that we understand how nitrogen use efficiency (NUE) and water use efficiency (WUE) vary under a changing climate in order to best mitigate nitrate leaching to groundwater and reduce our water use, while still maintaining crop production. Our research incorporates both field work and ecosystem modeling to begin answering these questions. Through our combined approach of field and modeling research, we hope to provide farmers, researchers, and policy makers with the tools to make management decisions that will aid in both improving groundwater quality and reducing water use, which will be of heightened importance as weather variability continues to increase.
The overarching objective of this project is to improve irrigation and fertilizer management in the WCS in order to address both water quality and quantity challenges, while still maintaining crop production and farmer livelihood. The actions we will complete are as follows: 1) Assess spatiotemporal variability of nitrate levels in groundwater 2) Determine the different physiological responses of potato varieties to nitrogen and water stress 3) Improve the agroecosystem model, Agro-IBIS to accurately model WUE and NUE of vegetable cropping systems in the WCS under a changing climate. The broader outcomes will be 1) reduced fertilizer use which will provide economic savings and aid in reducing nitrate leaching to groundwater 2) Improved management strategies for responding to a changing climate.
This project will generate a diverse range of both learning and action outcomes. Learning outcomes include: 1) Increased knowledge of nitrate levels in groundwater, and subsequently, irrigation water. 2) Increased knowledge of nitrate variability within season, and year to year. 3) Increased knowledge of spatial variability of nitrate levels in irrigation water across the WCS. 4) Increased knowledge regarding how different varieties of potatoes respond physiologically to nitrogen and water stress under a changing climate.
Action outcomes include 1) Farmers will credit the nitrate found in irrigation water in their nitrogen management plans, and as result, reduce the amount of fertilizer and they are applying. 2) Reducing fertilizer use will save farmers money while simultaneously decreasing nitrate leaching to groundwater. 3) Based on model results, farmers will adopt management strategies that improve WUE and NUE of their vegetable cropping systems.
Research
Nitrate Concentration in applied irrigation water
To determine the spatial and temporal variability of N levels in irrigation water, water samples were collected and analyzed weekly during the growing seasons in 2018, 2019, and 2020 for nitrate and chloride concentration. To collect samples from the fields, we installed funnel systems on farms spanning a North-South gradient across the WCS. Funnel systems were simple, portable, and cost-effective, consisting of a funnel at canopy height, and using PVC pipe and a fence post to route water to a 3-gallon storage container on the ground. During the 2018 growing season, samples were taken from four farms, with five to six fields (each field serviced by a different well) sampled at each farm. We expanded the number of farms involved during the 2019 field season, for a total of six farms, with five to seven fields sampled at each farm. Due to the selling of one farm, only five farms were included in our sampling during the 2020 growing season. In order to balance both the temporal and spatial aspects of the research, roughly half the fields were repeated each year of the study. To allow for replication, three funnels were placed in each field, and each funnel was placed at a different point along the center pivot irrigation system. To account for precipitation, three funnels were placed at each farm in an area free of irrigation. In general, this approach allowed for the passive collection of irrigation water. While sampling from fields, rather than wells directly, meant that our water samples often included both irrigation and precipitation water, we were able to collect roughly ~90 samples a week, which would not have been possible otherwise. As a result of the passive system of sampling, back calculations were performed for each sample to account for any dilution that may have occurred due to precipitation. This study was not crop specific, and any field receiving regular irrigation was included. Throughout the three years of the study, a wide array of crops were grown on the fields sampled, including soybean, potato, sweet corn, field corn, cabbage, hemp, pea, carrot, and strawberry.
Samples were analyzed for both nitrate and chloride using a liquid membrane, combination ion selective electrode. Nitrate and chloride concentration was determined by adding an ionic strength adjuster to each sample, and then measuring the voltage that occurs as a result of the ion exchange between the solution and membrane. To assess the accuracy of our lab analysis (with electrode probes) and determine whether any biases existed, 10% of samples were sent to the UW Stevens Point Water and Environmental Analysis lab and analyzed for N content using a Lachat Instruments Flow Injected Analyzer. When comparing the two methods, we found that the electrode approach overestimated N concentration. To correct for this, a correction factor was applied annually based on the linear regression bet fit line relating the two methods of N concentration measurement. Additionally, a subset of samples were also measured for Total Kjeldahl Nitrogen (TKN), which will allow us to determine how much N is being added during fertigation events (e.g. additional N is mixed with the irrigation water and applied to fields) and provide an additional component of the N budget.
During the 2021 calendar year, to complete a deeper analysis of factors contributing to nitrate contamination, we evaluated the relationship between land cover, well depth, well casing, and nitrate levels. Initial analysis focused on these variables, as past research has found that the shallower the well and thinner the casing, the higher the nitrate concentration. Additionally, heavy agricultural use is the main contributor to groundwater contamination in this area. Considering all of our wells fall within agricultural fields, we wanted to determine if the degree of intensity of agriculture use influenced nitrate concentration. In the future, other variables that may be considered are water table elevation and direction of groundwater flow.
To obtain well depth and well casing information, well construction reports were found using the Wisconsin Well Construction Reports dataviewer based on well location and unique well ID number when provided. Land cover data was compiled annually from 2008 to 2020 using the USDA CropScape data layer, which produces satellite derived land use/land cover data. We placed a 500m buffer around each well in our study to determine land area contributing to each well. For each well, the crops grown within the contributing buffer were determined annually, and a pixel count for each crop was estimated. Using University of Wisconsin nutrient application guidelines, the pixel count for each crop in a given buffer area was multiplied by the respective nitrogen rate recommendation. By utilizing this approach, we were able to estimate the amount of nitrogen each given well was receiving annually.
Using a linear mixed effects model, we then evaluated the relationship between nitrate concentration and farm, field, well casing, well depth, week of sampling, year, and nitrogen application. Within our model, field and farm are random, with field nested in farm. This allows for both field and farm variability to be estimated without losing degrees of freedom, and allows for added structure. The model was tested for normal distribution, and has a lower AIC score than comparable models we created.
To compare and quantify variability in nitrate concentration, the coefficients of variation (CV) were calculated by determining the ratio between the standard deviation and sample mean. Nitrate concentration was grouped at the well level and at the farm level to assess spatial variability in nitrate concentration across wells on the same farm in addition to comparing wells on different farms. Within-season temporal variability was evaluated by comparing well level data for each year, and interanual temporal variability was evaluated by grouping well level data across all three years of the study.
Ecophysiology: potato photosynthetic response to nitrogen, temperature, and soil moisture
During the 2020 growing season, leaf level gas exchange measurements were taken using a LI-COR 6400xt portable gas exchange analyzer (LICOR Inc., Lincoln, Nebraska, USA). The portable system consists of an infrared gas analyzer, leaf chamber, and computer console, allowing for the control of light intensity, temperature, flow rate, relative humidity, and CO2 concentration. To measure photosynthesis and transpiration, an open system approach is taken, calculating photosynthesis and transpiration based on the differences in CO2 and H2O concentrations in in-chamber and pre-chamber air streams. Conceptually, rate of photosynthesis is measured as the difference between photosynthetic carbon assimilation and the CO2 that is lost during mitochondrial respiration. For the 2020 growing season, measurements focused on potatoes grown in a nitrogen rate trial. N rate treatments included 40, 240, and 360 lbs N/ac. Specific data collected included light response curves, CO₂ response curves, survey measurements, soil moisture data, and leaf C:N content. Following photosynthesis measurements of response curves, each leaf was collected for future N content analysis and dried at 80ºC for 24h. In the spring of 2021, samples of at least 8-10 mg of leaf dry matter were ground and analyzed for total C and N via combustion at 900 degrees Celsius using a Flash EA 1112 CN Automatic Elemental Analyzer (Thermo Finnigan, Milan, Italy).
Each CO₂ response curve was then fitted following the Farquhar-Berry-von Caemmerer model of leaf photosynthesis and Vcmax (maximum rate of carboxylation) and Jmax (maximum rate of electron transport) were calculated. Preliminary analysis has focused on evaluating the relationship between Vcmax and nitrogen rate, potato variety, leaf temperature, soil moisture, growth stage, and leaf nitrogen concentration using multiple linear regression.
Nitrate Concentration in Irrigation Water
Across all three years of the study, preliminary results indicate that 73% (338 of 460) of samples analyzed had a nitrate concentration value exceeding 10 mg/L (Figure 1). Nitrate concentration varied widely throughout the study; when evaluating all samples in our study, nitrate concentration ranged from 1 mg/L to 46 mg/L. Average farm level nitrate concentration was 12-21 mg/L, with Farm 1 experiencing the highest average N concentration, and Farm 6 the lowest. The interannual variability in nitrate concentration at the farm level was approximately +/- 5 mg/L, with three farms experiencing less than 2 mg/L of interannual variability. Yearly averages of nitrate concentration were highest in 2018 at 18.68 mg/ L, followed by 2020 at 15.58 mg/L and the lowest average values were observed in 2019 at 14.34 mg/L (Table 2). Interannual variability of nitrate concentration for each unique well was less than approximately 9 mg/L. Approximately 50% of wells (14 out of 30) sampled for multiple years of the study had less than 3 mg/L of interannual variation in nitrate concentration. Average nitrate concentrations of individual wells had an absolute range of approximately 14 mg/L throughout the growing season. Based on our analysis, we found large spatial variability in N levels in irrigation water, and less variability within season and year to year. Fields that were measured in 2018, 2019, and 2020 show good agreement, and the same trends appear to exist year to year across the wells.
The mixed effects model found year to be a statistically significant indicator of nitrate concentration at a significance level of p <.001. However, considering nitrate concentration data was adjusted yearly with a correction factor – this is likely partially induced by our method of analysis. Well depth was also statistically significant at a p level of .1 (Figure 2). However, only one well in our study was deeper than 300 feet, and when removed from analysis, well depth was no longer a statistically significant predictor of N concentration. Well casing diameter, nitrogen rate application, and week of sampling were not statistically significant predictors of nitrate concentration. These results are likely driven by the homogenous factors in our study system -- well depth did not range widely, most wells had similar well diameters, and all wells in the study were on sandy soil in agricultural fields receiving regular nitrogen application.
Considering all three years of our study, the average N concentration in irrigation water was approximately 15.6 mg/L, or 1.5x the EPA standard for safe drinking water. While this number clearly indicates unsafe drinking water, it has less meaning when thinking about N fertilizer application. To determine how much plant available N is being applied through irrigation water, a simple calculation can be done. A grower must estimate the average amount of inches of irrigation applied during a growing season, as well as the N concentration of the specific well they are using to irrigate. Once analyzed, NO3-N levels are typically reported in values of mg/L or ppm of nitrogen, which then can be converted to lbs. per inch of irrigation water by multiplying by 0.226. The resulting value multiplied by annual inches of irrigation estimates the nitrogen applied through irrigation water (expressed as pounds of nitrogen per acre, N lb/ac). See equation: Lbs N per acre = NO3-N (mg/L or ppm) * .226 * inches of irrigation water.
Depending on the crop being grown and the amount of irrigation occurring in a given growing season, the amount of N in irrigation water may account for a substantial portion of the required N inputs for that crop. For instance, corn grown in the WCS typically receives in N rate application of 200 N lb/ac. If we assume a grower is irrigating 8 inches during a growing season, and the irrigation water has a concentration of 20 mg/L N, the grower is then adding approximately 36 N lb/ac through irrigation water, or about 20% of the total N inputs required by corn. Our results emphasize that without crediting the N in irrigation water, growers in the Wisconsin Central Sands are substantially underestimating the amount of plant available N being applied to the landscape. If all of the growers in the region began crediting the N present in irrigation water, fertilizer application could be reduced substantially.
Our results demonstrate both the high prevalence and magnitude of nitrate contamination of groundwater in the central sands region of Wisconsin. Considering only about one in every four wells tests below the EPA threshold for safe drinking water, and the average nitrate concentration per sample was 1.5x above safe drinking water threshold, it is clear that considerable action must be taken if groundwater quality is to improve.
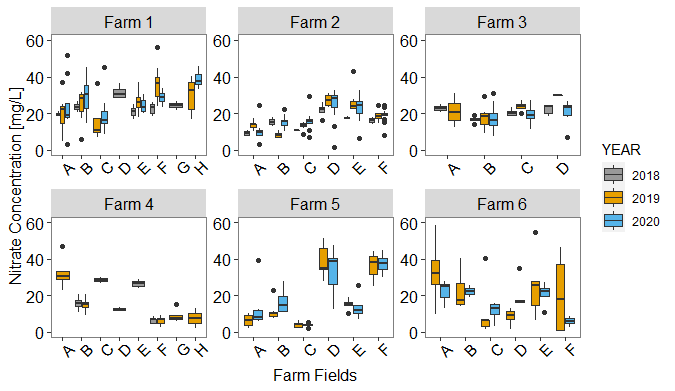
Figure 1.
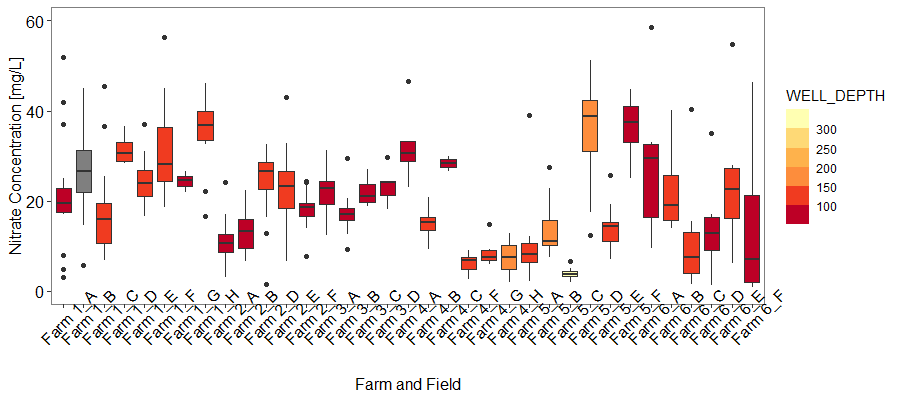
Figure 2.
Potato Ecophysiology
Based on preliminary analysis using multiple linear regression, nitrogen rate, potato growth stage, soil moisture, and leaf temperature were all significant predictors of Vcmax. As Vcmax is used in modeling crop production, understanding the drivers and interactions influencing Vcmax is crucial for more accurate modeling. While our initial research question sought to evaluate differences in physiology across varieties of potato, our analysis did not find significant differences in ecophysiological responses between the Hodag and W9433 varieties included in our study.
Ongoing preliminary analysis has highlighted that with increasing N rate application comes an increase in Vcmax, with the greatest difference in Vcmax evident between the 40 and 360 lb/ac N treatments (Figure 3). While our findings indicate that an increase in nitrogen application rate increases Vcmax, agriculture does not happen in a closed system and other factors outside of the scope of our study must be considered when making management decisions. As previously established, groundwater quality in this region is extremely vulnerable to nitrogen leaching. Moving forward, a systems perspective to managing crops in the Wisconsin Central Sands will be needed if both crop production and ecosystem services are to be valued.
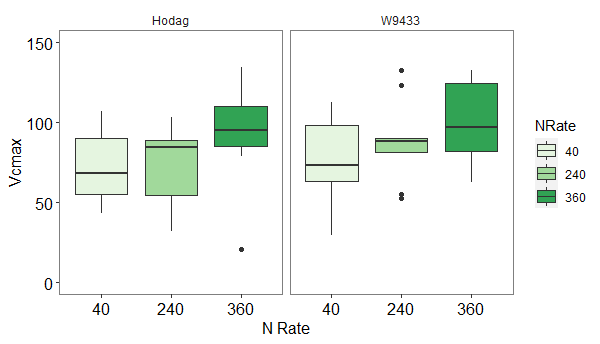
Figure 3.
By taking gas exchange measurement throughout the growing season, we were able to capture the ecophysiological changes that occur in relation to changes in potato phenology. Our results indicate that during both tuber initiation and senescence, the plant experiences a lower Vcmax (Figure 4). These findings highlight the need to collect within-season measurements in order to more accurately understand potato physiology and growth.
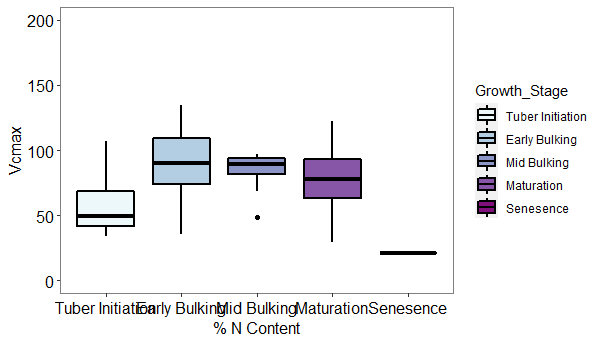
Figure 4.
Based on modeling findings, an increase in the temperature of the leaf is negatively related to Vcmax, meaning that as the temperature of the leaf rises, Vcmax declines (Figure 5). This finding is especially important when continuing to plan for climate change. As the number of days above 90 degrees increases, we can expect potato production systems to experience greater heat stress, lowering Vcmax and possibly resulting in a decline in yield. One additional connection to increasing heat is a corresponding increase in water demand by the plant, which may drive the need for more frequent irrigation, placing increased demand on water and energy resources to maintain production levels. As the agricultural sector continues to face ongoing climate change, it will be critical that current practices are adapted or re-evaluated entirely.
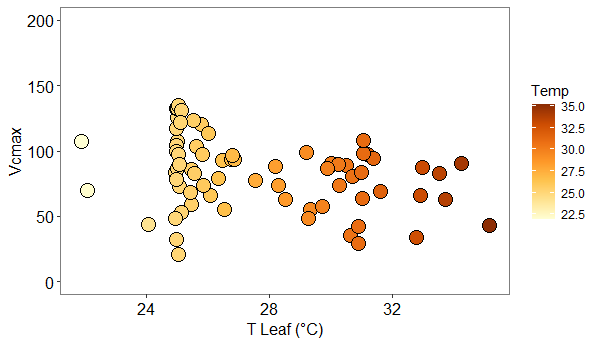
Figure 5.
Future modeling work with the Agro-IBIS agroecosystem model
Ongoing research is focused on incorporating the above research into Agro-IBIS, a processed based model that allows us to better understand systems changes to current and future agricultural production. We are currently developing scenarios focused on the Wisconsin Central Sands region of the state focused on understanding the impact of different fertigation (fertilizer applied through irrigation) strategies on nitrate leaching and crop production under ongoing climate change. Scenario based modeling will allow us to scale up plant and field level approaches to better understand the biophysical and climate drivers on an entire region. This modeling work will directly incorporate the data we’ve collected on nitrate concentration in irrigation water to more accurately model nitrogen inputs within the system. By comparing nitrogen fertigation scenarios with broadcasting split-application scenarios, we can help to inform more efficient nitrogen management practices. Building off of the data collected in the field, our modeling work will support an improved understanding of the larger scale impacts of N in irrigation water and a changing climate on water quality and crop production in the Wisconsin Central Sands.
Educational & Outreach Activities
Participation summary:
Research was presented at the Wisconsin Potato and Vegetable Growers Association in February of 2020. Attendees include academic researchers, graduate students, agricultural specialists, extension agents, and growers. About 30 individuals attended the talk. Research has also been presented at an on farm presentation located in Plover, Wisconsin. Participants included graduate students, farmers, and county extension agents, and number of participants is estimated to be 30. A flyer was distributed during the on farm presentation, explaining the research and providing tables for easy calculations. Additionally, some of our results were presented at the virtual Agro-IBIS workshop during April of 2020, which had about 20 graduate students and professors in attendance. Moving forward, the research will be presented at the American Water Resources Association annual conference on March 4th of 2021, as well as at a farmer led watershed group sometime in the summer of 2021. We expect at least two peer reviewed paper to be published from this work. Additional presentations were expected in the spring of 2020, but were canceled due to Covid.
During 2021, this research was presented virtually at the Wisconsin chapter of the American Water Resources Association annual conference, which was attended by about 50 researchers, working on water quality and quantity related work. Additionally, this research was presented nationally at the annual conference for the Agronomy Society of America in Salt Lake City, UT during November of 2021. The talk was attended by roughly 25 scientists, spanning different disciplines and regional focuses. Due to the Delta and Omicron waves of the Covid-19 virus, opportunities for more (safe) presentations were limited.
Project Outcomes
Through our project, we collected water samples from six farms across the Wisconsin Central Sands. Located in the central region of the state, this area is faced with an array of challenges due to geography, hydrology, and economic sectors in the region. As an area characterized by its sandy soil and shallow water table, agricultural fields in the region are highly susceptible to nitrate leaching. Considering that many in the community receive their drinking water from private wells testing well above the EPA threshold of 10 ppm of Nitrate, this is especially concerning. Our research project has highlighted both the severity of N contamination in irrigation water across the region, while also illustrating the wide spatial variability in N levels and minimal temporal variability. Using this information, growers can determine how frequently they need to test the N levels in their water. Additionally, growers may use our findings to begin accounting for the N already present in their irrigation water, when determining how much N to apply to crops during the field season. By taking this approach, growers could substantially reduce the amount of N being applied to the landscape, preventing further groundwater contamination.
By conducting research on farms across the Wisconsin Central Sands, we had the chance to interact directly with farmers and growers in the area, and as a result, became more aware of the barriers they face in relation to nitrogen management. For instance, during presentations we received feedback from growers about the perceived uncertainty surrounding the crediting of nitrate in irrigation water. We also learned that some farmers don't consider groundwater quality to be much of a concern, while others have already been implementing improved management practices for years. As a result, this information has helped us improve our science communication on the topic, as well as actively seek out input from growers in the area. A survey sent to growers in the region as part of a related project has highlighted that growers consider the risk of reducing crop yield, unclear benefit of crediting, and lack of information to be the largest barriers to crediting nitrate in irrigation water. Additionally, through our widespread sampling of irrigation water, we have a better understanding of the nitrate concentration in irrigation water and how it varies across space and time. Specifically, our results indicate that N levels vary minimally within a growing season, or from year to year, but there is substantial variability from farm to farm, and even among fields within the same farm. This information will allow growers and educators to improve N crediting recommendations.
We received the following email from a vegetable farmer located in Central Wisconsin:
"Thank you for that and thank you for conducting this research. That field grew excellent peas this year and I put part of that to your research making me aware of the nitrates in the water so I could credit them. The peas stood better since I credited the N and I applied less. Higher yields and less inputs that’s a win win!"
Based off a survey to growers in the Central Sands region of the state, we found that at least four growers have increased their crediting of N in irrigation water over the past year.