Final report for GNC19-283
Project Information
Effective nitrogen management is an area of major concern to all farmers, and its impacts extend far beyond final yield. Excess nitrogen fertilization can cause losses in quality and even yield for a variety of crops, and N leaching is associated with environmental damage and contamination. Still, many farmers tend to over-apply to avoid yield losses. Both the environmental and plant nutrition problems are exacerbated in sandy soils, where leaching can occur rapidly. Processing carrots are grown in such soils in the North Central region, and due to their long season many growers apply three or more topdresses during the summer and fall. The proper timing of these applications is uncertain. Some carrot growers have adopted petiole nitrate sampling as a means of timing these applications, applying N when the sampled nitrate values fall below a threshold. This method is labor intensive, however, and has poor spatial and temporal resolution relative to what is required for decision-making. Further, the thresholds at which fertilization should occur are not well-established. Remote sensing using drones comes with the advantages of being relatively low-cost and rapid to implement, yielding spatially continuous image data which can be collected on-demand.
The approach of this study was to evaluate the impact of topdress application timing on carrot yield, and to compare the accuracy and reliability of drone-based remote sensing methods to petiole nitrate sampling. A two-year on-farm trial (2019-2020) was established with a grower collaborator near Hart, MI to complete this objective. Treatments included a starter-only control (29 kg ha-1 N) and a ramp of season-total N rates (67, 135, and 202 kg ha-1 N) applied as starter fertilizer plus topdressed urea, as well as two treatments in which the recommended rate (135 kg ha-1 N) was applied on a split schedule offset from the other treatments by two weeks (early, late). Three additional treatments had topdresses of 67, 135, and 202 kg ha-1 N applied entirely at the first topdress date rather than splitting. These treatments allowed analysis of the impact of topdress rate, splitting, and timing on carrot yield and the evolution of petiole nitrate and carrot imagery over the course of the season. Results were communicated to farmers primarily through presentations at scientific conferences, field days, and grower meetings. Planned outcomes included an improved understanding of carrot nutrient management, as well as drone technology and its potential uses for vegetable farmers in the region.
The experiment found that the higher-than-recommended season N rate (202 kg ha-1) was associated with significantly increased yields in both years, though there were no yield differences between the 67 and 135 kg ha-1 N rates. In fact, in 2020 there were no differences between any of the lower rates including the starter-only control treatment. Topdress splitting and timing showed no impacts on yield, but split applications and later topdress timings were associated with increased N uptake in a wet year, possibly mitigating the risk of leaching losses. Vegetation indices calculated from both RGB and multispectral drone imagery were found to correlate with final yield across much of the season, and sufficiency indices normalized using a high-N treatment as a healthy reference delivered more conservative recommendations compared to petiole sap nitrate testing.
The main goal of this study was to evaluate how drone-based remote sensing technology can be used for fertilizer application timing decision support in processing carrots. Concomitant with this goal was an evaluation of how application rate, splitting, and timing impact yield. The results of this study can give a realistic picture of the potential of this new technology for carrot nitrogen management, as well as information regarding the importance of timing as a management consideration. The specific outcomes we sought are as follows:
Learning Outcomes
- Carrot farmers will have a more complete understanding of the importance of nitrogen topdress application timing as a management consideration, and the potential utility of drone-based decision-support relative to current practices (petiole sampling).
- Vegetable farmers and researchers will have both an improved awareness and greater understanding of drone technology and its strengths and limitations.
- Farmers and agricultural researchers will be better equipped to critically evaluate scientific or sales publications regarding the use of drones in agriculture.
Action Outcomes
- Carrot farmers will improve their nitrogen management practices through more robust decision support relative to current practices.
- Some carrot farmers will be able to integrate drones into their scouting and monitoring programs for nitrogen management.
- Carrot farmers and researchers will be better able to experiment with drone-based remote sensing for different applications more specific to their needs.
Research
Field Trials
From June to October 2019 an extensive field campaign was initiated in an active commercial agricultural field during carrot production in Oceana County, Michigan, USA (43.5552° N, 86.0958° W; “Site 1”). The experiment was repeated at another commercial agricultural field in 2020, located northwest of Site 1 in the adjacent Mason County (43.8267° N, 86.3827° W; “Site 2”).
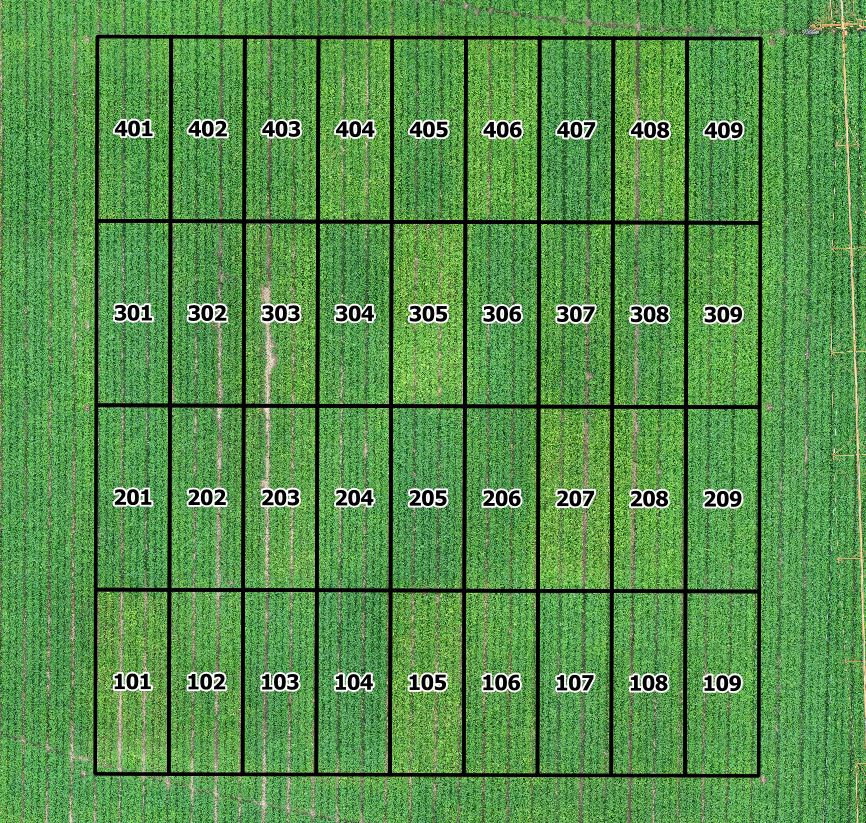
Both sites were prepared for carrot planting using a custom strip tiller consisting of a shank, bed forming disks, and rotary cultivator. At Site 1, processing carrots of the cultivar Cupar were seeded in 3-row beds on 20 April 2019. Carrot rows were spaced 0.46 m apart within each bed with 1.63 m between bed centers. The same spacing was used at Site 2 with cultivar Canberra seeded on 24 April 2020. A total of 29 kg ha-1 N was applied with the planter as liquid starter fertilizer in both years. Experimental plots 4.88 m (three beds) across and 12.19 m deep were arranged in a randomized complete block design with four replications.
In addition to a low N control which used starter fertilizer only, treatments included a ramp of season-total N rates (67, 135, and 202 kg ha-1 N) corresponding to 50, 100, and 150% of the recommended season-total N rate for processing carrots on mineral soils in Michigan (Warncke et al., 2004). These rates were applied as starter fertilizer plus topdressed urea. Due to projections of a hot and dry summer in 2020, topdresses in that year were applied as urea mixed with Agrotain at the manufacturer-recommended rate of 2.09 L t-1 to mitigate volatilization losses. Topdresses occurred as either a single large frontloaded application or three equally sized split applications. Frontloaded applications occurred entirely on the dates corresponding to the first split applications, with split applications continuing on at roughly 4 wk intervals. Two additional treatments were included that follow Michigan State University’s recommended grower practice (135 kg ha-1 N applied as starter plus split topdress applications) with the exception that split topdress applications were initiated approximately 2 wk earlier and 2 wk later than the other split treatments. The 2019 and 2020 topdressing schedules for these different groups of treatments are shown in Table 1.

Data Collection
Site visits occurred at approximately 2 wk intervals to accommodate the fertilizer application schedule and collect plant data (Table 2). During each site visit, 5-10 carrot plants were collected per plot. The youngest fully-expanded leaf was removed from sampled plants, and the petiole sap was expressed and analyzed for nitrate concentration. To estimate final total yield, carrots were harvested shortly before commercial harvest (29 October 2019, 13 October 2020). Roots and shoots were separated and the shoots weighed fresh. Before being weighed, harvested carrots were graded into either marketable or cull categories based on market specifications.
A DJI Phantom 4 Pro quadcopter equipped with a 20-megapixel natural color camera was used to collect red-green-blue (RGB) composite imagery of the experimental sites. A MicaSense RedEdge-MX camera was also affixed to the drone to collect multispectral image data at the 475 nm (blue), 560 nm (green), 668 nm (red), 717 nm (red-edge), and 842 nm (near-infrared) spectral bands.
Vegetation and Sufficiency Indices
The normalized RGB and multispectral bands were used to calculate two vegetation indices (VIs) which are associated with plant N status: the visible Green Leaf Index (GLI) and the multispectral Normalized Difference Vegetation Index (NDVI) (Louhaichi et al., 2001; Rouse et al., 1973). GLI was calculated using only the RGB camera data while NDVI used multispectral camera data in order to assess their relative performance given the differing equipment required. Mean values of these VIs were calculated over the plot areas.
In order to convert plot mean VI values to sufficiency indices (SIs), a reference value was first calculated for each sampling date by averaging the VI values of the plots which received the 202 kg N ha-1, frontloaded topdress treatment. This treatment (the “reference treatment”) was assumed to be the best approximation of a non-N limited reference area due to the high N rate and single topdress required. Plot mean VI values were then effectively normalized by dividing by the reference value for the corresponding date, yielding SI values (GLI-SI; NDVI-SI) for each experimental plot on each sampling date from 20 June through 9 October 2019 and 18 June through 8 October 2019.
Statistical Analysis
Statistical analysis was also performed using R statistical software. The fixed effects of total season N rate and topdress division on total yield and shoot fresh weight were evaluated for each year using type 3 ANOVAs. The data evaluated using this model excluded the starter-only treatment as well as the early and late topdress treatments to maintain balanced data. Dunnett’s test was then used to compare the individual treatments within this data subset to the control treatment, selected as the low-N starter-only treatment, to further develop the interpretation of topdress rate and division effects. The fixed effects of split topdress timing on the same response variables were evaluated using a subset of data which included the early and late topdress treatments as well as the split 135 kg ha-1 N rate treatment on the intermediate timing. Replicate was included as a random blocking factor in both models.
In order to make hypothetical topdressing decisions in the same manner as the petiole sap nitrate test, i.e. by comparing sampled values to a minimum threshold, minimum SI thresholds for triggering topdress applications were calculated for the GLI-SI and NDVI-SI. Using simple linear regression equations between total yield and the SIs for each date, SI thresholds were calculated as the SIs corresponding to the mean total yield of the reference treatment in each year. Only highly significant (p < 0.01) regression equations were used to maintain accuracy in yield predictions. The average of these calculated thresholds for each year was then compared to plot SI values, with SI values below the threshold corresponding to a hypothetical topdress event.
Carrot Yield and Shoot Biomass
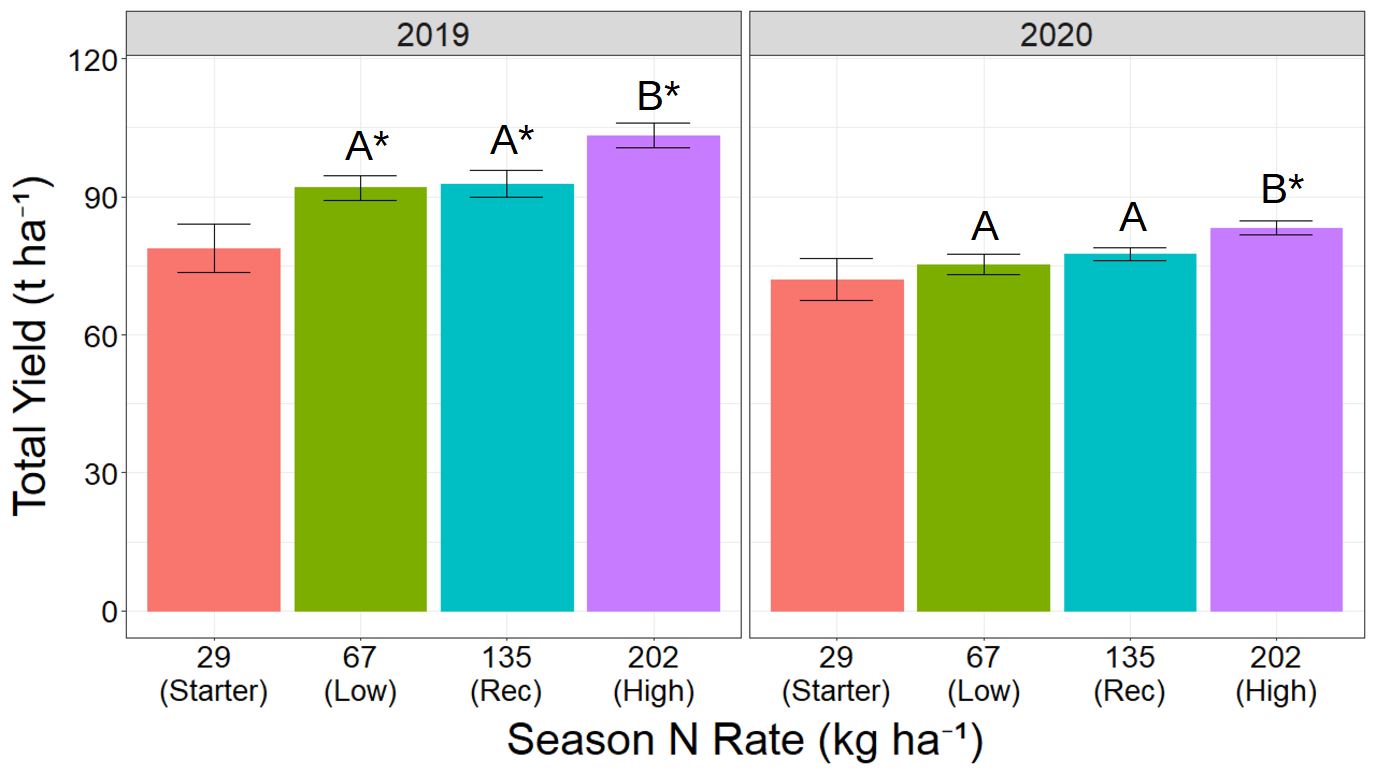
The highest N rate of 202 kg ha-1, applied either frontloaded or split, showed significantly higher total yield and shoot fresh weight when compared to the lower N rates, including the low-N control, in both years (Figure 1). No significant yield differences were found between the 67 and 135 kg ha-1 N rates in either year, though both showed significantly higher yields than the low-N control in 2019. In addition to the highest N rate treatments, split applications of the 135 kg ha-1 N rate led to higher shoot fresh weights compared to the low-N control while the treatments receiving 67 kg ha-1 showed no such differences.
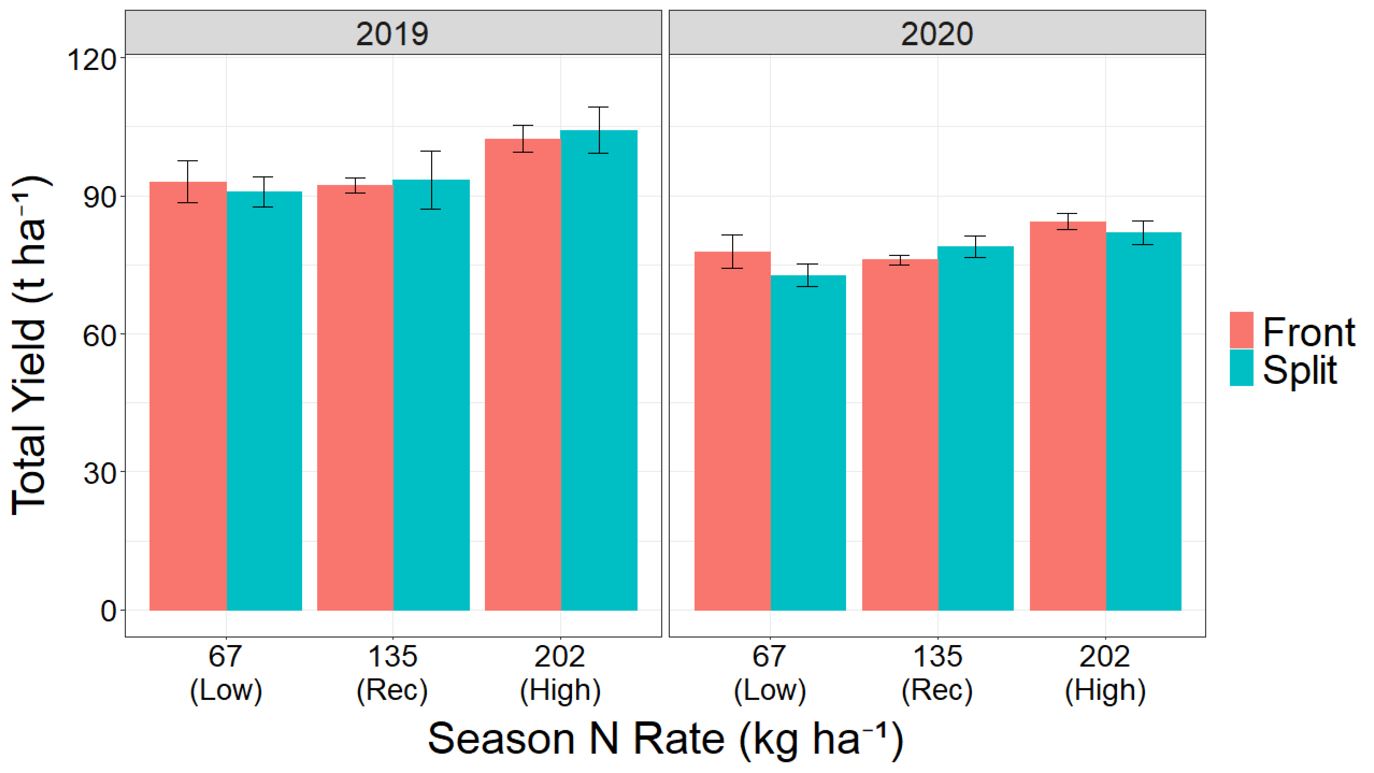
There was no significant effect of topdress division on yield, but treatments with split N applications consistently demonstrated significantly higher shoot fresh weight than treatments with frontloaded N applications (Figure 2). Split treatments were also associated with significantly higher plant N uptake in 2019, which received more than 50% more rainfall over the season compared to 2020. Later topdress timings also showed higher N uptake in 2019 compared to the early topdress timing. The timing of split topdresses showed no significant effect on yield and only showed marginally significant effects on shoot fresh weight, as late timing was associated with increased shoot biomass at harvest relative to the early timing.
Tradeoffs in N Topdress Strategies
The effects of topdress N rate were more pronounced on final shoot biomass than on total yield. This agrees with similar findings by Makries & Warncke (2013) and Westerveld et al. (2006) which showed that carrot shoots were more responsive to N than carrot roots. By contrast, the number and timing of topdresses showed no significant effects on yield, and even the increases in the more-responsive shoot fresh weight associated with later timing and split applications were only marginally statistically significant. These differences in processing carrot yield, even if not statistically significant, could still be economically relevant and potentially justify increased logistical and management costs due to the high value of processing carrots. Adaptive N management, either through the petiole sap nitrate test or another tool such as VI-based sufficiency indices, has the potential to realize some of these economic benefits by allowing for delivery of N closer to the optimal time points.
Topdress Application Decisions
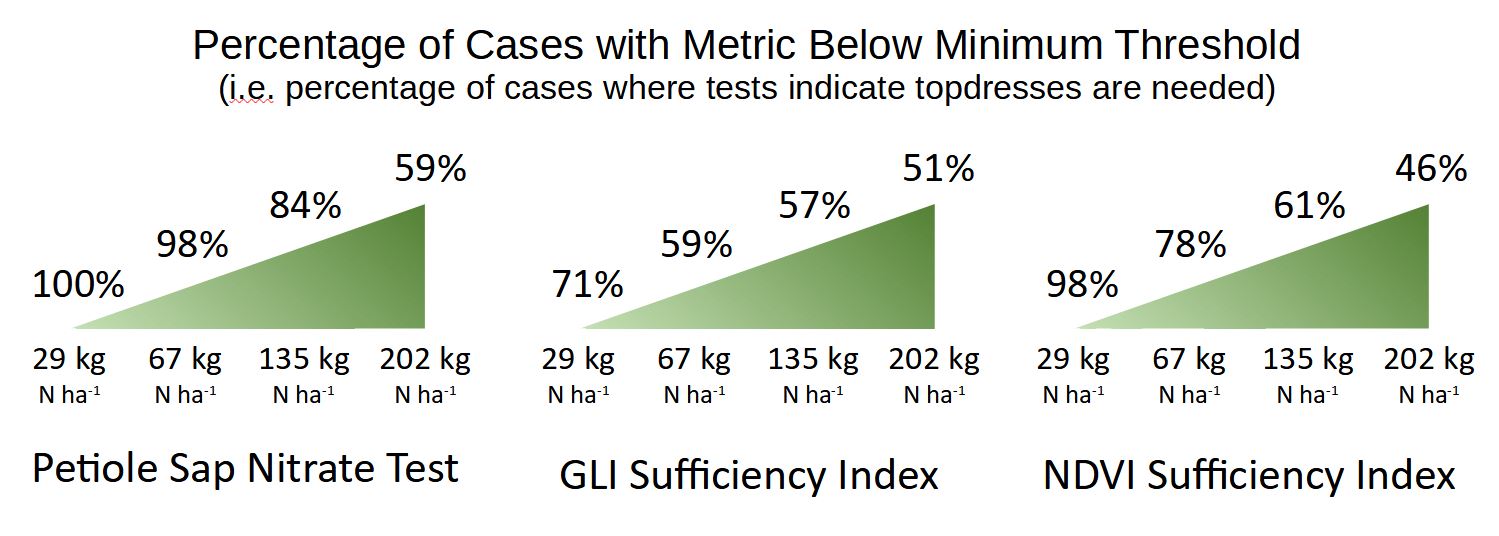
Twelve of 17 regressions showed significant correlations between SI values and yield in 2019, while only 6 of 17 correlations were significant in 2020. The mean GLI-SI and NDVI-SI threshold values in 2019 were 1.007 and 0.997 while the 2020 means were 0.989 and 0.990, respectively. These within-year means were used as minimum threshold values for GLI-SI and NDVI-SI in the hypothetical topdress application decision analysis, while the minimum acceptable thresholds published by MSU Extension were used as the corresponding thresholds for the petiole sap nitrate test (MSU Extension, 2011). The petiole sap nitrate test indicated the need for topdress N more often on average than the GLI-SI or NDVI-SI methods, with GLI-SI and NDVI-SI showing 79% agreement in recommending topdress application (Figure 3). The petiole sap nitrate test recommendation matched the GLI-SI and NDVI-SI recommendations in 57% and 64% of cases, respectively, with cases where the petiole sap nitrate test recommended a topdress but GLI-SI and NDVI-SI did not constituting the majority of the disagreement (34% and 28% of cases).
Comparing Topdress Decision Making Tools
The relationships found between VI-based SIs and total yield were not useful for identifying N deficiencies earlier than July or August, after the reference treatment had received its topdress and N variability was introduced in the trial more broadly. The timing of this utility may change depending on the amount of starter fertilizer used and when topdress N is introduced, as depletion of starter N and the application of topdress N to the reference area would influence the development of differences in the field. The use of VI-based metrics for identifying N deficiencies in root vegetable crops like processing carrots is also complicated by imbalances in N response between roots and shoots. As the aboveground component visible to inspection, differences in the size and appearance of plant shoots are essentially what VI differences show even though the root size is most relevant for growers. The statistically significant relationships found between these VIs and yield demonstrate that there is some relationship between shoot size and root size, but care must be taken in interpreting differences in shoot appearance and basing topdress N decisions on those differences.
The GLI-SI and NDVI-SI metrics generally agreed on whether or not to topdress, with greater disagreement between these metrics and the petiole sap nitrate test. Most of the disagreement was caused by the petiole sap nitrate test recommending a topdress where the other metrics did not; in fact, the petiole sap nitrate test indicated the need for topdress N more often than the SI metrics across all treatments. This was especially true in late September, as the petiole sap nitrate test recommended topdresses in all treatments at a time when additional N is not usually applied to avoid issues with high root nitrate and wasted N. Overall, the GLI-SI and NDVI-SI were more conservative and recommended fewer N topdresses relative to the petiole sap nitrate test using the calculated SI thresholds. However, different thresholds could produce much different results; at the SI threshold of 0.95 popular for use with handheld chlorophyll meters, for example, the SI recommendations would be even more conservative. The management of the reference area, particularly the rapid growth following large topdresses which was seen in this trial, could also disproportionately affect VI values for some length of time and influence the corresponding recommendations. Still, the overall similarity between the recommendations given by the two SI metrics indicates that a purely visible (i.e. RGB-based) index such as GLI could be used without sacrificing performance. This could save farmers the extra cost and technical expertise associated with using a multispectral camera, as many drones come equipped with a RGB camera.
References
Louhaichi, M., Borman, M. M., & Johnson, D. E. (2001). Spatially located platform and aerial photography for documentation of grazing impacts on wheat. Geocarto International, 16(1), 65–70. https://doi.org/10.1080/10106040108542184
Makries, J. L., & Warncke, D. D. (2013). Timing Nitrogen Applications for Quality Tops and Healthy Root Production in Carrot. Communications in Soil Science and Plant Analysis, 44(19), 2860–2874. https://doi.org/10.1080/00103624.2013.823987
MSU Extension. (2011). Petiole sap nitrate guidelines - MSU Extension. https://www.canr.msu.edu/news/petiole_sap_nitrate_guidelines
R Core Team. (2020). R: A Language and Environment for Statistical Computing (3.5.1). R Foundation for Statistical Computing. https://www.r-project.org/
Rouse, J. W., Haas, R. H., Schell, J. A., & Deering, D. W. (1973). Monitoring the vernal advancement and retrogradation (green wave effect) of natural vegetation.
Warncke, D., Dahl, J., & Zandstra, B. (2004). Nutrient Recommendations for Vegetable Crops in Michigan (E2904). In Michigan State University Extension Bulletin (Issue E2934).
Westerveld, S. M., McKeown, A. W., & McDonald, M. R. (2006). Distribution of nitrogen uptake , fibrous roots and nitrogen in the soil profile for fresh-market and processing carrot cultivars. Canadian Journal of Plant Science, 86, 1227–1237. https://doi.org/10.4141/P05-239
Educational & Outreach Activities
Participation summary:
4 Sept 2019: An on-farm demonstration entitled "Drone Imagery and Carrot Topdress Timing" took place as part of the Oceana Research Tour organized by Dr. Ben Werling, West Michigan Vegetable Educator for MSU Extension. Area growers and other industry professionals were invited to observe the research plots for this experiment, see a drone flight demonstration, and ask questions related to the costs, uses, limitations, and technical aspects of drone-based remote sensing.
19 Feb 2020: An oral presentation entitled "N Topdress Strategies in Processing Carrots" was given at the winter Michigan Carrot Committee meeting. The presentation served as a summary of this project's first-year results. Several MSU researchers, approximately 10 Michigan carrot growers, and one or two industry professionals attended.
16 Sept 2020: A "virtual field day" video presentation took place as part of the virtual Oceana Research Tour organized by Dr. Ben Werling, West Michigan Vegetable Educator for MSU Extension. Area growers and other industry professionals were invited to view prepared videos about research updates, as well as to participate in Q&A sessions with the researchers involved in each video. First-year results of this project were shared along with remote sensing background information for growers.
10 Nov 2020: A pre-recorded oral presentation entitled "Remote Vs Proximal Monitoring for N Topdress in Processing Carrots" was given at the ASA-CSSA-SSSA (Tri-Societies) 2020 Annual Meeting. The presentation detailed the motivation, methods, and first-year results of this project.
24 Feb 2021: A summary of trial agronomic results along with drone-based remote sensing work was given in pre-recorded video format at the winter Michigan Carrot Committee meeting. Several other MSU researchers attended along with major Michigan carrot growers. The video created for this meeting may also be used for ongoing MSU Extension purposes.
1 April 2021: Thesis (link)
In Preparation: Paper
Project Outcomes
The sustainability aspect of this study was mainly focused on the possible utility of drone-based monitoring for topdress N decision support. This utility was fairly well demonstrated via the correlations between total yield and sufficiency indices based on GLI and NDVI, although significant correlations were stronger and more numerous in 2019 compared to 2020. The hypothetical topdress decisions made in this study using GLI-SI and NDVI-SI were also more conservative, recommending fewer N applications compared to petiole sap nitrate testing. This has the potential to reduce applied N while maintaining yields by allowing for delivery of N closer to the optimal time points. Relatively few significant yield differences were found using varying N rates and application strategies, supporting the idea that inputs can be reduced without sacrificing yield. In terms of leaching risk, we also found that split topdresses and later topdress timings increased plant N uptake in a particularly wet year and could reduce leaching.
This project also laid significant groundwork for related future studies. While drone technology requires more equipment and expertise than the petiole sap nitrate test and may be more vulnerable to misidentifying other nutrient or disease issues as N status issues, it is also more scalable for variable rate N or other precision agriculture applications. With more development, the synergy of these technologies could significantly reduce agricultural inputs, creating both economic and environmental sustainability benefits. Future work could also include treatments with N management actually based on the petiole sap nitrate test and SIs to examine the impacts and tradeoffs of these decision support tools more rigorously.
Over the course of this project, we gained significant experience and skill in processing and analyzing remote sensing data combined with an increased knowledge of sustainable agriculture goals and techniques. Through this experience, we found new possibilities and opportunities for applying high-resolution agricultural remote sensing to reduce inputs like fertilizer and fungicides, both in processing carrots and in other vegetable crops. Our optimism for remote sensing tools was tempered somewhat by the mixed results of this trial as well as the additional management logistics required to use the method shown, but overall remote sensing demonstrated potential as a tool for reducing inputs and making agriculture more sustainable.