Final report for GNC19-289
Project Information
This project will evaluate the establishment of native plant species for livestock forage and wildlife habitat in a silvopasture system. A mix of native cool and warm season grasses, forbs, and legumes will be planted in two treatments (black walnut and pitch-loblolly pine) of mature silvopasture systems. The rate of establishment beneath each canopy type will be compared to an open pasture control. Forage nutritive value (fiber, protein and digestibility) will be measured.
Giving talks and presentations at university agriculture research center field days will be the main source of outreach to farmers and ranchers, as these are heavily attended events by the target audience. A video chronicle of the project produced and posted on social media pages hosted by the College of Agriculture, Food, and Natural Resources (CAFNR) will allow producers the opportunity to learn, comment, ask questions, and stay updated on project progress throughout the year. Attendees of field days and other meetings will be given pre- and post-presentation surveys to determine the level of knowledge gained for the different aspects of our project. Questions on the surveys will help provide reflection on whether or not the project outcomes have been met.
There are four main outcomes related to farmers and ranchers for this project. First, they will learn how to establish native species in a silvopasture system to use as forage for livestock. Second, farmers and ranchers will be able to use these newly learned practices to incorporate pollinator-friendly species into their own existing forage-livestock systems, and that some may consider managing existing timber land to create a silvopasture system for improved land management and livestock use. Being able to produce two commodities (timber and forage for grazing/haying) on the same amount land where previously only one had been produced allows farmers and ranchers to expand their enterprise and increase their economic value without having to purchase more acres. Incorporating the native plant species as a forage choice draws pollinators to the area creating a more aesthetically pleasing environment for wildlife habitat while improving quality of life for the people and their livestock.
The goals of this project are that farmers and ranchers:
- Learn how to establish native species best suited to the shade environment of different silvopasture systems to use as forage for livestock that will also serve as an attraction to pollinators.
- Learn the benefits of having established native forages in silvopasture.
- Are able to use these newly learned practices into action to incorporate pollinator-friendly species into their own existing forage-livestock systems.
- Consider managing their existing timber land to develop a silvopasture system for improved land management and livestock use.
Cooperators
- (Researcher)
Research
To prepare the site for planting, existing vegetation was mowed to ground level and allowed to regrow. Regrowth was sprayed with a broad-spectrum herbicide and then mowed to ground level a second and final time. The planting area was divided in half to represent Year 1 and Year 2 of the study.
A total of 23 native plant species (see Table 1) were selected and divided into three plant functional groups: cool season grasses, warm season grasses, and forbs and legumes. Cool season grass species (Canada Wild Rye; Early Wild Rye; Virginia Wild Rye) were drilled into the Year 1 sections of the three replications of Pitch X Loblolly Pine and Black Walnut silvopasture as well as an open pasture control around mid-September 2019. After emergence, stand counts were taken weekly in each treatment at 1, 3, and 5-meter locations from the tree row; weekly measurements continued until first frost. These measurements will help determine if there was any variation in stand count due to changes in tree canopy density as one moves from the tree trunk to the center of the alley. All remaining plant species (warm season grasses; forbs; legumes) were frost seeded via drill in mid-December 2019. Frost seeding allows for vernalization, which is necessary for some species to break dormancy in the following spring.
Table 1: Plant species by functional group; Latin binomial, common name, and percentage of total seed mix planted
|
Latin binomial |
Common name |
Percent of seed mix |
|
COOL SEASON GRASSES |
|
|
|
Elymus canadensis L. |
Canada wild rye |
3.25% |
|
Elymus macgregorii R.E. Brooks & J.J. N. Campb. |
Early wild rye |
10.4% |
|
Elymus virginicus L. |
Virginia wild rye |
16.2% |
|
WARM SEASON GRASSES |
|
|
|
Andropogon gerardi Vitman |
Big bluestem |
19.5% |
|
Tripsacum dactyloides (L.) L. |
Eastern gamagrass |
11.7% |
|
Sorghastrum nutans (L.) Nash |
Indian grass |
14.9% |
|
Panicum virgatum L. |
Switchgrass |
2.60% |
|
Sporobolus compositus (Poir.) Merr. |
Tall dropseed |
1.30% |
|
FORBS |
|
|
|
Silphium perfoliatum L. |
Cup plant |
1.30% |
|
Helianthus maximiliani Schrad. |
Maximillian sunflower |
1.95% |
|
Heliopsis helianthoides (L.) Sweet |
Oxeye sunflower |
1.30% |
|
Echinacea pallida (Nutt.) Nutt. |
Pale purple coneflower |
0.65% |
|
Coreopsis tinctoria Nutt. |
Plains coreopsis |
1.30% |
|
Echinacea purpurea (L.) Moench |
Purple coneflower |
2.60% |
|
Coreopsis lanceolata L. |
Tickseed coreopsis |
1.30% |
|
Monarda fistulosa L. |
Wild bergamot |
0.65% |
|
Parthenium integrifolium L. |
Wild quinine |
0.65% |
|
LEGUMES |
|
|
|
Desmanthus illinoensis (Michx.) MacMill. Ex B.L. Rob. & Fernald |
Illinois bundleflower |
2.60% |
|
Amorpha canescens Pursh |
Lead plant |
0.65% |
|
Chamaecrista fasciculata (Michx.) Greene |
Partridge pea |
1.95% |
|
Dalea purpurea Vent. |
Purple prairie clover |
1.30% |
|
Lespedeza capitata Michx. |
Roundhead lespedeza |
0.65% |
|
Desmodium canadense (L.) DC. |
Showey tick trefoil |
1.30% |
Plant stand counts for all Year 1 species resumed after the last frost in early 2020. Additionally, environmental data was collected through sensors connected to a HOBO data logger. These sensors collected measurements for ambient temperature, soil moisture, and light availability (photosynthetically active radiation, PAR). Two sets of sensors collected data over a 24-hour period at a randomized location in each treatment and were rotation through random locations throughout the course of the growing season. The data collected through these sensors will indicate any environmental differences between the two different types of tree canopies.
Year 2 cool season grass species were drilled mid-September 2020 following a mowing of existing vegetation. Stand counts were collected following the same protocol as Year 1. The frost seeding via no-till drill of all other Year 2 species was completed in February 2021. Plant stand count data and environmental data for Year 2 was collected after the last frost in 2021 in the same manner as Year 1. Additionally, we took a final stand count for the Year 1 treatment areas at the end of the 2021 growing season to determine species persistence.
Statistical Analysis
All data were analyzed using the PROC GLIMMIX procedure of SAS version 9.4 (SAS Institute, 2013). Treatment differences were considered significant if P≤0.05.
At the time of this report, Year 2 data and forage quality data have not been fully analyzed due to circumstances beyond our control. Therefore, the following results will only pertain to data from the Year 1 plantings. After all remaining data has been analyzed, this report will be amended accordingly.
Environmental Data Results
For each of our three sensor types (PAR, soil moisture, ambient temperature) data collected was compiled to represent an average 24-hour period during the growing season for each treatment.
Figure 1 shows the 24-hour average PAR for each treatment. An asterisk designates an hour in which there were significant statistical differences amongst treatments. On average, PAR in the open pasture control was significantly greater than the two silvopasture treatments during hours 13-15 and 17-20. There were no other statistical differences between treatments.
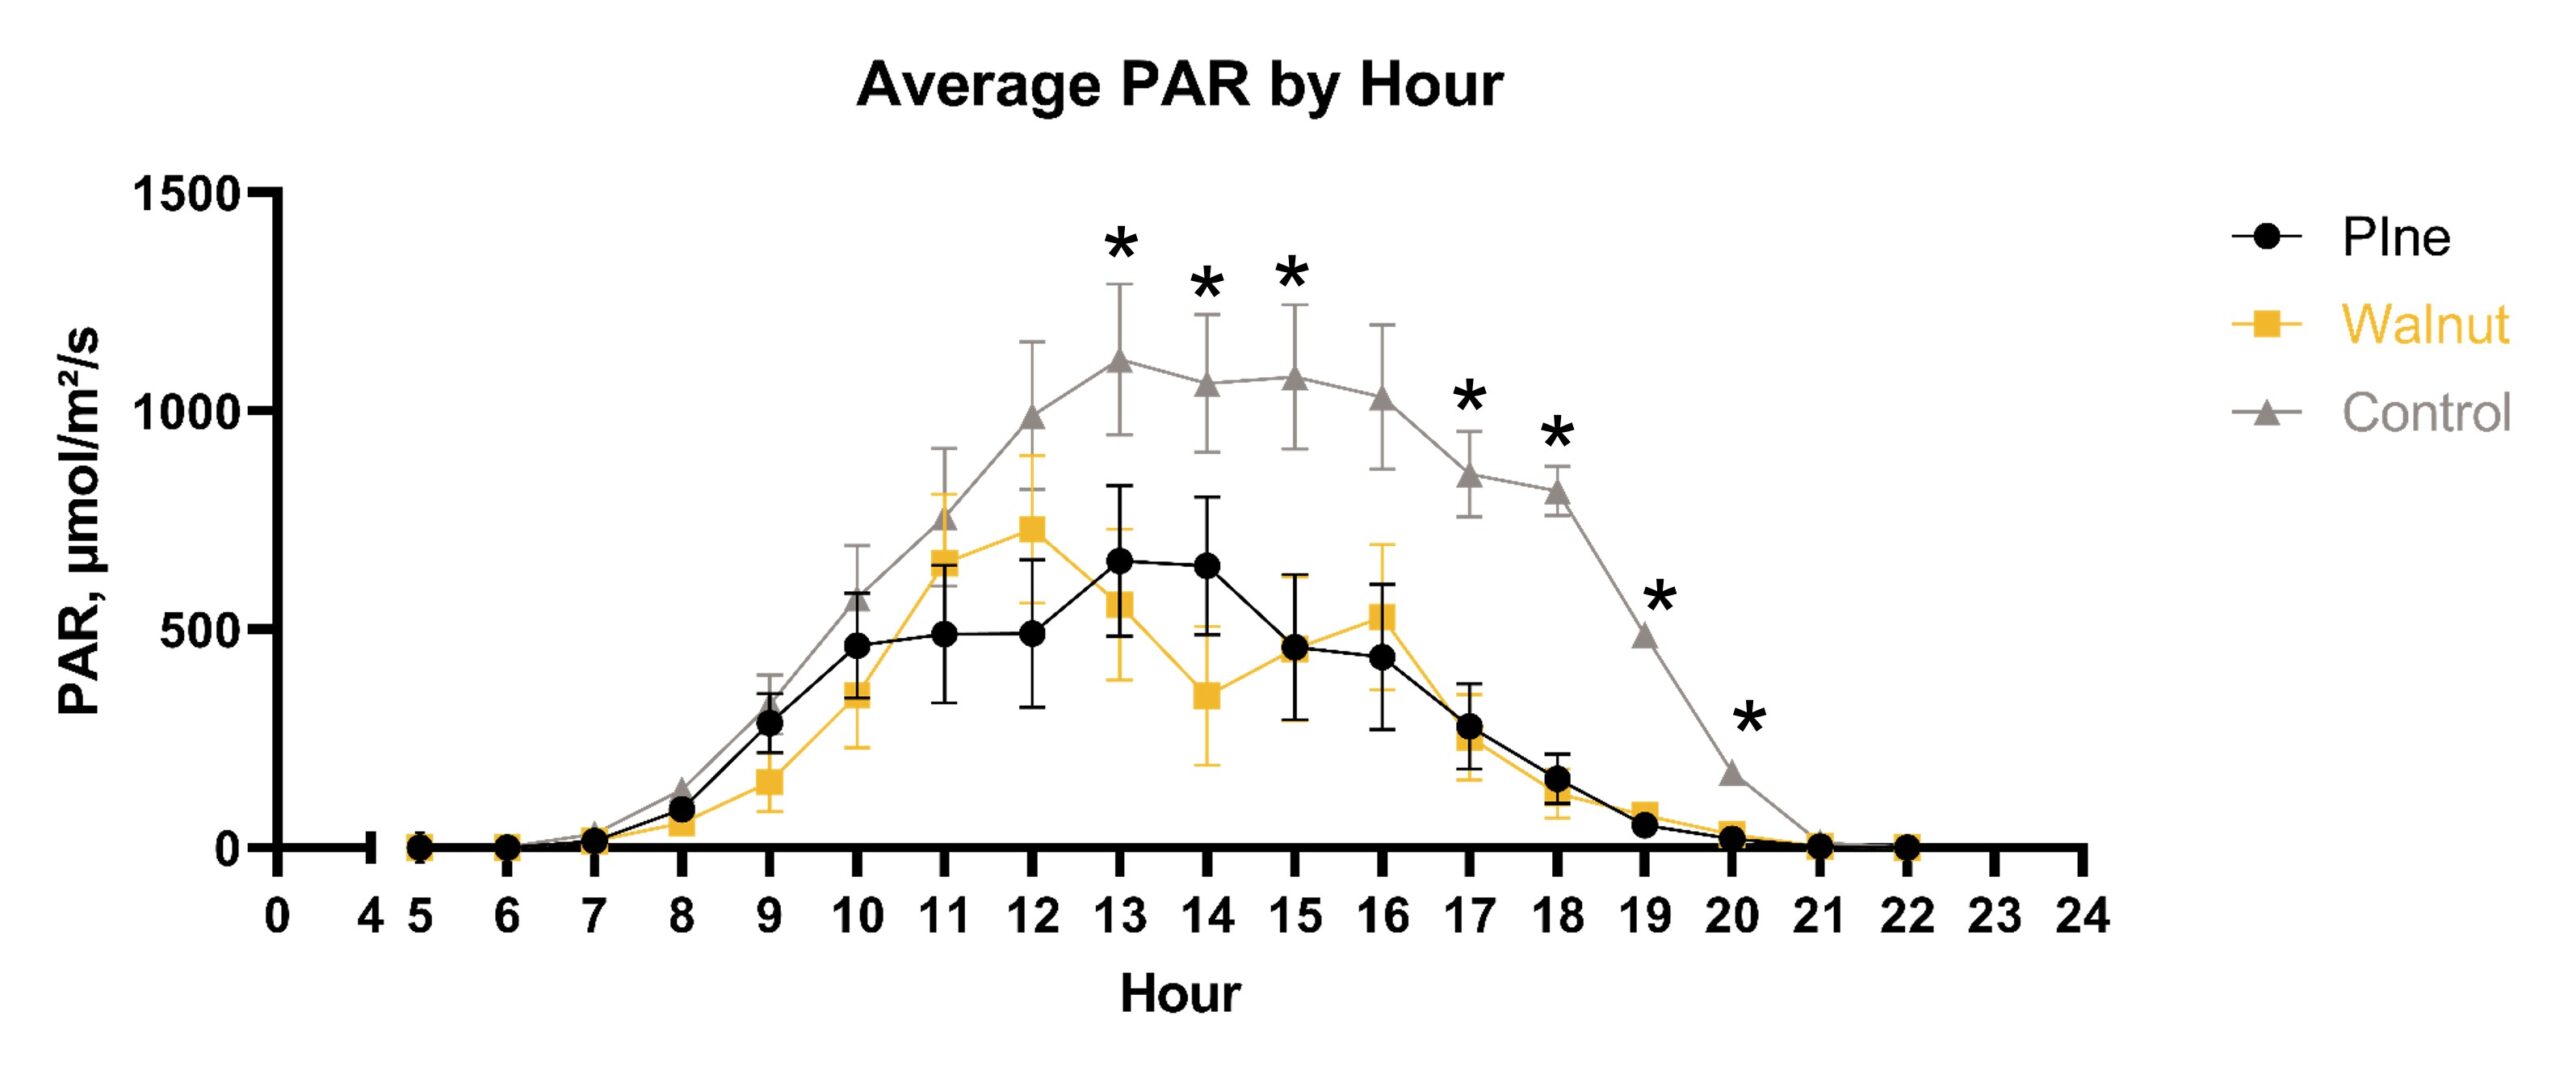
Figure 2 shows the 24-hour average ambient temperature for each treatment. An asterisk designates an hour in which there were significant statistical differences amongst treatments. Average ambient temperature was significantly greater in the Black Walnut silvopasture treatment during hours 5-7, 11-12, 19, and 21-22 compared to the other two treatments. There were no other statistical differences amongst treatments.
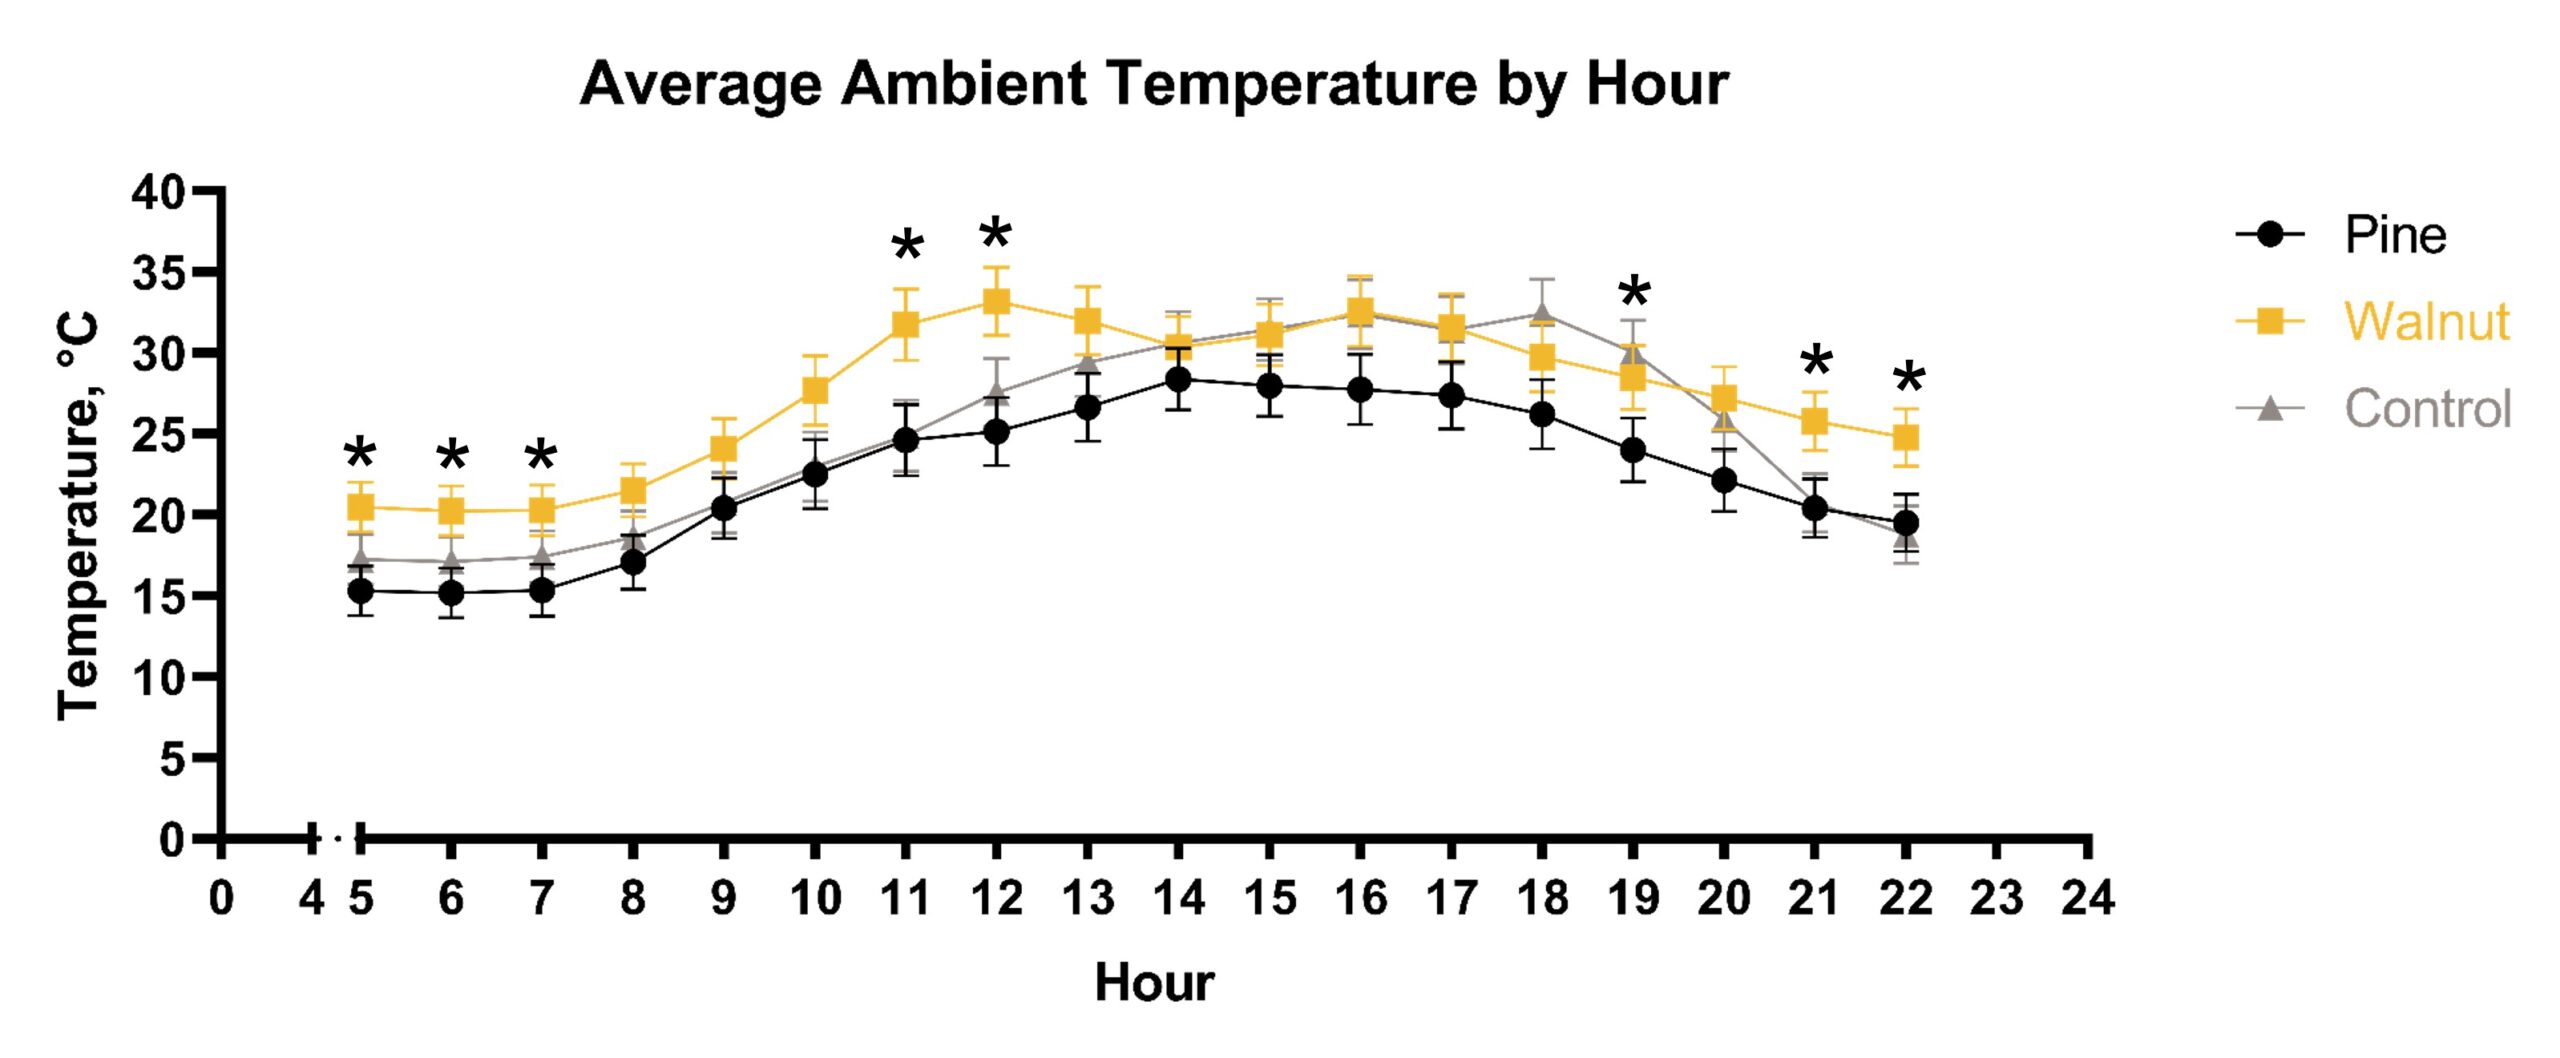
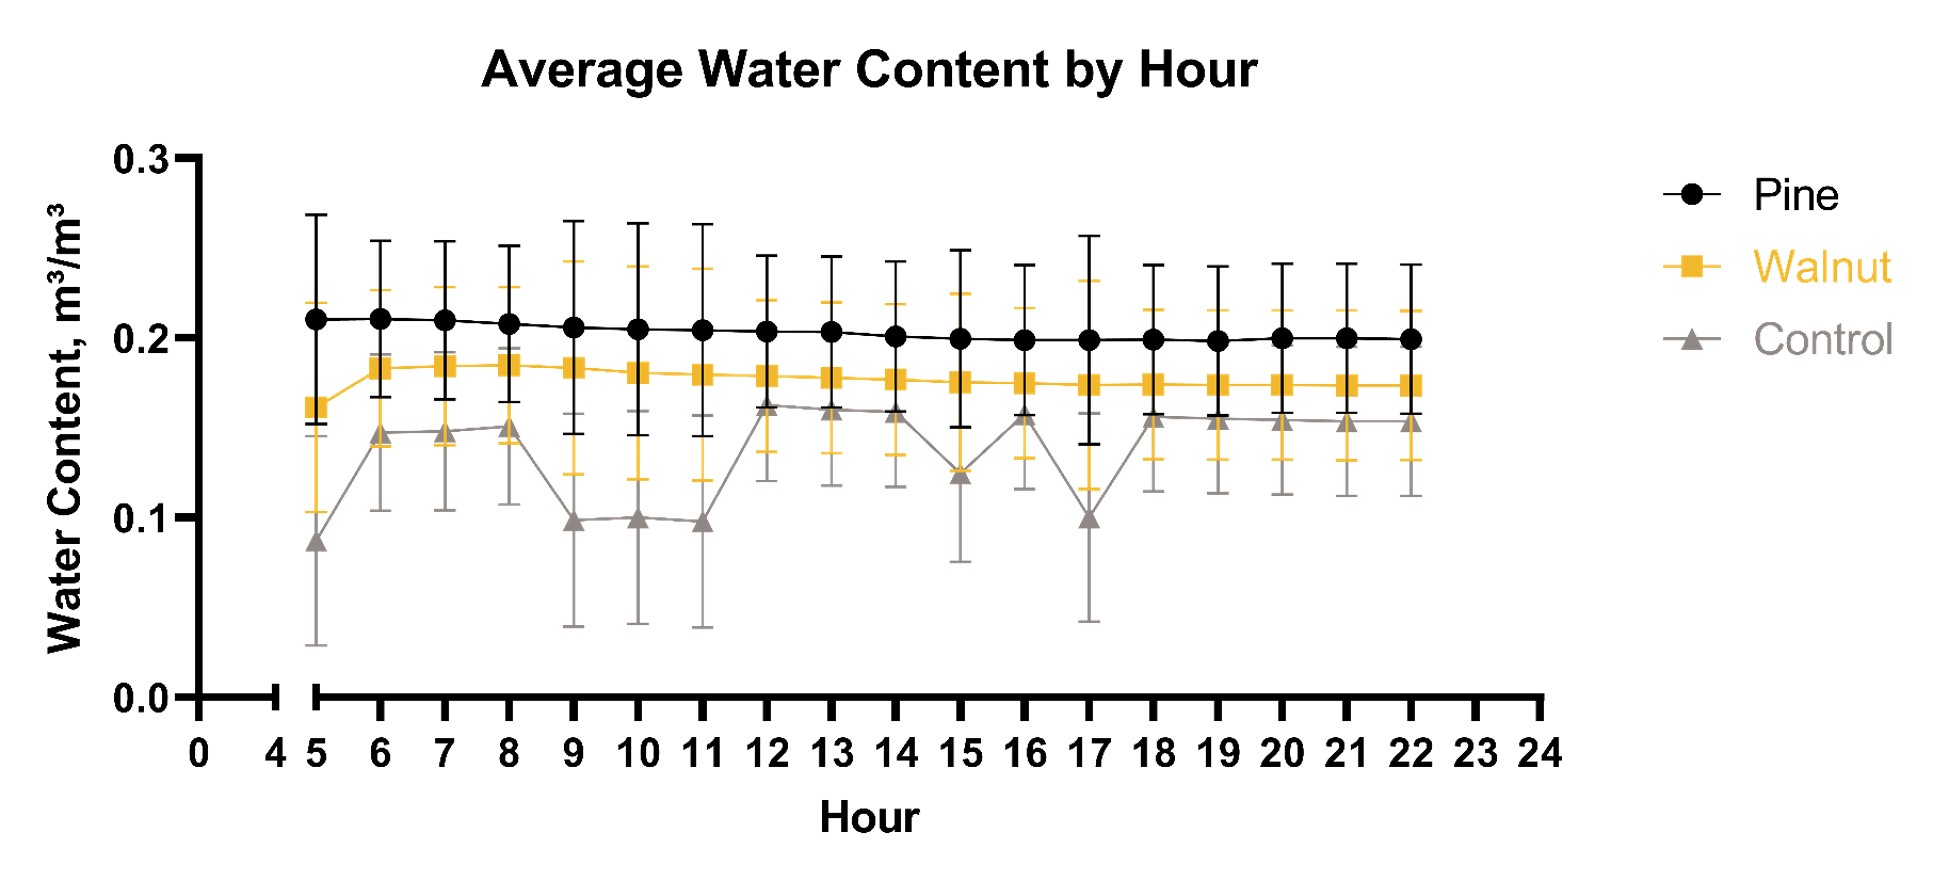
Figure 3 shows the average 24-hour soil moisture for each treatment. Pitch X Loblolly Pine silvopasture had the greatest water content, followed by Black Walnut silvopasture and lastly the open pasture control. The water content in both silvopasture treatments stayed fairly consistent throughout a 24-hour period while water content in the open pasture control had some fluctuations throughout the day. Even though there were numerical differences in water content amongst the three treatments, none of these differences were considered to be statistically significant.
Stand Count Data Results
Stand counts from the Year 1 planting were grouped into three plant functional groups: cool season grasses, warm season grasses, and forbs and legumes. The following figures show the average stand count for each of these plant functional groups by treatment for each growing season from 2019 to 2021
Figure 4 shows the average stand counts for the cool season grasses plant functional group. Both the Pitch X Loblolly Pine and Black Walnut silvopasture treatments had significantly greater cool season grass stand counts compared to the open pasture control in Fall 2019. An asterisk designates statistically significant differences between treatments. There were significant differences between all three treatments during the 2020 growing season, with Pitch X Loblolly Pine silvopasture having the greatest number of plants per hectare, followed by Black Walnut silvopasture, with the open pasture control having the least number of plants per hectare. By the 2021 growing season, there were no significant differences in plants per hectare between the three treatments. Plants per hectare decreased over time for both silvopasture treatments, while plants per hectare in the open pasture control increased each growing season after the initial emergence in Fall 2019.

Figure 5 shows the average stand counts for the warm season grasses plant functional group. There were no warm season grass measurements for all three treatments in Fall 2019 because these plant species were seeded after first frost in December 2019. No warm season grasses were present in all three treatments for the 2020 growing season. There were no statistically significant differences in plants per hectare amongst the treatments the 2021 growing season.
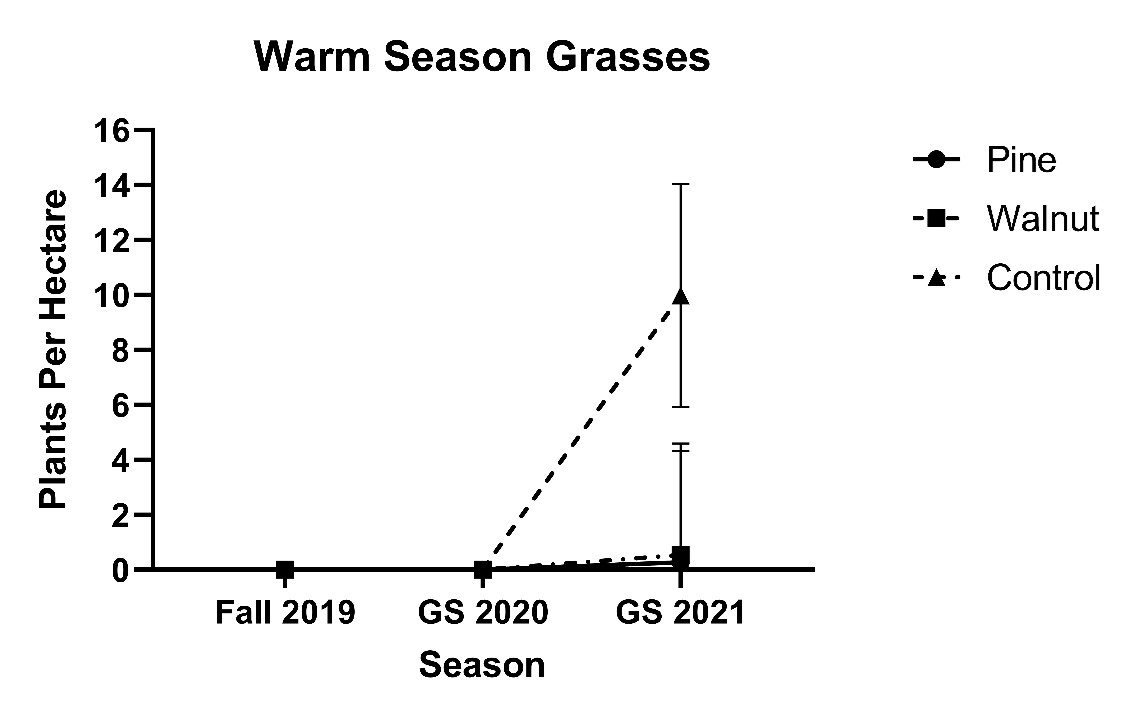
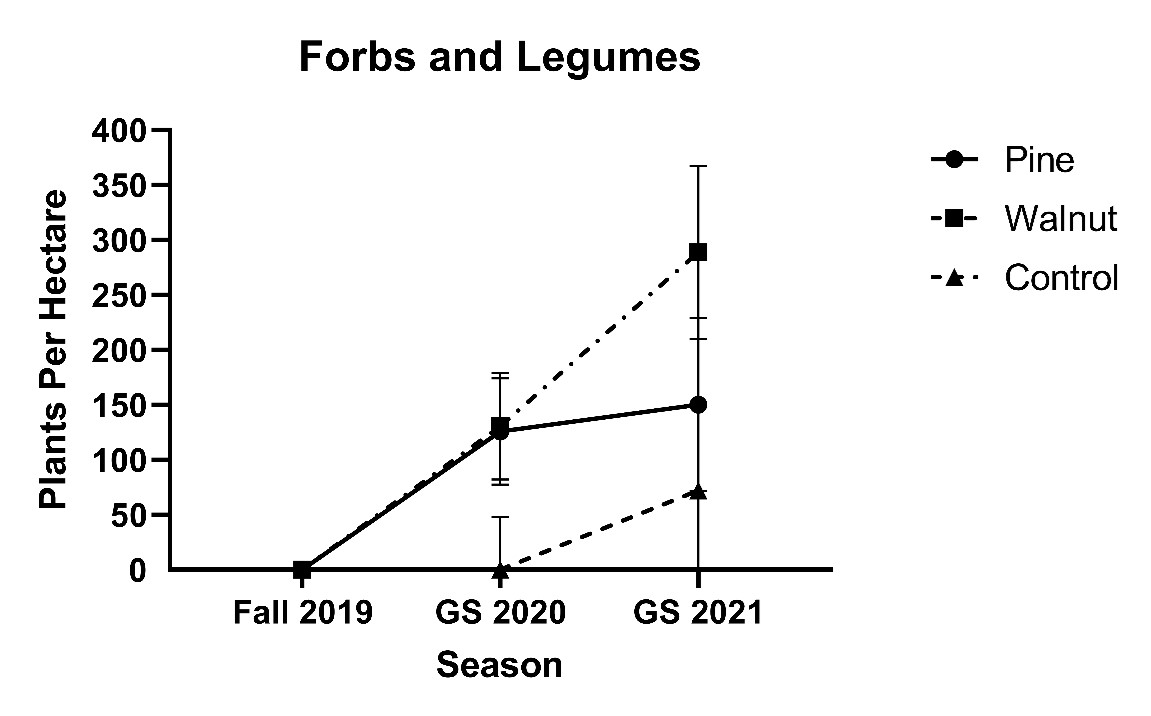
Figure 6 shows the average stand counts for the forbs and legumes plant functional group. There were no forb and legume measurements for all treatments in Fall 2019 because these plant species were seeded after first frost in December 2019. There were no statistically significant differences amongst all three treatments for both the 2020 and 2021 growing seasons. Plants per hectare increased for all three treatments from 2020 to the 2021 growing season.
Discussion
Our results show that all plant functional groups have the potential to establish in each treatment, although the rate at which these plant functional groups establish may be impacted by environmental factors.
Educational & Outreach Activities
Participation summary:
University restrictions due to Covid-19 prevented the occurrence of the intended education and outreach activities. For a majority of the project, the number of personnel allowed at the research centers was limited to one person per project during a scheduled time; this prohibited media personnel from being able to film project progression for the university social media pages. Additionally, all in-person field days and other educational activities were cancelled and moved to a virtual platform with limited audience interaction.
Towards the end of the Year 2 growing season, we were able to have a member of the research center staff film two informational videos about the project. These videos were uploaded to the Mizzou Agroforestry YouTube channel (860 current subscribers) and posted to the MU Horticulture and Agroforestry Research Center Facebook page (719 current followers). Combined, the two videos currently have 566 views and 12 likes on YouTube as well as 21 shares on Facebook from both individuals and regenerative agriculture focused group pages. Additionally, we were able to present the analyzed data from Year 1 at the ASA-CSSA-SSSA International Annual Meeting in Salt Lake City, Utah in November 2021 as part of the Robert F. Barnes graduate student poster competition in the Forage and Grazing Lands division of the Crop Science Society of America (CSSA). After the completion of the Year 2 data analysis, it is our goal to publish the results of this project in an agroforestry-focused scientific journal.
Project Outcomes
The COVID-19 pandemic has presented many challenges in our efforts to achieve our initial learning and action outcomes. Two of our four outcomes had a partial focus on pollinators and introducing farmers and ranchers to the benefits of attracting pollinators to their livestock systems; this was the primary reason for the inclusion of several forb plant species in our seed mix. Restrictions on personnel allowed at the researcher centers for much of the project prevented the collaboration with the entomology department necessary to meet these goals. Since connections were made prior to the pandemic restrictions, there is potential for a future research project focused on the pollinator plant species specifically.
While we were not able to host in-person workshops and field days, we were able to disperse information about the research project to farmers, ranchers, and other stakeholders through the use of social media. The two part video series about the project has over 560 views at the time of this report, and although we were not able to survey producers as initially planned, we were fortunate to have the opportunity for healthy discussion about the project, silvopasture, and agroforestry in the comment sections of multiple platforms.
Establishing a silvopasture system or converting an existing livestock system to a more sustainable one, especially when utilizing native plant species as the forage component can be costly. The stand count and environmental data we collected during this research project allows us to present the establishment success of native plant species in four different plant functional groups to farmers and ranchers. While not every farmer and rancher will have the same tree species used in our silvopasture treatments, the data we collected can serve as a baseline to help farmers choose native plant species best suited to their personal systems, thus avoiding expensive mistakes by choosing the wrong plant species.
not completed.