Final report for GNC20-295
Project Information
Kura clover can be integrated into current forage and row-cropping systems as a perennial cover crop, also known as a living mulch. Kura clover living mulch (KCLM) systems are an effective soil and water conservation tool and can increase the flexibility of Midwestern farming systems; as a perennial, it can be used to produce high protein forage one year, and the next year as a living mulch for annual row-crop production. While there are numerous environmental and practical benefits associated with continuous living cover, there are still agronomic and economic challenges in establishing and managing a KCLM system that limits adoption by producers who could otherwise benefit from this innovative conservation cropping system.
The main barriers to producer adoption of KCLM systems are 1) the long establishment period to develop a vigorous stand, 2) working width, horsepower requirements, and availability of equipment to effectively manage the living mulch system, and 3) the limited understanding of nitrogen (N) cycling in these systems, how it is affected by management practices, and how that translates to in-season fertilizer N recommendations.
Addressing these limitations is necessary to mitigate the risks taken on by early adopters and to promote its use in Midwestern commodity production systems. To address the lengthy establishment period, we will test the proposition that seeding kura clover into a mature alfalfa stand will both bolster forage yields and reduce establishment costs by allowing for forage harvest during the transition from a pure alfalfa stand to a pure kura stand. To reduce management barriers after the clover is well established, we will test the effectiveness of newly available cover crop residue management tools and strip tillage implements for maize production in KCLM. To strengthen fertilizer N management recommendations for maize production in KCLM, we will investigate biomass decomposition and nitrogen cycling affected by residue incorporation and fertilizer N application.
These projects fall under the title Removing the Barriers to Adoption of Kura Clover Living Mulch Systems. This work will be included in my dissertation, academic publications, extension articles, and monthly blog posts on the online AgTalk message board. This project will produce important management information for innovative stewards, producers, and conservationists and reduce the risks taken on by early adopters. The outreach efforts included in this research will introduce this system to the Midwestern landscape and this research will provide relevant information for farmers to make educated management decisions.
Learning outcomes
Through this research and dissemination of its results through scientific publications, popular literature, field days, farm shows, and agricultural forums, producers will gain practical management information required to manage KCLM systems for maize and forage production. This research will improve the awareness of KCLM systems as a potential option for conservation management in the Midwest. We hope that this research will shift the attitudes regarding KCLM systems from a niche conservation tool to a practical agronomic solution. In doing so, this system has the potential to benefit a wide audience of producers, and with its adoption, provide valuable environmental benefits.
Action outcomes
With the removal of the barriers to adoption of KCLM systems, producers will more easily and more confidently shift their management to this system or other holistic conservation management strategies. Even if a small number of producers are willing to make this dramatic shift, other farms in their neighborhood will observe these practices in action and be more likely to consider them for their operations. Reflection on the concepts and approaches that this research investigates and utilizes will result in greater adoption of KCLM and other conservation management strategies for Midwestern row-crop production systems.
Cooperators
Research
There were three field studies conducted as part of this research project. The first involved overseeding kura clover into an existing alfalfa stand as a means of increasing forage productivity during the establishment years while transitioning to a pure clover stand that could be used as a living mulch.
To test this method of establishment, inoculated kura clover was seeded in April 2020 and 2021 and in August 2020 at 10 lb live seed acre-1 into an existing alfalfa stand that was established in 2018 at the Rosemount Research and Outreach Center in Rosemount, MN. Forage samples were collected before each hay cutting (4 cuttings yr-1) and samples were processed to determine alfalfa stand count and the relative proportions of alfalfa, weeds, and kura clover biomass.
The second experiment of this project was designed to determine the interactions between row establishment and fertilizer N requirements for maize production in a kura clover living mulch (KCLM).
Field experiments were conducted during the 2021 growing season at the University of Wisconsin - Arlington Research Station in Arlington, WI, and the University of Minnesota - Rosemount Research and Outreach Center in Rosemount, MN. Soils at the Arlington site were a Saybrook silt loam (Fine-silty, mixed, superactive, mesic Oxyaquic Argiudolls), and soils at the Rosemount site were a Waukegan silt loam (Fine-silty over sandy or sandy-skeletal, mixed, superactive, mesic Typic Hapludolls). Kura clover stands were more than 3 years old at each site and the clover was managed as a living mulch for maize production in the previous growing season. While each site was managed under the same cropping system in the previous year, the specific management of the plot area differed, where the Rosemount site received shank strip tillage, broadcast glyphosate application at 2.2 kg ha-1 and no fertilizer N, and the Arlington site received broadcast glyphosate at 4.5 kg ha-1, broadcast glufosinate at 2.5 kg ha-1, and broadcast urea at 240 kg N ha-1.
The experiment investigated two factors, row establishment method and fertilizer N rate, and their effects on maize yield and nitrogen use efficiency. At both sites, individual plots measured 3 by 12 m and were laid out in a split-plot design with four replications, with row establishment as the main plot and fertilizer N rate as the split-plot treatments. Row establishment treatments included rotary zone tillage (RZT), shank strip-tillage (ST), and banded herbicides (BH), and were chosen based on previous work and their practicality for farmers managing a KCLM (Affeldt et al., 2004; Alexander et al., 2019a). Within row establishment treatments, fertilizer N was applied at 0, 45, 90, 135, 180, and 225 kg N ha-1 as SuperU, urea fertilizer with nitrification and urease inhibitors, banded in the center of the row with an EarthWay garden seeder at a 5 cm depth in the RZT and ST treatments and on the surface in the BH treatment (Koch Agronomic Services, Wichita, KS, USA; EarthWay, Bristol, IN, USA). Row establishment and fertilizer treatments were applied on 7 May at the Arlington site and 11 May at the Rosemount site. Dekalb 47-54RIB was seeded on 76 cm rows at 89,000 seeds ha-1 on 8 May and 13 May at the Arlington and Rosemount sites, respectively. Glyphosate herbicide was broadcast at 1.4 kg ha-1 on each plot area on all treatments one week after planting to kill weeds in the row zone and to chemically suppress clover growth during the establishment period. Each site received 100 kg P ha-1, 114 kg K ha-1, and 39 kg S ha-1 as broadcast triple-superphosphate and sulfate of potash 10 d after planting.
Grain, cobs, and stover were harvested on Oct 7 and Oct 21 at the Arlington and Rosemount sites, respectively. Maize ears were picked and stover was cut from a 3 m long row in each plot. Maize stover was weighed and subsampled before the subsamples were chopped into 2-5 cm pieces, bagged, and weighed at the field moisture level. Maize ears and stover subsamples were dried at 60° C until reaching a constant mass. Grain was shelled from the cob and each product was weighed before being subsampled and pulverized. Dry stover subsamples were weighed to determine field moisture content that could be related to the whole sample mass before a subsample was collected and pulverized. Pulverized grain, cob, and stover subsamples were analyzed for N content with the Dumas dry combustion method in an elemental combustion analyzer (Elementar GmbH, Langenselbold, DE) (Bremner and Mulvaney, 1982). Yield and N content data were used to calculate total crop N uptake, N balance (NB = total crop N uptake - fertilizer N) and nitrogen use efficiency (NUE = total crop N uptake/fertilizer N), which have potential to indicate differences in in-season soil N contributions from the living mulch (Congreves et al., 2021).
Dependent variables were tested for normality and homogeneity of variance by visual inspection of QQ plots and residual vs fitted plots, respectively (Kutner et al., 2004). When data from both sites were tested, several of the dependent variables violated one or more assumptions of ANOVA, and data transformations were unable to satisfy the required conditions. Because of this, data were separated between sites, retested, and when needed, appropriate data transformations were made to satisfy assumptions of normality and homogeneity of variance. Data were then fit with linear mixed-effects models in the lme4 package (Bates et al., 2015) in R (R Core Team, 2020), where row-establishment method and fertilizer N rate were fixed effects, and the main plot nested within block was the distribution of random error (Langhans et al., 2005). Models were tested for and met the assumption of homogeneity of variance by visual inspection of residual vs fitted plots (Kutner et al., 2004). Mixed models were then tested with the type III F test with Kenward-Roger estimated denominator degrees of freedom using the car package in R. When P ≤ 0.05, treatment means were separated using the emmeans (Lenth et al., 2018) and multcomp (Fox and Weisberg, 2019) packages in R, and results were presented using compact letter display (Piepho, 2018).
Weather data were collected from the UW Arlington Farm weather station of the National Weather Service and the US-Ro6 weather station of the AmeriFlux network, for the Arlington and Rosemount sites, respectively. Drought severity and coverage index (DSCI), which represents an integrated value of drought severity for a region ranging from 0 to 500, was collected from the US Drought Monitor for Columbia County, WI, and Dakota County, MN, for the Arlington and Rosemount sites, respectively.
Finally, research was conducted to track biomass turnover, N contributions from the living mulch, and N species pathways in a KCLM managed for maize production.
Site description and treatment application
An experiment was conducted during the 2020 growing season to investigate the effect of N fertilizer application rate on clover growth and decomposition, maize yield, N uptake efficiency, and nitrogen use efficiency (NUE) in a KCLM system for maize production. The site was located at the University of Minnesota’s Rosemount Research and Outreach Center (44°41'40"N 93°03'35"W) on a Waukegan silt loam (fine-silty over sandy or sandy-skeletal, mixed, superactive, mesic Typic Hapludolls).
Kura clover was seeded at the site in the spring of 2018 and the stand was managed as a forage crop during the 2018 and 2019 growing seasons. The site was prepared by mowing clover to a 50 mm height on 11 May 2020, which was one day before rows were established using a shank-type strip tillage tool (Orthman Manufacturing, Lexington, NE, USA). Fertilizer N rate treatments were applied as granulated urea fertilizer infused with nitrification and urease inhibitors (SuperU, Koch Agronomic Services, Wichita, KS, USA). The fertilizer was banded within the tilled strip at a 50-mm depth with a garden seeder (EarthWay, Bristol, IN, USA) immediately following strip tillage. On 13 May, the maize hybrid, Dekalb 47-54RIB, was seeded at 79,000 seeds ha-1 with a John Deere 7100 planter fitted with no-till coulters and heavy duty down pressure springs (John Deere Manufacturing, Moline, IA, USA). On 30 May, glyphosate was broadcast onto the plot area at 1.4 kg a.e. ha-1. Meteorologic data was obtained from the US-Ro2 weather station from the AmeriFlux network (Novick et al., 2018).
Sampling
Aboveground clover biomass was collected from one location in each block before and after the clover was mowed to quantify the surface biomass inputs from the mowing portion of spring management. Clover was sampled by manually cutting aboveground biomass from a 0.5 m2 quadrat that spanned one row width. Clover biomass samples were dried at 60° C until they reached a constant mass before they were weighed and adjusted to dry kg ha-1 basis. The average cut clover biomass was multiplied by the estimated N concentration (0.05 g N g-1) to determine the surface spring N input.
The proportion of cut clover biomass that was buried in the row zone due to tillage was determined with a bead tracer analysis (Allmaras et al., 1996). Four replications of 500 plastic beads were placed on the soil surface in the area that is intercepted by the strip tillage tool. The beads were tilled under the same conditions as the plot area, and after tillage, beads were recovered from the surface, 0 – 50, 50 – 100, and 100 – 150 mm depths, in 50 mm increments on each side of the tilled strip. No beads were recovered from the 100-150 mm depth, we therefore excluded decomposition data from litter bags placed at the 200 mm depth. Bead tracers were recovered, and the average proportion of buried beads was used to determine the relative amount of clover buried by strip tillage.
The sum of standing and cut clover biomass in the row zone was multiplied by the proportion of buried bead tracers to determine buried clover biomass inputs to the row zone. Cut clover biomass was multiplied by the proportion of bead tracers that were recovered on the surface to determine surface clover residue inputs in the row zone. Surface clover biomass inputs to the row zone and interrow zone were summed to represent total surface biomass inputs from spring management.
After treatment application, clover biomass was collected weekly to define the temporal distribution of clover biomass in the KCLM system. Standing clover biomass was estimated for each plot with polynomial regression of clover biomass by day of year (DOY), where the degree of the polynomial was determined by minimizing the AIC.
Litter decomposition
Clover biomass was collected from the site upon emergence from winter dormancy. The clover residue was dried at 60° C before it was homogenized and pulverized into ~2 mm diameter pieces. Litter bags were assembled using 60 x 120 mm sheets of 0.5 mm nylon mesh material folded in half on the long edge and sealed on two sides using a soldering iron (Lupwayi et al., 2007). The empty bags were weighed before ~5 g of dry clover biomass was added to the empty bags and the final edge was sealed. Bags were placed onto a reciprocal shaker for 2 h at 240 rpm to remove residue particles that passed through the 0.5 mm mesh. The prepared litter bags were weighed and the difference between the prepared and empty bag mass represents the initial clover mass.
On 13 May, soil was excavated adjacent to the row zone to 200 mm with a 70-mm i.d. auger in six locations per plot. A litter bag was placed at the 200-mm depth in each hole, half of the excavated soil was replaced and packed, and a second litter bag was placed at the 100-mm depth. The remaining excavated soil was replaced and packed before the final litter bag was placed on the surface adjacent to the excavated hole. One set of litter bags from the 0–, 100–, and 200–mm depths were collected 1, 2, 3, 4, 6, and 8 wk after installation.
The N concentration of the initial clover residue (g g-1) was characterized from the analysis of 12 subsamples that were analyzed for total C and N concentration (g g-1) using a combustion analyzer (vario MAX cube, Elementar, Langenselbold, DE) (Stevenson, 1996). Twelve additional subsamples were collected to determine the initial clover ash content. These samples were dried at 105 °C for 2 h before they were weighed, combusted in a muffle furnace at 900° C for 4 h, and the remaining material was weighed (Andrén et al., 1992; Mulvaney et al., 2010). The quotient of the final and initial mass of the combusted litter samples represents the initial clover ash content (g g-1).
Recovered bags were dried at 60° C until they reached a constant mass before they were weighed, cut open, and the partially decayed clover residue was removed. Empty bags were weighed, and the mass was subtracted from the total bag mass to determine the remaining clover residue mass (plus infiltrated fine roots) after deployment. Fine roots that grew into buried litter bags were removed and their mass was subtracted from the remaining litter mass. Lastly, two subsamples of the remaining litter were collected, prepared, and analyzed for total C, N, and ash content with the same methods that were used to characterize the initial clover residue.
The root-free-litter mass (g) was multiplied by the litter N concentration and the proportion of ash free residue to determine the ash free clover N (g) at time t (Equation 1).
(1) Ash free clover Nt = [Totalt - Bagt - Rootst] * Nt * [1 - Asht]
, where Ash free clover, Total, Bag, and Roots represent mass (g), and N and Ash are concentrations (g g-1).
Remaining litter N (g g-1) was calculated as the proportion of ash free clover N at time t (g) and ash free clover N at t = 0 (g) (Equation 2).
(2) Remaining litter Nt = Ash free clover Nt/Ash free clover Nt = 0
The inverse of Remaining litter N [1 – Remaining litter N (g g-1)] was calculated to determine the cumulative N mineralization (g g-1) of the initial litter. Cumulative N mineralization was analyzed against the quadratic function of days (d) for buried and surface litter bags using linear regression. The resulting coefficients were extracted, and the derivative was solved to describe the daily mineralized N (g g-1) for each day after deposition (Equation 3).
(3) Daily mineralized Nd(t) = 2at + b
, where a and b are model coefficients for litter bags corresponding with surface or buried litter bags, d represents litter bag installation depth, and t = days after bag deployment (litter deposition).
Litter inputs and mineralization
Spring N inputs (kg N ha-1) were multiplied by daily mineralized N (kg kg-1 d-1) to determine spring N mineralization (kg N ha-1 d-1) for 56 d after spring management (Equation 4).
(4) Spring N mineralizationd (t) = Spring N inputsd * Daily mineralized Nd (t)
, where d = deposition depth (surface or incorporated), and t = days after deposition.
The temporal distribution of clover biomass was described using polynomial regression. The AIC determined that a 4x polynomial best described the present dataset. The derivative of the regression equation describes the daily rate of biomass accumulation or decline (kg ha-1). The inverse of this slope, when the derived slope is negative, is equivalent to the rate of litter input to the soil (kg ha-1). Finally, the rate of litter inputs (kg ha-1) was multiplied by the assumed clover biomass N concentration (kg N kg-1) (Equation 5).
(5) Shade N inputsi (x)= -0.05(di + x(2ci + x(3bi + 4ai x)));
if di +x(2ci + x(3bi + 4ai x)) < 0
, where x = DOY, i represents the individual plot, and a, b, c, and d, are model coefficients.
Shade N inputs (kg N ha-1) were multiplied by daily mineralized N from surface litter bags (kg kg-1 d-1) to determine shade N mineralization (kg N ha-1 d-1) for 56 d after deposition (Equation 6).
(6) Shade N mineralizationi (x, t) = Shade N inputsi (x) * Daily mineralized N(t)
, where x = DOY, t = days after deposition, and i represents an individual plot.
Finally, the sum of Shade N mineralization (x, t) was calculated to determine the total N mineralization (kg N ha-1) from in-season clover inputs (Equation 7).
(7) Total N mineralizationi = ∑Shade N mineralizationi (x, t)
Overseeding kura clover into the established alfalfa stand did not work as intended. The clover was out competed and soil and environmental conditions did not allow for clover germination. No kura clover was found in the processing of samples from this project and data collection ceased after the first cutting in 2021.
The interactions between row establishment method and fertilizer N rate offered several insights into the performance of KCLM systems under varying intensity of drought.
Growing conditions at the two sites were challenging during the 2021 growing season. The Arlington site received 64% of the 1991 – 2020 average rainfall between 20 Apr and 31 Oct resulting in moderate drought conditions for most of the growing season. Drought conditions were characterized using the Drought Severity and Coverage Index (DSCI) (National Drought Mitigation Center et al., 2021). Despite this, rainfall was relatively well distributed, and temperatures were near the 1991 – 2020 average, allowing maize plants to mature normally. The Rosemount site received very little (< 16 mm) rainfall in the 23 days before and 4 days after planting and entered a severe drought (DSCI > 200) on 27 July that ended on 24 August. Air temperatures were higher than the 1991 – 2020 average beginning in June until the end of the growing season. Underdeveloped maize plants nearly died in two of the four blocks at the Rosemount site.
At Arlington, row establishment treatments influenced grain yield, grain N, stover N, total N, NB, and NUE. Grain yield and Grain N were greatest in the RZT treatment and lowest in the BH treatment, while ST was not significantly different than RZT or BH treatments (p < 0.05). Stover N was greatest in the RZT treatment, lowest in the ST treatment, and the BH treatment was not significantly different than the RZT and ST treatments. Total N uptake, NB, and NUE was greater in the RZT treatment than the ST and BH treatments.
Grain N, Stover yield, Stover N, Total N, NB, and NUE were significantly affected by fertilizer N rate. Grain N was lowest in the unfertilized treatment and greatest in the 90 – 180 kg N ha-1 treatments. Stover yield was lowest in the unfertilized treatment and greatest in the 135 and 225 kg N ha-1 treatments. Total N was greater in the 90 – 225 kg N ha-1 treatments than the unfertilized treatment. N Balance and NUE were maximized in the low N rate treatments and followed a downward trend with increasing fertilizer N rates.
At Rosemount, row establishment treatments significantly affected Grain yield, Grain N, Total N uptake, and NUE. For each of these response variables, the BH treatment was significantly greater than the RZT treatment and the ST treatment was not significantly different than the BH or RZT treatments at the p < 0.05 level. Nitrogen Balance was also affected by the row establishment treatment, where the BH and ST treatments took up a larger fraction of the applied fertilizer N than the RZT treatment.
Stover yield, Stover N, Total N uptake, NB, and NUE were affected by fertilizer N rate treatments. Stover yield was greatest in the 135 and 180 kg N ha-1 treatments, lowest in the unfertilized plots, and the 45, 90, and 225 kg N ha-1 treatments were not significantly different than the highest and lowest yielding treatments. Stover N was greatest in the 135 - 225 kg N ha-1 treatments, lowest in the unfertilized treatment, and the 45 – 90 kg N ha-1 treatments were not different than the 0 and 180 kg N ha-1 treatments. Similarly, total N uptake was lowest in the unfertilized treatment, greatest in the 135 – 225 kg N ha-1 treatment, and the 45 – 90 kg N ha-1 treatments were not significantly different from high and low uptake treatments. Nitrogen Balance and NUE were maximized at the low N rate treatments and followed a negative trend with increasing fertilizer N application. The NB was positive in the 0 - 45 kg N ha-1 treatments and reached -149 at the highest N rate.
Results from these experiments highlight the risks of utilizing a KCLM system for maize production in rainfed cropland in the upper Midwest. While the Arlington site had acceptable grain yields at all fertilizer N rates despite moderate drought conditions during some periods of the growing season, the Rosemount site nearly experienced a total crop failure. Differences in crop performance between sites is almost certainly a result of crop moisture stress. While the Arlington and Rosemount sites received a similar amount of total rainfall, the distribution varied. Rainfall was relatively well distributed over the growing season at the Arlington site, but the Rosemount site received most of its precipitation in May and early September. Research into the distribution of irrigation has found that irrigation in July has a positive correlation with grain yield while irrigation distributed mostly in August or September is neutral or negatively correlated with grain yield, respectively (Payero et al., 2009). These findings are well aligned with the observed conditions during the 2021 growing season at Arlington and Rosemount, which despite a similar amount of total rainfall, resulted in drastically different crop performance.
Moisture stress may have also been influenced by soil quality and site history. While grain yields across all plots at Rosemount yielded 3.6 Mg ha-1, the plots that were less affected by drought yielded 5.3 Mg ha-1, which is not significantly different than conventionally managed plots adjacent to the study area, which yielded 5.2 (SD = 0.6) Mg ha-1 (unpublished data). Differences in crop development and maturity between blocks within the plot area were apparent early in the growing season, and without rainfall in early September, it is likely that the most severely affected plots would not have made grain. The highest and lowest yielding plots at the Rosemount site were spatially correlated and differences in crop performance are likely attributed to soil depth and texture, which are well known to exacerbate the effects of drought (Jia et al., 2013). Because of the variability in soil quality across the plot area, we cannot say whether the KCLM exasperated or helped the maize crop respond to drought conditions.
Differences in moisture stress between the two sites may have also been influenced by initial clover stand health. Kura clover growth is most vigorous from mid-April to late-May and typically accumulates ~2 Mg biomass ha-1 during that time. Ochsner et al. 2010, analyzed soil water content and estimated evapotranspiration and found that a KCLM system imposed a water deficit of 37 – 50 mm in May relative to monocrop maize (Ochsner et al., 2010). Living mulch management imposes prolonged stress on kura stands and depletes belowground clover biomass reserves (manuscript in preparation). While both sites were used as a living mulch in the previous year, the management of the sites may have favored increased relative clover health at the Rosemount site. Specifically, the Arlington site received broadcast glyphosate at 4.5 kg ha-1 and glufosinate at 2.5 kg ha-1 while the Rosemount site was managed with strip tillage and broadcast application of glyphosate at 2.2 kg ha-1. The additional broadcast herbicide application may have increased the suppression of clover in the interrow and reduced the spring vigor and water use of the clover stand at the Arlington site.
Row establishment treatments influenced maize performance at both sites. At Arlington, the RZT treatment outperformed the ST and BH treatments, and at Rosemount, the BH treatment outperformed the ST and RZT treatments. While this experiment did not collect in-season soil moisture, clover biomass, or crop development data, the literature suggests that these observed treatment differences could be attributed to moisture conservation, inter-species competition, and unique weather conditions during the study period. Conservation tillage management, including no-till, is known to increase soil moisture availability and reduce evapotranspiration during the early growing season (Blevins et al., 1983). This period was critical at the Rosemount site because of dry planting conditions, whereas Arlington received rain the day before tillage and planting. Because soil moisture at Arlington was not limiting as seedlings emerged, the more intensive mechanical suppression of clover from the RZT treatment likely sped the emergence and development of maize at this site (Dobbratz et al., 2019). The Arlington site entered a moderate drought on 8 June that lasted until 20 July, and the better developed and more deeply rooted plants may have been able to better withstand the moderate moisture stress during that period. The Rosemount site did not receive significant rainfall in the 23 days preceding and 7 days after planting. The low moisture in the seed zone of the RZT treatment likely slowed maize emergence and development relative to ST and undisturbed BH treatments due to the water conservation of less intensive tillage. The Rosemount site entered a moderate drought on 8 June and a severe drought on 27 July that lasted until 24 August. Crops that were not well established before this time nearly died.
Fertilizer N rate treatments did not affect maize performance at either site. KCLM systems have been found to reduce fertilizer N requirements for maize in previous research, however, because of the unique environmental conditions during the 2021 growing season, conclusions regarding the N management of KCLM-maize systems will not be made based on the observed data. Nitrogen efficiency metrics were unable to reveal differences in the N contributions from row-establishment treatments. This result is unsurprising, as grain yields at both sites were unresponsive to fertilizer N rate treatments. These metrics might be useful in future N rate research to determine estimates of in-season N contributions from the KCLM or other legume inter-cropping systems under N limited conditions.
Results from the experiment detailing biomass turnover and N cycling:
Litter mineralization
Cumulative litter mineralization was affected by the interaction between time after deposition and placement depth, where litter placed at 10 cm were mineralized more quickly than litter deposited at the surface. Cumulative litter mineralization followed a quadratic function over time after deposition, and the mineralized litter mass after 56 d was 0.73, and 0.95 g g-1, for surface and buried litter bags, respectively.
Clover biomass
Following mowing and before strip tillage, there were 946 and 369 kg ha-1 of standing and cut clover biomass, respectively. Surface biomass inputs to the interrow were 272 kg ha-1. The row zone contained 346 kg ha-1 of total clover biomass (cut and standing), of which, 31% was incorporated by strip tillage (109 kg ha-1). The remaining 69% of unincorporated cut clover biomass in the row zone were accounted as surface biomass additions.
Clover biomass and N mineralization
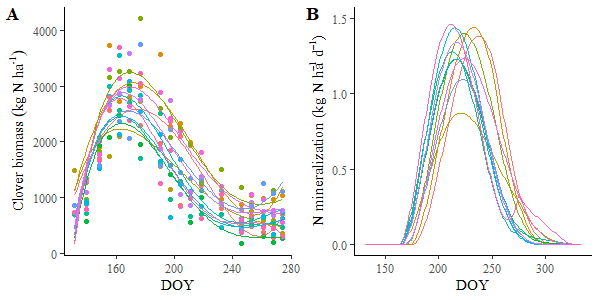
In-season clover biomass was affected by fixed effects DOY and fertilizer N treatment (Table 1). Mean clover biomass was greater in the unfertilized treatment than the 90 and 180 kg N ha-1 treatments. Clover biomass followed a quartic distribution over time during the 2020 growing season (Figure 3). According to the regression of clover biomass and DOY, biomass peaked on 14 Jun at 2685 kg ha-1 followed by a more gradual decline until late Aug (Figure 3a).
|
Fixed effects |
Seasonal clover biomass |
|
|
kg ha-1 |
|
Fertilizer N (kg N ha-1) |
|
|
0 |
2159 (105)a* |
|
90 |
1523 (105)b |
|
180 |
1526 (105)b |
|
Significance |
P > F |
|
DOY |
<0.0001 |
|
N |
<0.01 |
|
DOY:N |
0.40 |
Table 1: Treatment means and significance of clover biomass under fertilizer N rate treatments. *Means followed by the same letter are not significantly different at P < 0.05.
Nitrogen inputs from spring management were 17.0 kg N ha-1, which represents 77% of N contained in clover residue deposited on the surface and incorporated into the row zone. Nitrogen inputs from shade suppression followed a pattern that resembles a normal distribution over DOY that reached its maximum ~50 d after clover biomass peaked in early Jun (Figure 3a;b). Peak N contributions from in-season biomass inputs range from 0.8-1.5 kg N ha-1 d-1, and cumulative inputs range from 64 – 90 kg N ha-1.
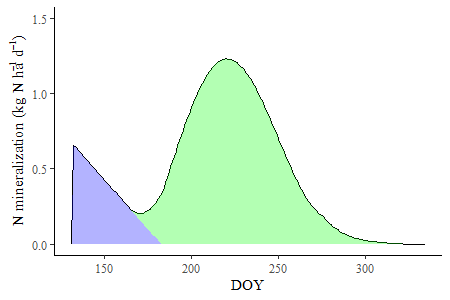
Clover biomass disturbed by spring management was mineralized at 0.66 kg N ha-1 d-1 immediately after treatment application (Figure 4). Nitrogen supplied by these biomass inputs declined until 30 Jun when residue was fully mineralized. Shortly thereafter, inputs from shade suppression increased until their peak of 1.23 kg N ha-1 d-1 on 7 Aug. At this point, clover continued to decline, but at a slower rate relative to earlier in the year and clover N mineralization was reduced to a low level by the end of Oct. Averaged over all plots, N supplied from clover biomass inputs were 95.9 kg N ha-1 over the measurement period.
Crop performance
Grain, stover, and crop N uptake were affected by fertilizer N rate treatments (Table 2). Grain yield was maximized at 180 kg N ha-1, while stover yield and plant N uptake was greater in the 90 and 180 kg N ha-1 treatments than the unfertilized control.
|
Fixed effects |
Grain yield |
Stover yield |
Plant N uptake |
NUEfert† |
NUEall‡ |
|
|
kg ha-1 |
kg N kg N-1 |
|||
|
Fertilizer N (kg N ha-1) |
|
|
|
|
|
|
0 |
6570c* |
4370b |
99.6b |
Inf⁋ |
1.03a |
|
90 |
10900b |
6910a |
156.1a |
1.73a |
0.85ab |
|
180 |
13190a |
7040a |
199.0a |
1.11b |
0.72b |
|
Significance |
P > F |
||||
|
N |
<0.001 |
<0.01 |
<0.01 |
0.02 |
0.03 |
Table 2: Treatment means and significance grain yield, stover yield, plant N uptake, NUEfert, and NUEall under fertilizer N rate treatments. *Means followed by the same letter are not significantly different at P < 0.05. † NUEfert is plant N uptake/fertilizer N. ‡NUEall is plant N uptake/(fertilizer + clover N inputs). ⁋ NUEfert is incalculable at the 0 N rate.
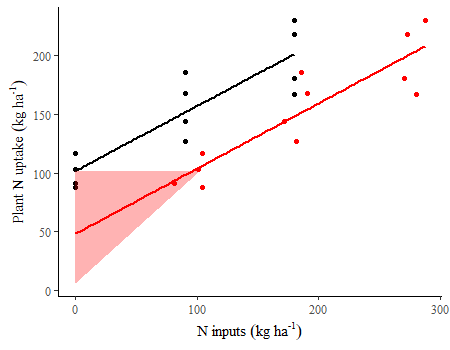
Plant N uptake was significantly affected by fertilizer N inputs (Figure 5). The regression of plant N uptake and fertilizer N revealed that 102 kg N ha-1 is supplied by non-fertilizer sources and 56% of fertilizer N inputs are taken up by the crop. When estimated clover N inputs from each plot was added to fertilizer N inputs in the regression, the intercept was reduced to 48 kg N ha-1, which represents N supplied from soil N. However, this assumes that the uptake efficiency of clover N inputs is equal to the uptake efficiency of fertilizer N. Because we do not have estimates for soil derived N, we cannot estimate N uptake from clover biomass N inputs. The possible range of clover derived N uptake is therefore 0-95.9 kg N ha-1, which corresponds with uptake efficiency of 0 and 100%, respectively.
Nitrogen use efficiency (N uptake/N inputs) was calculated with and without clover biomass N inputs. Nitrogen use efficiency is incalculable at the 0 N rate, but at the 90 and 180 kg N ha-1 treatments, NUE averaged 1.73 and 1.11 kg kg-1, respectively. When estimated clover N inputs were added to N rate, NUE at the 0, 90, and 180 kg kg-1 treatments averaged 1.03, 0.85, and 0.72 kg kg-1, respectively.
Discussion
Clover biomass followed a strong seasonal pattern, where biomass rapidly increased until its peak in early June followed by a gradual decline into late summer. This study identified a relationship between fertilizer N rate and seasonal clover biomass, in which the unfertilized treatment had greater mean clover biomass over the growing season. This finding is supported by the literature, where N deficient maize reduces the relative shade suppression and increases clover biomass in the mid and late growing season (Sanders et al., 2017). These dynamics between clover and maize align with our previous experience and highlight the importance of strong early-season maize development to reduce overall crop competition in the mixed cropping system (Dobbratz et al., 2019; Sawyer et al., 2010).
The low C:N clover residue exhibited simple and rapid decomposition dynamics. These estimates of residue decomposition are an important piece of the N cycle in these systems, where the rate of residue mineralization influences the timing and magnitude of soil N inputs. The cumulative decay estimates reported in this study are in excellent agreement with the literature and promote confidence in our results (Miura et al., 2008; Nakamoto and Tsukamoto, 2006). These studies also reported analysis and description of microbial communities under management systems with similarities to KCLM and provide opportunities for further research into soil biology within KCLM systems.
The timing and magnitude of clover biomass inputs is directly related to the timing and magnitude of N mineralization. Spring management adds clover biomass inputs through mechanical or chemical disturbance such as mowing, banded or broadcast herbicide application, and strip tillage (Jonathan R Alexander et al., 2019b). In the present study, these inputs made up 5.9-20.9% of total seasonal biomass N inputs from the living mulch. However, the magnitude of these N inputs rely on both the amount of clover biomass and the amount of clover disturbance at the time of spring management, which may be influenced by annual variability and the long-term intensity of KCLM management (Jonathan R Alexander et al., 2019a). Following maize canopy closure, clover biomass levels declined, and biomass deposits were again rapidly mineralized. Clover biomass peaked at 2685 kg ha-1 on 14 Jun while daily mineralized N peaked at 1.23 kg N ha-1 d-1 on 7 Aug when maize was at the R1 physiological growth stage. Future research should collect in-season maize N uptake data that could be used to relate clover N inputs and maize N demand.
Nitrogen uptake efficiency calculated with and without clover biomass N inputs had similar slopes. Extending the regression of maize N uptake and total N inputs to the intercept assumes that the uptake efficiency of clover N inputs is equal to the uptake efficiency of fertilizer N. The intercept of these lines represent uptake from different pools, where the intercept of N uptake and fertilizer N rate represents N sourced from both soil derived N and clover biomass N inputs (102 kg N ha-1), while the intercept of N uptake and total N inputs (clover + fertilizer) represents N sourced from soil derived N (48 kg N ha-1). The present dataset is not able to differentiate uptake from non-fertilizer N pools, however, we would expect similar efficiencies as the distribution of N mineralization of these organic N sources are more similar than the distribution of fertilizer N inputs.
Given the present representation of uptake efficiency of total N inputs, the estimated soil derived N is lower than expected. The existing literature reports a range of N uptake in unfertilized maize in Rosemount, MN, from 92 to 161 kg N ha-1 (Venterea et al., 2011). Liu et al. 2017 investigated the mineralization of soil organic matter (SOM) under organic and inorganic fertilizer sources. They found that organic inputs generally reduced the mineralization of native soil N. This can happen as microbial populations shift their primary source of energy and N from SOM to organic inputs . This concept is further supported by Nakamoto and Tsukamoto 2006, who found that white clover living mulch stimulated soil fungal decomposition pathways to efficiently process large perennial inputs of clover biomass. Regardless of whether these dynamics exist in the present study, future research in KCLM or other legume intercropping systems should quantify soil derived N in order to estimate the uptake efficiency of biomass N inputs.
Nitrogen use efficiency calculated with or without clover biomass N inputs further supports our estimates of clover derived N. Without accounting for clover N inputs, average NUE in 90 and 180 kg N ha-1 treatments was 173 and 111%, respectively, meaning that all treatments took up significantly more N than was applied as fertilizer. After adding clover N inputs to the denominator in the NUE calculation, we found NUE values of 103, 85, and 72%, in the 0, 90, and 180 kg N ha-1 treatments, respectively. If we assume that the uptake efficiency of clover N inputs equal the uptake efficiency of fertilizer N and that the uptake efficiency of soil derived N is 100%, we find that the crop took up 51-79% of all N inputs and that 24-138 kg N ha-1 was lost from the system. These values are well aligned with regional NUE estimates for maize in the Midwestern US (Zhang et al., 2021).
Conclusions
The process model was able to generate reasonable estimates for clover N inputs in the KCLM system. Including these estimates in N efficiency calculations allows for more robust comparison of legume living mulch systems to conventional management systems. Further research is required to quantify uptake efficiency of clover biomass inputs in order to better define fertilizer N requirements for maize in KCLM.
Educational & Outreach Activities
Participation summary:
In the last year, I presented my experimental results with farmers and agricultural professionals on the AgTalk message board. My research summaries were viewed hundreds of times and received several comments and questions. Roughly half of my outreach with farmers was conducted with these summaries on the AgTalk forum.
I also had the opportunity to present my preliminary results with the scientific community at the 2020 Soil Science Society of America conference. This conference was online-only, and so I do not have high confidence in my estimated attendance, however, these presentations are now archived and available online for anyone to view.
In February 2022, I presented my research at the 8th Annual Nitrogen: Minnesota's Grand Challenge and Compelling Opportunity Conference, which was attended by 130 producers and agricultural professionals. There was high interest in my project and I made connections with people in attendance who I've stayed in contact with for personal consultation.
In June 2022, I defended my dissertation, which included two chapters that focused on project partially funded by the SARE Graduate Student Grant. One of these chapters was published in Agrosystems, Geosciences, and Engineering, under the title, "Maize performance in a kura clover living mulch under drought conditions".
In November 2022, I presented work related to quantifying N inputs from kura clover living mulch at the Soil Science Society of America conference in Baltimore, MD. An estimated 50 agricultural and research professionals were in attendence.
Project Outcomes
This research has developed revised management recommendations for corn production in KCLM, identified management practices that do not work well for establishing new clover stands, and led to new hypotheses that will be tested in future funded work. The insights that were gained with this research will follow me into the next part of my career as a post-doc, where I will investigate agronomic, economic, and environmental aspects of managing a KCLM system for corn production. The support for this work is gaining in the agricultural community and the continued development of this cropping system has the potential to increase economic and environmental sustainability in the upper Midwest.
We each learned important information regarding kura clover living mulch systems for corn production, and with that, our general knowledge regarding conservation agriculture has grown. Our research was very direct and our findings were explained by our existing conceptual view of the cropping system. We feel more confident in our understanding and management of KCLM systems and are more comfortable answering questions about the cropping system and promoting its use to farmers and agricultural professionals.