Final report for GNC20-297
Project Information
Improving apple and peach pollination by advancing knowledge of how forest management affects wild bee functional diversity
Agricultural systems worldwide are dependent on bee pollination. With continued pollinator declines, it is imperative that we manage landscapes in ways that both conserve and promote pollinators. Land management operations rarely assess ecosystem services (i.e. pollination), and the diversity of pollinators is crucial to successfully pollinate crops. We assessed how forest management can improve apple pollination by increasing wild bee functional diversity at the landscape level. We used a forest-agriculture interface in southern Illinois to evaluate this relationship because these two ecosystems have the potential to increase a wide diversity of pollinators (specifically wild bees) due to their contrasting environments and floral resources. Our specific objectives were to: (1) Determine how forest management practices, through their influence on forest structural complexity, affect wild bee functional diversity on forest lands; (2) compare wild bee composition in apple orchards to managed forest lands; and (3) advance stakeholder knowledge (apple and peach farmers and forest landowners) about promoting wild bee pollination with management through workshops that engage local resource managers and local landowners.
To explore the relationship between forest management, wild bee functional diversity, and apple pollination, we collected wild bee specimens in both forest sites on public lands and on nearby apple farms. In order to measure vertical canopy heterogeneity, which can affect pollinator communities, we quantified forest structural complexity using a variety of metrics calculated from LiDAR point clouds. We then related these measures to wild bee diversity within forests. Throughout the project we worked alongside apple and peach farmers and employees at the Illinois Department of Natural Resources (IDNR) and the University of Illinois Forestry Extension.
We found that bee functional composition varied with forest management type, and that different bee functional traits aligned with different management strategies (including no management). Unmanaged habitat provides critical nesting resources to bees that otherwise might not exist within managed habitat. Given these findings, a diversity of management strategies is needed to support a functionally diverse bee community. We also determined which structural metrics derived from LiDAR point cloud data were most useful in predicting bee diversity and abundance within managed forests. Structural metrics in the understory, as well as overall vegetation density, were most predictive of spring bee diversity and abundance. Structural metrics in the midstory were most predictive of summer bee diversity and abundance. Midstory vegetation density had consistently negative relationships with summer bee diversity and abundance. Although we were only able to collect one year of data for the apple pollination portion of the project, we were able to determine that bee composition significantly varied between apple orchards and all forest management strategies. More research is needed to determine which forest management strategies increase pollination services to apple orchards.
Land managers at the IDNR will be using our data and findings when considering future management decisions. Reference collections are being provided to all public land sites used in the study (Giant City State Park, Trail of Tears State Forest, and Lake Murphysboro State Park). Displays showcasing bee specimens will be set up at select visitor centers within these sites so that employees and the public are aware of the diversity of wild bees in temperate deciduous forests and how management can affect their populations.
Learning and action outcomes targeted the following stakeholders: apple and peach farmers, landowners with forested lands on their property, and employees at the Department of Natural Resources, and The University of Illinois Forestry Extension. This project first elucidated how forest management affects wild bees, and that information was and will be shared with those implementing forest management plans on private and public property. In doing so, forest management practices that enhance bee diversity will be encouraged in southern Illinois. In the long-term, all stakeholders will understand the value of forest management in relation to pollinators and agriculture, learn about wild bees, and either be able to implement forest management strategies on their forest lands that are pollinator friendly or potentially increase pollination to their apple and peach orchards. Results provide a foundation for increasing forest management on public lands with co-benefits to surrounding agricultural lands.
Cooperators
Research
Sites:
Field work was conducted in southern Illinois in Jackson and Union Counties. In total we sampled 42 100m2 plots. There were 29 forest plots, distributed across three public land sites: Lake Murphsyboro State Park (LM; N=9), Trail of Tears State Forest (ToT; N=12), and Giant City State Park (GC; N=8). Plots were divided into three treatment types - thin-only, burn-only, and thin and burn (thin+burn). There were a total of four thin-only, seven burn-only, and nine thin+burn plots. In addition to these treatments, there were nine control plots (three at each site) (see Fig. 1). Management was carried out by the Illinois Department of Natural Resources starting in fall 2014 and ending in March 2020. Management was conducted similarly across all sites in order to restore diversity and xerophytic conditions, limit shade-tolerant tree species, and open the canopy. Alongside the forest plots, we sampled 13 apple orchard plots at three privately-owned apple orchards: Flamm Orchards (N=6), Rendleman Orchards (N=6), and Lipe Orchards (N=1). The plot at Lipe Orchards was later dropped due to site differences.
Sampling:
Sampling occurred in 2021 and 2022. Sampling did not occur in 2020 due to the pandemic. In 2021, data was collected in three separate sampling rounds: March/April - early spring (during apple blooms), May - late spring/early summer, and July/August - summer. In 2022, plots were sampled only twice per year during early spring and summer. May 2021 data were later dropped from analyses to maintain consistency. Each sampling round lasted approximately two weeks to reduce seasonal turnover in the bee community. In the early spring round (March / April), we sampled both apple orchard and forest plots. Only forest plots were sampled during summer. Sampling took place on sunny days with minimal wind when temperatures were at least above 15.6° C. Since temperature thresholds were different across seasons, this meant sampling occurred between 0900 and 1500 h. We collected wild bee specimens along with various plot-level environmental and abiotic variables.
Environmental/abiotic variables:
In addition to wild bees, we collected plant species data (forest and apple orchard plots), soil temperature and moisture measurements (forest plots only), canopy cover (forest plots only), DBH measurements (forest plots only), stem count measurements (forest plots only), and bee nesting resource data (forest plots only). We identified all blooming plants to the species level, and recorded the number of individual flowers on each plant. Blooms were counted if the flower was open and perceived as a potential nectar or pollen source for bees. Flowers in compound umbels (e.g., some species within Apiaceae) were counted in clusters rather than counting each individual flower. Canopy cover was measured with a concave spherical densiometer from the center of the plot at breast height. We measured soil temperature and moisture with a TDR probe (Lutron PMS-716). Measurements were taken at the center and each corner of the plot (NW, NE, SW, and SE).
We evaluated the availability and quality of nesting resources in forest plots by measuring the following variables in each plot in spring and summer of both sampling years: litter depth, total percentage of bare ground, slope, bulk density, aspect, and presence of pithy stems, deadwood with diameter > 2 cm, holes, shells, and cavities > 2 cm. To measure these variables, each plot was divided into four equal quadrants using perpendicular transects. A 1-m2 quadrat was then placed in the center of each quadrant, in addition to one at the center of the plot (N = 5 total quadrats). Within each quadrat, we measured the total percentage of bare ground and litter depth at the center, as well as the presence of aforementioned nesting resources. All values were averaged across quadrats. Slope was measured once by recording whether the slope of each quadrat was mostly flat (<30⁰), gentle (30⁰-60⁰), or steep (>60⁰). To measure soil bulk density, we collected 5.06-cm diameter soil cores (0–10 cm depth) at the center of the line separating each quadrant (four per plot). After oven-drying at 105° C for 48 h, we removed large debris (e.g., rocks and roots) and weighed each sample. Bulk density was calculated as the corrected dry weight divided by the volume of the core. Values were averaged across the four samples.
Characterizing forest structural complexity with Light Detection and Ranging (LiDAR):
To characterize vegetation structure and structural complexity, we used light detection and ranging (LiDAR) to develop multiple structural vegetation metrics. Structural metrics were chosen to assess the amount of vegetation density and variability of vegetation density (structural complexity) throughout the understory, midstory, and canopy, as well as the amount of canopy gaps. Structural vegetation metrics included canopy segmentation (i.e., canopy cover and canopy gaps), vegetation height, and mean vegetation density and vegetation density variability (coefficient of variation (CV)) across four separate strata of the forest profile. We downloaded LASer (LAS) files from the Illinois geospatial Data Clearinghouse (Illinois Height Modernization Program, 2023) for Jackson County, IL and Union County, IL. These datasets were developed in 2020 for Union County and 2021 for Jackson County. Due to limited collection of above ground LAS points for the southern area of Union County, which encompassed sites located at Trail of Tears State Forest (ToT), we used data collected in 2014 to assess vegetation structural metrics in that region. Management in Trail of Tears (ToT) occurred after 2014, but in Giant City (GC) and Lake Murphysboro (LM), management occurred before LiDAR data was collected in 2020 and 2021.
Wild bee sampling:
We collected wild bees using both active and passive sampling methods. We visited plots twice in one day. During the first visit, we distributed blue, yellow, and white pan traps (N=15) and arranged them in two, perpendicular lines. These traps were filled with soapy water, and left in a plot for two hours. Upon returning to a plot for the second visit, we drained the traps and stored any collected bee specimens in plastic bags. We then actively sampled for bees using nets and stopwatches. We divided the plot into four equal quadrats, and sampled each quadrat for 5 minutes (20 minutes total). During active sampling, we paused the stopwatch once a bee was netted. We then placed the bee into a cyanide tube and started the stopwatch once the net was free to collect another bee. Floral association for each bee was recorded upon collection. Once we concluded sampling for the day, bees were processed that night. Bees from pan traps were washed with 70% ethanol, dried with a blow dryer and tea strainer, and pinned and labeled. Netted bees were pinned and labeled directly. We then stored all specimens in boxes for later identification. Marissa Chase identified bees to the species level using Discover Life and appropriate genera keys and some specimens were sent to a local taxonomist, Michael Arduser, for identification and verification.
Wild bee traits:
We only used bee specimens collected from 2021 for this portion of the project (Objective 1). We identified 98.7% of the bees we collected to the species level. The remaining 1.3% of specimens were from difficult-to-identify genera (i.e. Lasioglossum and Nomada) and were assigned to morphospecies rather than species. We later removed these morphospecies from analyses because we could not definitively assign values for all traits. We chose eight common bee ecological and functional traits that are known to respond to forest management or have been studied as functional traits in the bee literature (body size, tongue length, flight phenology, scopa number, lecty, sociality, nesting strategy and parasitism). We chose these traits based off a meta-regression analysis we conducted in 2020 and 2021 to make up for the lost year of sampling (Chase et al. 2023 - Bee functional traits and their relationship to pollination services depend on many factors: A meta-regression analysis (Insect Conservation and Diversity). All species were assigned a trait value as described below.
We calculated body size by measuring the inter-tegular span (IT span) of all female specimens and averaged this value for each species. Using these IT spans, we calculated tongue length with pollimetry, an R package that estimates pollinator proboscis length and other covarying traits. We used Discover Life to calculate flight phenology, which is measured as the number of months a bee species is foraging. Finally, we determined the number of bee body segments which contain scopa (a set of branched hairs a bees uses to store pollen on its body; herein referred to as scopa number).
For lecty, sociality, nesting strategy and parasitism, we used the literature to gather trait information. For lecty, we defined bees as either polylectic (generalist) or oligolectic (specialist). We categorized sociality into solitary, subsocial or primitively eusocial. We divided nesting strategy into either ground excavating (herein referred to as ground nesting), cavity renting, cavity excavating or diverse nesting (bee species that utilize multiple nesting strategies). Lastly, parasitism was categorized as either cleptoparasitic or non-cleptoparasitic. For cleptoparasitic bees, we used their host trait information for lecty, sociality and nesting strategy. If species lacked data for trait values such as lecty, nesting strategy or sociality, we presumed trait information from the literature.
(1) Determine how forest management practices, through their influence on forest structural complexity, affect wild bee functional diversity on forest lands
How does forest management and related environmental variables affect the distribution of bee functional traits?
Results
Spring bee functional assemblages
We performed RLQ analysis to assess how bee trait assemblages respond to forest management and environmental variables. RLQ is an ordination technique that allowed us to visualize trait-management relationships across multiple dimensions. In the first dimension (RLQ axis 1), we found that unmanaged plots were most different from thin+burn plots. We found that burn-only plots were most similar to unmanaged plots, and thin+burn plots fell in between burn-only and thin-only plots (Figure 2; Table 1). Thin-only plots were positively correlated with the amount of litter, holes and the total number of floral resources (Table 1), opposite to unmanaged plots. Additionally, in the second dimension (RLQ axis 2), we found that burn-only plots were most different from unmanaged plots (Figure 3; Table 1). There was a positive correlation between burn-only plots and bulk density and slope (Table 1). In addition, unmanaged plots had significantly higher canopy cover and increased dead wood and holes (Table 1).
Body size, nesting strategy, parasitism, sociality, scopa number, tongue length and flight phenology were significantly associated with the first RLQ axis (Table 1). Larger bees with longer tongues were more prevalent in unmanaged plots, as well as cavity renting bees. (Table 1; Figure 2). The community of bees most associated with thin-only plots was smaller, non-cleptoparasitic, cavity-excavators, primitively eusocial bees, bees with more scopa locations and bees with longer activity periods (Table 1; Figure 2).
Table 1: Relationships between site scores and environmental variables and species scores and bee traits for RLQ axis 1 and 2 in spring. Correlation coefficients are based on Spearman rank correlations (ρ) for continuous variables and Kruskal-Wallis chi-squared statistics (χ2 ) for categorical variables. p < 0.1*; p < 0.05**; p < 0.01***
|
|
RLQ axis 1 |
|
RLQ axis 2 |
|
|
|
Environmental variables |
|
ρ/χ2 |
P-value |
ρ/χ2 |
P-value |
|
|
Treatment |
13.84 *** |
0.003 |
14.37*** |
0.002 |
|
|
Canopy cover |
0.108 |
0.585 |
0.358* |
0.062 |
|
|
Bulk density |
-0.259 |
0.181 |
-0.422** |
0.026 |
|
|
Soil temp |
0.175 |
0.373 |
-0.056 |
0.778 |
|
|
Soil moisture |
-0.134 |
0.467 |
0.135 |
0.494 |
|
|
Litter depth |
0.382** |
0.046 |
0.1052 |
0.594 |
|
|
Bare ground |
-0.264 |
0.174 |
0.237 |
0.224 |
|
|
Slope |
0.156 |
0.429 |
-0.479*** |
0.009 |
|
|
Wood |
-0.096 |
0.627 |
0.484*** |
0.009 |
|
|
Pithy stems |
-0.263 |
0.176 |
-0.05 |
0.802 |
|
|
Shells |
0.12 |
0.542 |
0.137 |
0.486 |
|
|
Holes |
0.319* |
0.098 |
0.348* |
0.069 |
|
|
Cav > 2cm |
0.289 |
0.137 |
0.274 |
0.158 |
|
|
Total bloom |
0.352* |
0.066 |
-0.23 |
0.238 |
|
Bee traits |
|
|
|
|
|
|
|
Body size |
-0.553*** |
0.004 |
0.407** |
0.04 |
|
|
Lecty |
0.593 |
0.441 |
5.33** |
0.021 |
|
|
Nesting strategy |
6.054** |
0.048 |
10.572*** |
0.005 |
|
|
Parasitism |
3.704* |
0.054 |
0.454 |
0.501 |
|
|
Sociality |
16.12*** |
0.0003 |
5.34* |
0.069 |
|
|
Scopa number |
0.498*** |
0.009 |
-0.242 |
0.233 |
|
|
Tongue length |
-0.795*** |
0.00003 |
-0.16 |
0.434 |
|
|
Flight phenology |
0.676*** |
0.001 |
-0.181 |
0.377 |


Summer bee functional assemblages
Unlike spring, we did not find that treatment significantly associated with RLQ axes and affected environmental variables (Table 2). Rather, RLQ axis 1 separated plots by nesting resources and floral resource availability. Plots on the negative side of the axis were characterized by increased bare ground and more wood and holes within sites, while on the positive side they were characterized by increased litter, pithy stems, total number of blooms and steeper slopes (Table 2; Figure 4).
In summer, environmental variables were associated with different bee functional traits. Nesting strategy, sociality and scopa number were significantly associated with RLQ axis 1. Ground nesting bees, primitively eusocial bees and bees with more scopa locations on their body were more abundant in plots with increased floral resource availability and steeper slopes (i.e. litter, pithy stems and total number of blooms) (Table 2; Figure 4). Plots with more nesting resources (bare ground, wood and holes) had more cavity nesting (excavators and renters) and diverse nesting bees and solitary bees (Table 2; Figure 4).
Table 2: Relationships between site scores and environmental variables and species scores and bee traits for RLQ axis 1 and 2 in summer. Correlation coefficients are based on Spearman rank correlations (ρ) for continuous variables and Kruskal-Wallis chi-squared statistics (χ2 ) categorical variables. p < 0.1*; p < 0.05**; p < 0.01***
|
|
RLQ axis 1 |
|
|
|
Environmental variables |
|
ρ/χ2 |
P-value |
|
|
Treatment |
3.143 |
0.37 |
|
|
Canopy cover |
0.194 |
0.471 |
|
|
Bulk density |
0.309 |
0.244 |
|
|
Soil temp |
0.408 |
0.117 |
|
|
Soil moisture |
0.238 |
0.373 |
|
|
Litter depth |
0.662*** |
0.006 |
|
|
Bare ground |
-0.56** |
0.025 |
|
|
Slope |
0.662*** |
0.005 |
|
|
Wood |
-0.046* |
0.074 |
|
|
Pithy stems |
0.521** |
0.038 |
|
|
Holes |
-0.581** |
0.018 |
|
|
Cav > 2cm |
0.045 |
0.868 |
|
|
Total bloom |
0.609** |
0.012 |
|
Bee traits |
|
|
|
|
|
Body size |
-0.448 |
0.147 |
|
|
Lecty |
- - - |
- - - |
|
|
Nesting strategy |
9.539** |
0.023 |
|
|
Parasitism |
0.525 |
0.469 |
|
|
Sociality |
2.91* |
0.088 |
|
|
Scopa number |
0.672** |
0.017 |
|
|
Tongue length |
-0.438 |
0.147 |
|
|
Flight phenology |
0.119 |
0.713 |
Discussion
Our findings demonstrate that specific bee functional traits align with different management strategies, including no management, and this relationship changes throughout the year. Both managed and unmanaged habitat provide vital nesting and floral resources that alter bee functional trait composition. Collectively, our results suggest that retaining both unmanaged and sustainably managed stands within a temperate forested landscape can promote a functionally diverse bee community and maintain crucial pollination services for the plant community.
In spring, bee traits aligned with specific management strategies depending on availability of resources. Thinned plots with increased floral resources supported small bees that are more dispersal limited. This is important as bee body size is linked to many behavioral and morphological traits that affect fitness and potentially pollination services, including but not limited to foraging flight distance, overwintering survival and offspring survival.
Thin-only management and unmanaged plots increased nesting resources for bees in spring. Snags and stumps that were not removed from thin-only plots may have provided additional nesting resources for cavity-excavators. Unmanaged plots specifically provided both deadwood and holes for bees. These results suggest that management practices that retain dead wood in the forest post-management (e.g., retention forestry) should be used to increase nesting resources for bees. This may also indicate that burning by itself or burning in combination with thinning may eliminate key nesting resources that bees rely on in forests.
Unmanaged plots also supported several of the most vulnerable bee groups (i.e., cleptoparasites and specialists). Both of these bee groups are more likely to face future declines and may be more sensitive to disturbance compared to other bee groups. Cleptoparasitic bees stabilize and regulate the bee community by preferentially targeting dominant bee species and are therefore imperative for maintaining a healthy bee community. Given this, it is imperative that areas of unmanaged forest habitat remain on the landscape intermixed with managed areas.
Overall, findings from this portion of the project emphasize the importance of using an array of forest management strategies to support a functionally diverse bee community.
How does structural complexity affect wild bee communities?
Results
Spring and summer bee diversity
Spring bee diversity was negatively related to overall vertical height variability (Fig. 5A), and positively related to the mean vegetation density between 0 - 2 m (Fig. 5B). Summer bee diversity was affected by different LiDAR-derived structural metrics. Summer bee diversity was negatively related to percent canopy gap (Fig. 6A), mean vegetation density between 2 - 5 m (Fig. 6B), and the variability of vegetation density between 0 - 2 m (Fig. 6C).
Spring and summer bee abundance
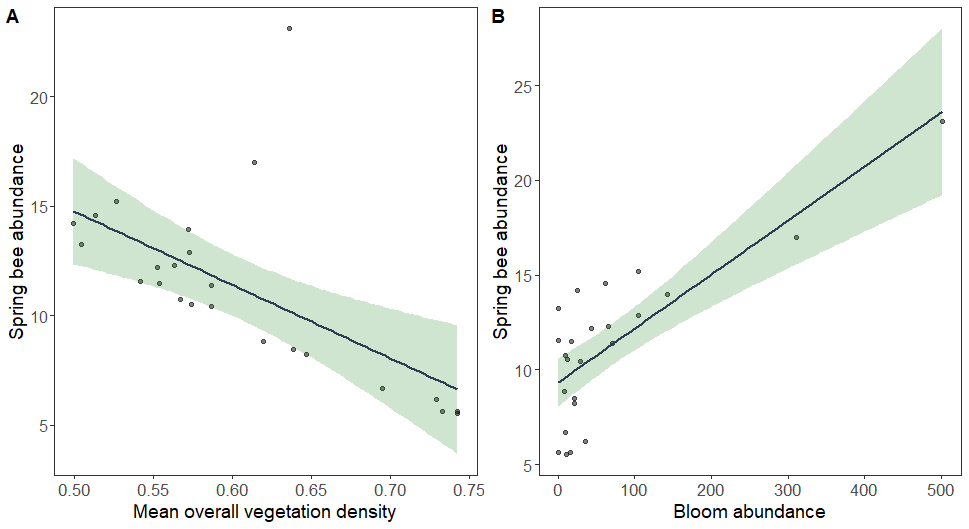
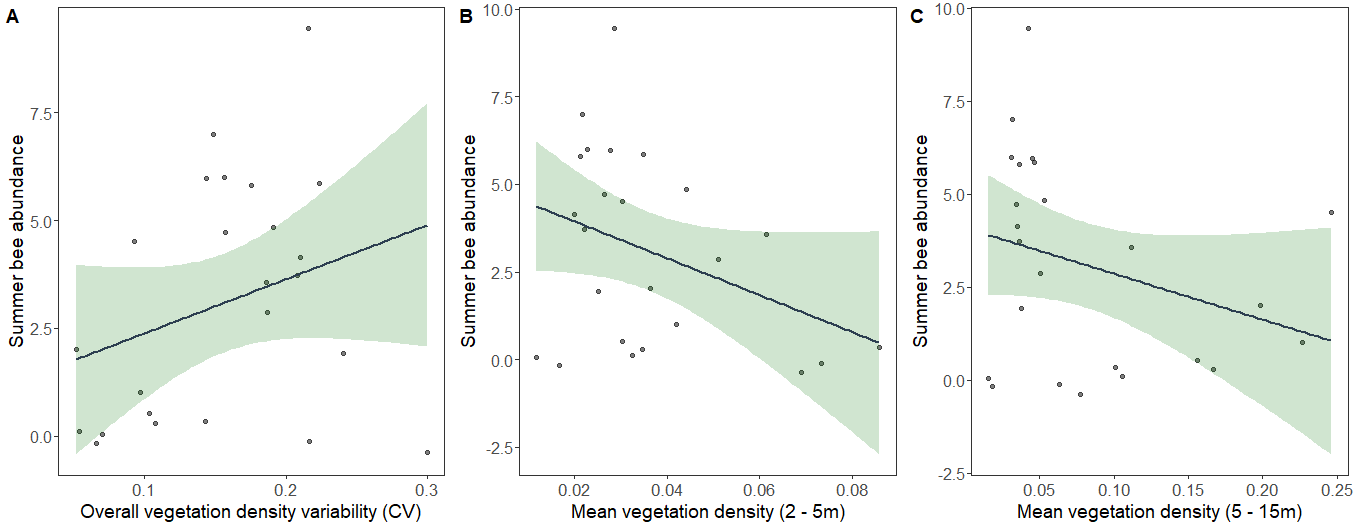
Spring bee abundance was negatively related to mean overall vegetation density (Fig. 7A) and positively related to bloom abundance (Fig. 7B). Again, summer bee abundance was affected by different LiDAR-derived structural metrics. Summer bee abundance was positively related to the variability of overall vegetation density (Fig. 8A), and negatively related to mean vegetation density between 2 -5 m (Fig. 8B) and mean vegetation density between 5 – 15 m (Fig. 8C).
Discussion
Many studies have found that understory vegetation density is an important predictor of forest bee communities. The majority have studied this in the context of increased floral resources provided by herbaceous plants on the forest floor. In temperate forests in spring, ephemeral wildflowers provide some of the earliest floral resources and support a taxonomically and functionally diverse bee community. My results support this, as bloom abundance outcompeted all LiDAR metrics in predicting spring bee abundance. However, increased vegetation density between 0 - 2 m also positively affected bee abundance and diversity in spring. This may reflect increased floral resources from woody shrubs and small flowering trees (e.g., serviceberry, dogwood, and American plum).
In summer, vegetation density between 2 - 5 m had a negative effect on bee diversity and abundance. This mirrors other work that has found that subcanopy openness and not just canopy openness is a strong predictor of bee community structure. This relationship is likely more apparent in summer once the canopy has leafed out. The effect was especially pronounced in mesophytic forest plots, where we observed an abundance of mid-story beech trees and dense shade. Densely shaded stands can lead to a reduction in floral resource availability, which can have negative effects on bee communities.
(2) Determine which wild bee functional groups are present in apple orchards; compare those wild bee functional groups to managed forest lands
Results and Discussion:
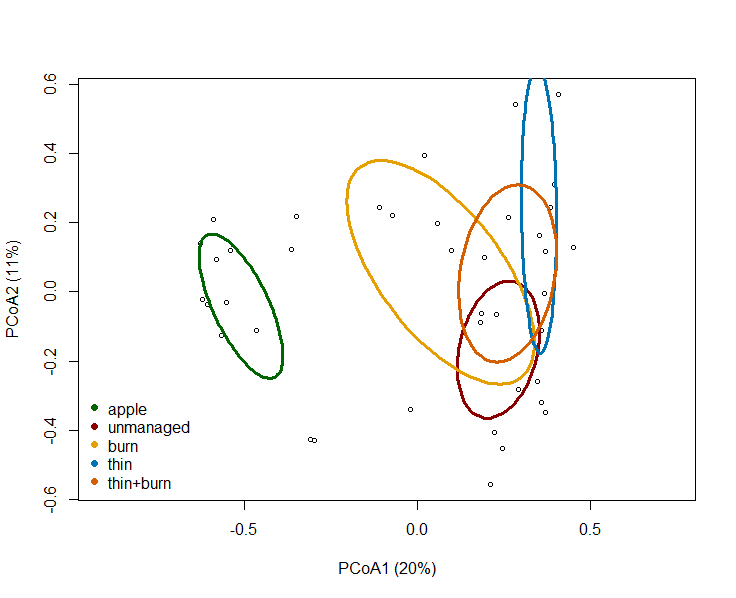
We found that bee species composition in apple orchards was significantly different from all forest management types with the first two PCoA aces explaining 31% of total variation (P = 0.001; R2 = 0.61; Fig. 9).
We sampled apple orchards in 2021 but were unable to gather data in 2022 due to poor weather conditions that hindered our ability to sample bees. During the apple flowering period in 2022, conditions were rainy and windy. On days with clear skies, temperatures were too low and there were very few bees seen foraging from apple flowers. As a result, we only have results from 2021 apple sampling to share. This limits our ability to provide recommendation to growers and relay information regarding wild bee functional composition between apple orchards and managed forest lands. As a result, we instead compared how bee species composition differed between apple orchards and forest management strategies. While there were significant differences in bee composition between apple orchards and forest management treatments, we were unable to detect if a specific management treatment had more similar bee composition to apple orchards over others. Given this, we cannot say which forest management strategy may be best for apple pollination. However, other papers have found that increased bee functional diversity can increase pollination services to apples. Given that we found different bee functional traits aligned with different forest management strategies, this may mean a diversity of management strategies surrounding apple orchards is best to increase pollination services. We hope to continue this work in the future.
Educational & Outreach Activities
Participation summary:
We have published three journal articles (DOIs attached below). We have another journal article that will be submitted to Landscape Ecology in the next month. In addition to these journal articles, we have written two reports for the Illinois Department of Natural Resources. We are in the process of writing a third. We are also designing a flyer for the University of Illinois Extension that showcases the common bee genera found in Illinois apple orchards. Finally, we are currently creating bee reference collections for each of the public land sites (Giant City State Park; Trail of Tears State Forest; Lake Murphsyboro State Park). We are also helping to create displays at the visitors centers at each site. The displays will include bee specimens and information about our research findings.
Chase, M. H., Fraterrigo, J. M., & Harmon-Threatt, A. (2023). Bee functional traits and their relationship to pollination services depend on many factors: A meta-regression analysis. Insect Conservation and Diversity, 16, 3, 313–323. https://doi.org/10.1111/icad.12635
Chase, M.H., Fraterrigo, J. M., Charles, B., Harmon-Threatt, A. (2023). Wild bee response to forest management varies seasonally and is mediated by resource availability. Forest Ecology and Management, 548, 121426. https://doi.org/10.1016/j.foreco.2023.121426.
, , , & (2023). Diverse forest management strategies support functionally and temporally distinct bee communities. Journal of Applied Ecology, 00, 1–14. https://doi.org/10.1111/1365-2664.14513
Project Outcomes
By managing forest lands in ways that provide co-benefits to bees, adjacent crop lands will benefit from increased pollination services. This is especially true in southern Illinois where many apple orchards are directly adjacent to private and public forest lands. Although we did not get to fully assess how forest management can impact pollination services to nearby apple orchards, our findings are still relevant to apple growers.
While talking with Jeff Flamm, the owner of Flamm Orchards, I learned that he had a lot of knowledge and awareness of wild bee pollination. He stopped importing honey bees into his orchards many years ago. As we discussed wild bee pollination, he talked about how his orchards were situated between many industrial corn fields and how there was a lot of Dicamba run-off entering his orchards. He showed me the specific damage Dicamba does to apple trees. I learned of the difficulties sustainable agriculture operations face when adjacent to industrial agriculture systems.