Final report for GNC21-321
Project Information
Kansas State University, Bayer Crop Science, USDA-NRCS, Guetterman Brothers Family Farms, and The Save Farm will form a team to provide integrated research, extension, and education efforts to farmers and future agriculture players on understanding of soil health and sustainable agricultural practices. Soil health has wide-ranging benefits and is of increasing interest to farmers and agricultural stakeholders. While no-till is widely adopted, the implementation of other conservational practices such as cover crops is still relatively low. One possible reason for the low adoption of soil health improving practices is the long-term returns and the lack of science- and data-driven based evaluations. This project builds upon the Kansas Soil Health Partnership and intends to extend for 2 years the on-farm soil health research conducted at Guetterman Brothers Family Farms (Bucyrus, KS) since 2018 for a total of 7 years. The goals of this project are to (1) evaluate the effect of winter cover crops on soil health and soybean and corn yields; (2) assess the effect of cover crops on soil health indicators (soil organic carbon, microbial community composition, and enzyme activity); (3) quantify the impact of soil health indicators on crop yield; and (4) determine the economic benefits of a long-term (after 7 years) on-farm cover crop adoption. We believe that the involvement of farmers via field days and educational approaches such as cover crop gardens will substantially impact the adoption of sustainable practices, increase soil organic carbon, soil biodiversity, water infiltration, and reduce soil erosion. Involvement of pre-college students via field days will impact the long-term adoption of sustainable practices, building a legacy for future generations. The long-term goal for this project is to sustainably increase the productivity of our current (and less diversified) agricultural systems by increasing soil health, removing yield-limiting factors, educating, advocating, and supporting the dissemination and use of cover crops. At the end of this project, farmers will: (1) improve and diversify their production systems through data-driven recommendations; (2) identify circumstances where adopting cover crops will not be only a viable option but will demonstrate improvements on soil health and sustainability of their farms; and (3) improve farmers economic well-being, quality of life, and professional inquiry of issues related to environmental stewardship and long-term sustainability. These outcomes represent critical steps toward agricultural systems sustainability and will lead to positive improvements in agricultural productivity and soil health.
Learning outcomes: (1) provide integrated Extension and Education efforts benefitting both farmers and students and their understanding of sustainable agricultural practices; (2) empower farmers with knowledge and applied skills for sustaining and improving soil health on their farms; (3) support networking and technical assistance to help farmers and their advisors make decisions that will result in positive changes for the profitability of their operation and soil sustainability. After this project, farmers will (action outcomes): (1) improve and diversify their production systems through data-driven recommendations; (2) identify circumstances where adopting cover crops will not be only a viable option but will demonstrate improvements on soil health and sustainability of their farms; (3) improve farmers economic well-being, quality of life, and professional inquiry of issues related to environmental stewardship and long-term sustainability. These outcomes represent critical steps toward agricultural systems sustainability and will lead to positive improvements in agricultural productivity and soil health across the North Central region and positive education changes for promoting sustainability. Furthermore, we expect this project to result in fundamental new knowledge on benefits from cover crops for similar agricultural production systems in the US and worldwide. Additionally, this project will result in the education of many current farmers and next-generation agriculturalists (5-12 grades), who will gain valuable experience on agricultural sustainability. We believe that pre-college involvement via field days will impact the long-term adoption of sustainable practices, building up a legacy for future generations.
Cooperators
- (Researcher)
Research
Study site and field characteristics
An on-farm research study was conducted in Kansas from 2018 to 2023, U.S., as part of the Kansas Soil Health Partnership. The was classified as Hot-summer humid continental (Dfa) according to (Peel et al., 2007). Soil classification (Soil Survey Staff, 2014), coordinates, elevation, average annual precipitation, and average mean annual temperature are presented in Table 1. Soil physicochemical characterization by treatment, depth, and year is presented in Table 2.
Table 1. Site name, location, elevation, soil classification, average annual precipitation, and average mean annual temperature.
|
Site |
Location |
Elevation |
Soil taxonomy |
Average annual precipitation |
Average annual temperature |
|
Bucyrus |
38.7395N -94.7068W |
341 m |
Fine, smectitic, mesic Aquertic Argiudoll |
998 mm |
13°C |
Experimental design and treatment descriptions
The experiment was established as a randomized complete block design, with two treatments [cover crop (CC) and no cover crop (NC)] and four replications (strips) (Figure 1). The strip size matched the field size and farming equipment. The field size was 21.6 ha, with a strip size of 2.7 ha and a sampling grid of 0.45 ha.
Throughout the five years of study, the cropping system at Bucyrus (Figure 2) was corn (2018), cereal rye as CC (2018/2019), soybean (2019), oat, cereal rye, radish, and hairy vetch as a mix of CCs (2019/2020), corn (2020), cereal rye as CC (2020/2021), soybean (2021), cereal rye, rapeseed, winter pea, and hairy vetch as a mix of CCs (2021/2022), corn (2022), cereal rye as CC (2022/2023). The field was managed under no-tillage and poultry litter was applied across the entire field at a rate of 600 kg ha-1.
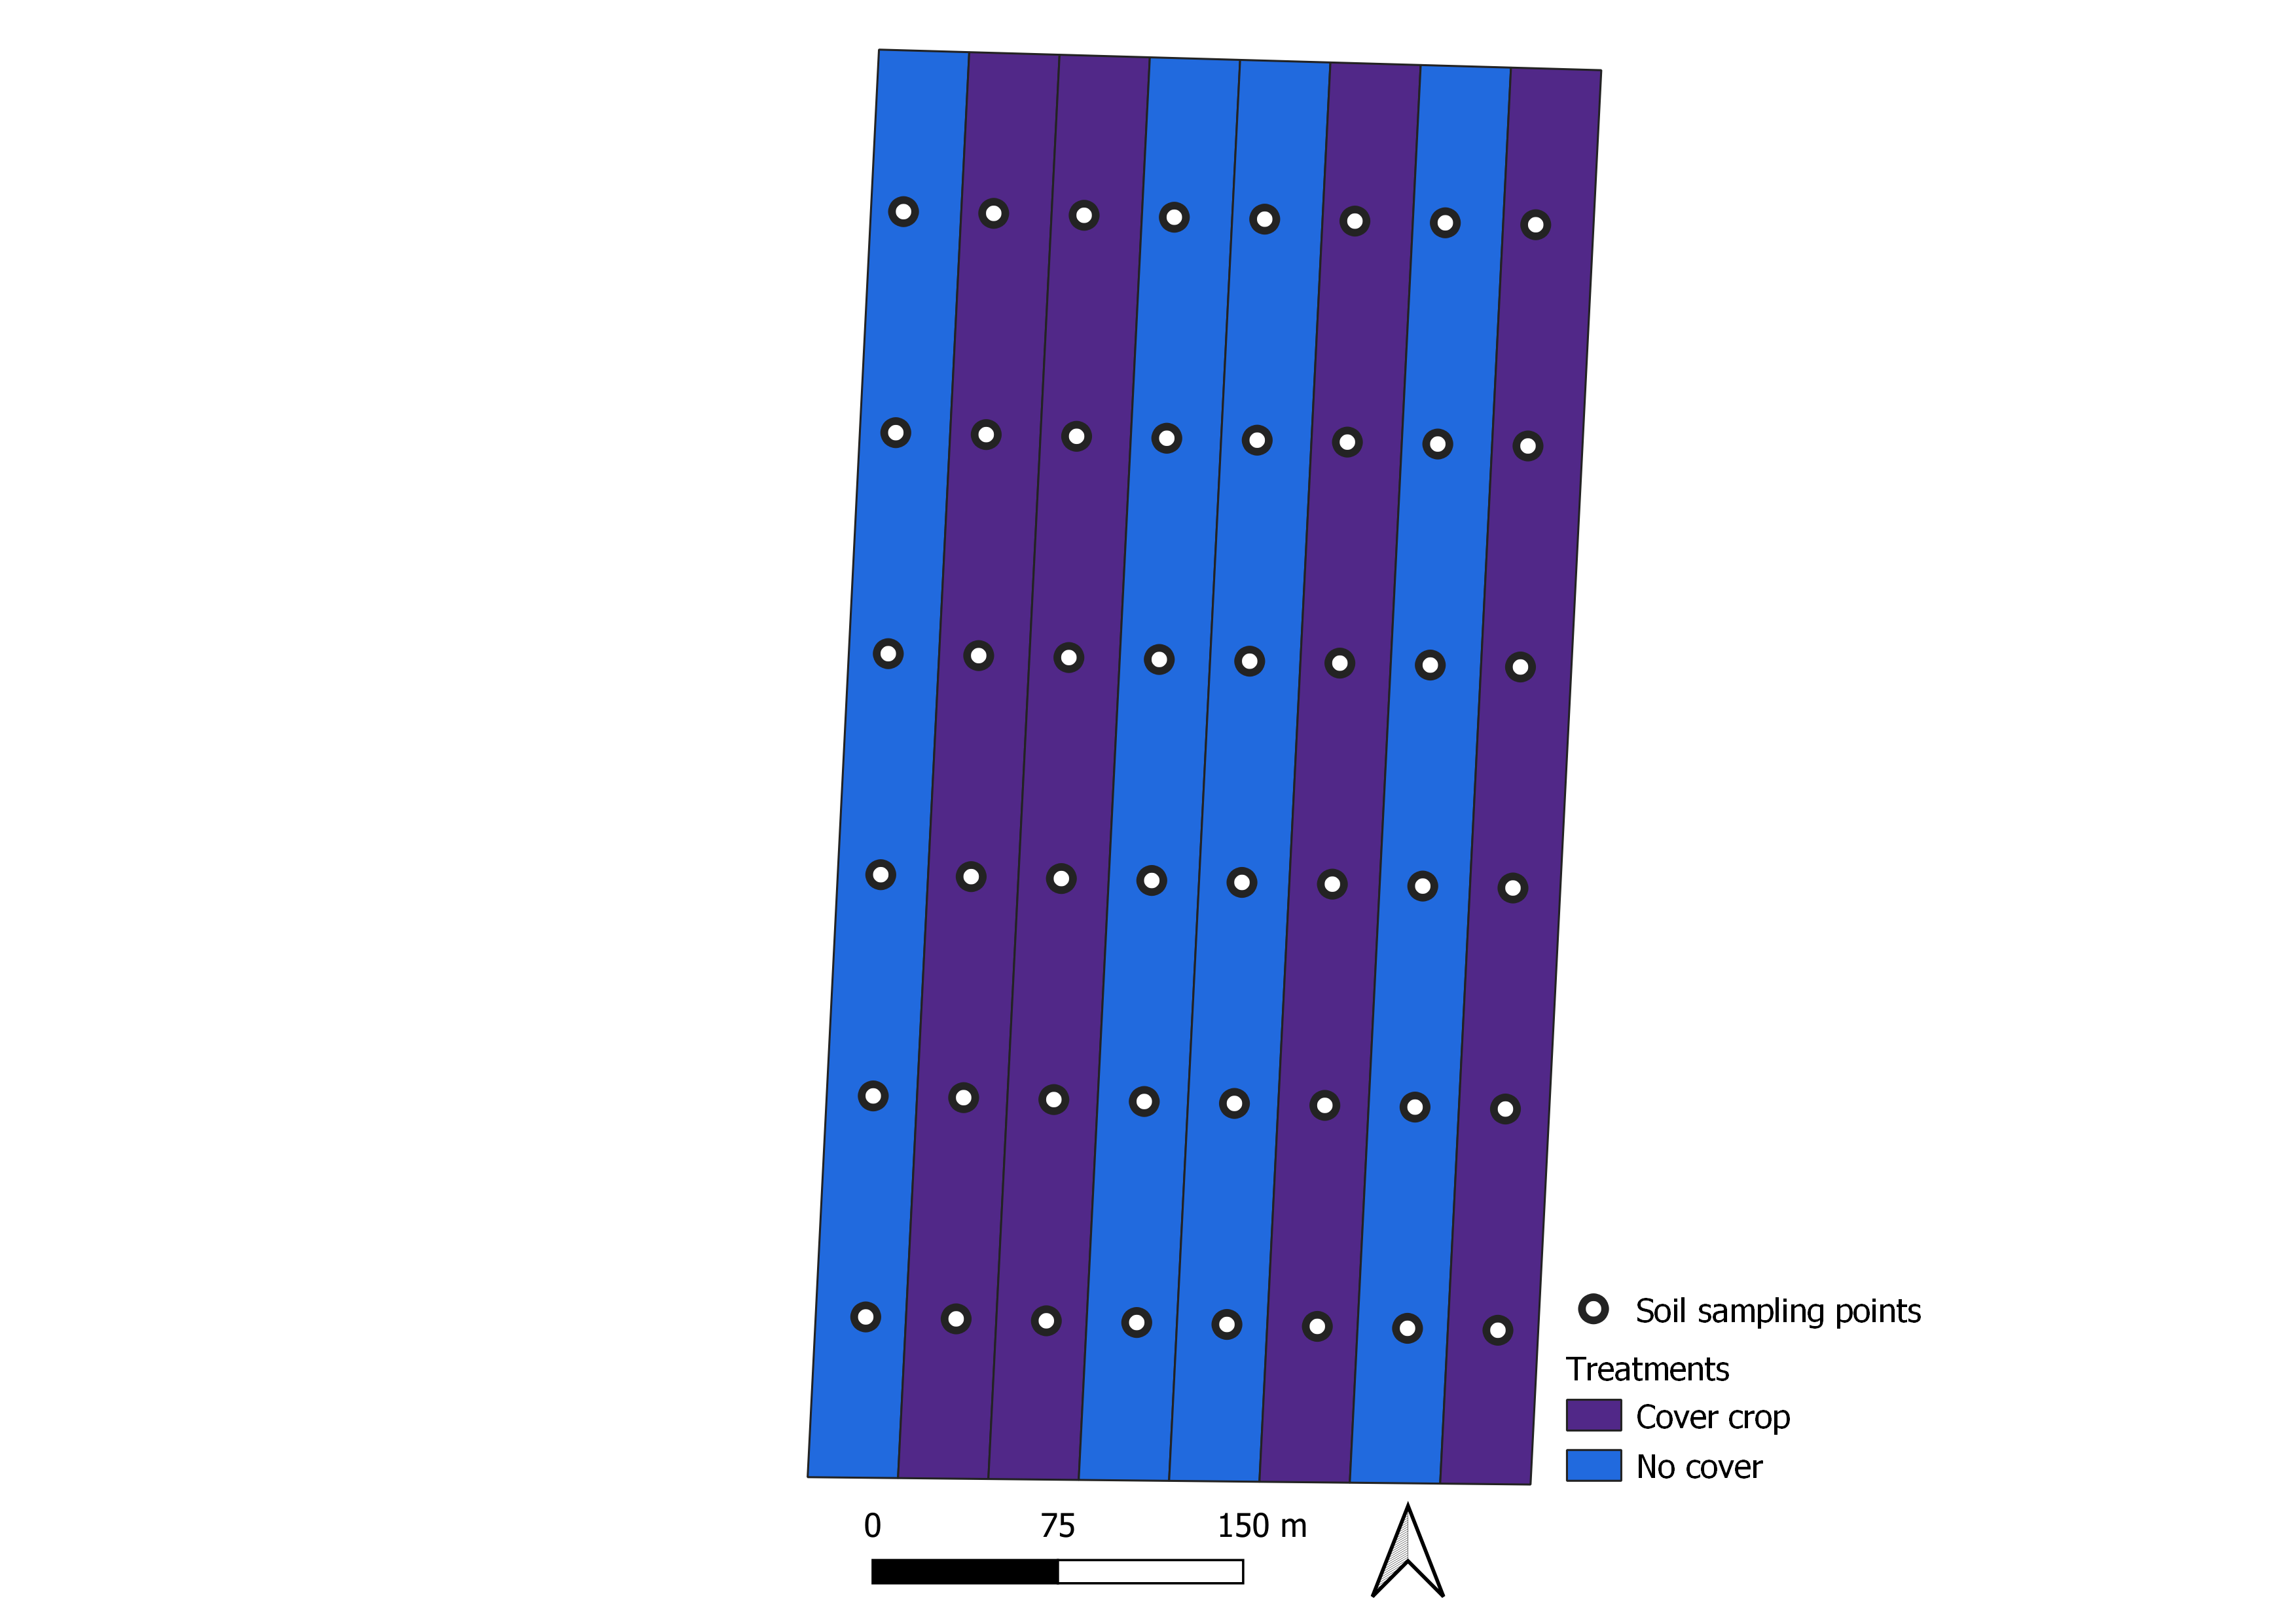
Figure 1. Study experimental design. Bucyrus, Kansas.
Table 2. Soil physicochemical properties by treatment, year, and depth at Bucyrus, KS (n = 4).
|
Treatment |
Year |
Clay |
Silt |
Sand |
K+ |
P |
Ca2+ |
Mg2+ |
Na+ |
pH |
|
-------- g kg-1 -------- |
---------------------------- mg kg-1 ---------------------------- |
|||||||||
|
0-5 cm |
||||||||||
|
No cover |
2018 |
234 ± 10.6 |
633 ± 10.5 |
133 ± 2.5 |
198 ± 11.9 |
45.3 ± 2.6 |
2565 ± 65 |
185 ± 5.6 |
13.3 ± 0.6 |
6.6 ± 0.1 |
|
Cover crop |
2018 |
245 ± 9.6 |
630 ± 9.9 |
125 ± 4.3 |
173 ± 8 |
39.9 ± 2.4 |
2622 ± 55.1 |
188 ± 5.5 |
12.3 ± 0.7 |
6.8 ± 0.1 |
|
No cover |
2020 |
----- |
----- |
----- |
218 ± 11.7 |
63 ± 5.4 |
2610 ± 74 |
197 ± 8.4 |
29 ± 0.9 |
6.8 ± 0.1 |
|
Cover crop |
2020 |
----- |
----- |
----- |
207 ± 13.1 |
51.4 ± 3.9 |
2539 ± 61.2 |
197 ± 7.1 |
25.8 ± 0.7 |
6.9 ± 0 |
|
No cover |
2022 |
----- |
----- |
----- |
179 ± 11.1 |
50 ± 5 |
2305 ± 54.6 |
170 ± 5.8 |
24.4 ± 0.7 |
6.9 ± 0.1 |
|
Cover crop |
2022 |
----- |
----- |
----- |
186 ± 6.4 |
46.7 ± 4.1 |
2373 ± 55 |
182 ± 6.9 |
24.8 ± 0.9 |
7 ± 0 |
|
5-15 cm |
||||||||||
|
No cover |
2018 |
282 ± 8.1 |
594 ± 9.1 |
124 ± 2.1 |
102 ± 6.3 |
17.3 ± 1.9 |
2216 ± 64.8 |
162 ± 8.3 |
34.1 ± 1 |
5.6 ± 0.1 |
|
Cover crop |
2018 |
290 ± 9.1 |
590 ± 10.7 |
120 ± 3.1 |
103 ± 6.9 |
15.3 ± 2.1 |
2312 ± 56.1 |
172 ± 10.2 |
35.6 ± 1.3 |
5.7 ± 0.1 |
|
No cover |
2020 |
----- |
----- |
----- |
145 ± 9 |
26.4 ± 3.6 |
2379 ± 82.5 |
166 ± 8.4 |
31.2 ± 1 |
6.2 ± 0.1 |
|
Cover crop |
2020 |
----- |
----- |
----- |
136 ± 8 |
23.2 ± 2.6 |
2446 ± 88.1 |
176 ± 11.6 |
29.3 ± 1.1 |
6.3 ± 0.1 |
|
No cover |
2022 |
----- |
----- |
----- |
120 ± 8 |
17.3 ± 2.6 |
2230 ± 62.5 |
150 ± 8.2 |
24 ± 1.3 |
6.3 ± 0.1 |
|
Cover crop |
2022 |
----- |
----- |
----- |
117 ± 7.6 |
13.1 ± 2.6 |
2417 ± 77.6 |
163 ± 13.1 |
25.5 ± 1.3 |
6.6 ± 0.1 |
|
15-30 cm |
||||||||||
|
No cover |
2018 |
301 ± 9.7 |
582 ± 10.5 |
117 ± 2.7 |
113 ± 9.4 |
7.3 ± 1.7 |
2203 ± 95.8 |
194 ± 14.6 |
41 ± 2 |
5.7 ± 0.1 |
|
Cover crop |
2018 |
308 ± 9.7 |
576 ± 10.2 |
116 ± 2.6 |
101 ± 7.1 |
4.1 ± 0.4 |
2166 ± 64.6 |
194 ± 14.9 |
39.9 ± 1.6 |
5.8 ± 0.1 |
|
No cover |
2020 |
----- |
----- |
----- |
130 ± 7.9 |
11.1 ± 2.3 |
2259 ± 98.9 |
183 ± 14.3 |
33 ± 0.9 |
5.8 ± 0.1 |
|
Cover crop |
2020 |
----- |
----- |
----- |
129 ± 9.9 |
11.9 ± 2.4 |
2245 ± 102.3 |
183 ± 19 |
31.3 ± 1.9 |
5.9 ± 0.1 |
|
No cover |
2022 |
----- |
----- |
----- |
115 ± 7.1 |
8.6 ± 2.1 |
2133 ± 65.7 |
155 ± 9.9 |
27.2 ± 1.9 |
5.9 ± 0.1 |
|
Cover crop |
2022 |
----- |
----- |
----- |
120 ± 8.9 |
8.7 ± 1.9 |
2423 ± 84.9 |
176 ± 16.2 |
29.1 ± 1.6 |
6.2 ± 0.1 |
Means for soil texture with the standard error of the mean.
Soil and biomass sampling
Soil samples were taken at 0-5, 5-15, and 15-30 cm soil depth in a GPS coordinate sampling grid at the first, third, and fifth year of the study. Soil sampling was done during the spring after CCs termination and before planting the cash crop. The first-year sampling was considered as the baseline. Soil samples for microbial properties were kept in a cooler (4°C) and frozen (-20°C) within 2 hrs after sampling and stored until analysis. Samples for physical and chemical analysis were cleaned of roots, air-dried, ground, and passed through a 2-mm sieve. Cover crop aboveground biomass was collected after CC termination. One 0.98 m2 aboveground biomass sample was collected at each GPS point. Samples were dried in a forced-air oven at 50°C for a minimum of 7 days and weighed when constant weight was achieved. Cash crop aboveground biomass was estimated using a harvest index (Prince et al., 2001; Schapaugh & Wilcox, 1980; Sharma & Smith, 1987) of 0.54 for corn (Johnson et al., 2006; Ruiz et al., 2023; West et al., 2010) and 0.43 for soybean (Johnson et al., 2006; Prince et al., 2001; West et al., 2010).
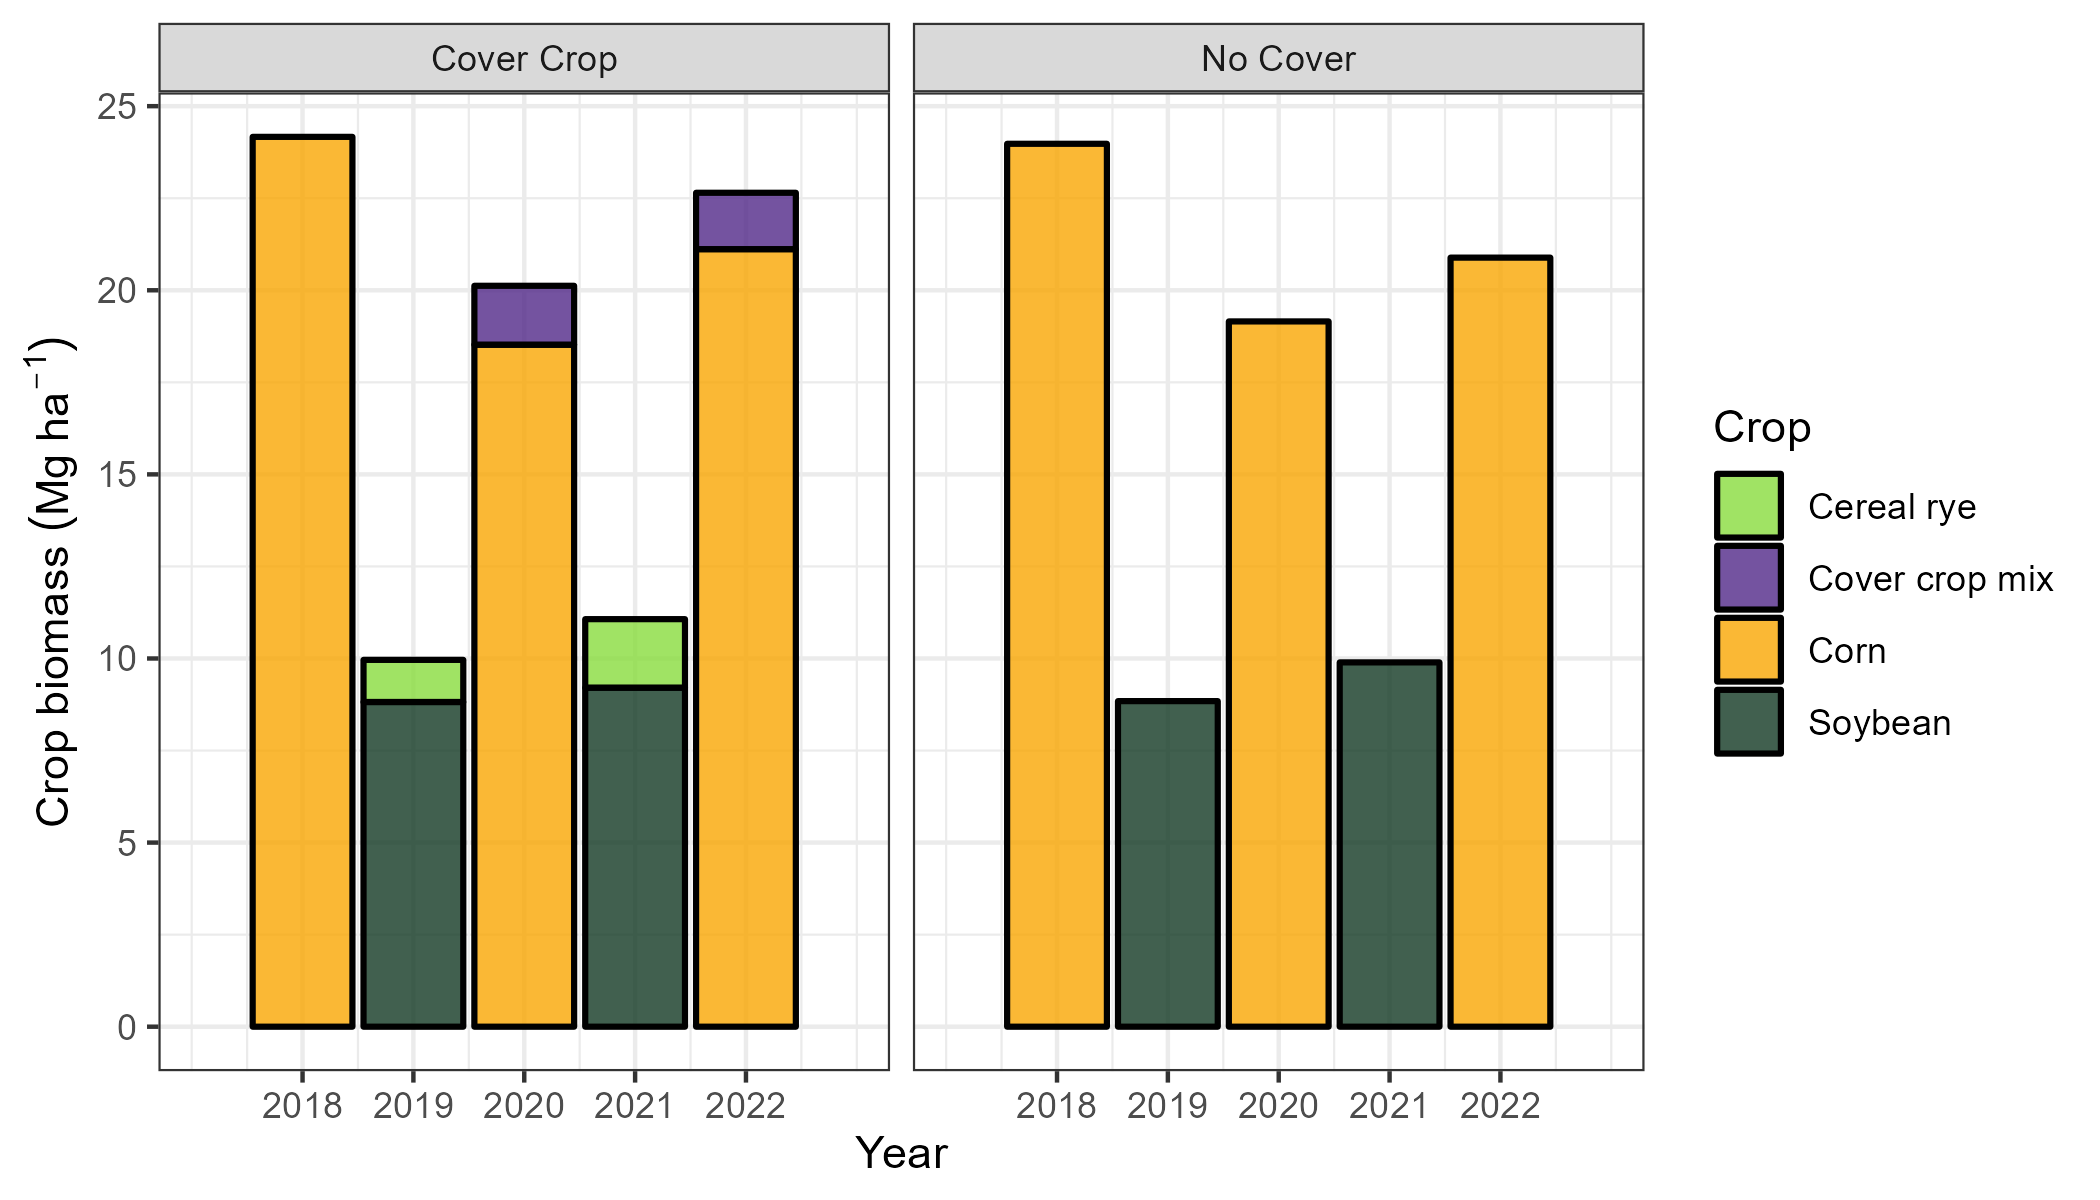
Figure 2. Crop biomass by treatment and year at Bucyrus, KS.
Soil physical and chemical properties analysis
The sand, silt, and clay fraction for each site was determined by the hydrometer method using a solution of 50 g/L of sodium hexametaphosphate as a dispersing solution (Gavlak et al., 2005). Soil chemical properties were analyzed using the standard Mehlich-3 method (NCR221, 2015) for extractable P and the standard ammonium acetate method for extractable K, Ca, Mg, and Na (NCR221, 2015) at the Soil Testing Lab at Kansas State University, Manhattan, KS. Soil pH was determined with a 1:10 soil: water slurry method. Soil organic carbon (SOC) and total nitrogen (TN) were determined by dry combustion using a LECO® CN 828 analyzer (Leco Corp; USA).
To determine sand-free water stable aggregates (WSA), 100 g of soil were weighed and placed into a Yoder wet-sieving machine (Yoder, 1936) for the recovery of all particle fractions as described by Mikha & Rice (2004). Each soil sample was separated into four aggregate size classes (8-2 mm, 2-0.250 mm, 0.250-0.053 mm, and 0.053-0.020 mm diameter). Aggregates from each treatment were fractionated into macroaggregates (>2 and 0.250–2 mm) and microaggregate (0.053–0.250 and 0.020–0.053 mm) size classes.
Soil microbiological properties analysis
Phospholipid fatty acid (PLFA) analysis was performed with modifications to the original procedure (D. C. White & Ringelberg, 1998) to assess the soil microbial community composition. Phospholipid fatty acid abundance was reported as nmol PLFA g−1 soil. Microbial biomass (TMB) was estimated as the sum of all PLFA biomarkers.
The potential activity of four extracellular and hydrolytic soil enzymes indicative of C-cycling (β-glucosidase, βG, EC 3.2.1.21), C/N-cycling (N-acetyl-β-glucosaminidase, NAG, EC 3.2.1), P-cycling (acid phosphatase, AcidP, EC 3.1.3.2), and S-cycling (arylsulfatase, ArylS, EC 3.1.6.1) was evaluated. These enzyme activities were assayed using 0.5g of air-dried soil with the appropriate p-nitrophenyl substrate and incubated for 1 hour at 37°C at the optimal pH as described by Tabatabai (1994).
Statistical analysis
The R Programming software (R Core Team, 2023) was used for all the analyses and figure production. Prior to statistical analysis, the dataset was spatially transformed to a sf object using x (longitude) and y (latitude) coordinates from the GPS sampling points (Pebesma & Bivand, 2023). The effect of treatment (CCs) and year, and their respective interactions (fixed effects) on the response variables was analyzed by ANOVA after fitting a linear mixed effects model using the nlme R package (Pinheiro et al., 2017) for each depth. Blocks were set as random effects. The normality of the residuals was tested using the Shapiro–Wilk test, and square-root transformation was applied when necessary. Models were tested with exponential, spherical, gaussian, and rational spatial correlation structures without nugget effect using a maximized log-likelihood method (Pinheiro et al., 2017). Model selection for correlation structure was performed following the Akaike information criterion (AIC). Model means were extracted using the emmeans R package (Lenth, 2023) and a pairwise comparison was used to determine significant differences among treatments for all the fixed effects presenting a significance equal to or lower than 0.05 using Fisher’s LSD (multcomp R package) (Hothorn et al., 2008).
Results
Soil microbial community composition
The soil microbial community composition was assessed by the abundance of PLFA biomarkers according to treatment and year at each depth and site location. All other microbial groups at Bucyrus, excluding saprophytic fungi, had a significant two-way interaction for treatment and year at 0-5 cm (Table 2) Soil microbial biomass was significantly higher in the CC treatment in 2022 than in all other treatment and year combinations, showing an increase of 5x compared to the 2018 CC treatment (Figure 3). Likewise, NC 2022 had a microbial biomass 4x higher than NC 2018.
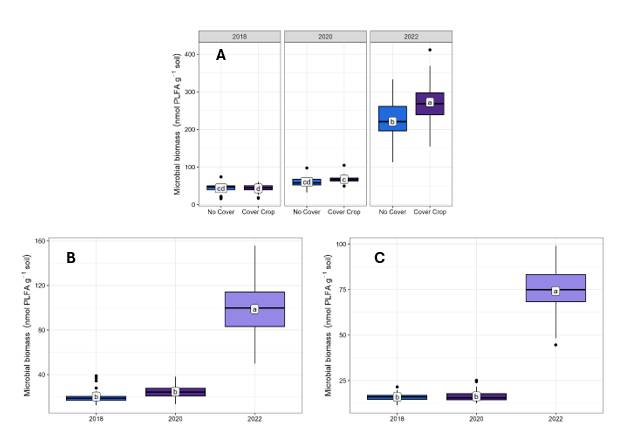
Figure 3. Microbial biomass by treatment and year at 0-5 (A), 5-15 (B), and 15-30 (C) cm depth at Bucyrus. Means followed by the same letter are not different according to Fisher’s LSD test at the 5% level.
The same trend was observed for Gram+, Gram -, actinomycetes, and AMF (Table 3). Saprophytic fungi were significant for year only (Table 3), with an increase of 3.1 nmol PLFA g-1 soil from 2018 to 2022 (Table 3). At 5-15 cm, all microbial groups were significantly affected by year, with 2022 having the highest values, excluding AMF, which had higher biomass in 2020 (Figure 3B; Table 3). At 15-30 cm, microbial biomass, Gram-, actinomycetes, and fungi were significant for year (Table 3). Excluding saprophytic fungi, which had higher biomass in 2020 (same as 5-15 cm), microbial biomass (Figure 3C), Gram-, and actinomycetes (Table 3) had higher biomass in 2022. This increase was 3.6x for microbial biomass, 4.4x for Gram-, and 2.6x for actinomycetes. Gram+ and AMF had a two-way interaction between treatment and year (Table 3). Cover crop 2022 had the highest Gram+ biomass, while NC and CC 2020 had the highest AMF biomass (Table 3).
Table 3. Changes in soil microbial community (nmol PLFA g-1 soil) by treatment, year, and depth in Bucyrus, KS.
|
Treatment |
Year |
Gram+ |
Gram- |
Actino |
AMF |
Fungi |
|
0-5 cm |
||||||
|
No cover |
2018 |
12.0 cd |
7.0 c |
2.3 d |
2.7 c |
0.6 b |
|
Cover crop |
11.8 d |
7.3 c |
2.6 cd |
2.6 c |
||
|
No cover |
2020 |
16.5 cd |
9.2 c |
3.6 c |
7.7 b |
0.8 b |
|
Cover crop |
17.0 c |
11.0 c |
3.5 cd |
8.6 b |
||
|
No cover |
2022 |
58.4 b |
40.0 b |
13.2 b |
8.5 b |
3.7 a |
|
Cover crop |
71.1 a |
51.4 a |
16.0 a |
12.9 a |
||
|
5-15 cm |
||||||
|
No cover |
2018 |
7.0 b |
2.5 b |
1.3 b |
0.7 c |
0.3 b |
|
Cover crop |
||||||
|
No cover |
2020 |
8.5 b |
3.2 b |
1.3 b |
3.3 a |
0.2 b |
|
Cover crop |
||||||
|
No cover |
2022 |
22.7 a |
13.2 a |
6.0 a |
2.2 b |
0.5 a |
|
Cover crop |
||||||
|
15-30 cm |
||||||
|
No cover |
2018 |
6.9 c |
1.4 b |
1.0 b |
0.4 d |
0.1 b |
|
Cover crop |
6.7 c |
0.4 d |
||||
|
No cover |
2020 |
6.8 c |
1.6 b |
1.2 b |
1.8 a |
0.1 b |
|
Cover crop |
6.6 c |
1.8 a |
||||
|
No cover |
2022 |
13.6 b |
7.6 a |
3.6 a |
0.8 c |
0.2 a |
|
Cover crop |
15.2 a |
1.0 b |
||||
Means followed by the same letter are not different according to Fisher’s LSD test at the 5% level. Gram-positive bacteria (Gram+), gram-negative bacteria (Gram+), actinomycetes (Actino), arbuscular mycorrhizal fungi (AMF), and saprophytic fungi (Fungi).
Extracellular enzyme activity
All tested enzymes had a significant two-way interaction for treatment and year at 0-5 cm (Table 4). For the 0-5 cm soil depth, βG activity increased from 360 µg PNP soil-1 h-1 (2018) to 568 µg PNP soil-1 h-1 (2022) with CCs, representing an increase of 58% (Figure 4A). Acid phosphatase activity also increased with CCs (Table 4). For the CC treatment, there was a difference of 24% between 2018 and 2022. On the other hand, NC decreased AcidP activity from 2018 to 2022 by 17% (4). N-acetyl-β-glucosaminidase activity had a similar trend, with a temporal increase of 39% from 2018 to 2020 with CCs and no significant changes with NC (Table 4). For ArylS, there was a significant increase from 2018 to 2020 and a decrease from 2020 to 2022. Nonetheless, ArylS activity was 30% higher for the CC treatment in 2022 than NC (Table 4).
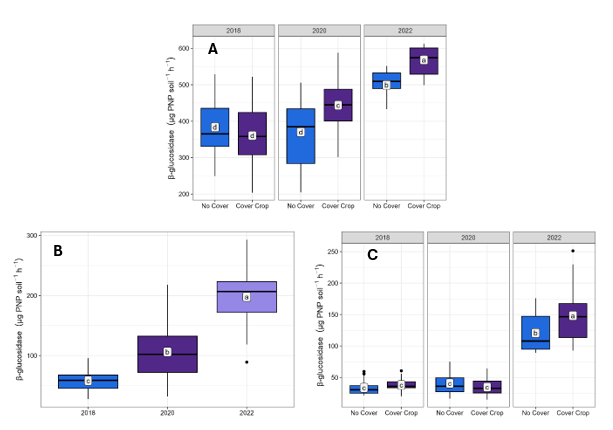
Figure 4. β-glucosidase activity by treatment and year at 0-5 (A), 5-15 (B), and 15-30 (C) cm depth at Bucyrus. Means followed by the same letter are not different according to Fisher’s LSD test at the 5% level.
Table 4. Changes in enzyme activity (µg PNP soil-1 h-1) by treatment, year, and depth in Bucyrus, KS.
|
Treatment |
Year |
AcidP |
NAG |
ArylS |
|
0-5 cm |
||||
|
No cover |
2018 |
585 ab |
59.4 b |
213 cd |
|
Cover crop |
521 bc |
58.2 b |
199 de |
|
|
No cover |
2020 |
594 ab |
60.5 b |
221 bc |
|
Cover crop |
628 a |
81.2 a |
256 a |
|
|
No cover |
2022 |
484 c |
60.0 b |
181 e |
|
Cover crop |
649 a |
77.7 a |
235 b |
|
|
5-15 cm |
||||
|
No cover |
2018 |
285 b |
24.7 b |
54.7 c |
|
Cover crop |
259 bc |
52.7 c |
||
|
No cover |
2020 |
295 ab |
28.7 a |
83.9 b |
|
Cover crop |
334 a |
105 a |
||
|
No cover |
2022 |
246 c |
29.2 a |
73.1 b |
|
Cover crop |
282 bc |
85.2 b |
||
|
15-30 cm |
||||
|
No cover |
2018 |
302 a |
43.8 a |
63.2 a |
|
Cover crop |
266 b |
|||
|
No cover |
2020 |
249 bc |
28.0 b |
66.0 a |
|
Cover crop |
255 bc |
|||
|
No cover |
2022 |
187 d |
25.5 b |
56.0 b |
|
Cover crop |
232 c |
|||
Means followed by the same letter are not different according to Fisher’s LSD test at the 5% level. Acid phosphatase (AcidP), N-acetyl-β-glucosaminidase (NAG), arylsulfatase (ArylS).
For 5-15 cm, there was a two-way interaction between treatment and year for AcidP and ArylS, and a one-way effect of year for βG and NAG (Table 4). For AcidP and ArylS we observed the same trend as 0-5 cm, with an increase from 2018 to 2020 and a decrease from 2020 to 2022 for the CC treatment. However, CC and NC 2023 were not statistically different. Both βG (240%) and NAG (18%) activity increased from 2018 to 2022 (Figure 4B; Table 4). At 15-30 cm, there was a two-way interaction between treatment and year for βG and AcidP, and a one-way effect of year on NAG and ArylS (Table 4). Independent of treatment, βG significantly increased from 2019 to 2023 (Figure 4C). However, greater βG was found for CC (148 µg PNP soil-1 h-1) than NC (121 µg PNP soil-1 h-1) in 2023. Contrastingly, AcidP activity continuously decreased with time for both treatments (Table 4). A greater decrease was found for NC (38%) than for CC (13%). N-acetyl-β-glucosaminidase (42%) and ArylS (11%) significantly decreased with time (Table 4).
Soil organic carbon and total nitrogen
At Bucyrus, there was a significant two-way interaction between treatment and year for SOC at 0-5 cm (Table 5). A one-way effect of year was found for 5-15 and 15-30 cm soil depth (Table 5). At 0-5 cm, CC increased soil organic carbon by 21% from 2018 to 2022 (Figure 5). Soil organic carbon was also higher for NC 2023 than CC 2018 (baseline) but not different from NC 2018 (Figure 5). For both 5-15 and 15-30 cm there was an increase in SOC of 19% and 13% with time, respectively (Table 5). Total nitrogen was significant for treatment and year for 0-5 cm and year for 5-15 and 15-30 cm (Table 5). Inversely to SOC, there was no increase in TN with time with CCs (Table 5). Moreover, TN temporally decreased by 36% without CCs.
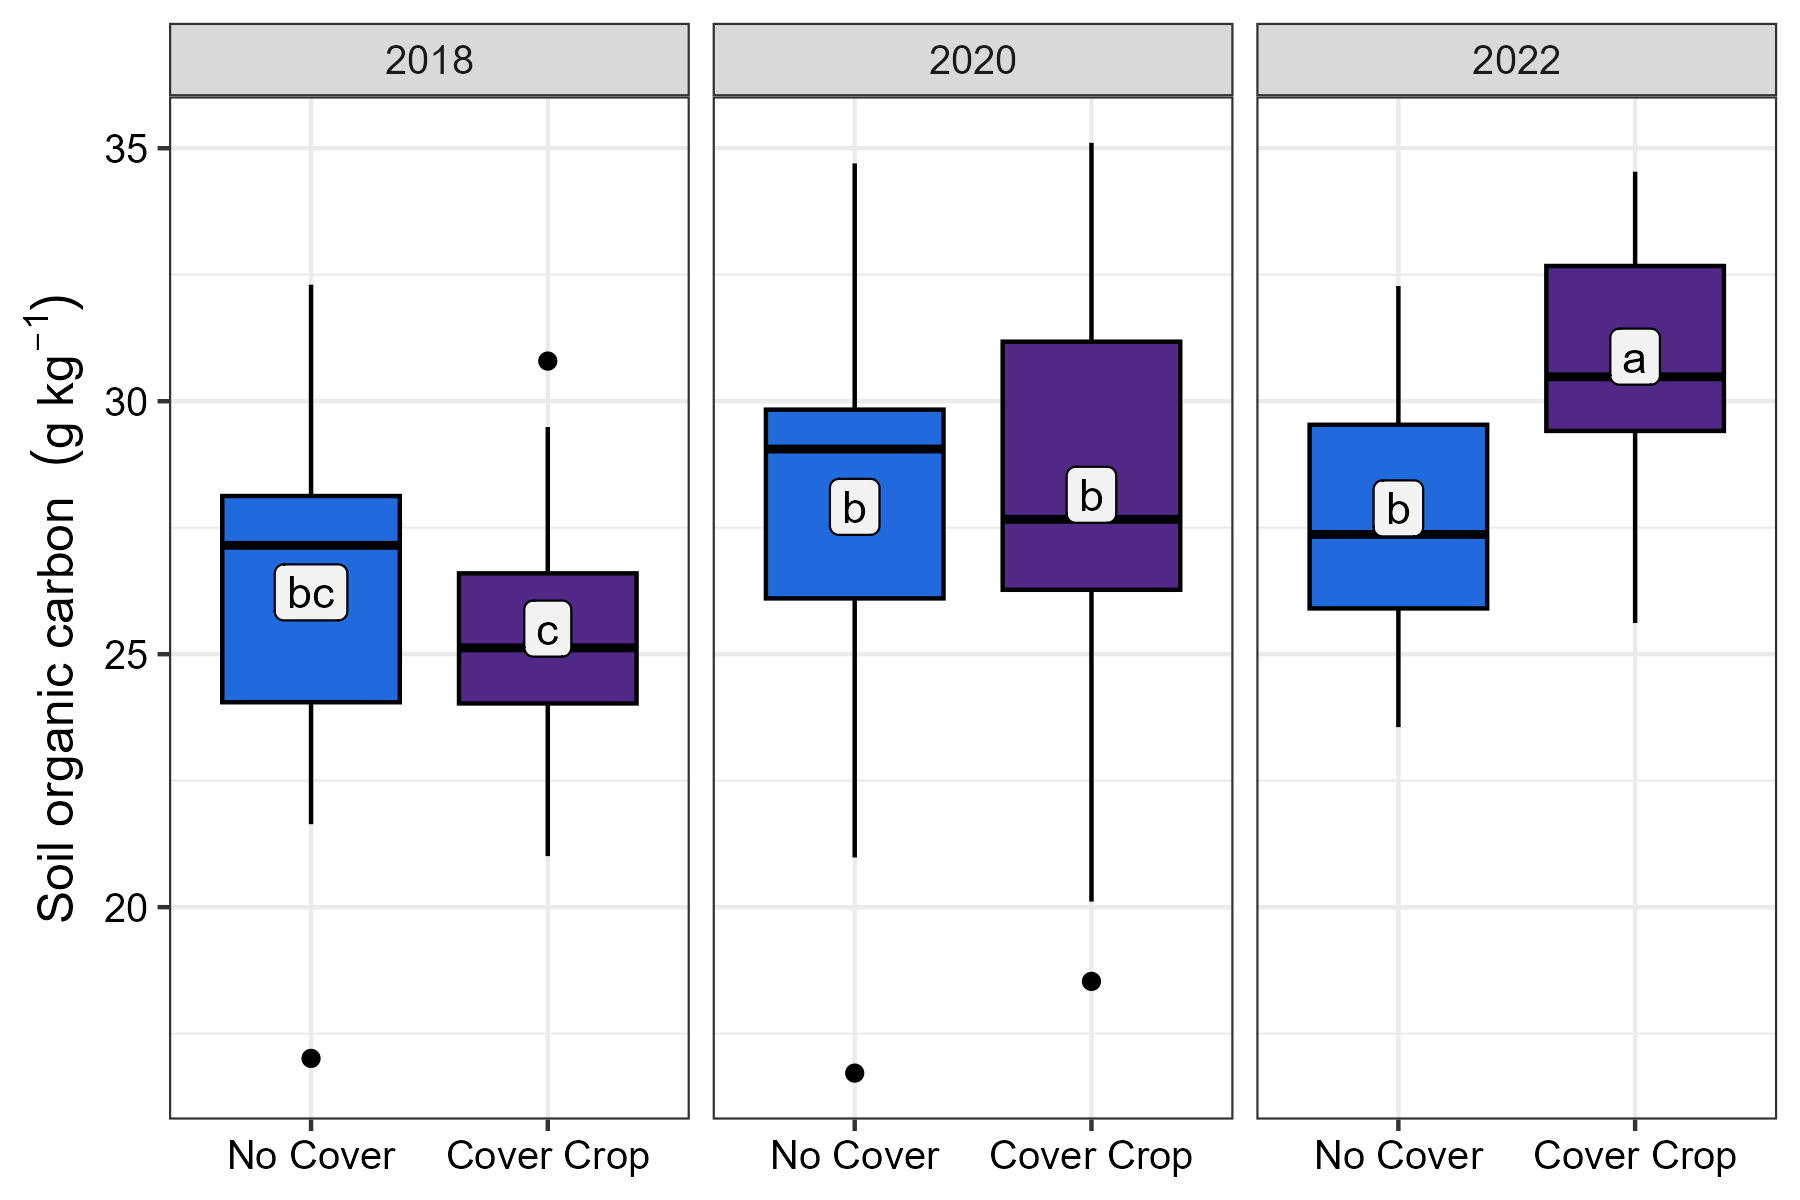
Figure 5. Soil organic carbon by treatment and year at 0-5 cm at Bucyrus. Means followed by the same letter are not different according to Fisher’s LSD test at the 5% level.
Table 5. Changes in soil organic carbon (g C kg soil-1), total nitrogen (g N kg soil-1), and C: N ratio by treatment, year, and depth at Bucyrus, KS.
|
Treatment |
Year |
SOC |
TN |
C:N ratio |
|
0-5 cm |
||||
|
No cover |
2018 |
26.2 bc |
3.0 a |
9.5 c |
|
Cover crop |
25.5 c |
2.7 ab |
||
|
No cover |
2020 |
28.0 b |
2.4 bc |
11.5 b |
|
Cover crop |
28.1 b |
2.4 bc |
||
|
No cover |
2022 |
28.0 b |
2.2 c |
12.5 a |
|
Cover crop |
30.9 a |
2.4 bc |
||
|
5-15 cm |
||||
|
No cover |
2018 |
17.1 c |
2.1 a |
9.2 c |
|
Cover crop |
||||
|
No cover |
2020 |
18.3 b |
1.6 b |
11.5 b |
|
Cover crop |
||||
|
No cover |
2022 |
20.3 b |
1.5 b |
13.5 a |
|
Cover crop |
||||
|
15-30 cm |
||||
|
No cover |
2018 |
15.7 b |
2.0 a |
9.2 c |
|
Cover crop |
||||
|
No cover |
2020 |
17.4 a |
1.4 b |
11.8 b |
|
Cover crop |
||||
|
No cover |
2022 |
17.8 a |
1.3 b |
13.7 a |
|
Cover crop |
||||
Means followed by the same letter are not different according to Fisher’s LSD test at the 5% level. Soil organic carbon (SOC), total nitrogen (TN), soil organic carbon: total nitrogen ratio (C: N ratio).
Cropping system biomass
The base cropping system yielded 82.7 Mg ha-1 of shoot biomass (Figure 2). The CC treatment added 5.3 Mg ha-1 for 88 Mg ha-1 (Figure 2). The fundamental idea behind incorporating CCs into the cropping system was to introduce a layer of residue cover ahead of soybean planting and a mix of legumes and grasses to supply nitrogen (N) for corn.
Aggregates size distribution
At Bucyrus, there was a two-way interaction between treatment and year for WSA >2 mm, a year effect for WSA 2-0.250 mm, and a separate effect of both treatment and year for WSA 0.250-0.053 mm and 0.053-0.020 mm. While there was no increase in WSA >2 mm for NC, CC increased >2 mm aggregates by 145% from 2018 to 2022 (Figure 6). The 2-0.250 mm fraction increased by 24% (Figure 6). No cover crop also had a lower amount of 0.250-0.053- and 0.053-020 mm aggregates than CC (Figure 6). The increase in the first two aggregate size classes is expected to lead to a decrease in smaller classes, driven by the need for aggregate size balance. Soil macroaggregates represent the sum of the WSA >2 mm and 2-0.250 mm classes. Macroaggregates were significantly increased by both CC (8%) and year (28%) (Figure 7).
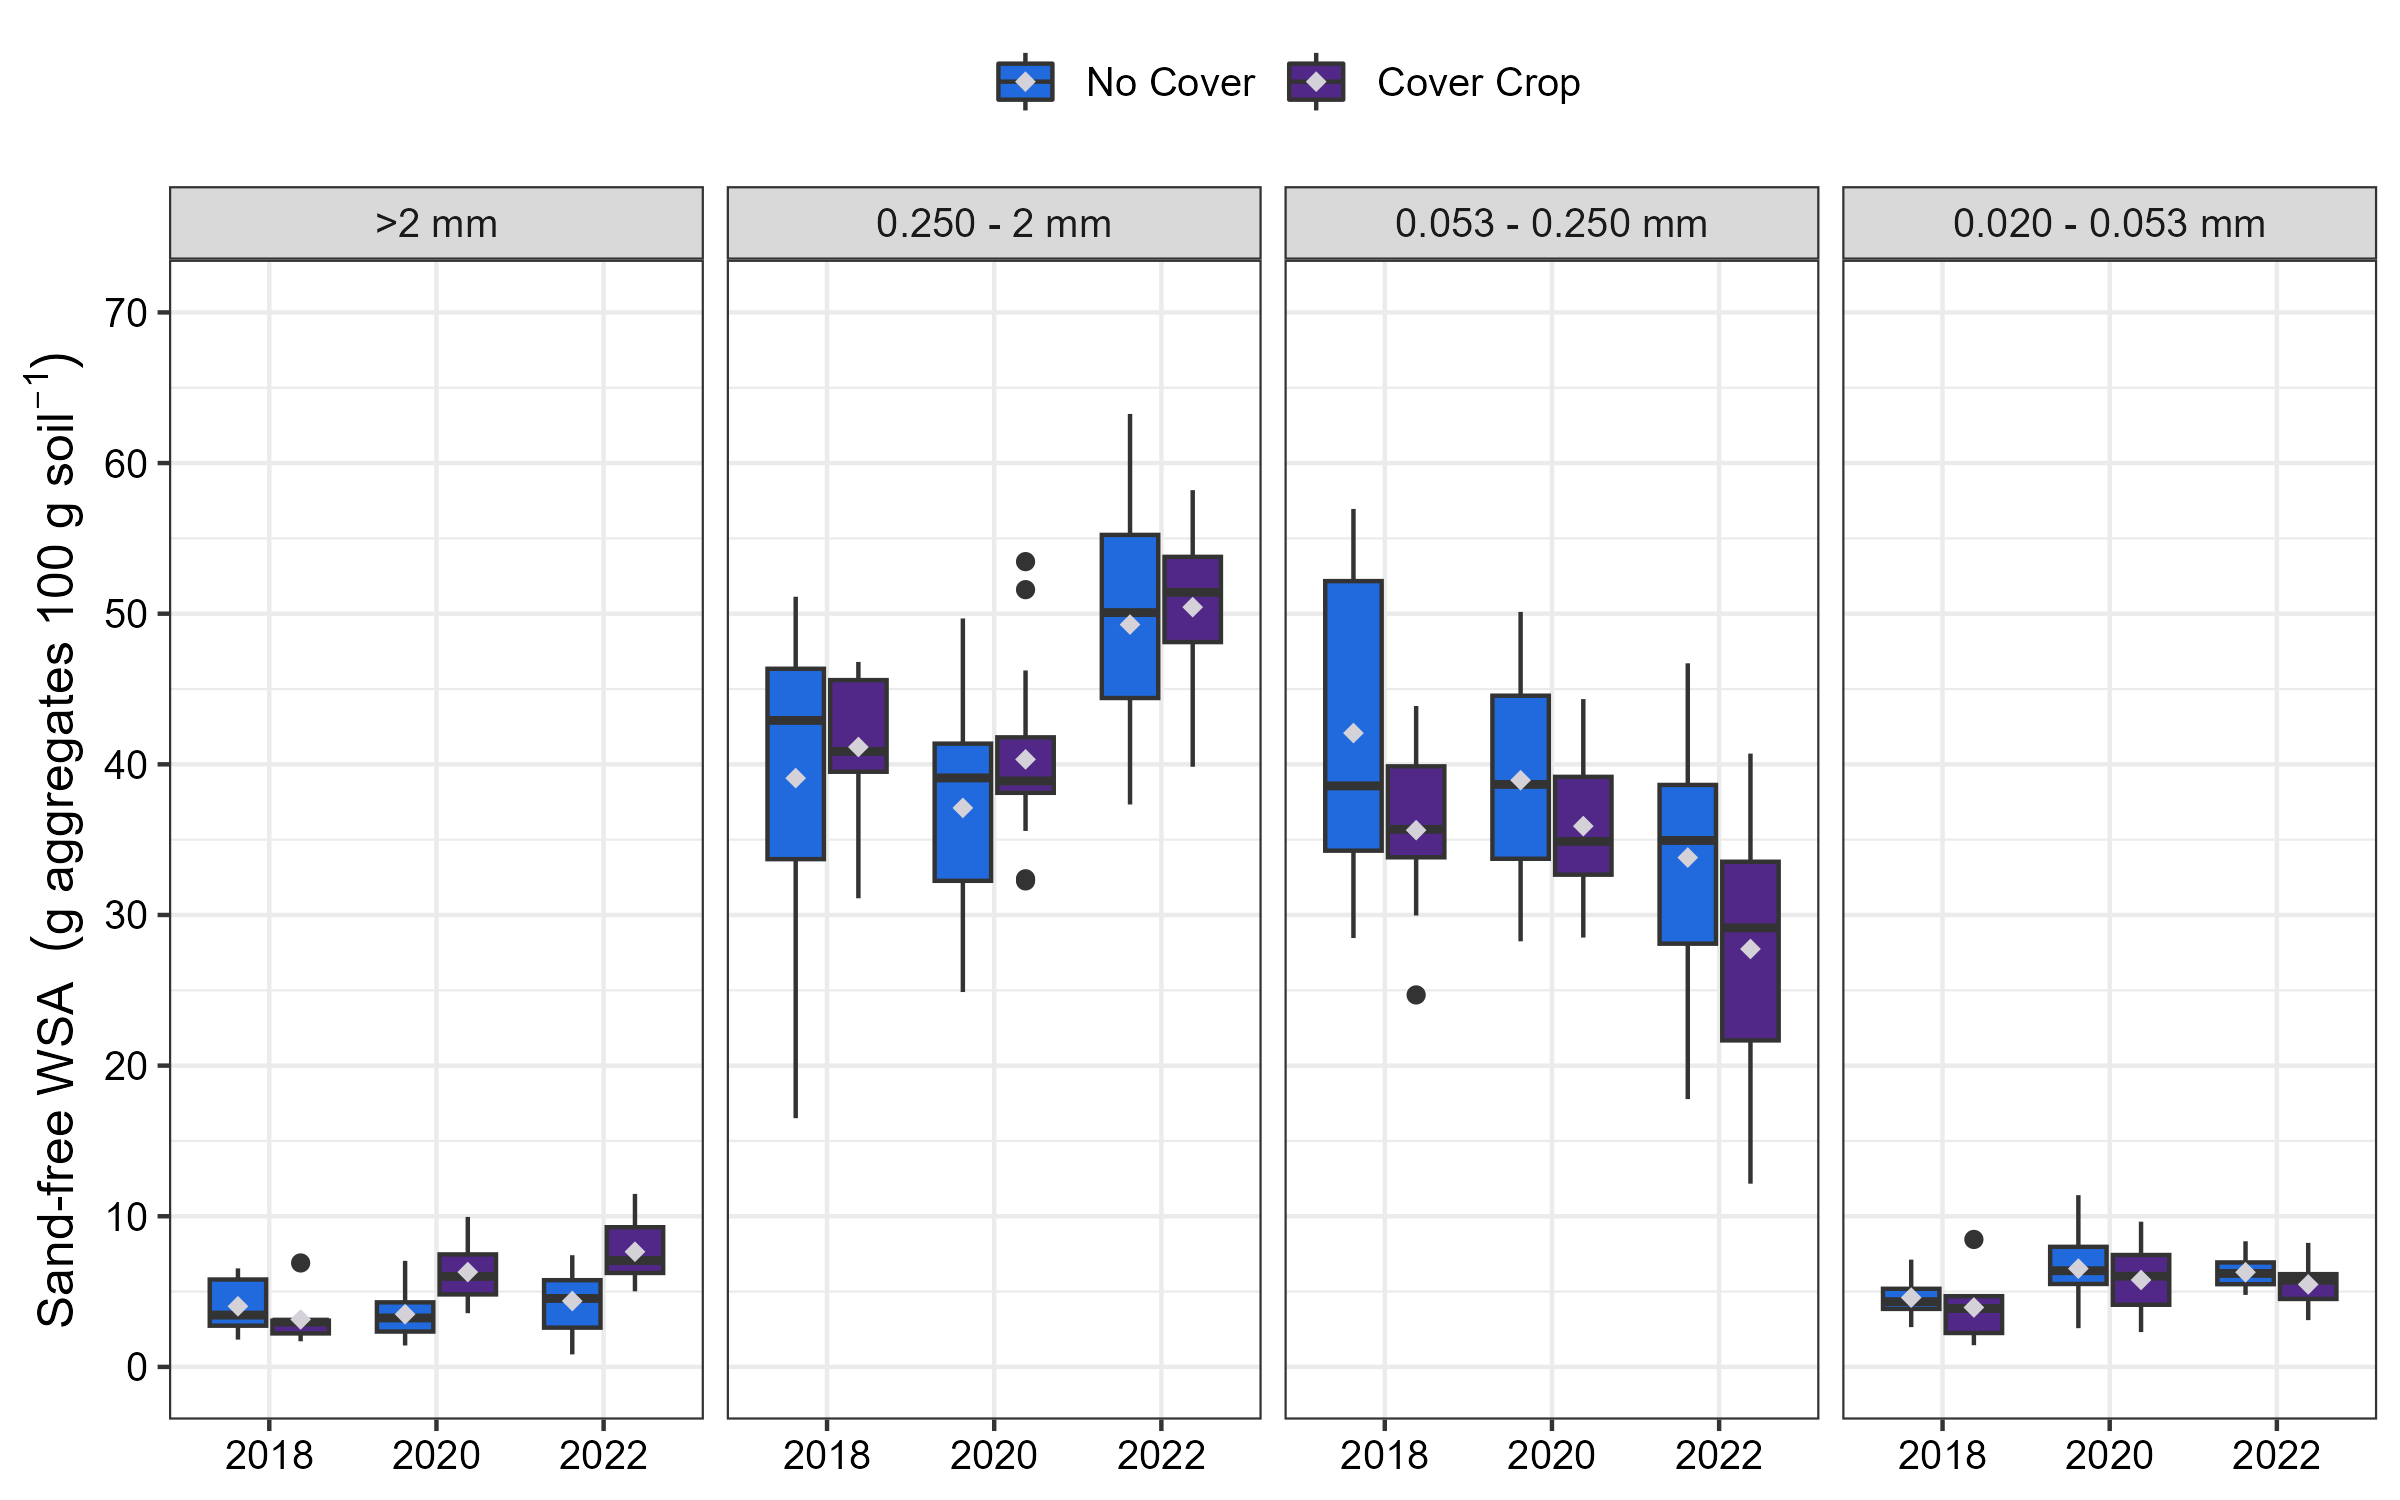
Figure 6. Sand-free water stable aggregate (WSA) distribution by treatment and year at 0-5 cm depth at Bucyrus. Means followed by the same letter are not different according to Fisher’s LSD test at the 5% level. Lowercase letters compare the interaction or year effect, while capitalized letters compare the treatment effect: *No cover, **Cover crop.
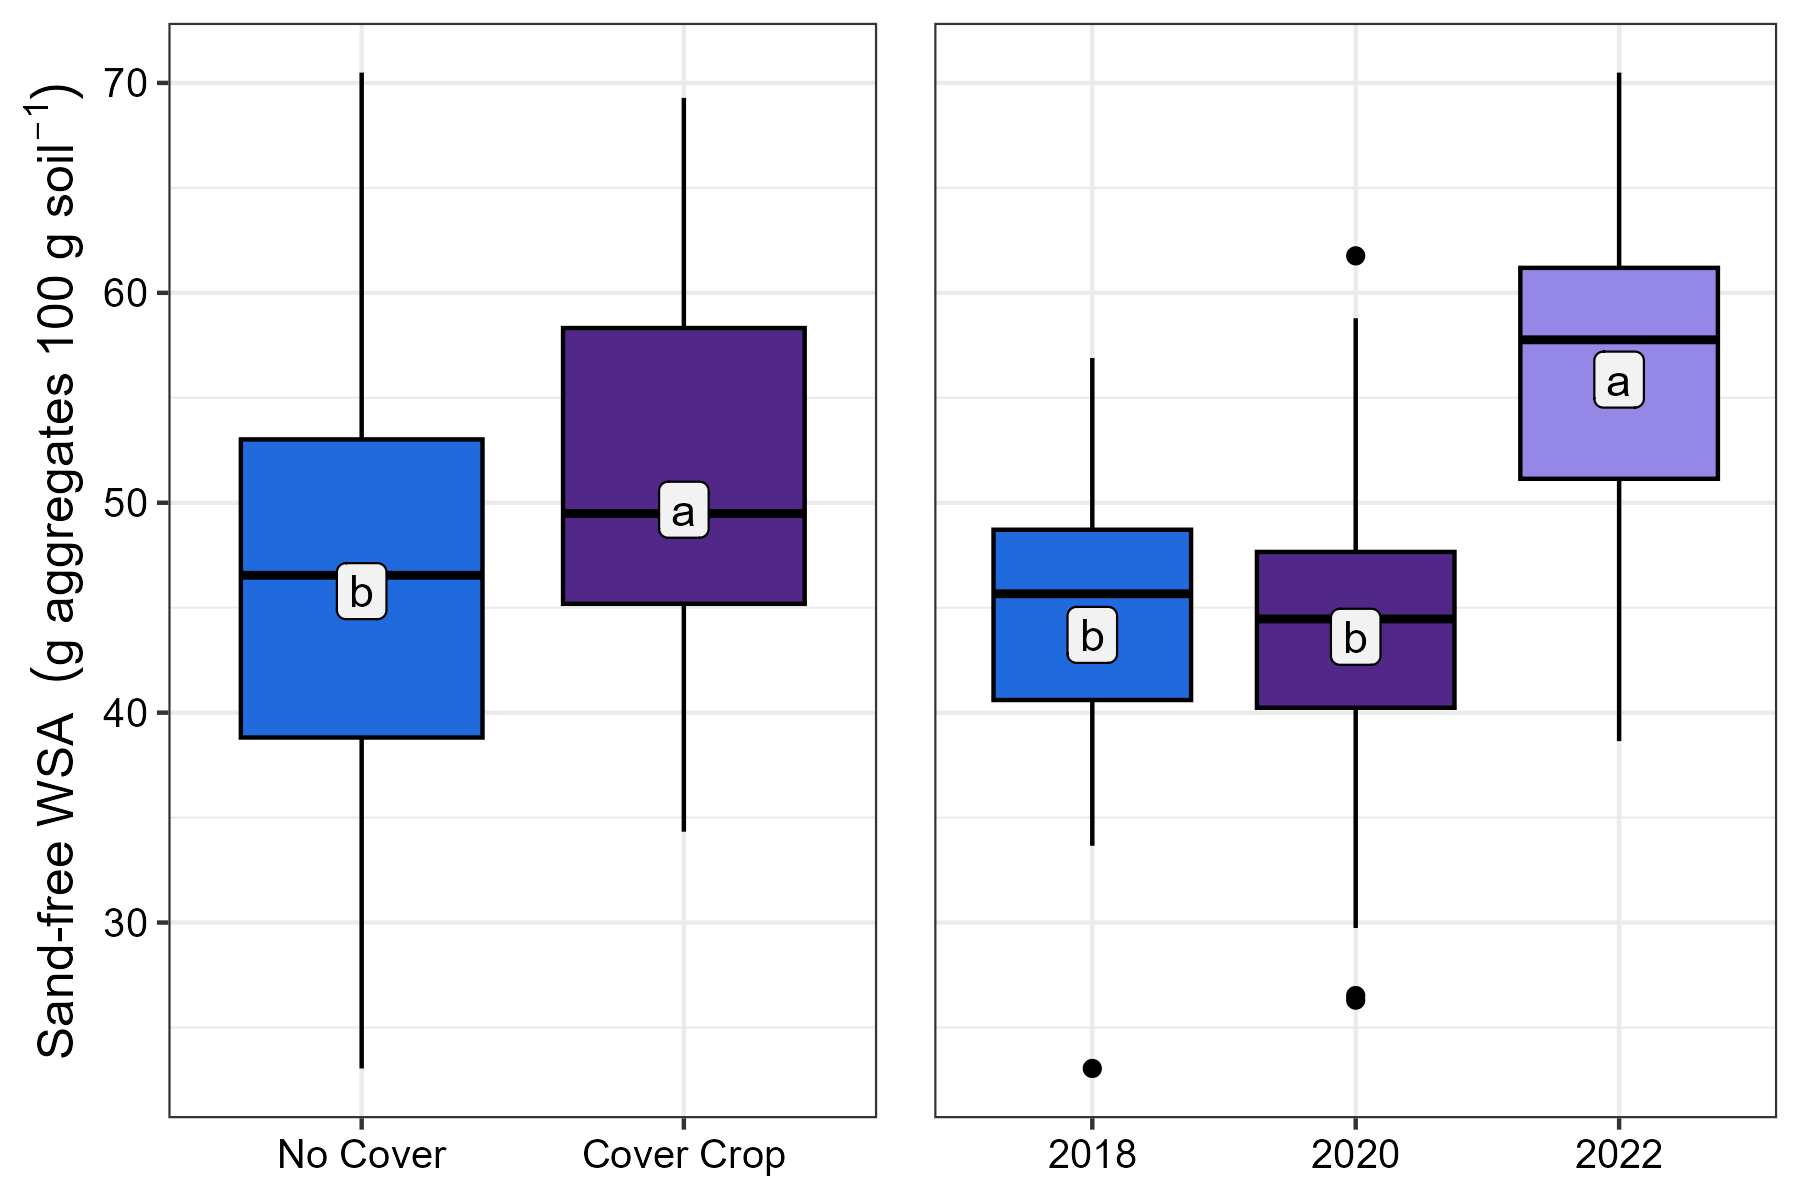
Figure 7. Macroaggregates by treatment and year at 0-5 cm depth at Bucyrus. Means followed by the same letter are not different according to Fisher’s LSD test at the 5% level.
Discussion
Soil microorganisms play an essential role in agroecosystems and have been recognized as a critical component of soil health, often serving as indicators for assessing soil health (Ashworth et al., 2017; Fierer et al., 2021; Kim et al., 2020). In general, cover cropping led to an overall increase in all microbial parameters at the 0-5 cm soil depth, with the extent of this increase varying depending on the site location due to environmental properties such as SOC and cropping system intensity and diversity. Muhammad et al. (2021) also found increased soil microbial community abundance with CCs compared to no CCs. At Bucyrus, the increase in microbial biomass, Gram+, Gram-, and actinomycetes was increased by the poultry litter application. In a study from (Acosta-Martínez & Harmel, 2006), higher microbial biomass and peak area of fatty acid methyl ester (FAMEs) was attributed to poultry litter application and its nutrient richness. Moreover, CCs enhanced this effect, resulting in higher microbial abundance and enzyme activity than NC. This effect was most likely provided by the additional plant C provided by CCs (Campos et al., 2011; Kim et al., 2020).
β-glucosidase, NAG, AcidP, and ArylS activity increased with time and CCs at 0-5 cm at all sites, corroborating with the findings of other studies (Mbuthia et al., 2015; Pires et al., 2020). These findings are likely associated with the quantity and diversity of crop residues and the proportion of readily decomposable organic materials reintroduced into the soil in response to the inclusion of CCs (Chavarría et al., 2016). β-glucosidase catalyzes the decomposition of cellulose; hence its higher activity may be explained by the SOC content (H. Liu et al., 2016). Furthermore, our study agrees with the study of Pires et al. (2020) that βG may be considered a good biological soil health indicator due to its quick response to changes in soil management. Enzyme activity can pose challenges as a soil health indicator when it is not adequately interpreted within its proper context. According to (Margenot & Wade, 2023), there is a reductionist assumption that fertilization always attenuates or inhibits soil enzyme activity, mainly phosphomonoesterase (PME). For instance, P fertilizer can increase overall crop growth and thus soil organic matter, which may increase the activity of PME (Margenot et al., 2017). In this context, higher enzyme activity can be interpreted as nutrient deficiency (feedback inhibition) or greater microbial activity and, thus increased rates of nutrient cycling (Margenot & Wade, 2023). In our study, overall enzyme activity followed SOC and microbial biomass increases as affected by CCs, demonstrating a linkage with possibly higher nutrient cycling rates (Six et al., 2000). Nonetheless, we also observed a decrease in AcidP activity at the 5-15 cm and 15-30 cm depths over time where poultry litter was applied (Bucyrus), indicating a potential P feedback inhibition despite the concurrent increase in SOC and microbial biomass.
Despite the differences in precipitation and plant biomass production among sites (Chapter 3), CC consistently increased the amount of WSA >2 mm and 2- 0.250 mm relative to NC after 5 yrs. Similar results have been reported in the literature by several authors (Blanco‐Canqui & Jasa, 2019; Blanco‐Canqui & Ruis, 2020; Liu et al., 2005; Nascente et al., 2015; Wood & Bowman, 2021). In a study conducted by Liu et al. (2005), CCs such as cereal rye and annual ryegrass increased the amount of WSA. Likewise, Dapaah & Vyn (1998) found that soil aggregate stability was greater following CC than under NC. In a review of CC impacts on soil physical properties, Blanco-Canqui & Ruis (2020) reported that CCs increased the percentage of macroaggregates up to 22% and MWD up to 95%. In most cases, the increase in macroaggregation was reported to be directly linked to increased SOC (e.g., humus) and root biomass.
References
Acosta-Martínez, V., & Harmel, R. D. (2006). Soil microbial communities and enzyme activities under various poultry litter application rates. Journal of Environmental Quality, 35(4), 1309–1318. https://doi.org/10.2134/jeq2005.0470
Ashworth, A. J., DeBruyn, J. M., Allen, F. L., Radosevich, M., & Owens, P. R. (2017). Microbial community structure is affected by cropping sequences and poultry litter under long-term no-tillage. Soil Biology and Biochemistry, 114, 210–219. https://doi.org/10.1016/j.soilbio.2017.07.019
Blanco‐Canqui, H., & Jasa, P. J. (2019). Do grass and legume cover crops improve soil properties in the long term? Soil Science Society of America Journal, 83(4), 1181–1187. https://doi.org/10.2136/sssaj2019.02.0055
Blanco‐Canqui, H., & Ruis, S. J. (2020). Cover crop impacts on soil physical properties: A review. Soil Science Society of America Journal, 84(5), 1527–1576. https://doi.org/10.1002/saj2.20129
Campos, B. C. D., Amado, T. J. C., Bayer, C., Nicoloso, R. D. S., & Fiorin, J. E. (2011). Carbon stock and its compartments in a subtropical oxisol under long-term tillage and crop rotation systems. Revista Brasileira de Ciência Do Solo, 35(3), 805–817. https://doi.org/10.1590/S0100-06832011000300016
Chavarría, D. N., Verdenelli, R. A., Serri, D. L., Restovich, S. B., Andriulo, A. E., Meriles, J. M., & Vargas-Gil, S. (2016). Effect of cover crops on microbial community structure and related enzyme activities and macronutrient availability. European Journal of Soil Biology, 76, 74–82. https://doi.org/10.1016/j.ejsobi.2016.07.002
Dapaah, H. K., & Vyn, T. J. (1998). Nitrogen fertilization and cover crop effects on soil structural stability and corn performance. Communications in Soil Science and Plant Analysis, 29(17–18), 2557–2569. https://doi.org/10.1080/00103629809370134
Fierer, N., Wood, S. A., & Bueno De Mesquita, C. P. (2021). How microbes can, and cannot, be used to assess soil health. Soil Biology and Biochemistry, 153, 108111. https://doi.org/10.1016/j.soilbio.2020.108111
Gavlak, R. G., Horneck, D. A., & Miller, R. O. (2005). Soil, plant and water reference methods for the Western Region. https://api.semanticscholar.org/CorpusID:130863153
Hothorn, T., Bretz, F., & Westfall, P. (2008). Simultaneous inference in general parametric models. Biometrical Journal, 50(3), 346–363. https://doi.org/10.1002/bimj.200810425
Johnson, J. M. ‐F., Allmaras, R. R., & Reicosky, D. C. (2006). Estimating source carbon from crop residues, roots and rhizodeposits using the national grain‐yield database. Agronomy Journal, 98(3), 622–636. https://doi.org/10.2134/agronj2005.0179
Kim, N., Zabaloy, M. C., Guan, K., & Villamil, M. B. (2020). Do cover crops benefit soil microbiome? A meta-analysis of current research. Soil Biology and Biochemistry, 142, 107701. https://doi.org/10.1016/j.soilbio.2019.107701
Lenth, R. V. (2023). emmeans: Estimated Marginal Means, aka Least-Squares Means. https://CRAN.R-project.org/package=emmeans
Liu, A., Ma, B. L., & Bomke, A. A. (2005). Effects of cover crops on soil aggregate stability, total organic carbon, and polysaccharides. Soil Science Society of America Journal, 69(6), 2041–2048. https://doi.org/10.2136/sssaj2005.0032
Margenot, A. J., Sommer, R., Mukalama, J., & Parikh, S. J. (2017). Biological P cycling is influenced by the form of P fertilizer in an Oxisol. Biology and Fertility of Soils, 53(8), 899–909. https://doi.org/10.1007/s00374-017-1226-9
Margenot, A. J., & Wade, J. (2023). Getting the basics right on soil enzyme activities: A comment on Sainju et al. (2022). Agrosystems, Geosciences & Environment, 6(3), e20405. https://doi.org/10.1002/agg2.20405
Mbuthia, L. W., Acosta-Martínez, V., DeBruyn, J., Schaeffer, S., Tyler, D., Odoi, E., Mpheshea, M., Walker, F., & Eash, N. (2015). Long term tillage, cover crop, and fertilization effects on microbial community structure, activity: Implications for soil quality. Soil Biology and Biochemistry, 89, 24–34. https://doi.org/10.1016/j.soilbio.2015.06.016
Mikha, M. M., & Rice, C. W. (2004). Tillage and manure effects on soil and aggregate-associated carbon and nitrogen. Soil Science Society of America Journal, 68(3), 809–809. http://dx.doi.org/10.2136/sssaj2004.8090.
Muhammad, I., Wang, J., Sainju, U. M., Zhang, S., Zhao, F., & Khan, A. (2021). Cover cropping enhances soil microbial biomass and affects microbial community structure: A meta-analysis. Geoderma, 381, 114696. https://doi.org/10.1016/j.geoderma.2020.114696
Nascente, A. S., Li, Y., & Crusciol, C. A. C. (2015). Soil aggregation, organic carbon concentration, and soil bulk density as affected by cover crop species in a no-tillage System. Revista Brasileira de Ciência Do Solo, 39(3), 871–879. https://doi.org/10.1590/01000683rbcs20140388
NCR221. (2015). Recommended chemical soil test procedures for the North Central Region. In North Central Regional Research Publication No. 221 (Revised) (Vol. 221, Issue 221, p. 76). Missouri Agricultural Experiment Station. https://extension2.missouri.edu/sb1001
Pebesma, E., & Bivand, R. (2023). Spatial Data Science: With Applications in R (1st ed.). Chapman and Hall/CRC. https://doi.org/10.1201/9780429459016
Pinheiro, J., Bates, D., DebRoy, S., Sarkar, D., & R Core Team. (2017). nlme: Linear and nonlinear mixed effects models. R Package Version 3.1-131, Https://CRAN.R-Project.Org/Package=nlme.
Peel, M. C., Finlayson, B. L., & McMahon, T. A. (2007). Updated world map of the Köppen-Geiger climate classification. Hydrology and Earth System Sciences, 11, 1633–1644. https://doi.org/10.1127/0941-2948/2006/0130
Pires, C. A., Amado, T. J. C., Reimche, G., Schwalbert, R., Sarto, M. V. M., Nicoloso, R. S., Fiorin, J. E., & Rice, C. W. (2020). Diversified crop rotation with no-till changes microbial distribution with depth and enhances activity in a subtropical Oxisol. European Journal of Soil Science, 71(6), 1173–1187. https://doi.org/10.1111/ejss.12981
Prince, S. D., Haskett, J., Steininger, M., Strand, H., & Wright, R. (2001). Net primary production of U.S. Midwest croplands from agricultural harvest yield data. Ecological Applications, 11(4), 1194–1205. https://doi.org/10.1890/1051-0761(2001)011[1194:NPPOUS]2.0.CO;2
R Core Team. (2023). R: A language and environment for statistical computing. R: A language and environment for statistical computing. R Foundation for Statistical Computing, Vienna, Austria.
Ruiz, A., Trifunovic, S., Eudy, D. M., Sciarresi, C. S., Baum, M., Danalatos, G. J. N., Elli, E. F., Kalogeropoulos, G., King, K., Dos Santos, C., Thies, A., Pico, L. O., Castellano, M. J., Schnable, P. S., Topp, C., Graham, M., Lamkey, K. R., Vyn, T. J., & Archontoulis, S. V. (2023). Harvest index has increased over the last 50 years of maize breeding. Field Crops Research, 300, 108991. https://doi.org/10.1016/j.fcr.2023.108991
Schapaugh, W. T., & Wilcox, J. R. (1980). Relationship between harvest indices and other plant characteristics in soybean. Crop Science, 20(4), 529–533. https://doi.org/10.2135/cropsci1980.0011183X002000040028x
Sharma, R. C., & Smith, E. L. (1987). Effects of seeding rates on harvest index, grain yield, and biomass yield in winter wheat. Crop Science, 27(3), 528–531. https://doi.org/10.2135/cropsci1987.0011183X002700030021x
Six, J., Elliott, E. T., & Paustian, K. (2000). Soil macroaggregate turnover and microaggregate formation: A mechanism for C sequestration under no-tillage agriculture. Soil Biology and Biochemistry, 32(14), 2099–2103. https://doi.org/10.1016/S0038-0717(00)00179-6
Soil Survey Staff. (2014). Kellogg soil survey laboratory methods manual. Soil Survey Investigations Report No. 42, Version 5.0. In Kellogg Soil Survey Laboratory Methods Manual.
Tabatabai, M. A. (1994). Soil Enzymes (1–5, pp. 775–833). Soil Science Society of America.
West, T. O., Brandt, C. C., Baskaran, L. M., Hellwinckel, C. M., Mueller, R., Bernacchi, C. J., Bandaru, V., Yang, B., Wilson, B. S., Marland, G., Nelson, R. G., Ugarte, D. G. D. L. T., & Post, W. M. (2010). Cropland carbon fluxes in the United States: Increasing geospatial resolution of inventory-based carbon accounting. Ecological Applications, 20(4), 1074–1086. https://doi.org/10.1890/08-2352.1
White, D. C., & Ringelberg, D. B. (1998). Signature lipid biomarker analysis. In O. University (Ed.), Techniques in Microbial Ecology (pp. 255–272). Oxford University Press.
White, P. M., & Rice, C. W. (2009). Tillage effects on microbial and carbon dynamics during plant residue decomposition. Soil Science Society of America Journal, 73(1), 138–138. https://doi.org/10.2136/sssaj2007.0384
Wood, S. A., & Bowman, M. (2021). Large-scale farmer-led experiment demonstrates positive impact of cover crops on multiple soil health indicators. Nature Food, 2(2), 97–103. https://doi.org/10.1038/s43016-021-00222-y
Yoder, R. E. (1936). A direct method of aggregate analysis of soils and a study of the physical nature of erosion losses. Soil Science Society of America Journal, B17: 165-165. https://doi.org/10.2136/sssaj1936.036159950b1720010046x
Educational & Outreach Activities
Participation summary:
- Soil health and cover crops field day in Bucyrus, KS, at the Guetterman Brothers Family Farms with 160 attendees
- Regenerative ag field day in Parsons, KS, at the K-State Southeast Research and Extension Center with 20 attendees.
- Cover crops and soil health field day at the Bayer Water Utilization Learning Center with 40 attendees.
- four publications of the soil health series: 1-What is soil health 2 - Biological Soil Health Indicators 3 - Physical Soil Health Indicators 4 - Chemical Soil Health Indicators
- 1 video about soil health produced. What is Soil Health? #1 (youtube.com)
- 1st Place Oral Presentation, Soil Health Community, American Society of Agronomy (ASA). 2022. Presentation: Cover crops boost the relationship between the soil microbial community and aggregates. Data from this grant was used.
- 1st Place 5-minute Presentation and Poster, Soil Education and Outreach, Soil Science Society of America (SSSA). 2022. Presentation: Using a root display to engage farmers and students toward sustainable agriculture.
- 5-minute and poster presentation in Baltimore (ASA-SSSA-CSSA). Engaging research and extension through soil health: building a network in Kansas.
- Oral presentation at the 22nd World Congress of Soil Science, July 31- August 5, Glasgow, Scotland. On-farm strategies for improving soil health: Building a network in Kansas - USA.
- Preventing the Next Dust Bowl (flatlandkc.org)
- Critical Soil Health Parameters to Improve Crop Production. Kansas Agricultural Experiment Station Research Reports: Vol. 9: Issue 2. https://doi.org/10.4148/2378-5977.8446
- Pires, C.B. (2023). CASH: Cover crops, agronomy, and soil health. Kansas Wheat Rx. 50 min long. Russel, KS.
- Pires, C.B. (2023). CASH: Cover crops, agronomy, and soil health. Kansas Wheat Rx. 50 min long. McPherson, KS.
Perspective of US farmers on collaborative on‐farm agronomic research | Agronomy Journal (wiley.com)
Project Outcomes
This project generated many research and extension outcomes. Besides being able to generate on-farm data to guide farmers on practices that improve soil health, this grant motivated us to conduct a national survey to understand the perspective of US farmers on agronomic on-farm research. We learned that farmers’ high trust in on-farm research outcomes can influence the adoption of sustainable practices. Limitations like time management and plot setup were identified in on-farm research, while strengths included practical knowledge gained and unbiased insights. Notably, a shift towards conservation practices has been made in the last 10 years, with cover crops and no-till at the forefront of these changes. We also found that farmers were 40% more likely to adopt practices supported by findings of on-farm research compared to off-farm ones, and farmers’ primary motivators for doing on-farm research were productivity and profitability. Insights of this nature have implications for fostering collaborations, addressing constraints, and maximizing the impact of on-farm research, offering guidance for sustainable agriculture progress in the U.S. and beyond. Results from this research survey can drive further policy and initiatives promoting on-farm research. This research survey was published in Agronomy Journal (Perspective of US farmers on collaborative on‐farm agronomic research | Agronomy Journal (wiley.com)). With this project, we also provide integrated extension and education efforts benefitting farmers in relation to sustainable agricultural practices and empowered farmers with knowledge and skills for sustaining and improving soil health on their farms.
One of the key knowledge gains from this project is the revelation that trust plays a key role in driving the adoption of sustainable practices among farmers. The high level of trust expressed by farmers in the outcomes of on-farm research shows its importance as a catalyst for the implementation of sustainable practices. This knowledge highlights the need for continued investment in on-farm research initiatives. Another significant knowledge gain pertains to the observed shift towards conservation practices, with cover crops and no-till farming emerging as prominent strategies over the past decade. Understanding the motivations behind this shift, such as the desire for increased productivity and profitability, provides valuable insights for tailoring extension and education efforts to meet farmers' evolving needs and priorities. Moreover, the finding that farmers are significantly more likely to adopt practices supported by on-farm research underscores the importance of effectively communicating research findings and fostering collaborative partnerships between researchers and farmers. We also learned about the importance of CCs in improving soil health, as evidenced by the increase in soil microbial biomass, bacteria, fungi, SOC, βG, and many other biological soil health indicators.