Final report for GNC21-328
Project Information
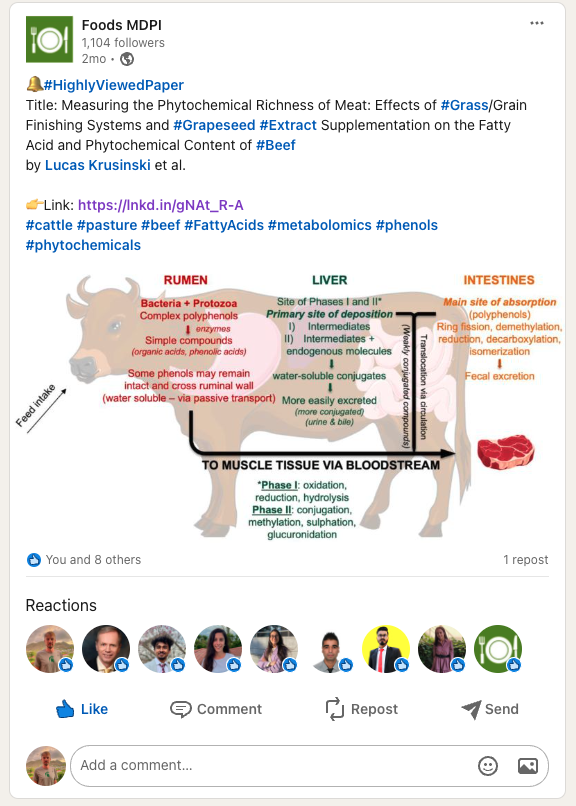
Beef producers in Northern Michigan are seeking to increase the supply of and demand for localized beef value chains. This project will build upon 2018 USDA NCR-SARE and M-AAA grants that are investigating how finishing systems impact beef quality and healthfulness in Michigan. Those projects focus on nutrient profile of fatty acid, mineral and vitamin (antioxidant) along with sensory and value chain outcomes. This proposal will build upon the nutrient composition analysis of the beef as it varies by finishing system and feed stuffs provided to the cattle by characterizing and profiling the impact of the finishing system on the polyphenolic/phytochemical content of the beef. There is appreciation in the literature that complex and biodiverse pasture composition will increase the presence and quantity of phytochemicals in milk and meat (Provenza et al., Front. Nutr., 19 March 2019). Yet, the presence of these phytochemicals in grass-finished beef products remains largely under appreciated in discussions of nutritional differences between grain-fed and pasture-raised (grass-fed) meat and dairy predominantly center around the lower n-6/n-3 fatty acid ratio and conjugated linoleic acid (CLA). The human intake of phytochemicals is linked to beneficial health outcomes and intake is thought to come primarily from fruit/vegetable intake and only occur in plants. However, many plant phytochemicals are concentrated in animal products, with more evidence in milk products (Prache et al., 2005 Small Rumin. Res. 59, 157–168; Carrillo et al., 2016 Sci. Rep. 6:25948). Therefore, the objective of this study is to characterize and compare the phytochemical, in particular, the polyphenolic content of beef resulting from different finishing systems. We will utilize previously collected beef samples from the 2018 UDSA NCR-SARE and M-AAA projects where we have beef samples from cattle finished on complex pasture systems, grain-finished and a positive control group supplemented with grape seed extract. Our lab has partnered with the Collaborative Mass Spectrometry Core (CMSC) at MSU and the van Vliet Lab at Utah State University to utilize cutting edge technology to profile and compare the phytochemical composition of the beef samples. The primary expected outcome is to demonstrate that the phytochemical/polyphenolic content of beef can be influenced by the finishing system to favor a profile that enhances human health when consumed. This will lead to increased consumer demand. This project has a very high likelihood of success using previously collected samples from funded USDA SARE projects with a team that is already working together as demonstrated by joint publications.
The primary expected outcome is to demonstrate that phytochemical/polyphenolic content of beef is influenced by the finishing system and by-product feeds to favor a profile that enhances human health when consumed. At the same time, this knowledge will lead to marketing strategies for grass-finished beef products. Although Michigan-focused, this value chain project is not geographically limited and is scalable to the entire North Central Region.
Learning Outcomes Research Project:
1) Demonstrate that the phytochemical/polyphenolic content of beef varies by finishing system/feeds.
2) Compare the phytochemical/polyphenolic richness of beef from grass-finished vs grain-finished and the grape seed extract supplemented groups.
3) Increase farmer knowledge of how the finishing system influences the nutrient density of beef.
4) Provide scientific knowledge to increase marketing potential of grass-fed/finished beef affordable for consumers.
Action Outcomes:
1) Research will be published comparing the phytochemical/polyphenolic richness of beef from grass-finished vs grain-finished and the grape seed extract supplemented groups.
2) Research will be combined with previous nutritional composition data collected via the NRC-SARE project.
3) New and more detailed nutritional composition of beef influenced by finishing-system will be created.
4) Farmers will use the knowledge to decide what they want to nutritional content of their final beef product to be.
5) Farmers will be able to choose a finishing system to create the most optimally nutrient dense beef product.
6) Farmers will use this new knowledge to market the beef based on nutrient density and finishing system.
Cooperators
- (Researcher)
Research
Please note that all materials and methods were described in the published manuscript Krusinski et al. (2023) https://www.mdpi.com/2304-8158/12/19/3547
Experimental design and diet composition:
- This two-year study (2019 and 2020) was conducted at the Upper Peninsula Research and Extension Center (UPREC) (Michigan State University) located in Chatham, MI (latitude: 46°20’ N, longitude: 86°55’ W; elevation: 271 m).
- Three treatments were tested: 1) a complex pasture mixture (GRASS), a total mixed feedlot ration (GRAIN), and a total mixed feedlot ration supplemented with 5% (dry matter - DM) GSE for the last 30 days of finishing (GRAPE). The experimental design for the GRASS and GRAIN groups was previously described (Krusinski et al. 2022).
- Forty (n = 40) and 32 Red Angus steers (n = 32) (14-20 months of age) were randomly allocated to the diets in 2019 and 2020, respectively. Thirty steers in 2019 and 22 steers in 2020 were randomly stratified and allocated to one of three pens for each of the GRASS and GRAIN treatments (for each diet and each year, n = 5 animals per pen, three pens). This design was followed in 2019, but due to lower male births in 2020, only two groups (one group with three steers and another group with four steers) were formed for the GRAIN diet. For GRAPE, ten Red Angus steers each year were kept in one same feedlot pen.
- For this project, for each year, nine samples per diet were randomly chosen. For GRASS and GRAIN in 2019, three samples per pen per year were randomly picked. The same design was followed for GRASS in 2020. Since only two pens for GRAIN were formed in 2020 due to lower male births, all seven samples were picked with an additional two random samples from 2019. Since GRAPE samples all came from the same pen, nine samples for each year were randomly chosen. The total number of beef samples analyzed for this study was 54 (n = 54).
- Plant species found in GRASS were meadow fescue (Schedonorus pratensis (Huds.) P. Beauv.), red clover (Trifolium pratense L.), timothy grass (Phleum pratense), alfalfa (Medicago sativa), white clover (Trifolium repens L.), birdsfoot trefoil (Lotus corniculatus), chicory (Cichorium intybus), orchardgrass (Dactylis glomerata L.), and dandelion (Taraxacum oficinale L.).
- The GRAIN diet was composed of orchardgrass hay, dry corn, high moisture corn, and pellets (36% crude protein).
- For GRAPE, 5% of GSE (DM basis) was added to GRAIN during the last 30 days of the finishing period. GSE was obtained from Pioneer Enterprises (Lewiston, ID, USA).
Sample collection:
- Feed samples were collected every two weeks (GRAPE samples were collected at the same frequency as GRAIN samples).
- For fatty acid analysis, the number of feed samples was 21 GRASS, 15 GRAIN, and 7 GRAPE in 2019 and 24 GRASS, 10 GRAIN, and 5 GRAPE in 2020. Since these feed samples were also analyzed as part of other projects, less samples were left for phytochemical analysis: 11 GRAIN samples and 4 GRAPE samples were analyzed. Unfortunately, no GRASS samples were left for phytochemical analysis. GRASS samples underwent multiple runs as part of a series of previous experiments, leaving little to no samples for phytochemical analysis.
- For beef samples collection, each year animals were harvested on the same day (late September in 2019 and early October in 2020) in a United States Department of Agriculture (USDA) regulated facility (16-18 months old for GRAIN and GRAPE and 24-26 months old for GRASS), and ribeye samples were collected between the 11th and 13th rib on the left side of the carcass.
- Beef samples were then further processed at the Michigan State University Meat Laboratory; steaks were cut in 1 ´ 1 cm cubes and flash frozen with liquid nitrogen. Beef samples were stored at -80 °C until further analysis.
Fatty acids:
Fatty acids in beef and feed samples were analyzed according to Krusinski et al. (2022) https://doi.org/10.3390/foods11213451
- Lyophilized and ground feed samples and minced beef samples were mixed with 8 mL 4:1 ethyl acetate:methanol (v/v) and underwent extraction in a CEM Mars 6 microwave digestion system equipped with a 24-vessel rotor and GlassChem tubes (CEM Corp., Matthews, NC, USA).
- Samples were then filtered using Whatman filter paper grade 597 into another set of test tubes containing 3.5 mL HPLC water and centrifuged to separate the top organic layer.
- The top layer was transferred to another set of tubes and evaporated under nitrogen gas. Samples were reconstituted with 4:1 dichloromethane:methanol (v/v) to reach a concentration of 20 mg of oil/mL.
- For the creation of FA methyl esters (FAMEs), 100 mL containing 2 mg of oil was resuspended in toluene with 20 mg of internal standard (methyl 12-tridecenoate, U-35M, Nu-Chek Prep, Elysian, MN, USA).
- After resuspending, 2 mL of 0.5 N anhydrous potassium methoxide was added before being heated at 50 °C for 10 min.
- Then, 3 mL of methanolic HCl (5%) was added before heating the samples at 80 °C for 10 min.
- After cooling down, 2 mL of HPLC water and 2 mL of hexane were added, and samples were centrifuged at 2,500 RPM for 5 min.
- The top layer was removed and dried under nitrogen gas.
- FAMEs were resuspended in 1 mL of isooctane (final concentration was 2 mg/mL).
- Samples were then transferred to gas chromatography-mass spectrometry (GC-MS) vials with glass inserts.
- For FAMEs quantification, a PerkinElmer (Waltham, MA, USA) 680/600S GC-MS in electron impact mode (70 eV) was used. The GC-MS was equipped with a HP-88 column (100 m, 0.25 mm ID, 0.2 mM film thickness) from Agilent Technologies (Santa Clara, CA, USA).
- One mL of feed samples was injected (GC temperature: 250 °C).
- One mL of beef samples was injected twice (20:1 split) (GC temperatures: 175 °C and 150 °C). For detailed temperature settings, please see Krusinski et al. (2022). A third injection in splitless mode followed for beef samples.
- The carrier gas was helium (1 mL/min), and MS data were recorded in full scan mode (m/z 70-400 amu).
- FAMEs identification was achieved using MassLynx V4.1 SCN 714 (Water Corp., Milford, MA, USA). Retention time and EI mass fragmentation were compared to a reference standard containing Supelco 37 Component FAME Mix with mead acid, docosatetraenoic acid, n-3 DPA, n-6 DPA, and palmitelaidic acid (Cayman Chemical, Ann Arbor, MI, USA). The CLA standard UC-59M from Nu-Chek Prep (Elysian, MN, USA) was used for the identification of CLA isomers.
- For FAs not included in the standards, elution order and EI mass fragmentation were used for identification. FAMEs were quantified by utilizing a standard curve containing reference and internal standards.
Vitamin E and mineral analysis of beef samples:
- For vitamin E, 1 g of beef was thoroughly mixed with 5 mL of water.
- Proteins were precipitated with ethanol, and fat-soluble vitamins were extracted using hexane.
- Samples were centrifuged and the top layer was evaporated.
- Evaporated samples were resuspended in the chromatographic mobile phase and placed in vials.
- A six-point curve was made by serial diluting a vitamin E solution (Sigma-Aldrich, St. Louis, MO, USA) in ethanol (50 mg/mL to 0.2 mg/mL).
- A Waters Acquity system equipped with a Symmetry C18, 1.7 mm, 2.1 x 50 mm analytical column and Water Empower Pro Chromatography Manager software (Water Corp., Milford, MA, USA) were used for chromatography analysis.
- The mobile phase was acetonitrile:methylene chloride:methanol (70:20:10, v/v/v) and the flow rate was 0.5 mL/min. Detection was performed at UV absorption 292 nm.
- For mineral analyss, the Agilent 7900 Inductivity Coupled Plasma-Mass Spectrometer (ICP-MS) (Agilent Technologies, Inc., Santa Clara, CA, USA) was used, with a six-point calibration curve and bovine liver and mussel standards (National Institute of Standards and Technology, Gaithersburg, MD, USA).
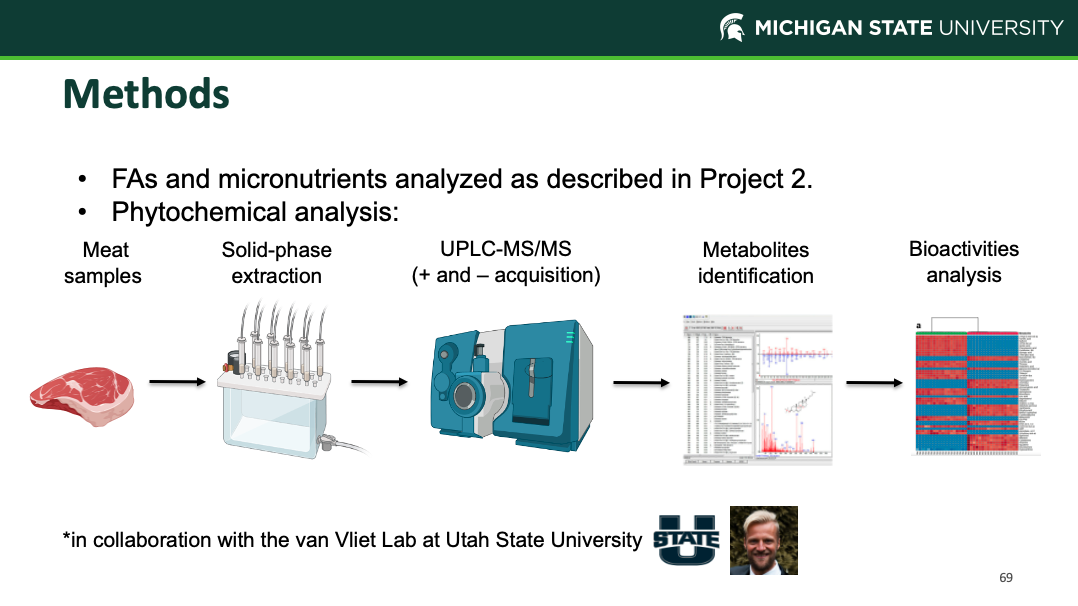
Polyphenolic profiling:
- Feed samples underwent freeze-drying for 18.5 h using a Harvest Right Home Freeze Dryer (Harvest Right, North Salt Lake, UT, USA) and were subsequently ground through a 1 mm screen in a Wiley mill (Arthur H. Thomas, Philadelphia, PA, USA) with dry ice.
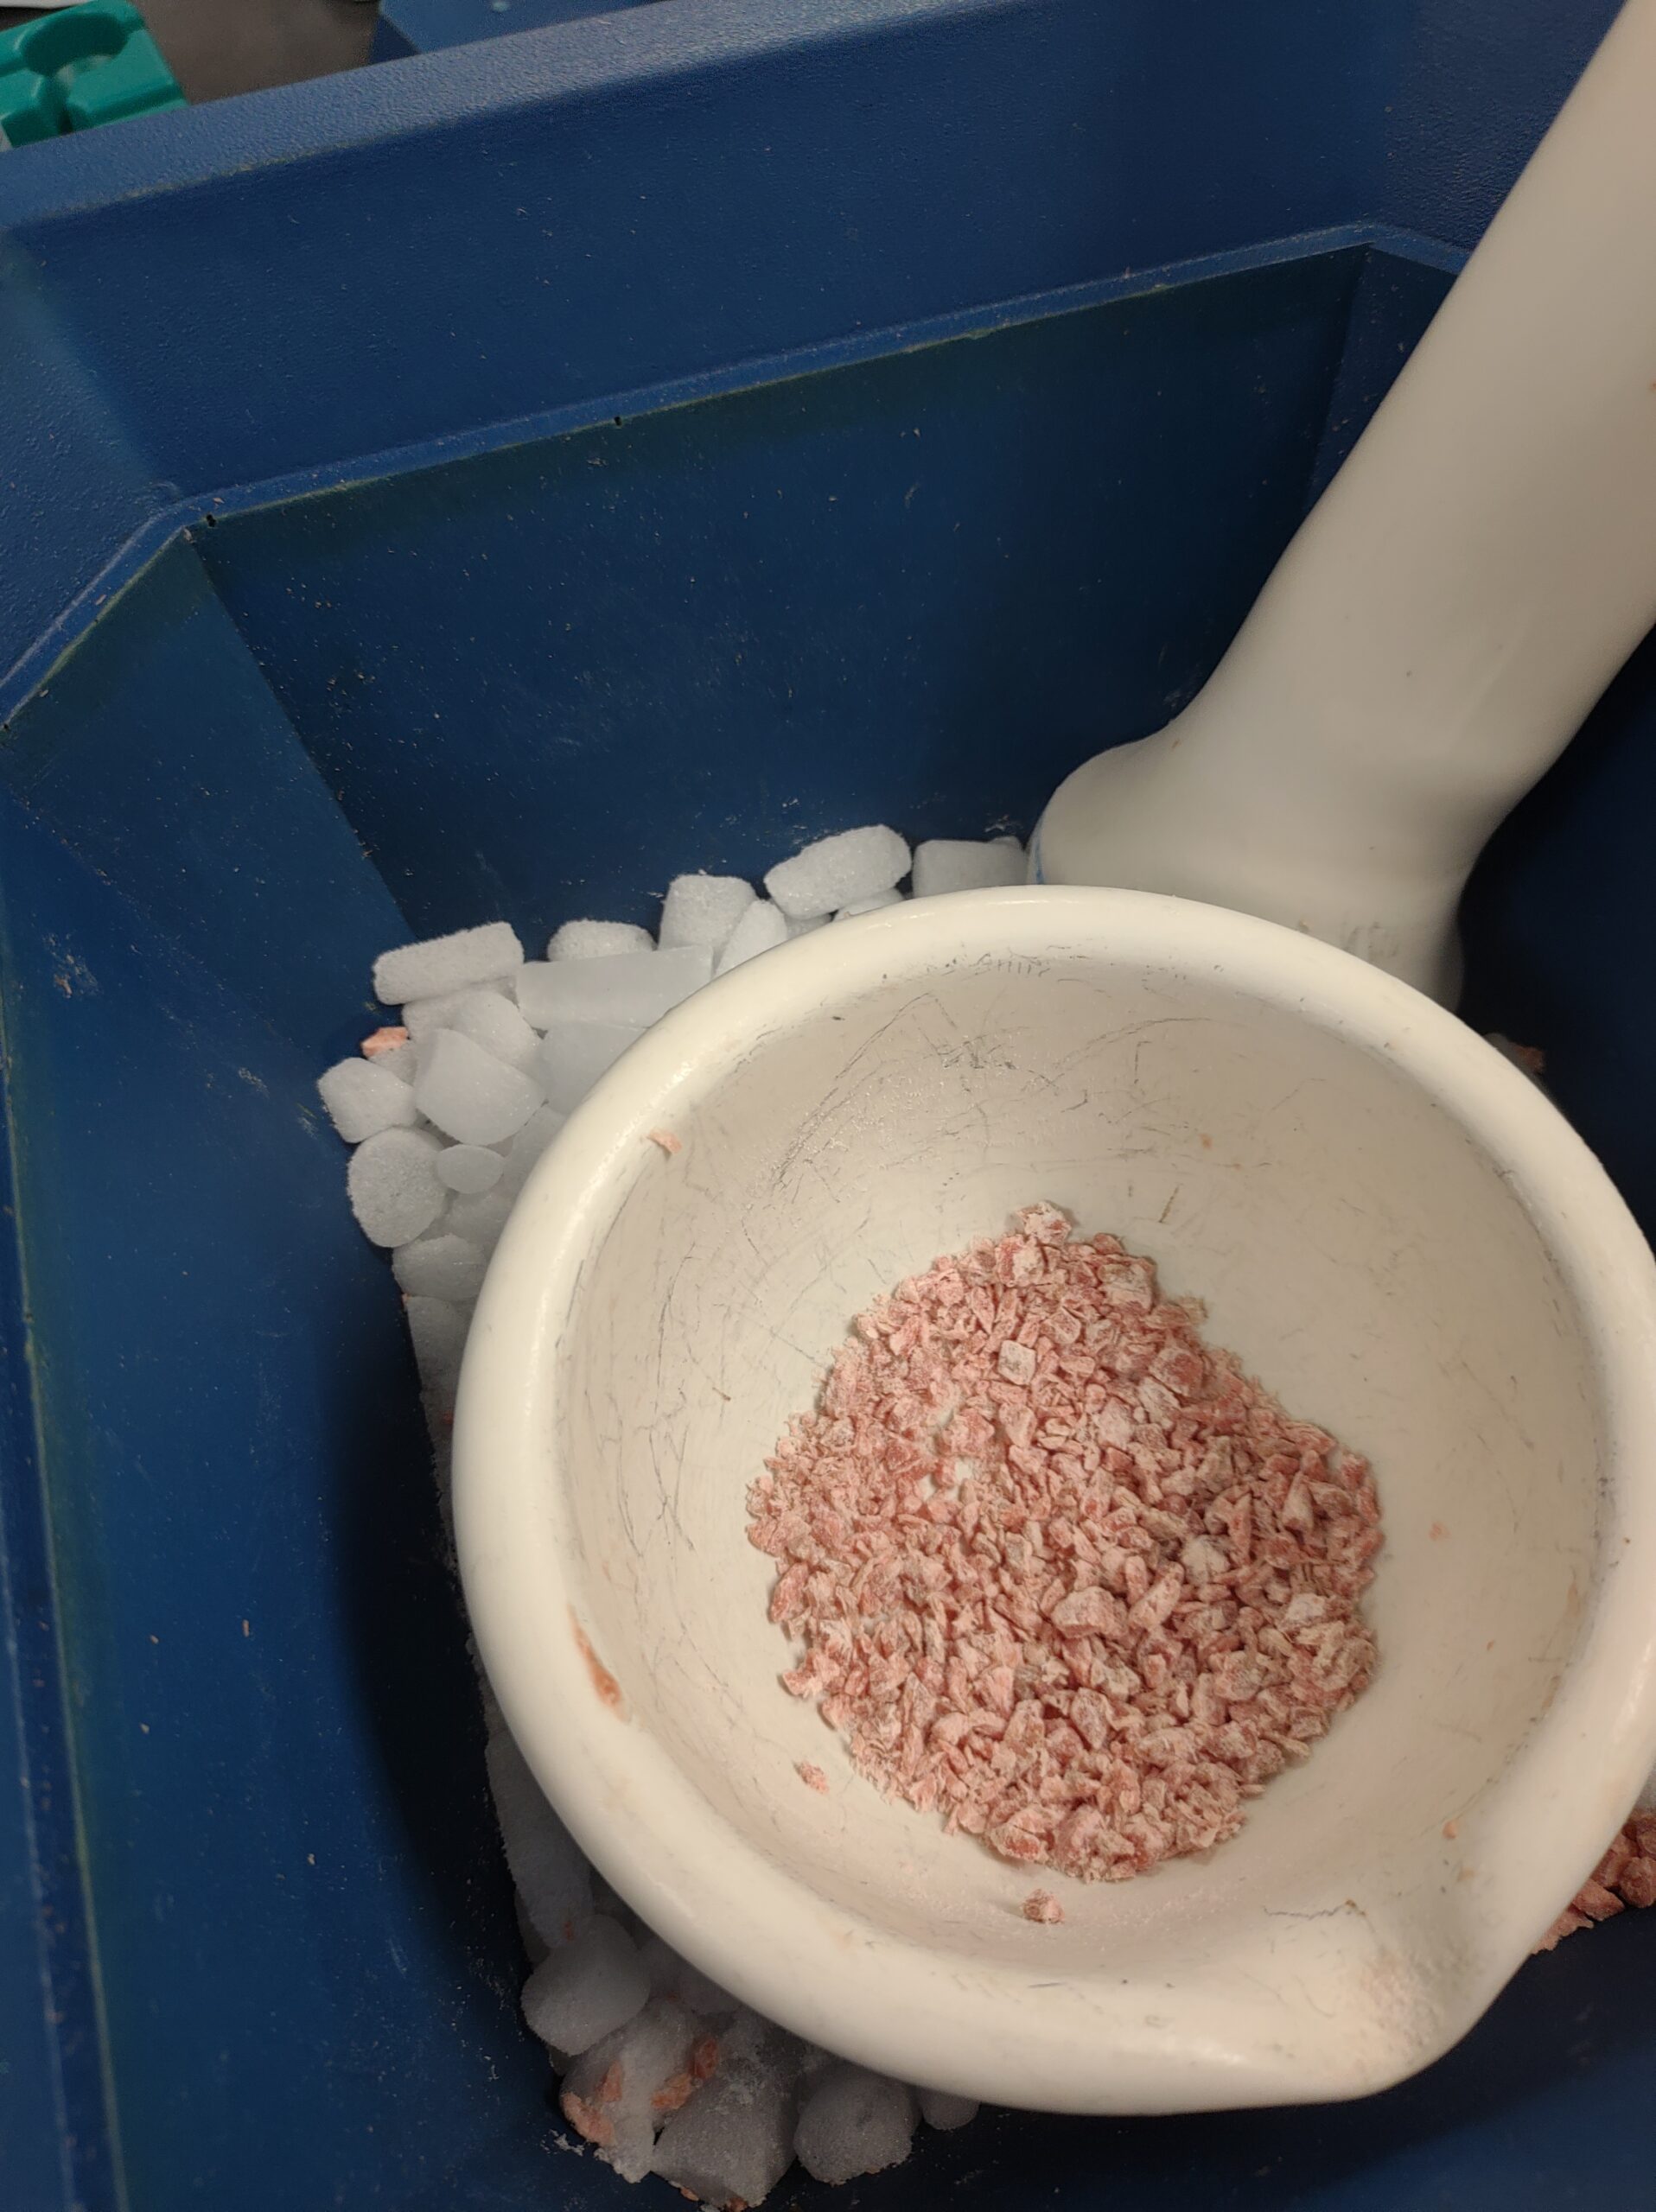
- Beef samples were minced and pulverized on dry ice using a mortar and pestle (see picture).
- UHP-LC-MS-grade acetonitrile, methanol, DMSO, formic acid and water (Supelco LiChrosolv®) were ordered from Sigma-Aldrich (St. Louis, MO, USA).
- A QReSS™ internal standards kit, containing a mixture of isotopically-labeled metabolites, was purchased from Cambridge Isotope Laboratories (Tewksbury, MA, USA).
- Purified external standards of compounds were obtained from Sigma-Aldrich (St. Louis, MO, USA) and/or Cayman Chemical (Ann Arbor, MI, USA).
- Briefly, 200 mg of pulverized beef and 50 mg of feed samples were mixed with 1000 mL and 500 mL, respectively of methanol.
- At this time, 10 mL of QReSS™ internal standard (Cambridge Isotope Laboratories, Inc., Tewksbury, MA, USA) were added to the samples.
- Proteins were then precipitated under vigorous shaking for 10 min at 20 Hz using a QIAGEN TissueLyser II operated with two 5 mm glass beads (QIAGEN Sciences, Germantown, MD, USA).
- Samples were then centrifuged at 23,000 x g for 10 min at 4 °C after a 1 h protein freeze-out step at -20 °C.
- Supernatants were removed and transferred to a new set of tubes.
- Beef samples were diluted with 2 mL of water with 1% formic acid (v/v), while feed samples were diluted with 1 mL of the same mixture.
- Strata C18-E cartridges (Phenomenex, Torrance, CA, USA) were used for solid phase extraction (SPE).
- Cartridges were activated with 1 mL of methanol with 1% formic acid and washed with 1 mL of water with 1% formic acid.
- Samples were then loaded onto the cartridges. After passing the samples through the cartridges, beef samples were washed with 2 mL of water with 1% formic acid while feed samples were washed with 1.2 mL of water with 1% formic acid.
- Beef and feed samples were eluted with 1.2 mL of methanol in 0.1% formic acid.
- Beef and feed samples were then evaporated under a gentle stream of nitrogen gas before being reconstituted with 100 mL and 200 mL, respectively of methanol in 0.1% formic acid in 1.5 mL LC-MS amber vials (Agilent, Santa Clara, CA, USA) with 250 mL glass inserts.
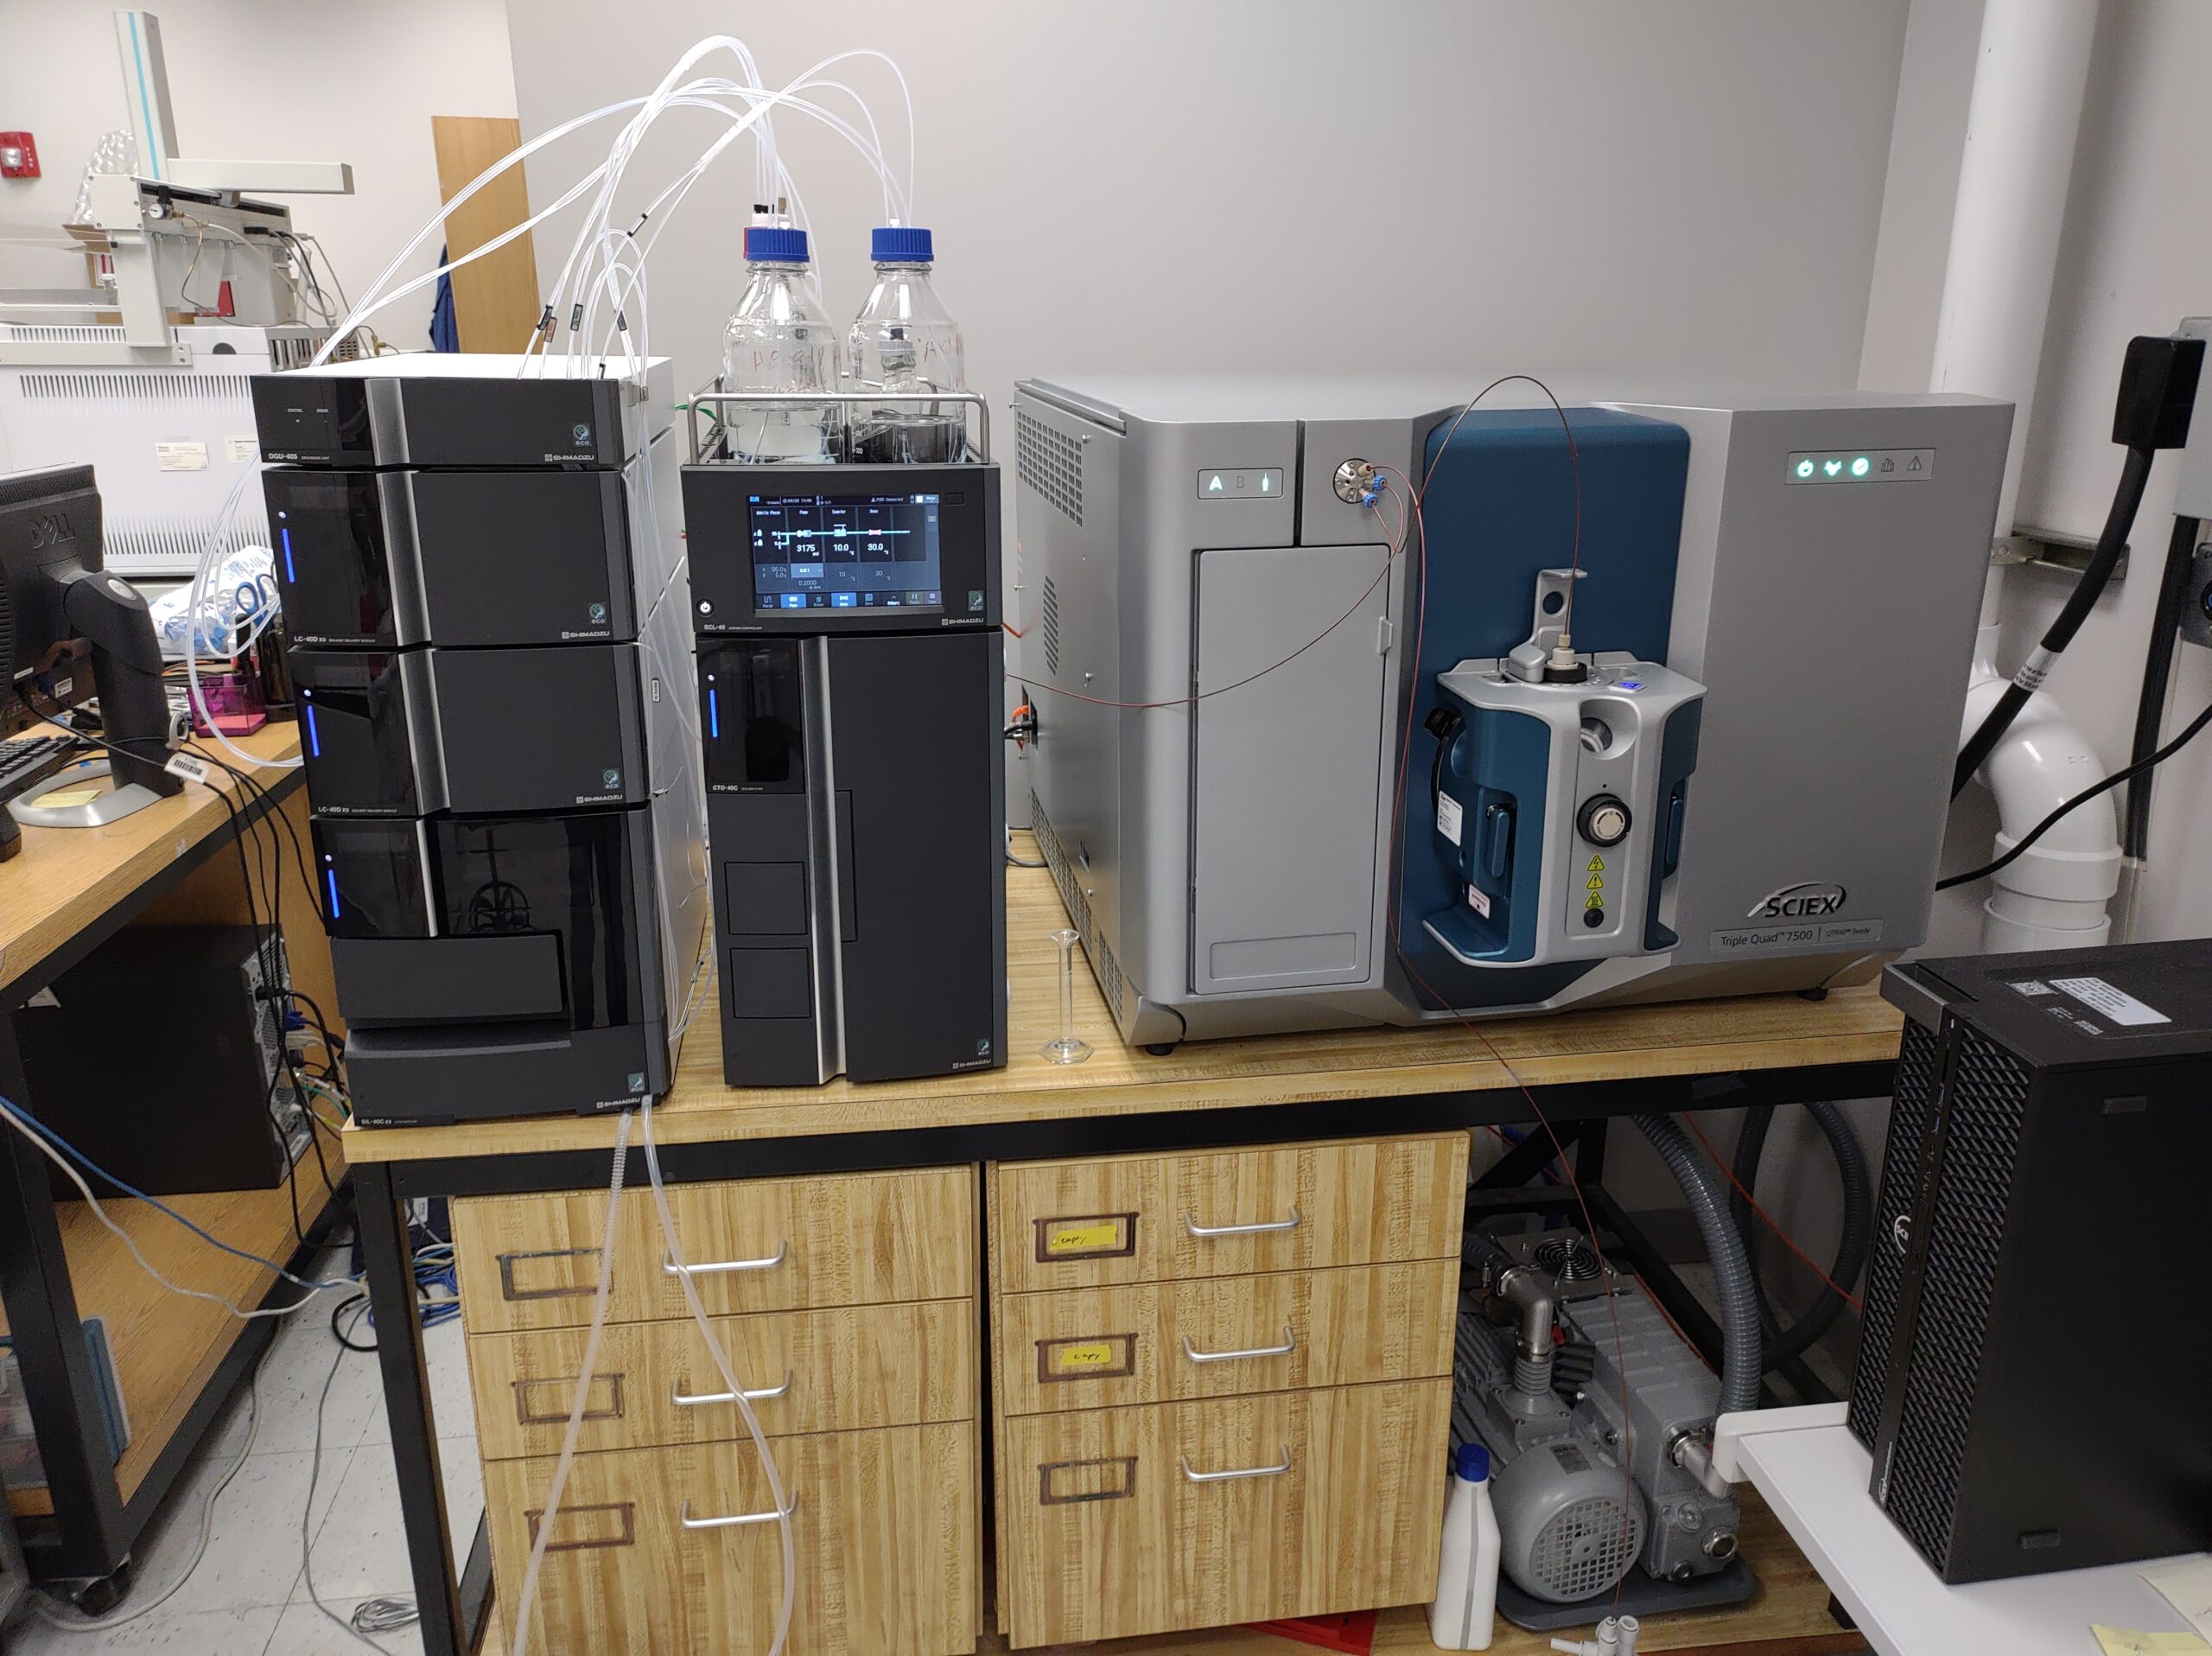
- Compounds were detected concurrently as precursor ion/product ion pair through multiple reaction monitoring (MRM) using ultra-high performance liquid chromatography tandem mass spectrometry (UHPLC-MS/MS).
- The platform utilized a SCIEX Hybrid Triple Quad™ 7500 (Framingham, MA, USA) with a front-end Shimadzu Nexera LC-40 Series (Kyoto, Japan) liquid chromatography system.
- Sample extracts were held at 10 °C in an auto-sampler and compounds were separated at 30 °C using a reverse phase Kinetex F5 100Å column (2.1 mm x 150 mm, 2.6 μM) from Phenomenex (Torrance, CA, USA) with binary mobile phases of water (A) and acetonitrile (B), both containing 0.1% formic acid (v/v).
- Samples were run in both negative and positive electrospray ionization mode. The following source parameters were used in negative mode: 1,600 V for the ionspray voltage, 550 °C for the temperature, 40 psi for the curtain gas, 40 psi for the nebulizer gas (GS1), 60 psi for the heating gas (GS2).
- In the negative mode, the linear gradient consisted of an initial composition of 5% B for 2.1 min with a flow rate of 0.2 mL/min, which was ramped up gradually to 95% B and a maximum flow rate of 0.46 mL/min over 14 min to keep a constant pressure, prior to being switched to 5% B for the final 4 minutes with a minimum flow rate of 0.175 mL/min.
- The following source parameters were used in positive mode: 2,000 V for the ionspray voltage, 550 °C for the temperature, 40 psi for the curtain gas, 40 psi for the nebulizer gas (GS1), 60 psi for the heating gas (GS2).
- In the positive mode, the linear gradient consisted of an initial composition of 5% B for 2.1 min with a flow rate of 0.2 mL/min, which was ramped up gradually to 95% B and a maximum flow rate of 0.46 mL/min over 14 min to keep a constant pressure, prior to being switched to 5% B for the final 4 minutes with a minimum flow rate of 0.175 mL/min.
- For both modes, a pooled matrix sample (sample generated by taking a small volume from samples from different experimental conditions), a double blank (100% methanol), and mixture of purified standards of target compounds was injected using an unscheduled method to determine presence of compounds in the matrix sample and their retention times for the scheduled method.
- In both modes, the cycling time in the scheduled method was set to 1000 msec and the dwell time ranged from 3 to 250 msec depending on the number of MRMs triggered.
- Double blank (100% methanol) and blank internal standard samples (methanol spiked with QReSS™ isotopically-labeled internal standards) were ran every 15 samples for quality control purposes.
- Analyst 3.1 software (AB Sciex, Framingham, MA, USA) was used to acquire and analyze the chromatographic data.
- Peaks were integrated using area-under-the-curve and normalization was performed using QReSS™ isotopically-labeled internal standards to account for any loss of material during sample preparation.
- Unlabeled external standard mixes were run in parallel to the samples with known concentrations of the different metabolites to allow for quantitation (in mg/100 g) of various compounds with relevant nutritive value and for which a standard was available.
- For compounds with no relevant nutritive value or for which no standard was ran concurrently, the data is expressed as arbitrary units (AU).
Statistical analysis:
- RStudio (R Core Team, Vienna, Austria) was used for the statistical analysis.
- A linear regression model was used to test the effect of diet on fatty acids, micronutrients, and quantified phytochemicals in beef.
- Diet, year, and pen were considered fixed effects.
- The experimental unit was each animal.
- Tukey’s HSD was used for post hoc comparison.
- For feed samples, a t-test was performed to compare GRAIN vs. GRAPE samples.
- For all analyses, values that fell below the limit of detection were treated as zeroes. Results were considered significant at p < 0.05 and were reported as mean ± standard error from the mean (SEM).
- Principal Component Analysis (PCA) and Random Forest (RF) analysis were conducted using MetaboAnalyst 5.0 (metaboanalyst.ca).
- Phytochemical compounds were first normalized to mass and then log transformed. The goal was to visualize data sets and identify the top metabolites that discriminate between groups using mean decrease accuracy.
Please note that all results and conclusions were reported in the published manuscript Krusinski et al. (2023) https://www.mdpi.com/2304-8158/12/19/3547
Chemical composition of experimental diets:
|
Table 1. Nutritional composition of the diets. |
||||
|
GRASS1 |
GRAIN2 |
GRAPE3 |
p-Value |
|
|
C10:0 |
0.03 ± 0.02 |
0.00 ± 0.00 |
0.00 ± 0.00 |
0.216 |
|
C12:0 |
0.21 ± 0.02 a |
0.03 ± 0.00 b |
0.03 ± 0.01 b |
< 0.001 |
|
C14:0 |
0.66 ± 0.05 a |
0.07 ± 0.00 b |
0.07 ± 0.00 b |
< 0.001 |
|
C15:0 |
0.13 ± 0.01 a |
0.03 ± 0.00 b |
0.03 ± 0.00 b |
< 0.001 |
|
C16:0 |
14.13 ± 0.22 |
13.82 ± 0.20 |
13.35 ± 0.17 |
0.156 |
|
C16:1 c9 |
0.18 ± 0.02 a |
0.09 ± 0.01 b |
0.09 ± 0.01 b |
< 0.010 |
|
C16:1 c7 |
1.06 ± 0.04 a |
0.14 ± 0.01 b |
0.12 ± 0.02 b |
< 0.001 |
|
C17:0 |
0.20 ± 0.01 a |
0.06 ± 0.00 b |
0.07 ± 0.00 b |
< 0.001 |
|
C18:0 |
1.73 ± 0.07 |
1.71 ± 0.05 |
1.67 ± 0.05 |
0.898 |
|
C18:1 c9 |
3.17 ± 0.26 b |
22.27 ± 0.14 a |
22.15 ± 0.31 a |
< 0.001 |
|
C18:1 c11 |
0.52 ± 0.05 |
0.52 ± 0.01 |
0.48 ± 0.01 |
0.896 |
|
C18:2 n-6 (LA)4 |
14.09 ± 0.42 b |
56.11 ± 0.57 a |
57.03 ± 0.64 a |
< 0.001 |
|
C18:3 n-3 (ALA)5 |
61.60 ± 0.93 a |
4.29 ± 0.30 b |
3.95 ± 0.66 b |
< 0.001 |
|
C20:0 |
0.62 ± 0.03 a |
0.42 ± 0.02 b |
0.41 ± 0.04 b |
< 0.001 |
|
C22:0 |
0.75 ± 0.04 a |
0.17 ± 0.01 b |
0.17 ± 0.01 b |
< 0.001 |
|
C24:0 |
0.74 ± 0.03 a |
0.23 ± 0.01 b |
0.22 ± 0.01 b |
< 0.001 |
|
∑ SFA6 |
19.36 ± 0.38 a |
16.57 ± 0.27 b |
16.03 ± 0.24 b |
< 0.001 |
|
∑ OCFA7 |
0.33 ± 0.01 a |
0.09 ± 0.00 b |
0.10 ± 0.00 b |
< 0.001 |
|
∑ MUFA8 |
4.94 ± 0.25 b |
23.02 ± 0.13 a |
22.98 ± 0.30 a |
< 0.001 |
|
∑ PUFA9 |
75.71 ± 0.57 a |
60.41 ± 0.32 b |
60.99 ± 0.34 b |
< 0.001 |
|
∑ n-610 |
14.09 ± 0.42 b |
56.12 ± 0.57 a |
57.04 ± 0.63 a |
< 0.001 |
|
∑ n-311 |
61.62 ± 0.93 a |
4.29 ± 0.30 b |
3.95 ± 0.66 b |
< 0.001 |
|
n-6:n-3 ratio12 |
0.24 ± 0.01 b |
15.12 ± 1.28 a |
18.42 ± 2.34 a |
< 0.001 |
|
DM13 |
21.38 ± 0.63 b |
79.80 ± 0.97 a |
82.36 ± 1.32 a |
< 0.001 |
|
Ash* |
6.60 ± 0.17 a |
4.02 ± 0.20 b |
3.79 ± 0.34 b |
< 0.001 |
|
CP14* |
13.40 ± 0.47 a |
9.65 ± 0.18 b |
9.29 ± 0.32 b |
< 0.001 |
|
NDF15* |
51.82 ± 0.92 a |
21.02 ± 0.39 b |
20.59 ± 0.62 b |
< 0.001 |
|
ADF16* |
33.38 ± 0.72 a |
10.09 ± 0.26 b |
9.94 ± 0.39 b |
< 0.001 |
|
Energy17 |
4465.49 ± 11.98 a |
4265.90 ± 15.98 b |
4274.76 ± 28.55 b |
< 0.001 |
|
Values reported as means ± standard error. Different letters denote statistical significance at p < 0.05. 1GRASS: diverse pasture; 2GRAIN: total mixed ration (TMR); 3GRAPE: TMR + 5% DM grapeseed extract. Fatty acids reported as % of total. 4LA: linoleic acid; 5ALA: α-linolenic acid; 6∑ SFA = all saturated FAs (10:0, 12:0, 13:0, 14:0, 15:0, 16:0, 17:0, 18:0, 20:0, 22:0, 24:0); 7∑ OCFA = all odd chain FAs (13:0, 15:0, 17:0); 8MUFA = all monounsaturated FAs (16:1, 18:1); 9∑ PUFA = LA + ALA + C20:3 n-3; 10∑ n-6 = LA; 11∑ n-3 = ALA + C20:3 n-3; 12n-6:n-3 ratio = ∑ n-6/∑ n-3; *reported in %DM; 13DM: dry matter (%); 14CP: crude protein; 15NDF: neutral detergent fiber; 16ADF: acid detergent fiber; 17Energy (cal/g). |
||||
Beef fatty acids:
|
Values reported as means ± standard error. Different letters denote statistical significance at p < 0.05. 1GRASS: beef fed a diverse pasture; 2GRAIN: beef fed a total mixed ration (TMR); 3GRAPE: beef fed TMR + 5% DM grapeseed extract; 4∑ SFA = all saturated FAs (10:0, 12:0, 13:0, 14:0, 15:0, 16:0, 17:0, 18:0, 19:0, 20:0, 22:0); 5∑ MUFA = all monounsaturated FAs (14:1, 16:1, 17:1, 18:1, 20:1); 6∑ PUFA = LA + ALA + GLA + Eicosadienoic + Eicosatrienoic + DGLA + Mead + Arachidonic + EPA + DTA + DPA n-3 + DHA; 7∑ n-3 = ALA + EPA + DHA + DPA n-3 + Eicosatrienoic; 8ALA: α-linolenic acid; 9EPA: eicosapentaenoic acid; 10DPA: docosapentaenoic acid; 11DHA: docosahexaenoic acid; 12∑ n-6 = LA + GLA + Eicosadienoic + DGLA + Arachidonic + DTA; 13LA: linoleic acid; 14n-6:n-3 ratio = ∑ n-6/∑ n-3; 15∑ CLA = sum of conjugated linoleic acid isomers (c9, t11/t7, c9 18:2 + t11, c13 18:2 + t11, t13 18:2 + t,t 18:2); 16∑ AD (Atypical Dienes) = sum of non-conjugated linoleic acid isomers (t11, t15 18:2 + t9, t12 18:2 + c9, t14/c9, t13 18:2 + t11, c15 18:2 + c9, t16 18:2 + c9, c15 18:2 + c12, c15 18:2); 17∑ CLnA = sum of conjugated linolenic acid isomers (c9, t11, t15 18:3 + c9, t11, c15 18:3); 18∑ FA = sum all of FAs. |
||||
|
Table 2. Fatty acid profile of beef by diet (mg per 100 g beef). |
||||
|
GRASS1 |
GRAIN2 |
GRAPE3 |
p-Value |
|
|
∑ SFA4 |
767.56 ± 188.89 |
996.16 ± 194.19 |
868.22 ± 266.53 |
0.700 |
|
C12:0 |
1.04 ± 0.25 |
1.09 ± 0.26 |
0.63 ± 0.35 |
0.527 |
|
C14:0 |
31.29 ± 10.15 |
53.81 ± 10.43 |
49.95 ± 14.32 |
0.287 |
|
C15:0 |
8.16 ± 2.23 |
3.97 ± 2.29 |
3.34 ± 3.15 |
0.330 |
|
C16:0 |
424.06 ± 107.99 |
681.64 ± 111.01 |
564.21 ± 152.37 |
0.261 |
|
C17:0 |
26.17 ± 8.62 |
10.18 ± 8.86 |
23.16 ± 12.16 |
0.403 |
|
C18:0 |
272.22 ± 66.47 |
242.23 ± 68.33 |
224.09 ± 93.79 |
0.907 |
|
∑ MUFA5 |
748.55 ± 194.06 |
944.75 ± 188.04 |
1076.92 ± 258.41 |
0.572 |
|
C14:1 9c |
5.57 ± 3.30 b |
19.10 ± 3.39 a |
13.67 ± 4.65 a,b |
< 0.050 |
|
C16:1 9c |
60.47 ± 54.83 |
117.74 ± 56.37 |
240.76 ± 77.37 |
0.174 |
|
C16:1 9t |
3.51 ± 0.33 a |
1.08 ± 0.20 b |
1.05 ± 0.27 b |
< 0.001 |
|
C18:1 9c |
565.28 ± 148.34 |
733.76 ± 152.50 |
732.59 ± 209.30 |
0.694 |
|
C18:1 9t |
2.24 ± 0.95 |
1.44 ± 0.27 |
1.75 ± 0.36 |
0.578 |
|
C18:1 11t |
36.69 ± 11.11 a |
1.54 ± 2.02 b |
1.70 ± 2.70 b |
< 0.001 |
|
∑ PUFA6 |
113.84 ± 12.60 |
111.65 ± 12.95 |
95.29 ± 17.78 |
0.669 |
|
∑ n-37 |
46.03 ± 4.79 a |
10.13 ± 4.92 b |
7.73 ± 6.76 b |
< 0.001 |
|
C18:3 n-3 (ALA)8 |
24.32 ± 3.70 a |
2.32 ± 3.81 b |
2.22 ± 5.23 b |
< 0.001 |
|
C20:3 n-3 |
0.30 ± 0.07 a |
0.03 ± 0.07 b |
0.09 ± 0.09 a,b |
< 0.050 |
|
C20:5 n-3 (EPA)9 |
7.41 ± 0.38 a |
1.80 ± 0.39 b |
1.10 ± 0.53 b |
< 0.001 |
|
C22:5 n-3 (DPA)10 |
13.39 ± 0.96 a |
5.67 ± 0.99 b |
3.96 ± 1.36 b |
< 0.001 |
|
C22:6 n-3 (DHA)11 |
0.61 ± 0.08 a |
0.32 ± 0.08 b |
0.35 ± 0.11 a,b |
< 0.050 |
|
∑ n-612 |
67.07 ± 9.04 b |
100.32 ± 9.29 a |
86.61 ± 12.73 a,b |
< 0.050 |
|
C18:2 n-6 (LA)13 |
46.95 ± 7.07 |
65.61 ± 7.27 |
57.47 ± 9.97 |
0.195 |
|
C18:3 n-6 |
0.29 ± 0.05 |
0.40 ± 0.05 |
0.42 ± 0.07 |
0.243 |
|
C20:2 n-6 |
0.33 ± 0.09 |
0.57 ± 0.10 |
0.55 ± 0.13 |
0.186 |
|
C20:3 n-6 |
3.34 ± 0.49 b |
5.87 ± 0.50 a |
4.61 ± 0.69 a,b |
< 0.010 |
|
C20:4 n-6 |
14.61 ± 1.51 b |
22.53 ± 1.56 a |
19.21 ± 2.14 a,b |
< 0.010 |
|
C22:4 n-6 |
1.56 ± 0.49 b |
5.34 ± 0.51 a |
4.36 ± 0.70 a |
< 0.001 |
|
n-6:n-3 ratio14 |
1.65 ± 0.44 b |
8.39 ± 0.45 a |
9.82 ± 0.62 a |
< 0.001 |
|
∑ CLA15 |
5.14 ± 1.20 |
2.28 ± 1.23 |
2.86 ± 1.69 |
0.243 |
|
C18:2 9c,11t/9c,7t |
4.01 ± 1.05 |
1.63 ± 1.08 |
1.96 ± 1.48 |
0.269 |
|
∑ AD16 |
18.07 ± 5.07 |
9.29 ± 5.21 |
17.01 ± 7.16 |
0.438 |
|
∑ CLnA17 |
0.36 ± 0.05 |
0.25 ± 0.05 |
0.25 ± 0.07 |
0.292 |
|
C18:3 9c,11t,15t |
0.12 ± 0.03 a |
0.02 ± 0.03 b |
0.05 ± 0.04 a,b |
< 0.050 |
|
C18:3 9c,11t,15c |
0.24 ± 0.03 |
0.23 ± 0.03 |
0.20 ± 0.04 |
0.758 |
|
∑ FA18 |
1686.08 ± 400.01 |
2080.23 ± 399.93 |
2090.96 ± 549.44 |
0.495 |
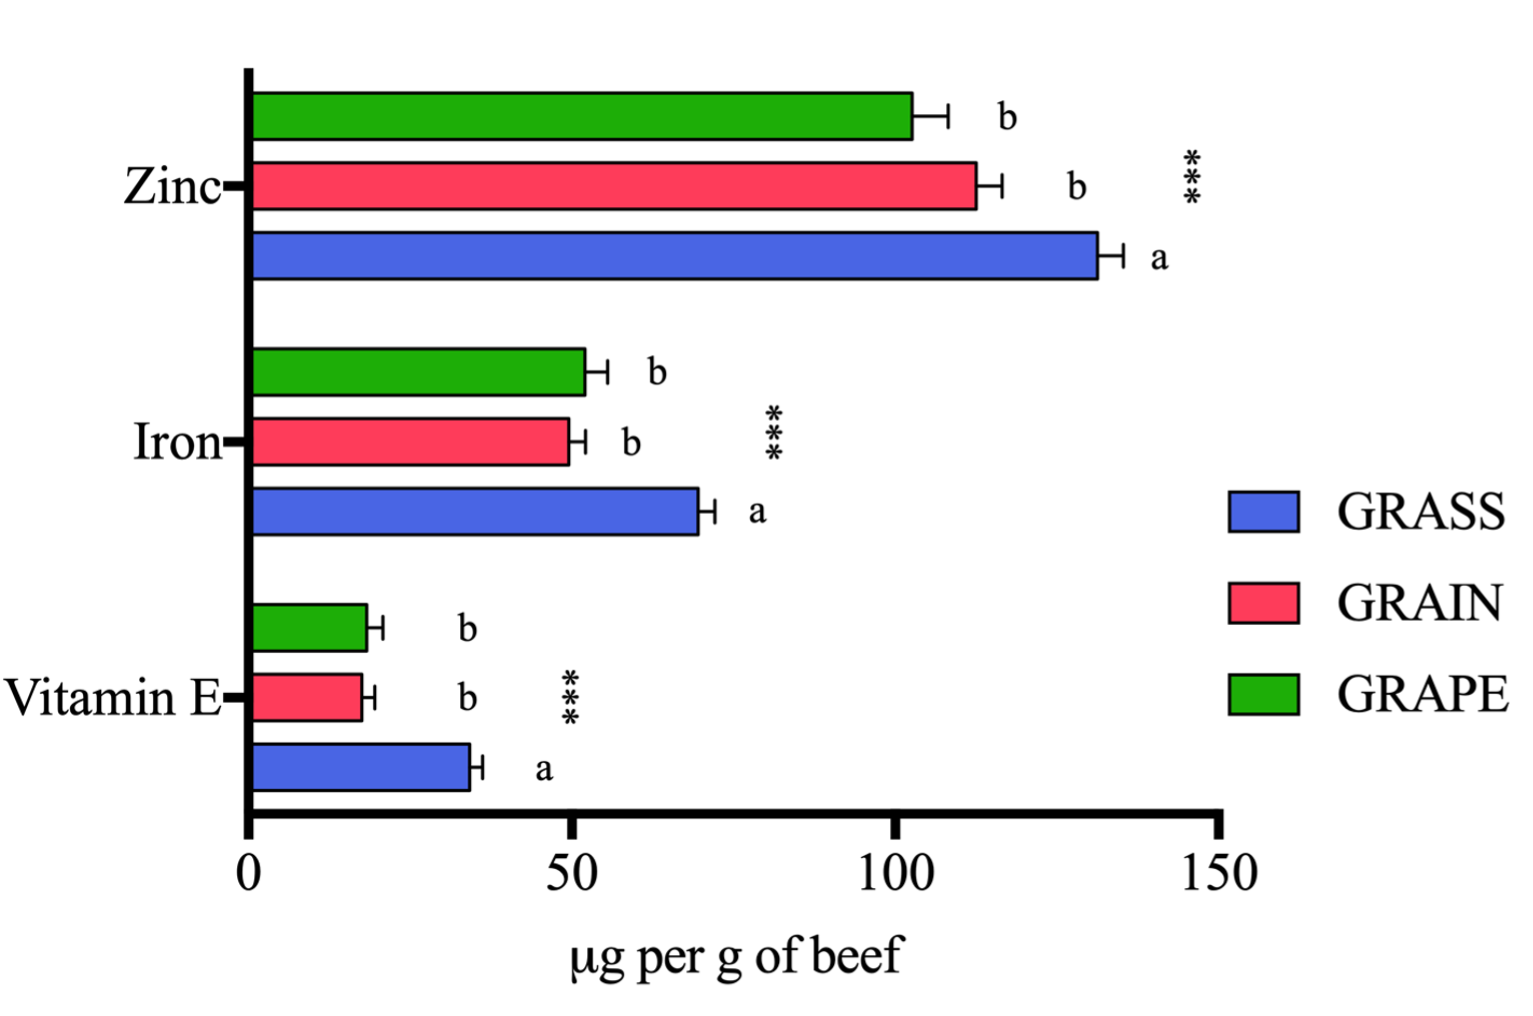
Beef vitamin E, iron, and zinc:
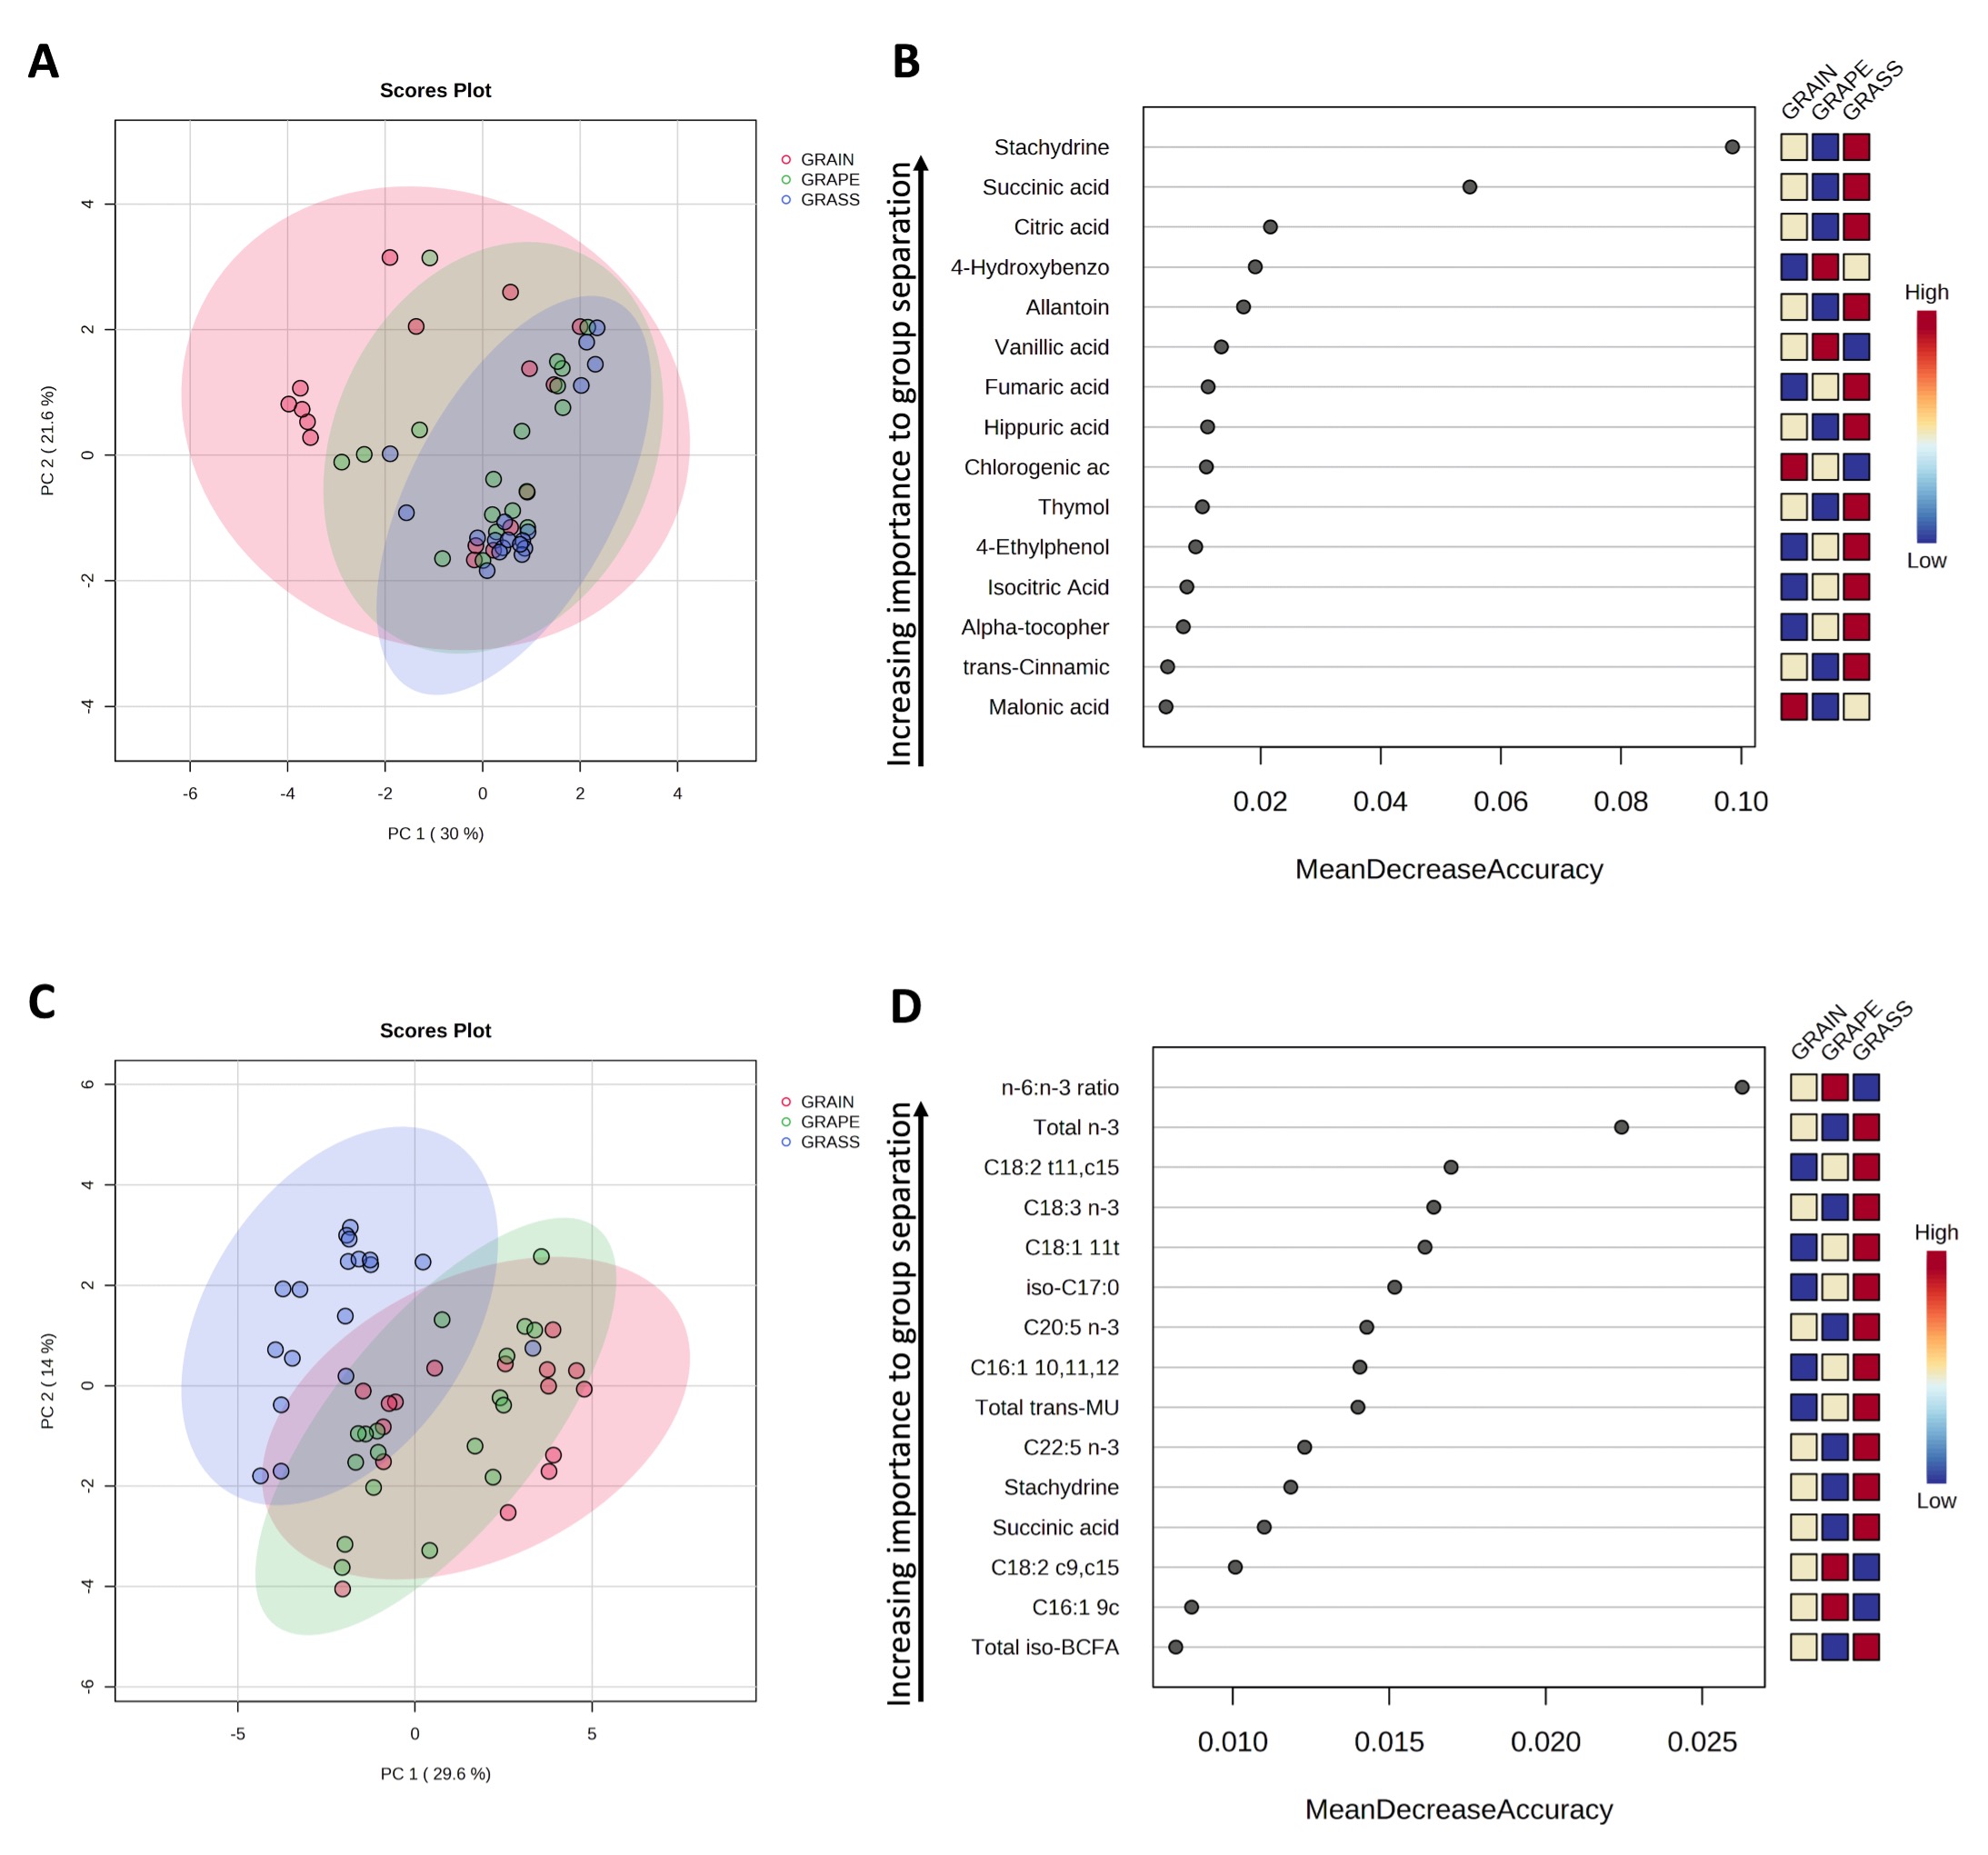
Data visualization of top discriminating compounds in beef:
Beef classification using Random Forest analysis:
|
Table 3. Random Forest Classification of beef by diet. |
|||||
|
GRASS1 |
GRAIN2 |
GRAPE3 |
Class Error |
OOB4 |
|
|
Phytochemicals |
|||||
|
GRASS |
17 |
1 |
0 |
5.60% |
17.30% |
|
GRAIN |
0 |
10 |
6 |
37.50% |
|
|
GRAPE |
0 |
2 |
16 |
11.10% |
|
|
Phytochemicals and fatty acids |
|||||
|
GRASS |
17 |
1 |
0 |
5.60% |
15.40% |
|
GRAIN |
0 |
13 |
3 |
18.80% |
|
|
GRAPE |
1 |
3 |
14 |
22.00% |
|
|
1GRASS: beef fed a diverse pasture; 2GRAIN: beef fed a total mixed ration (TMR); 3GRAPE: beef fed TMR + 5% DM grapeseed extract; 4OOB: Overall Out of Bag error rate. |
|||||
Quantified phytochemicals (including polyphenols) in beef:
|
Table 4. Quantified phytochemicals in beef by diet (mg per 100 g beef). |
||||
|
GRASS1 |
GRAIN2 |
GRAPE3 |
p-value |
|
|
Stachydrine |
0.65 ± 0.04 a |
0.26 ± 0.05 b |
0.28 ± 0.06 b |
< 0.001 |
|
4-Ethylphenol |
3.92 ± 0.44 |
3.00 ± 0.45 |
3.83 ± 0.60 |
0.287 |
|
Hippuric acid |
13.37 ± 1.20 a |
7.77 ± 1.24 b |
5.52 ± 1.66 b |
< 0.001 |
|
Citric acid |
379.20 ± 35.20 a |
79.10 ± 36.30 b |
51.40 ± 48.70 b |
< 0.001 |
|
Succinic acid |
36.80 ± 2.66 a |
17.80 ± 2.74 b |
13.70 ± 3.67 b |
< 0.001 |
|
Fumaric acid |
2.68 ± 0.34 a |
0.90 ± 0.35 b |
0.62 ± 0.47 b |
< 0.001 |
|
Caffeic acid |
0.04 ± 0.02 |
0.04 ± 0.02 |
0.01 ± 0.03 |
0.570 |
|
p-Coumaric acid |
1.56 ± 0.25 b |
2.47 ± 0.25 a |
2.53 ± 0.34 a |
< 0.050 |
|
4-Hydroxybenzoic acid |
0.38 ± 0.22 |
0.02 ± 0.23 |
0.85 ± 0.30 |
0.058 |
|
Gallic acid |
0.01 ± 0.02 |
0.00 ± 0.02 |
0.05 ± 0.03 |
0.370 |
|
Ethyl gallate |
0.01 ± 0.01 |
0.01 ± 0.01 |
0.02 ± 0.01 |
0.871 |
|
Vanillic acid |
0.18 ± 0.16 |
0.28 ± 0.16 |
0.38 ± 0.22 |
0.733 |
|
D-Tartaric acid |
2.29 ± 0.52 |
2.34 ± 0.53 |
1.71 ± 0.71 |
0.734 |
|
Pyrocatechol sulfate |
0.52 ± 0.09 |
0.55 ± 0.10 |
0.70 ± 0.13 |
0.501 |
|
Coixol |
1.07 ± 0.36 |
1.16 ± 0.37 |
1.73 ± 0.49 |
0.510 |
|
Values reported as means ± standard error. Different letters denote statistical significance at p < 0.05. 1GRASS: beef fed a diverse pasture; 2GRAIN: beef fed a total mixed ration (TMR); 3GRAPE: beef fed TMR + 5% DM grapeseed extract. |
||||
Discussion, conclusions, and relevance:
- Beef samples tested in this study all came from similar genetics steers, indicating that differences observed were most likely due to differences in finishing diets (GRASS vs. GRAIN vs. GRAPE).
- Stachydrine and hippuric acid were identified as cattle diet-discriminating compounds, even though van Vliet et al. (2023) reported higher levels of stachydrine in pen-finished bison compared to pasture-finished bison, which can be explained by the high level of alfalfa in the finishing ration of pen-finished bison. This phytochemical is found in high concentrations in chestnuts, alfalfa, and Chinese medicinal herbs, and demonstrates bioactivities that have potential applications in addressing fibrosis, cardiovascular diseases, cancers, brain diseases, and inflammation in humans (Cheng et al., 2020).
- It was expected to find higher concentrations of this compound in beef from GRASS since ~10% of the complex diverse pasture fed to these animals was made of alfalfa.
- Citric acid was the most abundant phytochemical quantified in this study (with beef from GRASS containing 379.20 mg of citric acid per 100 g of beef). Citric acid is mostly found in fruits, especially citrus fruits and has several health benefits including increasing the bioavailability and absorption of minerals and reducing risks of kidney stone formation (Mahato et al, 2018 & Nii et al., 2006).
- For comparison, fresh apricots contain 30-50 mg of citric acid per 100 g (Gurrieri et al., 2001). In the present study, 100 g of beef from GRASS contained 7-12 times more citric acid than 100 g of apricots.
- Succinic and citric acid are both TCA (citrate) cycle metabolites that can also be endogenously produced. These are usually elevated with an oxidative phenotype in grass-finished beef due to movement and more long-chain PUFAs in the forage.
- Additionally, long-chain PUFAs are preferentially oxidized in the mitochondria. So, while feed plays a role in the current study, it is also likely that these compounds were endogenously produced because of cattle moving more and/or eating more PUFAs (Gomez et al, 2022 & Apaoblaza et al, 2020).
- Beef from GRAIN and GRAPE (fed mainly a TMR) contained higher concentrations of p-coumaric acid than beef from GRASS. This phenolic acid is one of the main phenolic compounds reported in corn-based diets (Rocchetti et al, 2022).
- Based on the Random Forest biochemical importance plot, it appears that vanillic acid and 4-hydrobenzoic acid have the potential to discriminate beef from cattle supplemented with grapeseed extracts even though no significant differences were noted when these compounds were quantified. Vanillic acid is one of the most significant hydrobenzoic acid found in grapes (Sabra et al, 2021).
- Overall, beef from the grass-finishing system (GRASS) displayed the most beneficial nutritional profile for human health with a lower n-6:n-3 ratio and higher levels of long-chain n-3 PUFAs, vitamin E, zinc, iron, and various secondary metabolites including stachydrine, hippuric acid, citric acid, succinic acid, and fumaric acid compared to grain-finished beef (GRAIN) and grain-finished beef supplemented with GSE (GRAPE).
- Beef from GRAPE was somewhere in the middle between GRASS and GRAIN for a few specific FAs such as total n-6 PUFAs, C20:3 n-3, and DHA. The same observation was made with PCA where some overlaps were observed.
- While higher levels of phytochemicals were expected with GSE supplementation, the response is generally dose-dependent and the 5% (DM basis) added to the cattle diet in this study were most likely not enough to raise levels of bioactive compounds in beef.
- In conclusion, the n-6:n-3 ratio, total n-3 PUFAs, micronutrients, and phytochemicals in beef are compounds that can be used to determine the finishing diet of cattle.
Educational & Outreach Activities
Participation summary:
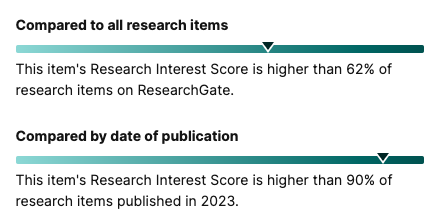
Our findings were published in an Open Access, peer-reviewed journal: https://www.mdpi.com/2304-8158/12/19/3547 . The article was flagged as highly viewed by the journal and totals as of today 27,340 views.
We presented our findings during seminars at Michigan State University and Chapman University to USDA-funded scientists, and shared the results with the Greenacres Foundation (which communicates findings with farmers and ranchers) https://green-acres.org/.
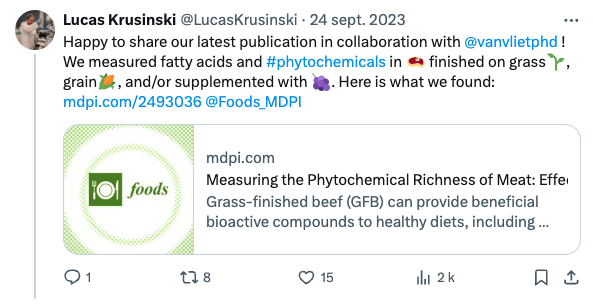
We also shared our findings with the public using social media such as X (formally Twitter) and LinkedIn.

Project Outcomes
We are confident that this project will benefit both consumers and farmers. Our findings indicate that grass-finished beef and grain-finished beef supplemented with grape seed extract contain beneficial bioactive compounds that are up-cycled from the feed to the meat (feed otherwise not consumed by humans). We reported that grass-finished beef contains more n-3 PUFAs, CLA, TVA, and has a lower n-6:n-3 ratio than grain-finished beef. Metabolomics data also indicate that grass-finished beef contains more phytochemicals with potential health benefits compared to grain-finished beef (e.g., citric acid, stachydrine, phenolic acids, polyphenols, vitamin E). These arguments can help consumers make more informed decisions when purchasing beef, and they also help sustainable farmers and producers to market their products (it has been previously shown that consumers are willing to pay premiums for products of grassland origins). This project also showed that it is possible to feed agriculture waste and by-products to cattle (by-products otherwise not used and wasted), which has both economical and environmental benefits for farmers. The findings reported as part of this project are important for agricultural sustainability, as it shows that regenerative, sustainable beef production systems benefit consumers, farmers, and animals. We are hopeful that if communicated with farmers and the general public, our findings will make people more interested in sustainable agriculture.
This project significantly improved our knowledge, attitude, skillset, and awareness about sustainable agriculture. The research done as part of this SARE project increased our knowledge about current and pressing issues in agriculture (e.g., agricultural waste, effects of current beef production systems on animal and human health, importance of biodiversity, etc.). Finding out that waste and by-products from the wine/grape industry can be fed to cattle was eye-opening. During the literature review that led to this project, we also discovered that a lot of other by-products can be used in beef production systems (e.g., olive and grape pomace, etc.) as cheap, nutritive, and readily-available feed. Also determining that finishing cattle on biodiverse pastures improves beef nutrient density and animal welfare markers (e.g., TCA cycle metabolites) reinforced our attitude towards sustainable agriculture. This project also trained us on metabolomics techniques and data analysis (mass spectrometry, random forest classification models, principal component analysis), knowledge that we reapplied in other sustainable agriculture projects. This project also allowed us to form new collaborations with other scientists, organizations, and farmers. This project was part of a successful Ph.D. dissertation and contributed the required knowledge, skills, and attitude to obtain a Postdoctoral Fellowship in the filed of sustainable and regenerative agriculture. Overall, this SARE project was a valuable learning experience for both graduate student(s) and advisor(s).
The dose of grape seed extract used in this study was most likely too low (5% of dry matter, for last 30 days of finishing) to cause important shifts in the nutrient density of beef. Future studies should attempt to feed higher doses of grape by-products (or other agricultural waste) to cattle. Other supplemental feeds should also be investigated in grazing systems. Additional biomarkers, especially related to animal welfare and environmental impact, should be studied in order to get a full-picture of different beef production systems and their place in sustainable agriculture.