Final report for GNC22-343
Project Information
SustaiN seeks to address the pressing issue of excessive Nitrogen (N) use in corn and sorghum production, which can be a significant financial burden for farmers and pose environmental risks. To provide a viable solution, we propose utilizing high-resolution satellite remote sensing to develop an interactive web-based decision support system (DSS) that visualizes the N-status of crops in near real-time. We are collaborating with our partners at the Donald Danforth Plant Science Center and the University of Illinois to establish experimental fields with variable N rates in plots of corn and sorghum. During the growing season of 2023, we will use a hyperspectral sensor mounted on an unmanned aerial vehicle (UAV) to collect remote sensing data and create an N-status index that can explain N-variability. We will then apply this index to PlanetScope (PS) satellite images and integrate the results into a fully interactive and user-friendly web based DSS.
Our research approach will involve the development of a suitable N-status index that can accurately explain N-variability from crop canopies. Drawing on our previous experiments conducted in 2021 and 2022, we have been able to create a N-status index from UAV data that is well-suited for the PS satellite. To ensure accessibility, we have established a dedicated project website (https://sustaincrops.net/) that allows farmers to easily subscribe and log in to the system. Our DSS allows users to input their field's location and desired time of data visualization, which provides a comprehensive N-status map highlighting areas of N-variability that can reduce costs for in-season N-application. In addition, we are developing educational videos and materials to help farmers understand how remote sensing can be integrated into high-throughput decision-making for their farming. The beta version of our web-based app is already running in the cloud, and we are excited to see how our project will benefit farmers by providing access to vital information that can inform their management decisions.
As the project is still in its early stages of development, we will continue to collect more data from the upcoming season. To promote wider adoption of SustaiN, we will reach out to farmers through social media and farmers' associations to encourage subscription. Our final report will include a more detailed research conclusion and a summary of the farmer adoption actions that resulted from the education program.
Learning outcomes
The learning outcomes will be shared to farmers and researchers by peer-reviewed journal publication and hosting the results in a project website.
- Farmers will learn how satellite data can explain in-season N-variability for corn and sorghum and gain insight into any environmental stress that may have affected overall N-uptake.
- The project will provide information on which corn and sorghum genotypes have better nitrogen use efficiency in different environmental conditions.
- Researchers will have access to unique crop datasets and project source codes that will enable them to reproduce the research outcomes and the DSS.
Action outcomes
- Farmers will make informed decisions about optimal in-season N-requirement without relying on drone-based flights or ground-based sensors, leading to increased profitability and reduced operational costs while improving the overall soil quality of their fields.
- Researchers can perform further investigation on top of the current version of DSS.
Cooperators
- (Educator and Researcher)
- (Educator and Researcher)
Research
The overall methodological framework for this study is illustrated in Figure 1.
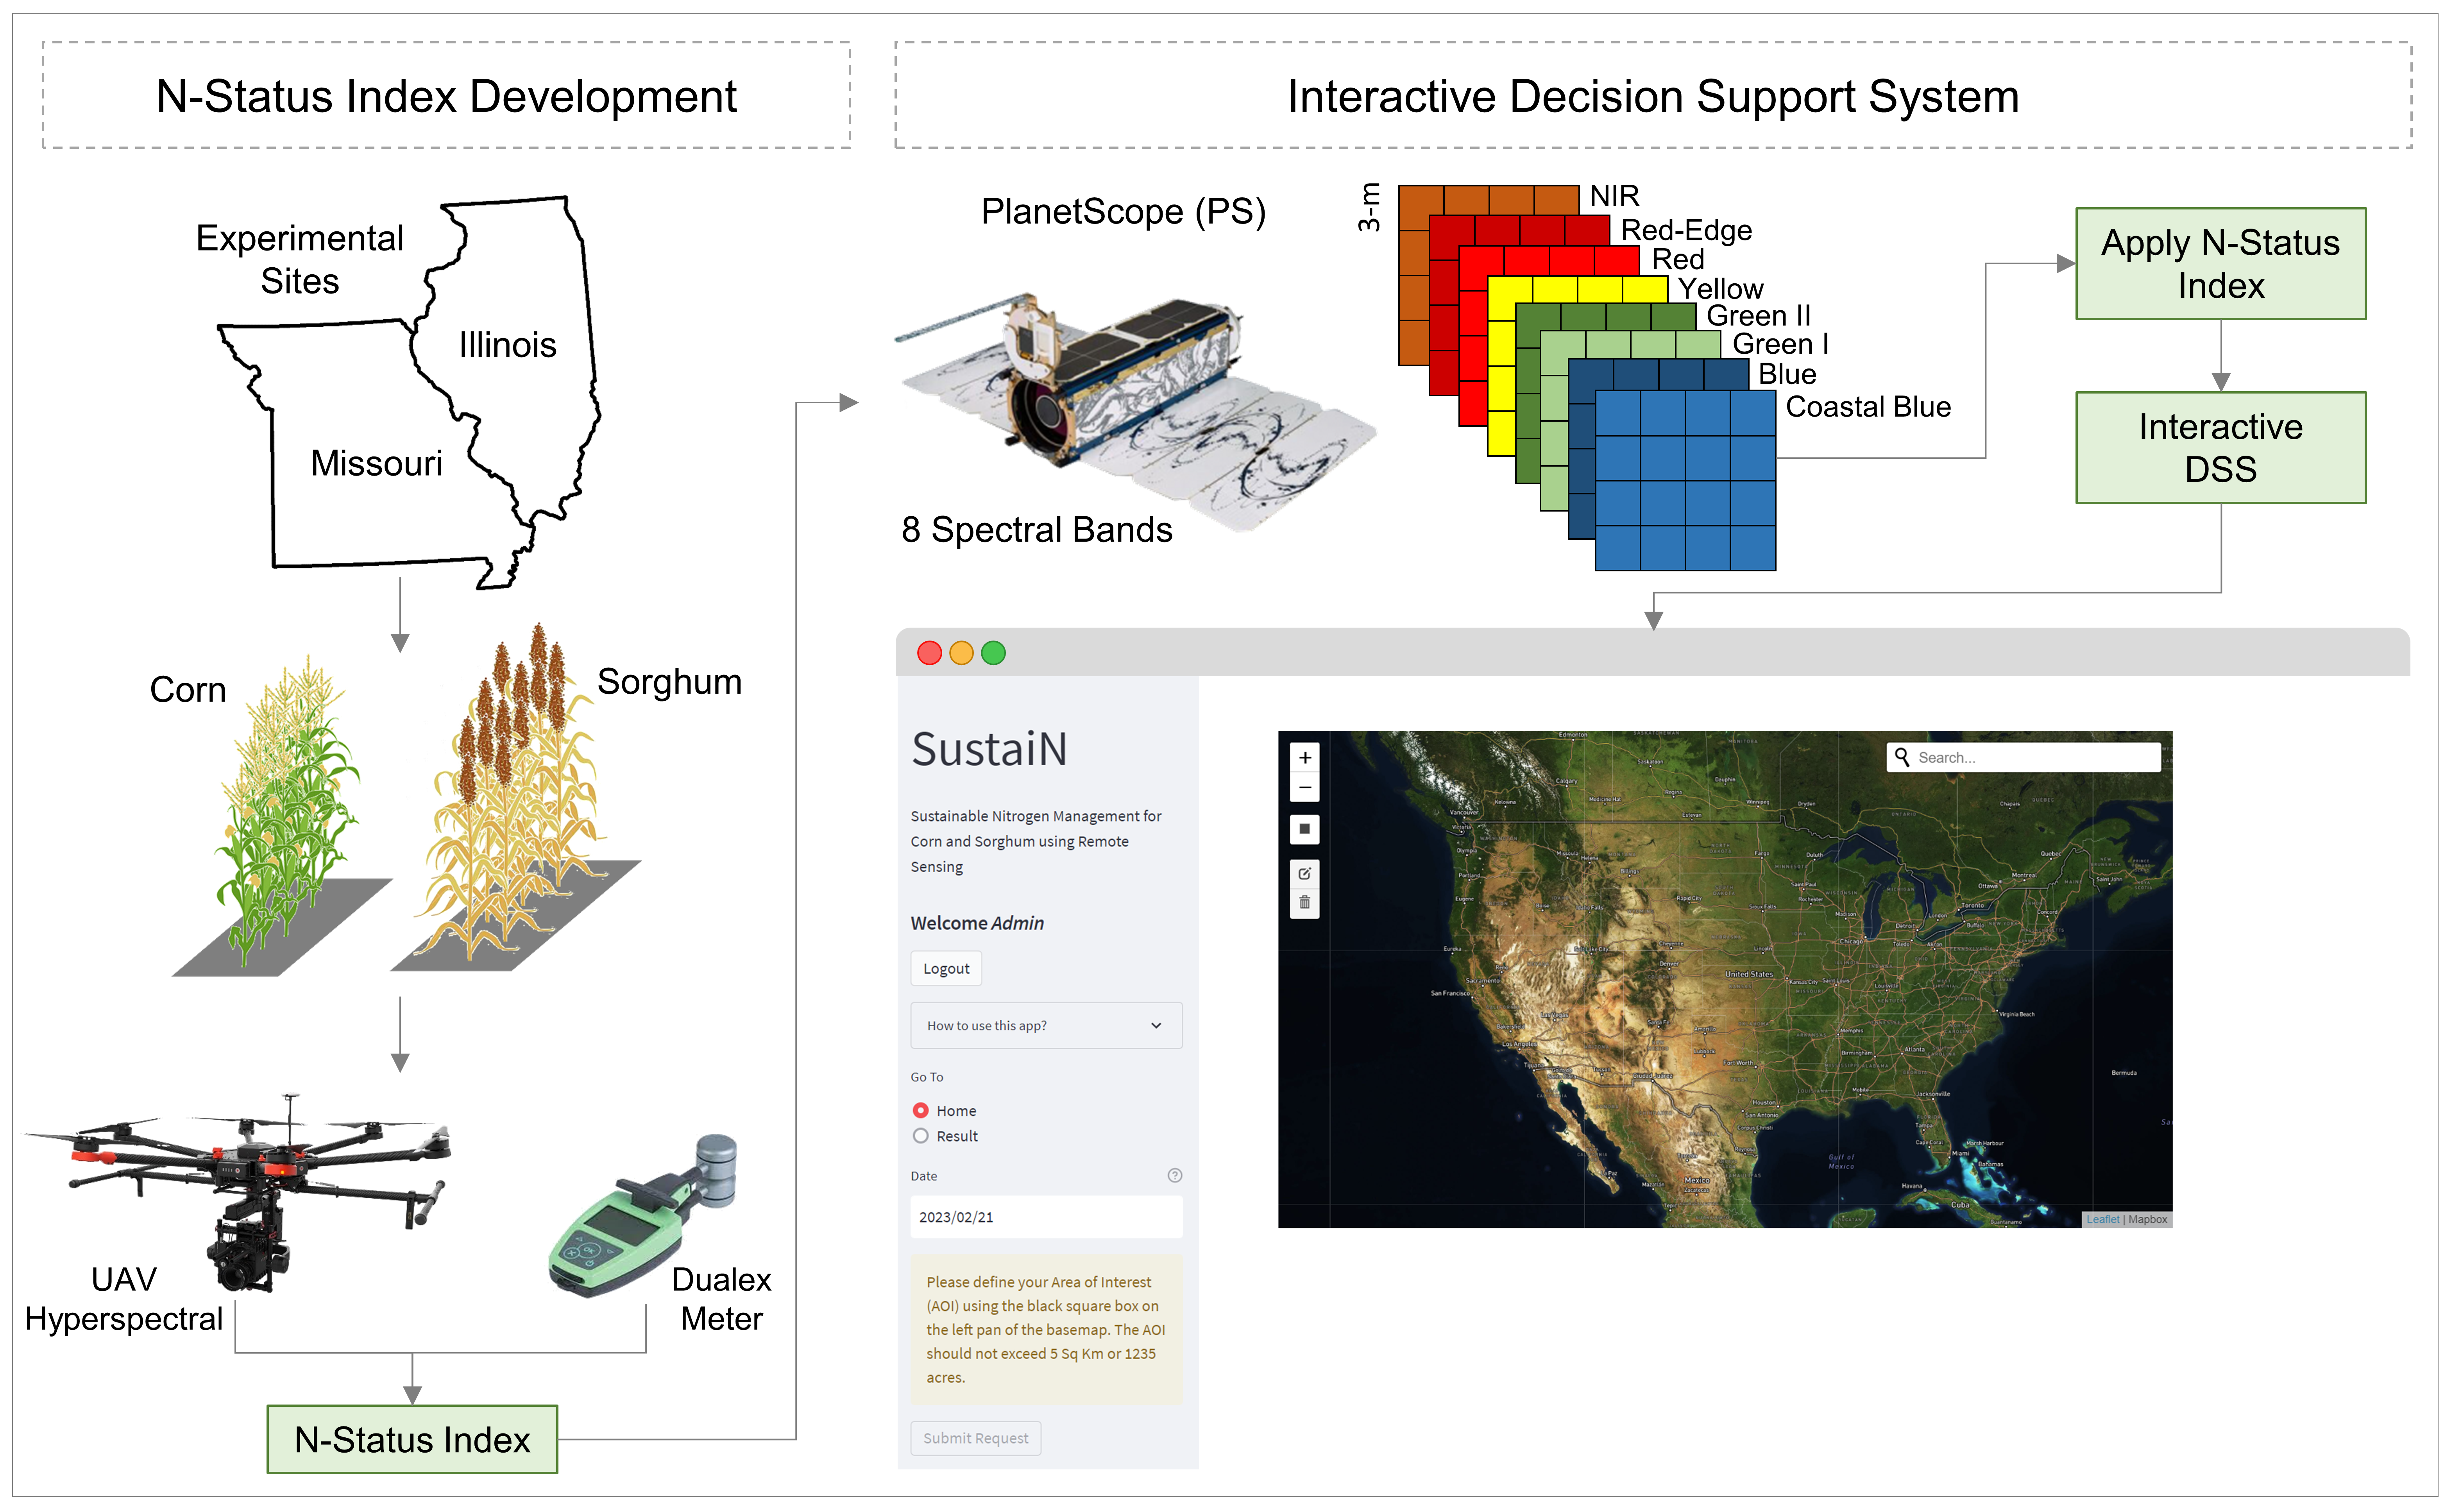
N-Status index development
Experimental sites
The goal of this project is to develop a suitable N-status index to accurately explain N-variability from crop canopies. Our collaboration with the Donald Danforth Plant Science Center granted us access to their corn experimental sites. Two experimental sites were established in Ofallon, MO in 2021 and 2022, and two other sites were located in the Fisher Farm, MO in 2023. These experimental fields were established with around 50 distinct genotypes. In the 2021 and 2022 fields, each field included a 3m by 2m plot with two rows of corn, whereas the 2023 fields consisted of 4 rows plot with 3m by 2m dimensions.
Data collection
UAV data collection
We collected UAV-hyperspectral data above the experimental fields in 2021, 2022, and 2023 using the Headwall NanoHyperspec 12 mm push-broom sensor mounted on the DJI Matrice 600 Pro hexacopter. This sensor provides high spatial and spectral resolution data across the very near-infrared region (400 nm to 1000 nm). We selected the hyperspectral sensor for our study since the new PS satellite has 8 bands and the UAV hyperspectral bands can be easily matched with the PS data. Table 1 provides the dates of data collection from different fields and corresponding sample data information.
Table 1: Data collection dates in the 2021 and 2022 season
| Location | Field Name | Date | Number of ground truth samples | Instrument |
| OFallon, MO | D3 | July 20, 2021 | 50 | Dualex, SPAD |
| OFallon, MO | D7 | August 04, 2021 | 50 | Dualex, SPAD |
| OFallon, MO | D7 | August 11, 2022 | 100 | Dualex, SPAD |
| Fischer Farms, MO | S29 | August 08, 2023 | 300 | CI-710 |
| Fischer Farms, MO | S32 | August 08, 2023 | 300 | CI-710 |
Ground truth data collection
To identify a suitable N-Status index for the PS imagery, it was necessary to acquire ground truth data to correlate imagery reflectance values with nitrogen levels. Leaf chlorophyll concentration emerged as an ideal proxy for assessing the overall nitrogen status of the plant. Numerous studies have demonstrated a significant correlation between varying levels of nitrogen treatment in plants and total chlorophyll concentration (Yuan et al. 2016, Wood et al. 2008, Minotti et al. 1994). Chlorophyll data were collected from sample plots in the fields, where four plants were selected, and four top-row, sunlit leaves were used to extract the chlorophyll data. These readings were averaged to determine the plot average chlorophyll status, serving as an indicator of the overall nitrogen status for the plot. For the experimental fields in 2021 and 2022, chlorophyll data were obtained using the Dualex Scientific 4 handheld instrument (https://metos.global/en/dualex/) and SPAD Meter (https://www.konicaminolta.us/). In 2023, the CI-710s SpectraVue Leaf Spectrometer (https://cid-inc.com/plant-science-tools/leaf-spectroscopy/ci-710-miniature-leaf-spectrometer/) was employed. The use of different instruments across these years was due to logistical challenges, which precluded the consistent application of the same instruments throughout the study.
Spectral data extraction
Spectral data from the hyperspectral cube were extracted to perform spectral sensitivity analysis. The plot boundaries were initially digitized using field notes and ArcGIS software. Subsequently, the hyperspectral image cube was cropped according to each plot boundary, and a true vegetation mask was derived by applying a k-means clustering algorithm on the NIR band. The NIR band was specifically selected for k-means clustering because it effectively represents healthy vegetation. Following the extraction of the true vegetation mask, the plot-level average spectral data were computed. A total of 269 reflectance values were extracted for each plot, corresponding to the 269 channels available in the hyperspectral sensor. However, the spectral data were later resampled to align with the Planet band configurations.
Spectral sensitivity analysis
To evaluate the spectral response to N-variability, we selected 8 channels that best represented the wavelength of PS scenes and calculated different spectral indices based on the combination of these bands. We computed normalized difference spectral index (NDSI) for all pairwise combinations of the bands using the following equations:
NDSI = (ρa - ρb)/(ρa + ρb) .................... (1)
where, ρ is the reflectance of wavelengths a and b. To identify the potential N-Status index for the decision support system (DSS), we calculated R-Squared between the spectral indices and the corresponding chlorophyll data collected from the field using Equation (2).
R2 = 1 - ((∑(yi-ýi)2)/(∑(yi-ȳi)2)) .................... (2)
where, yi is the measured chlorophyll data, ýi is the NDSI value, ȳi is the average of all measured chlorophyll data at i-th data point.
This analysis allowed us to identify the most promising spectral indices for accurately determining N-variability and developing the N-Status index for our DSS. Since there are total 8 distinct Planet bands out there, we ended up with 28 distinct NDSI variables.
Decision support system
The decision support system (DSS) for SustaiN was developed using Python and utilizes different frontend and backend technologies. The frontend of the DSS provides an interface for user interaction, while the backend is the actual computation platform that performs all the calculations.
PlanetScope (PS) images
The key idea behind the DSS is the automated download and processing of PS images. The PS images have eight narrowband channels (Table 2) available from August 2021, providing high spatial resolution data (3-m) that allows researchers to monitor crops more accurately. PS images are collected by a constellation of approximately 185 mini satellites known as Planet Doves that together collect images of the entire earth almost daily. However, the use of daily images is often hindered by cloudy conditions during data collection. Still, PS offers one of the best solutions specifically for crop-related studies.
Table 2: PlanetScope 8 Band Specifications
| Bands | Wavelength (nm) |
| Band 1 (Coastal Blue) | 431 - 452 |
| Band 2 (Blue) | 465 - 515 |
| Band 3 (Green I) | 513 - 549 |
| Band 4 (Green II) | 547 - 583 |
| Band 5 (Yellow) | 600 - 620 |
| Band 6 (Red) | 650 - 680 |
| Band 7 (Red Edge) | 697 - 713 |
| Band 8 (Near Infrared) | 845 -885 |
Access to the DSS
Access to the DSS is limited to registered farmers and researchers only. To register, farmers can fill out a questionnaire available on the project website. Based on their answers, the user will receive login information via email (login ID and a randomly generated password). Each time the user intends to access the DSS, the login credentials are required. The user IDs and passwords are securely hosted in the database services provided by Google Firebase (https://firebase.google.com/). Since this project is a pilot approach to democratize remote sensing data, open access for everyone is out of the scope of this project.
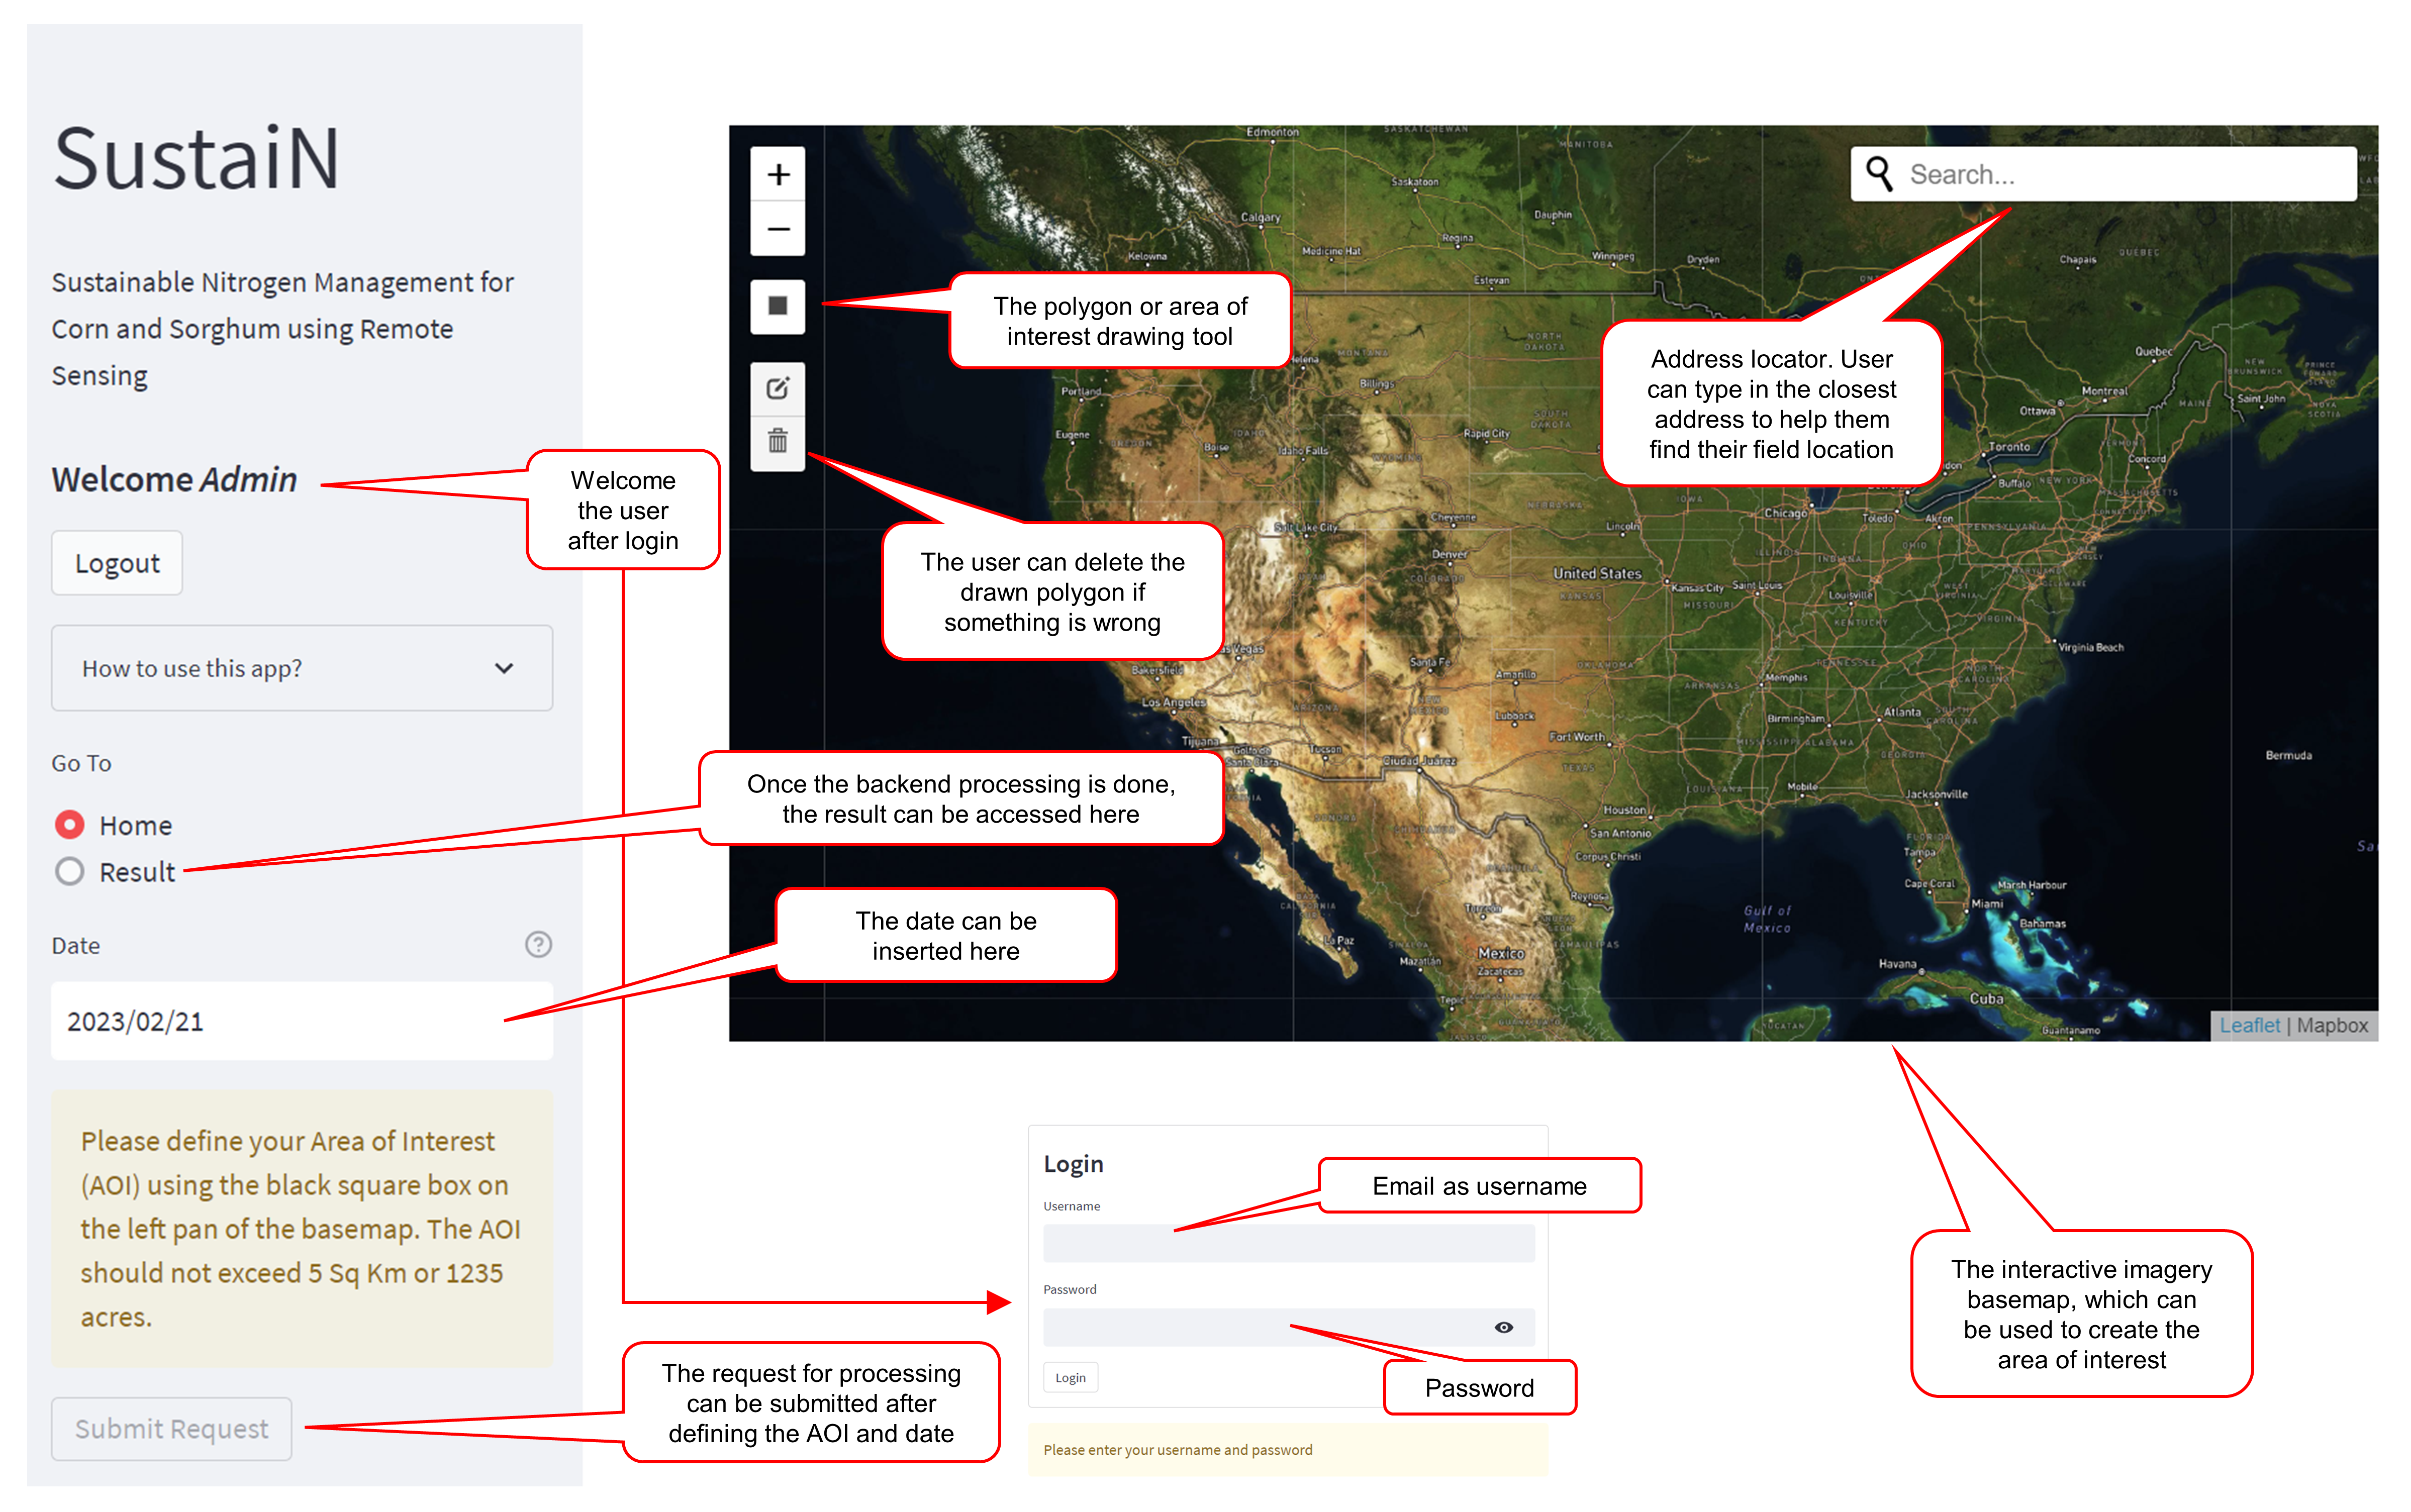
Frontend
The frontend of the DSS is built using the Streamlit framework (https://streamlit.io/) and provides an interface for user interaction (Figure 2). Once logged in, users provide two major pieces of information: 1) a boundary defining the location of their intended field or area of interest (AOI), and 2) the date for which the information is requested. The boundary can be drawn on an interactive map powered by the Folium maps. An address finder in the top right corner of the map helps pinpoint the location of the farmer's field, powered by the Open Street Map. The boundary must be less than 5 square kilometers; otherwise, the process cannot be started. The date is limited to the years 2022 and 2023, so the focus can be given only to recent farming practices. Once the two inputs are defined by the user, the process can be submitted, and the backend of the application handles the rest of the work.
Backend
The backend of the DSS was developed using a combination of open-source geospatial libraries in Python, enabling seamless integration with the frontend of the application. Upon receiving the user's inputs, i.e., geometry and date, the backend uses the Planet API and Python to automatically identify suitable PS satellite images by filtering out images that do not meet the user's criteria. The API searches for images within a 15-day timeframe from the user-provided date and selects the best image based on visibility percentage provided by the PS satellite, which is calculated based on the availability of cloud and haze within each scene. It should be noted that the highest visibility score does not guarantee that the requested geometry will not contain any cloud or haze.
After downloading the image, the backend calculates two vegetation indices, the Normalized Difference Vegetation Index (NDVI) and the N-status index developed earlier, from the PS image. The NDVI is commonly used to highlight healthy vegetation from remote sensing imagery and can be used to mask out unwanted objects within the user-defined geometry, such as roads, buildings, waterbodies, and forests. However, the range of NDVI values for healthy vegetation can vary depending on the specific crop and environmental conditions. Therefore, in the results section, the user can dynamically adjust the NDVI range to mask out unwanted objects within the result.
Using the adjusted NDVI range, input geometry, and date, the backend generates an interactive map of the N-Index overlayed on top of the basemap imagery. The user can toggle between the generated map to highlight major N-deficient areas suggested by the N-Index. The user can also interactively adjust the NDVI range to adjust the number of unwanted pixels within the AOI. Finally, the information can be downloaded as an HTML page in the local drive by clicking the download button. The output will include the interactive map along with other metadata information.
Cloud integration
The DSS is hosted within the Heroku framework (https://www.heroku.com/), which is a popular cloud platform that allows easy deployment of web applications. The Heroku platform provides a wide range of services, such as automated deployment, scalability, and database integration. Therefore, when the traffic increases for the application, we can easily scale it up to match the demand. In addition, the Heroku platform provides built-in monitoring and logging services, which allow for easy identification and resolution of any issues that may arise during the deployment and operation of the DSS.
References
(1992) Field chlorophyll measurements for evaluation of corn nitrogen status, Journal of Plant Nutrition, 15:4, 487-500, DOI: 10.1080/01904169209364335
(2016) Indicators for diagnosing nitrogen status of rice based on chlorophyll meter readings, Field Crops Research, 185, 12-20, DOI: 10.1016/j.fcr.2015.10.003
Minotti, P.L., Halseth, D.E., & Sieczka, J.B. (1994). Field Chlorophyll Measurements to Assess the Nitrogen Status of Potato Varieties. HortScience HortSci, 29(12), 1497-1500. DOI: 10.21273/HORTSCI.29.12.1497
Hyperspectral Data Collection of the Fields
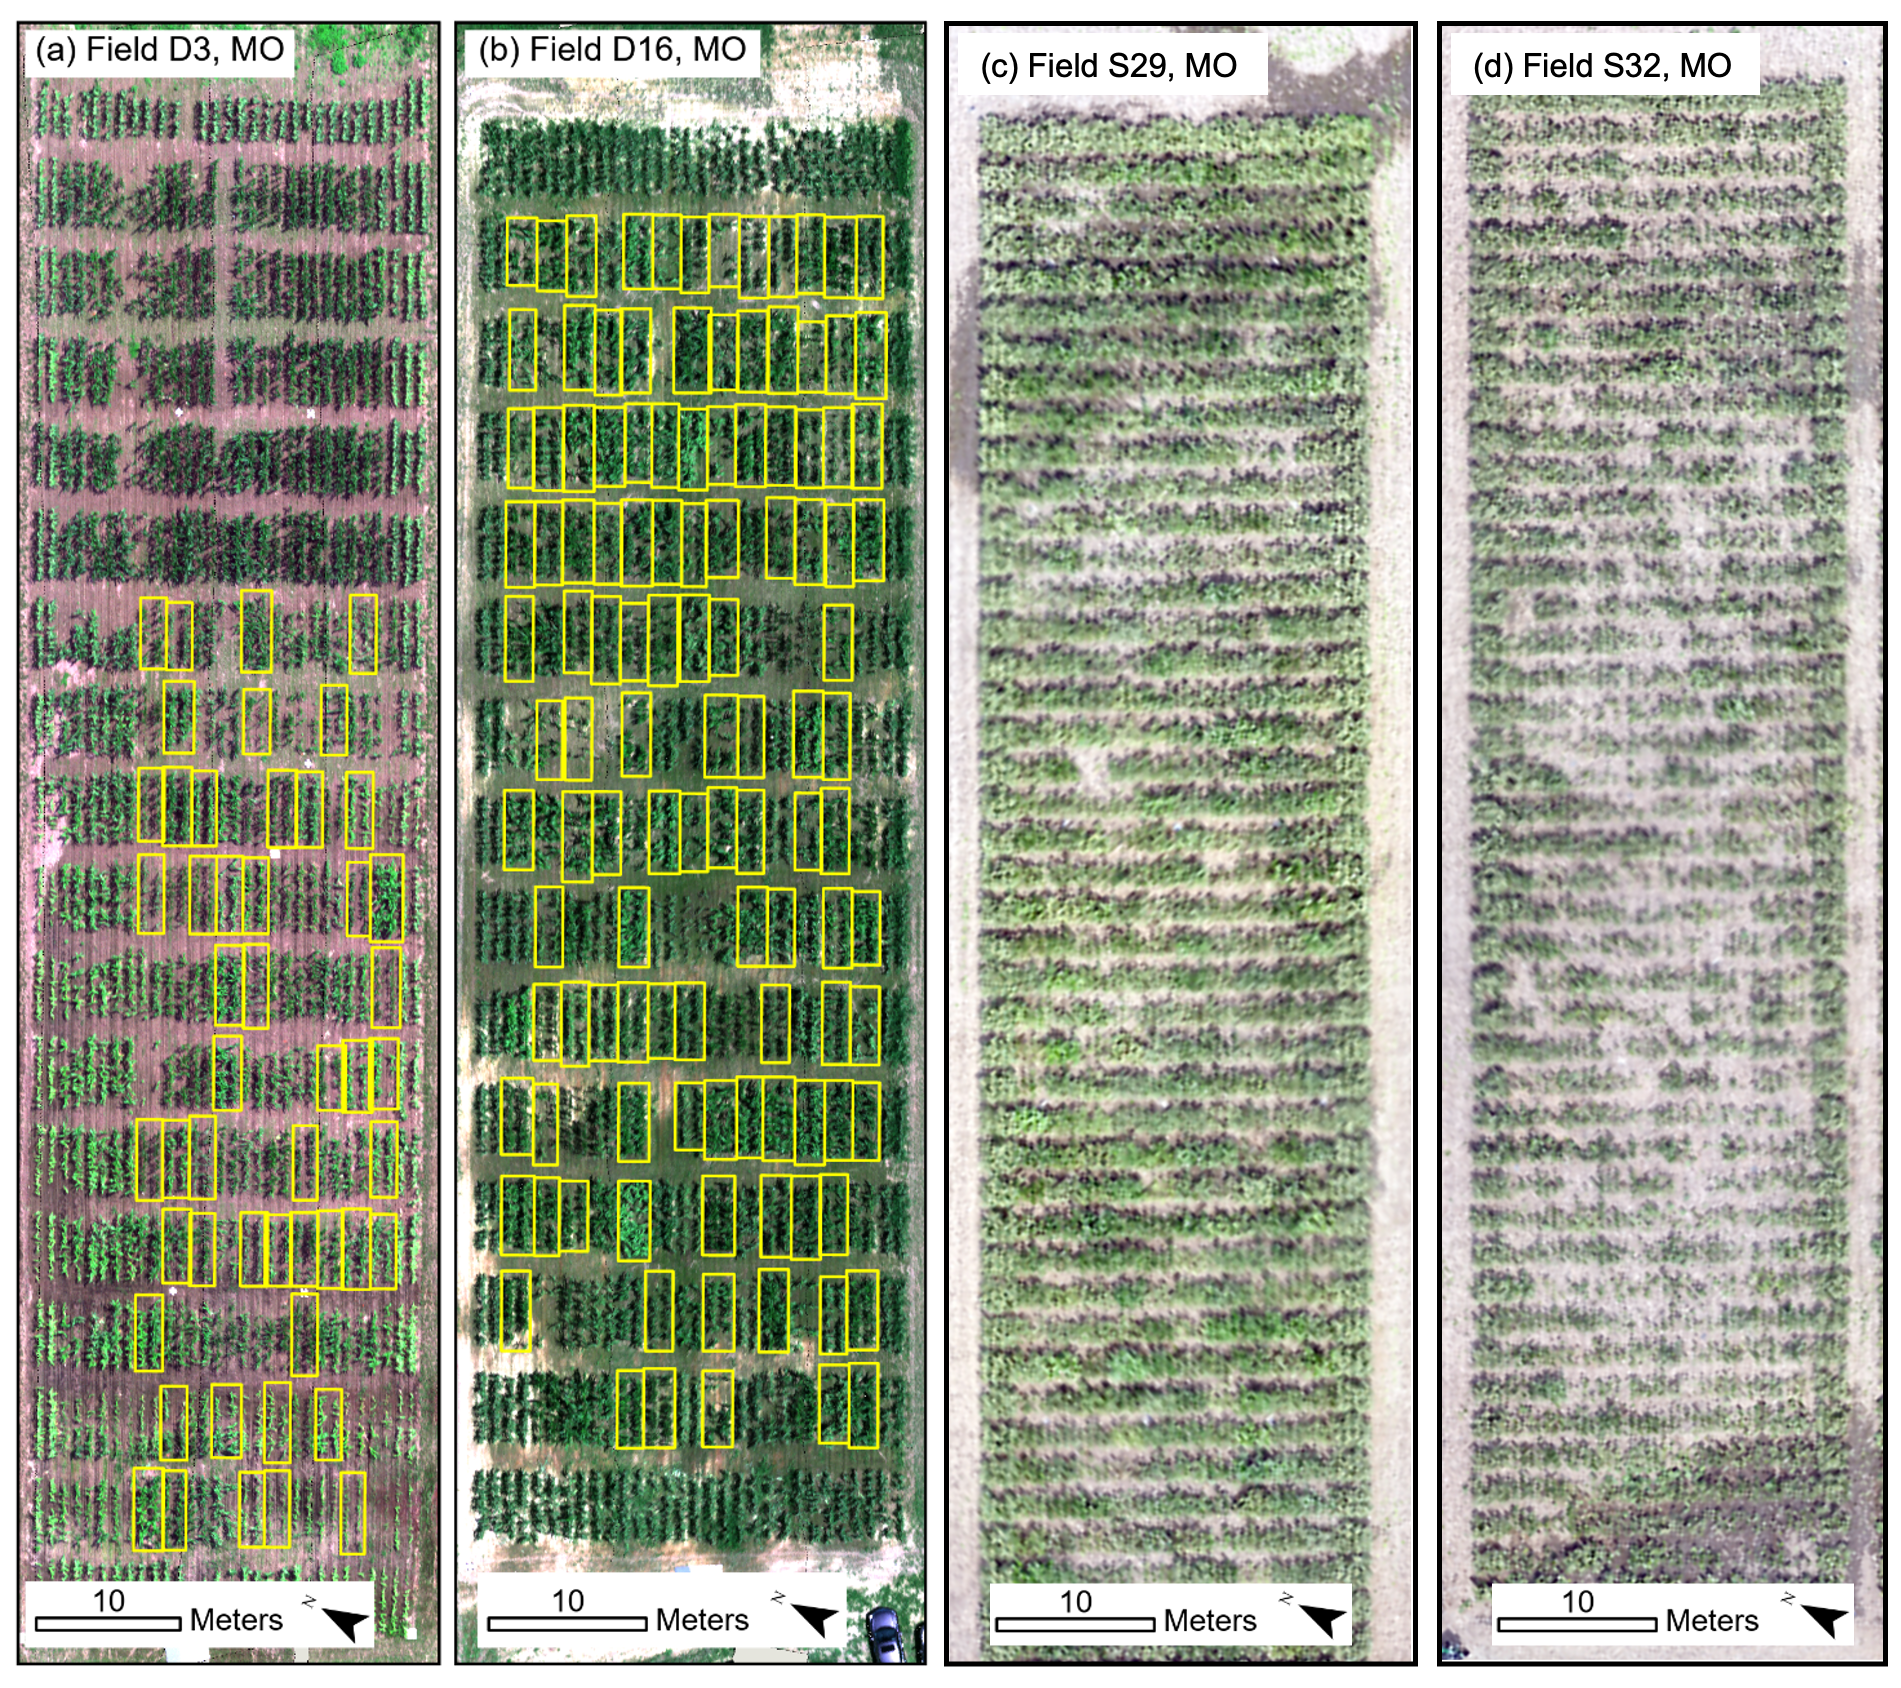
The hyperspectral data collection of the experimental fields from 2021, 2022 and 2023 were done. All the images were processed and plot boundaries were generated using ArcGIS Pro software. Figure 3 shows the orthomosaics generated from the fields using the UAVs and associated plot boundaries.
NDSI sensitivity analysis
The sensitivity analysis was conducted for all three different sources of ground truth data. Figure 4 shows the R-Squared calculated between the NDSI calculated using the pairs of wavelengths for three different instruments. The color scale is shared across all the figures which makes it easier to compare among the instruments.
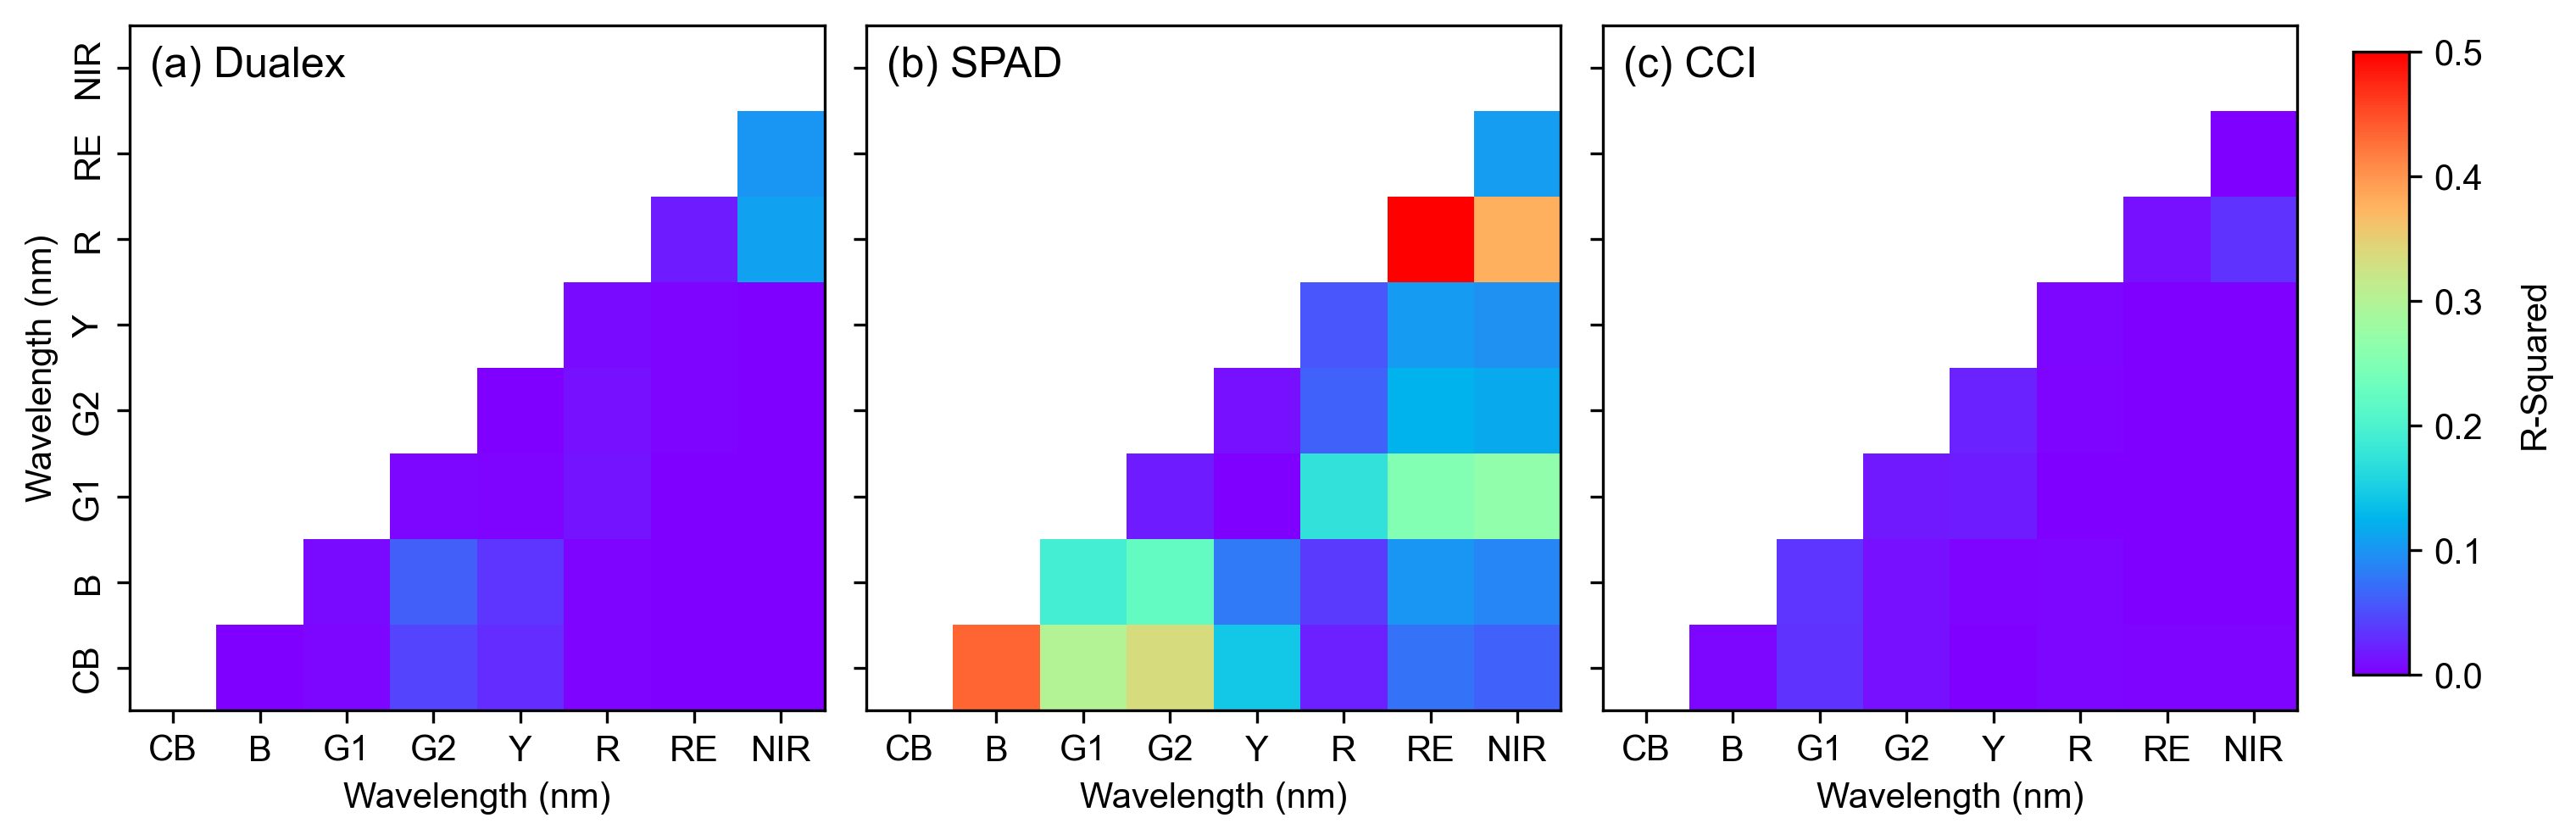
Results suggest that the overall R2 values for SPAD (Figure 4b) was better compared to Dualex (a) and CCI (c). The R2 for the Dualex and CCI ranged from 0 to 0.1, which is pretty low. However, the NDSI values showed very good correlation with SPAD data (R2 ranging from 0.1 to 0.5), which indicates that NDSI worked really well with SPAD values. Specifically the highest R2 was obtained by the NDSI calculated from the RedEdge (RE) and Red (R) bands. Figure 5 shows the relationship between the best found NDSI(RE, R) and SPAD values.
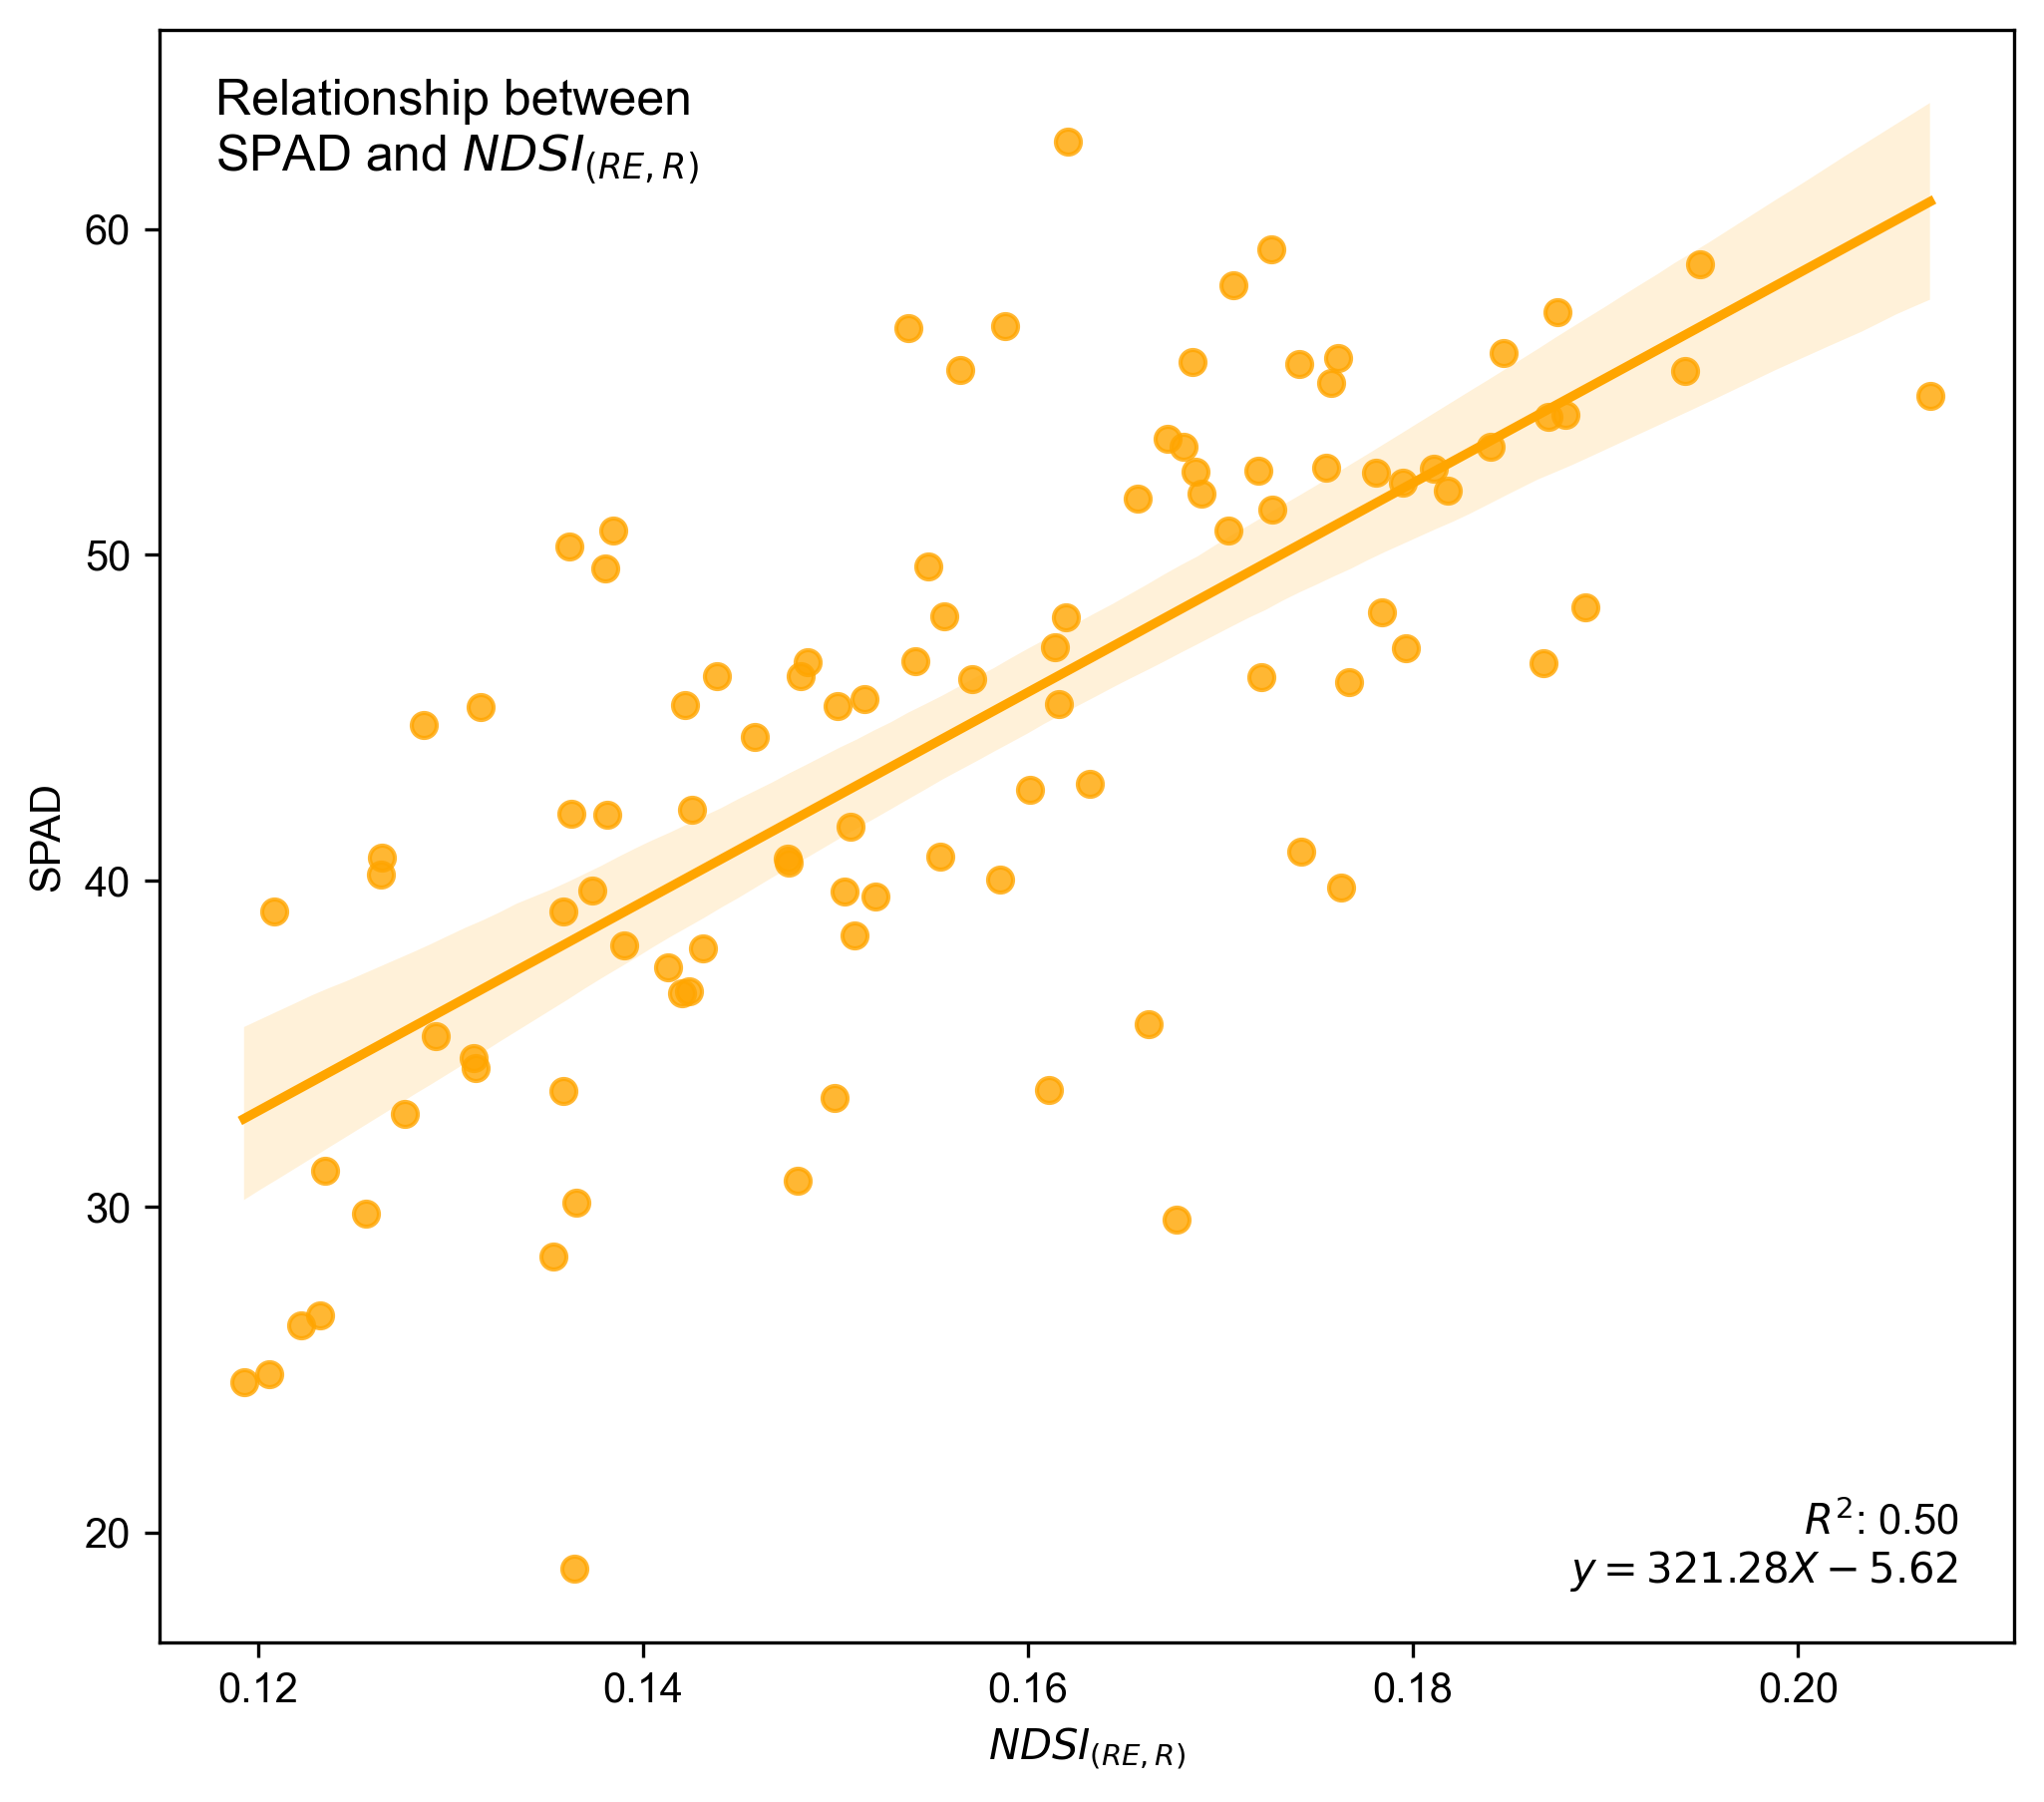
Interpretation of the result
The Red band is located within the region of the electromagnetic spectrum (around 650-680 nm) where chlorophyll strongly absorbs light. This high absorption in the red region is directly related to the concentration of chlorophyll in plant leaves. As chlorophyll content increases, the absorption in the Red band also increases, leading to lower reflectance values. Thus, the Red band is highly sensitive to changes in chlorophyll content, making it a reliable indicator of nitrogen levels, which are closely tied to chlorophyll synthesis. On the other hand, the RedEdge band lies between the Red and Near-Infrared (NIR) regions, typically around 697-713 nm in PlanetScope. It marks the transition between the chlorophyll absorption region and the NIR region where healthy vegetation reflects strongly. The RedEdge is particularly sensitive to changes in chlorophyll content and leaf structure, which can occur due to varying nitrogen levels. Even small variations in chlorophyll concentration can cause significant changes in reflectance in the RedEdge region, making it an excellent indicator of plant health and nitrogen status. The combination of the Red and RedEdge bands in NDSI leverages the strengths of both bands. This combination enhances the sensitivity of NDSI to chlorophyll-related stress, making it a more precise indicator of chlorophyll content.
Educational & Outreach Activities
Participation summary:
The project is currently in its nascent stage, and as a result, we have not yet been able to conduct extensive outreach efforts. However, the project website (https://sustaincrops.net/) contains information on how to participate in the project and use the DSS. We have already reached out to our collaborators from the Donald Danforth Plant Science Center, Sorghum Checkoff, and the Illinois Corn Growers Association. It is likely that farmers will subscribe once the application is fully developed. We anticipate that the application will be released by the end of March 2023. Following the application's release, we plan to use social media and our partners' networks to reach out to interested farmers and encourage them to subscribe. The application will include at least two YouTube videos that demonstrate how to use SustaiN to make informed decisions and how satellite remote sensing works in the background of the application.
Project Outcomes
The development of the SustaiN app has the potential to significantly enhance agricultural sustainability by providing farmers with an accessible tool to monitor and assess plant health, particularly in relation to nitrogen stress. Economically, the app enables farmers to optimize nitrogen fertilizer usage, reducing input costs and increasing crop yields, thereby improving profitability. Environmentally, by facilitating more precise application of nitrogen, the app can help minimize the runoff of excess nitrogen into water bodies, reducing pollution and contributing to the conservation of ecosystems. Socially, the app empowers farmers with knowledge and tools to make informed decisions, promoting sustainable farming practices and contributing to the long-term viability of agricultural communities. As this tool evolves with further research and refinement, it will likely play an increasingly important role in supporting sustainable farming practices that balance economic viability with environmental stewardship and social responsibility.
Knowledges Gained
The primary objective of this project was to explore different open-source geospatial and application tools to develop an easy-to-access decision support system hosted on the web. We found that GDAL-based geospatial tools work effectively and can be seamlessly integrated with Streamlit (the web application building platform in Python), enabling the successful development of this web application. Additionally, the use of Streamlit provided an intuitive and flexible framework for creating interactive web applications, allowing us to deliver geospatial analytics in a user-friendly format. This experience has deepened our understanding of the potential and limitations of integrating open-source geospatial tools with modern web development platforms, paving the way for future innovations in web-based decision support systems that involves satellite remote sensing and other geospatial data.
Challenges and limitations
While the primary objective of this study was to develop an open-source web application utilizing PlanetScope imagery to facilitate broader understanding of potential nitrogen stress in growers' fields, a significant limitation of the study was the reliance on collaborators' fields for experimental data. The scope of the project did not permit the establishment of experimental fields across diverse locations with varying genotypes of corn and sorghum. Consequently, the opportunity to capture a broader range of chlorophyll variability was constrained. Access to a wider array of genotypes, planted with replication across different planting dates, would have enhanced the ability to assess chlorophyll content variability more comprehensively. Additionally, applying varying nitrogen levels across plots would have allowed for a more robust examination of nitrogen stress as influenced by fertilizer application, potentially capturing this variability through remote sensing indices.
The primary outcome of this project is the development of the SustaiN app, a web-based application accessible to growers and breeders. Users can create an online account and submit requests to assess the plant health conditions in their fields. While this study does not establish a statistically significant vegetation index that strongly correlates with nitrogen stress, the app provides a well-known vegetation index (NDSIRE,R) at any given location and time specified by the user. Our recommendations are:
-
Experimental Validation: Future research should build on this tool by designing experiments with varying levels of nitrogen stress across different crops and conditions. This will help to develop a more accurate and statistically significant vegetation index that correlates better with nitrogen stress.
-
Index Refinement: Once the data from these experiments are available, refine or develop new indices that can more reliably indicate nitrogen stress, potentially improving the predictive capability of the SustaiN app.
-
Broader Testing and Application: Expand the testing of the SustaiN app to include a wider range of crops, genotypes, and environmental conditions to ensure the tool’s applicability across diverse agricultural settings.
-
User Feedback Integration: Collect feedback from users to enhance the app's functionality, ease of use, and accuracy, ensuring that it meets the practical needs of growers and breeders.