Final report for GNC23-371
Project Information
Corn (Zea Mays L.) is grown in almost all parts of the United States and is the largest consumer of nitrogen (N) fertilizer. Traditionally, N application rate and time are recommended more at the county or regional level using the regionalized mass-balance equations or through the expected economic returns. With some risk aversion, farmers often apply more than the required amount of fertilizers in their fields and these can exacerbate environmental, economic, and social issues. Research has been conducted in the past to overcome these issues, such as field experiment trials or using remote sensing. These methods are time-consuming, costly, and labor-intensive and do not evaluate environmental sustainability. Another method would be to deploy crop growth models (CGM) for predicting the timing and rate of N fertilizer application; this has not been done to date primarily due to complex user-interfaces and a plethora of model inputs. Some commercially available software packages use CGM in back-end, but subscription fees and lack of data-transparency influence adoption. Furthermore, it is difficult to integrate different (or actual) management practices or crops, and some fail to consider actual past weather. These critical gaps will be overcome by using the CGM (APSIM) with Shiny R to create a free and open-source decision-support tool (DST), Optimum Performance Tool for Informed Corn Nitrogen Recommendation - Open-Source(OPTICORN-OS) to stakeholders and can enforce data transparency.
The primary objective of this project is to increase the adoption of DST in agriculture to make an informed decision and following adaptive management in-season to achieve economic, environmental, and social sustainability. We will achieve this by (i) comparing APSIM simulations with field experiments by varying N rates and timings (ii) developing a DST (OPTICORN-OS), based on APSIM, to recommend N-fertilizer application rate and timing by integrating management, soil, and weather information, (iii) conducting user-testing workshops for farmers, extension educators, researchers for using OPTICORN-OS, to improve usability and effectiveness of the tool, and (iv) training farmers, extension educators, and students to use the tool via workshops and extension events. I will work with faculty at Purdue University, with expertise in agronomy, data modeling and simulation, extension, and software development. A field-scale study will be conducted in parallel with the APSIM simulations. From this research, I will publish two articles and one extension article and present in extension and academic conferences. Workshops will be hosted in the OATSCON-24, Purdue’s Digital Agriculture Showcase, and IoT4Ag annual meeting.
Learning Outcomes
- Farmers and extension educators would be able to better understand the economic and environmental consequences of their in-season decision related to N fertilizer application. These consequences will be estimated through the yield, biomass, amount of N-leaching, and nitrous oxide emissions and will be further validated through the field experiment running parallel to the simulation study.
- We will be developing a decision support tool named Optimum Performance Tool for Informed Corn Nitrogen Recommendation - Open-Source (OPTICORN-OS), to be used to recommend optimum date and rate of N fertilizer application for their fields. Barriers to farmer adoption of the DST will be increased since the tool is free and open-source and prioritizes transparency and usability in design.
- We will conduct surveys on the usability and effectiveness of the decision support tool with farmers, extension educators, researchers, and industry representatives.
Action Outcomes
- Farmers and extension educators from Indiana and the broader mid-west, can use this tool to optimize the N-fertilizer application in corn fields.
Condition Outcomes
- It improves the economic well-being of farmers, since nitrogen fertilizer application is a high-cost input for corn production.
- Addresses the issue of long-term environmental sustainability because overapplication of N fertilizer, reduces soil health and cause serious environmental consequences.
Research
Figure 1 shows the entire framework used for creating the OPTICORN decision support tool.
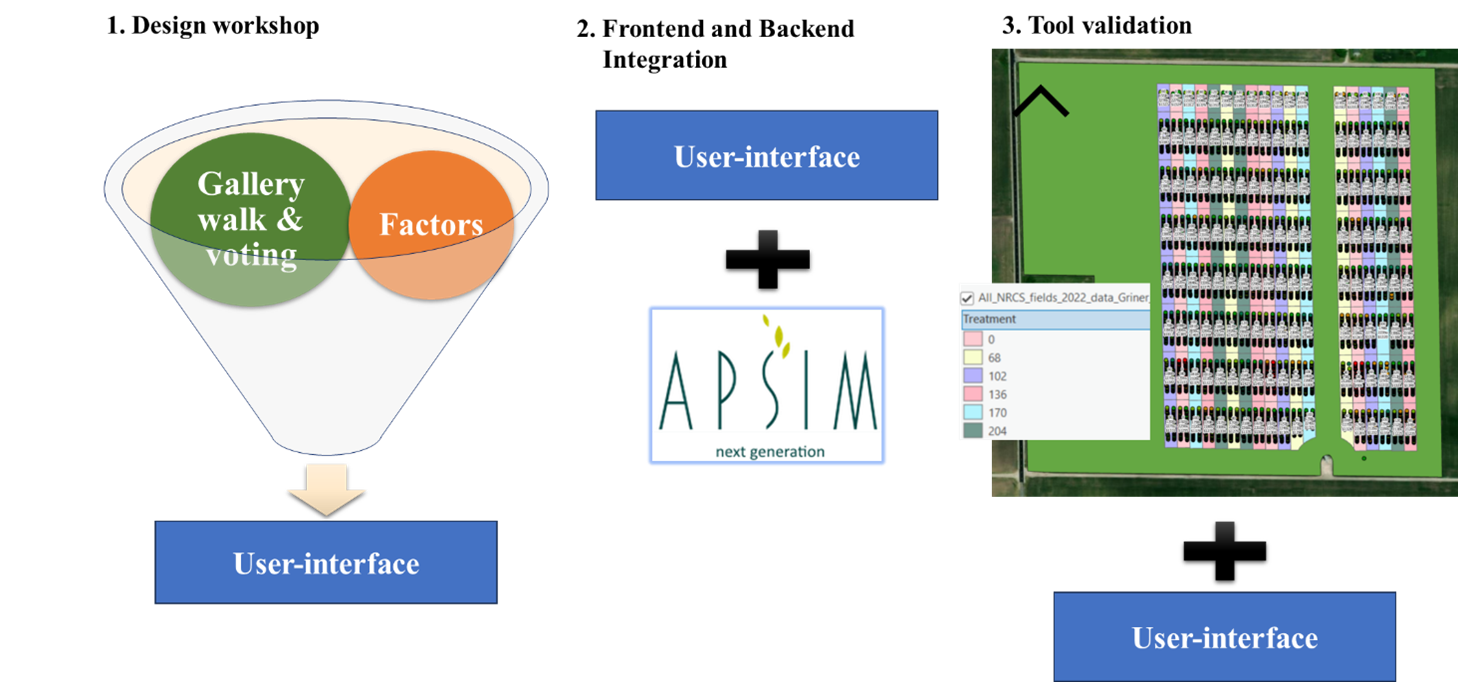
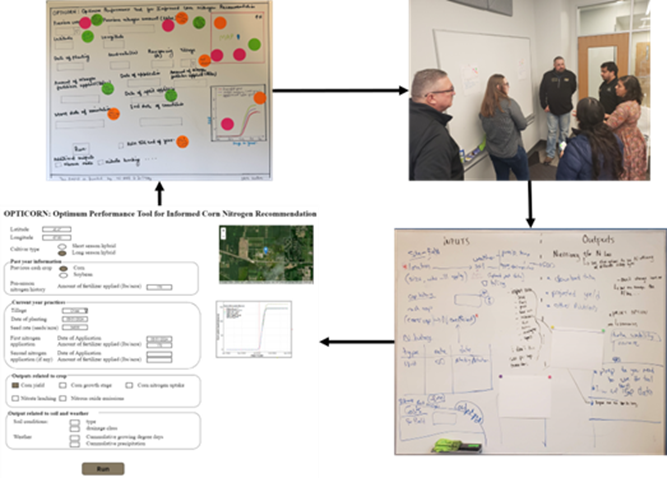
Design workshop: The agricultural ecosystem's inherent complexity translates into equally complex crop growth simulation models, which limits their practical use by farmers and extension educators for real-time farm management decisions during the growing season. These simulation models require numerous inputs from multiple sources and formats, making them time-consuming to implement. Additionally, the required inputs vary depending on the specific use case. A major limitation identified in existing literature on decision-support tools is the lack of end-user involvement in their development and the failure to understand user needs. This gap motivated our co-design workshop, which had two primary objectives: first, to understand which factors farmers and their advisors actually use when making nitrogen fertilizer management decisions for their fields and to map these factors to variables of APSIM; second, to understand farmers' vision of an ideal decision-support tool for nitrogen fertilizer management. To achieve these goals, we employed two software design techniques (Figure 2): gallery walk and maximum voting (Frank 2025, Gibbons 2019). In the maximum voting exercise, participants used stickers to anonymously vote on preferred user interface features and output variables, indicating both likes and dislikes. During the gallery walk, our team stationed themselves next to informational posters to facilitate discussions about participants' thoughts and perspectives on the tool and its features. The workshop concluded with participants collaborating with organizers to co-design a portion of the tool on a whiteboard, which became the foundation for the original OPTICORN tool.
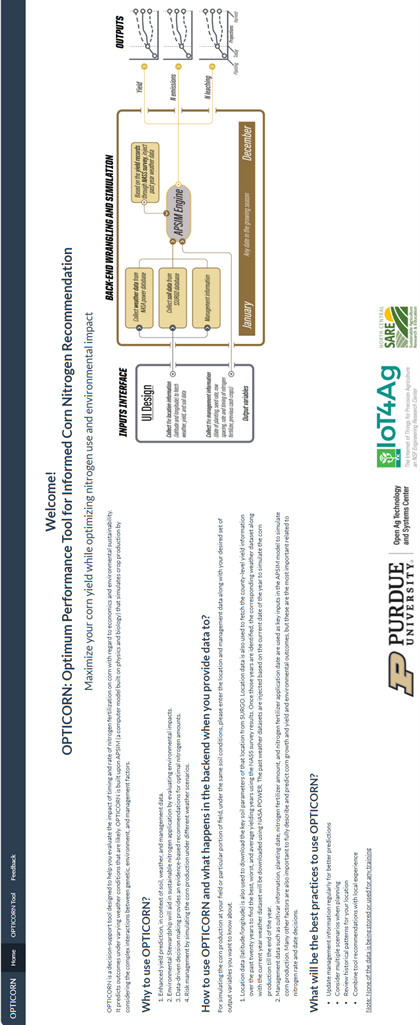
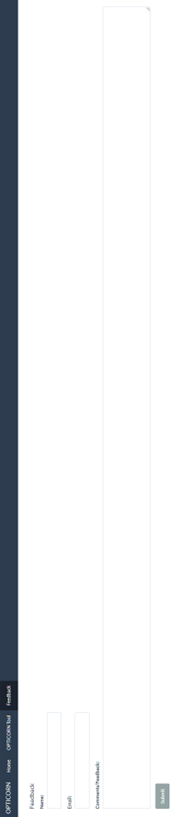
Frontend and Backend integration: The entire tool was developed in R, utilizing multiple backend packages including apsimx, soilDB, shinyjs, shinyBS, nasapower, plotly, and others. The tool features three pages: the first provides basic information about the tool, usage instructions, and expected outcomes; the second contains the main application with input options in the left pane and visualizations and results in the right pane; and the third offers a contact form where users can provide feedback using a valid user ID and comments. All feedback is sent to an email address, which is actively monitored by Harsh Pathak.
The tool requests basic field information from users, including location data to fetch public repositories for information about soil, weather, and historical yield. It also collects N-related management data such as planting dates, previous year’s cash crops, current N management strategies, cultivars and desired output parameters (Baum 2023, Winn 2023). Using the historical yield dataset for the user's county, the tool identifies the worst, best, and average yielding years, integrates this data with current year weather files, and runs .apsimx files in the backend, as weather plays a significant role in corn yield (Thorburn 2024). This functionality enables users to conduct what-if scenarios for their specific conditions of the current year. For users seeking location-specific recommendations, the tool offers a "run optimization" button that executes a non-dominated sorting genetic algorithm II (NSGA-II) to provide nitrogen recommendations based on field location (Deb 2002). These recommendations indicate the optimal nitrogen application amount for the current date. The tool presents three recommendation scenarios based on user priorities: higher yield, lower emissions, or a balanced approach, with options available for high, low, and average yielding years-based weather data.
Validation: Tool validation consisted of two components.
- The first involved testing the alignment between the tool's recommendations and actual field experiments conducted by Dr. Daniel Quinn over the past year. This validation will also compared corn performance and corresponding yields under different nitrogen management trials conducted this year at Purdue under Dr. Quinn's supervision (work in progress).
- The second validation study employed a cognitive walkthrough test with workshop participants to assess how independently they could use the tool and understand its inputs and outputs. For this cognitive walkthrough, we developed a set of 14 questions that participants answered after the workshop. Since the study collected only simple feedback for the designer without requesting personal information, IRB approval was not required.
Design workshop: Based on the design workshop, latitude and longitude, previous cash crops, previous season N management history received the higher number of votes as input factors and yield, crop N uptake, nitrate leaching, and weather and growing degree days received the higher number of votes. While in factor mapping, soil properties, weather information, economics (cost of labor, equipment, N fertilizer), management practices (date of planting, tillage), and genetics were the broad spectrum were of features which influence their management decisions.
Frontend and Backend integration: Figure 3 to 5, showcases the OPTICORN user-interface, highlighting the information required for running the tool and understanding the interpretation of the tool responses. The tool provides user the flexibility to select their cultivar type and previous cash crops through radio buttons, latitude and longitude either by entering it manually or selecting from the map by zoom in/out features, previous N management, current N management, and seed rate through text boxes; date inputs for entering application dates, and checkboxes for selecting outputs. To ease the usability and interpretability of the outputs, separate panes are provided for mapping/plotting different types of output graphs. Text boxes and text areas are used for providing contact information and suggestions, respectively.
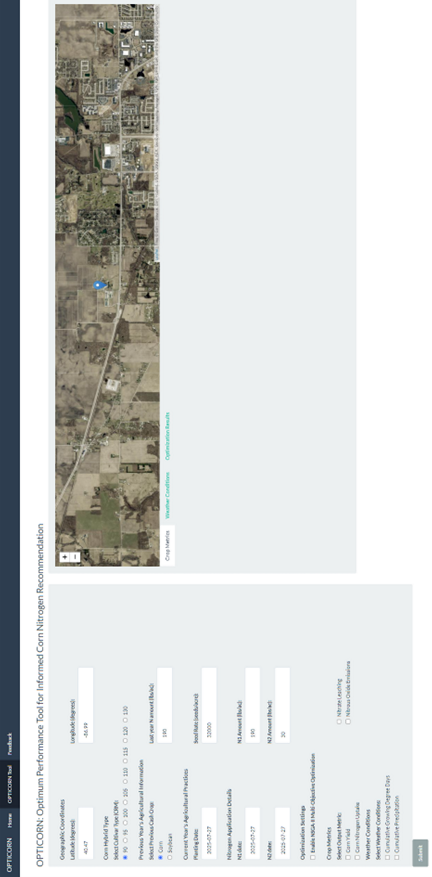
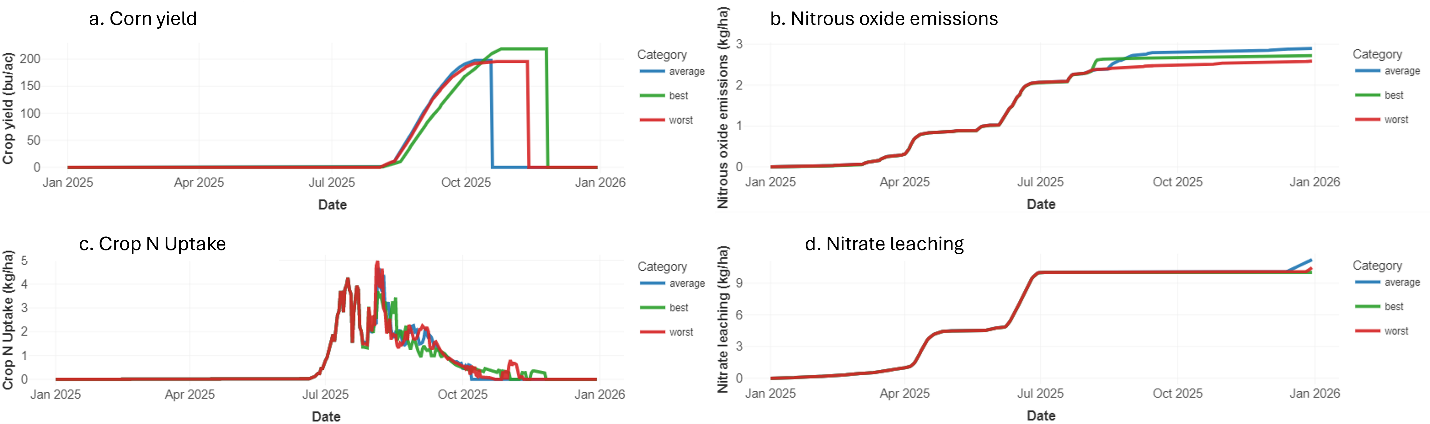
Walkthrough for tool: Given the set of inputs which the user provided in the Figure 6, the tool ran and provided the detailed outputs presented in Figure 7 and 8. It is to be noted that the tool was ran on date July 30, 2025, so as to decide how much N fertilizer would be worth to apply.
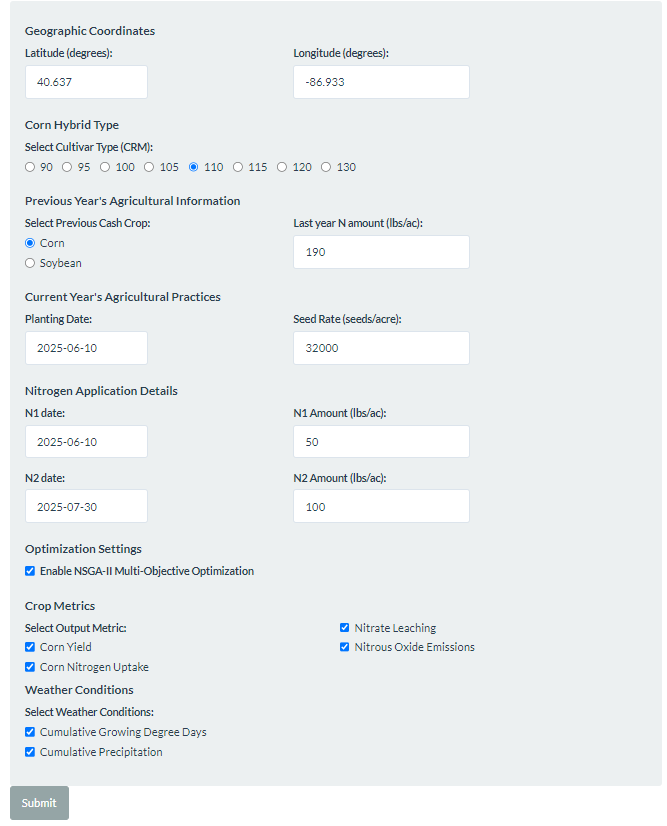
Figure 7 illustrates the temporal dynamics of key agronomic and environmental indicators throughout the growing season, enabling users to visualize the consequences of their N management decisions for the current year based on the best, worst, and average weather conditions for that location over the past 20 years. The seasonal progression reveals distinct patterns for corn yield (Figure 7a), where initially the curve shows minimal differences, but as the growth stages progress, differences between yield scenarios become apparent. It should be noted that differences between projection values decrease as the tool progresses within the season, while early in the season the differences are greater because the corn has not yet experienced future conditions and therefore has greater uncertainty. Nitrous oxide emissions and nitrate leaching (Figures 7b and 7d) demonstrate a gradual increase throughout the season, with emissions and leaching accelerating during periods of high soil moisture and temperature. Crop Nuptake (Figure 7c) exhibits sharp peaks during vegetative growth stages, showcasing when plant nitrogen demand is highest, followed by declining uptake as the crop approaches physiological maturity. This comprehensive visualization allows users to conduct what-if scenarios and understand the temporal trade-offs between productivity and environmental stewardship under location-specific weather conditions.
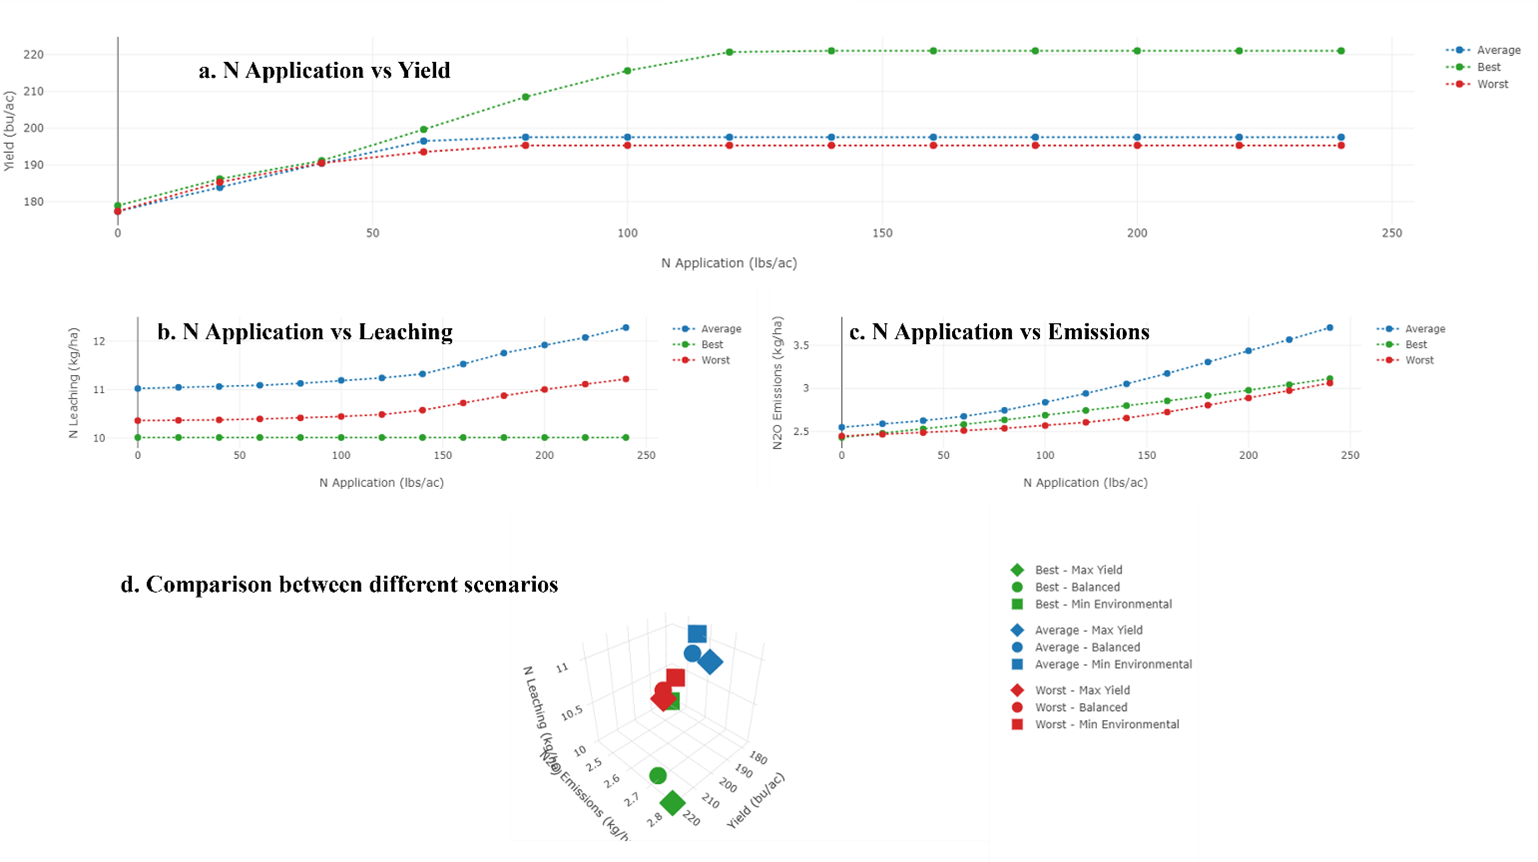
Figures 8a-8c demonstrate that increasing nitrogen application rates progressively increases corn yield, nitrate leaching, and nitrous oxide emissions across all weather scenarios. However, the yield response curve (Figure 8a) exhibits classic diminishing returns, with nitrogen applications beyond 125 lbs/ac (for best condition) providing minimal yield improvements while continuing to increase environmental costs. This response pattern highlights the critical importance of identifying the economic optimum nitrogen rate rather than simply maximizing yield. The three-dimensional analysis (Figure 8d) reveals the complex trade-offs between competing management objectives under varying weather conditions. When users prioritize maximum yield optimization, the results inevitably involve higher nitrate leaching and nitrous oxide gas emissions, a pattern that reflects conventional production-focused agricultural approaches. The balanced optimization approach consistently occupies the intermediate position across all three weather scenarios, achieving near-maximum yields while maintaining moderate environmental impacts. This strategy represents the most practical solution for most farming operations, as it balances economic viability with environmental stewardship, which is an essential component of long-term agricultural sustainability. Conversely, environmentally sound optimization minimizes both nitrate leaching and nitrous oxide emissions but have lower yield potential. The optimization framework enables farmers to make informed nitrogen management decisions based on their specific objectives, market conditions, and environmental priorities. By quantifying these trade-offs, the system provides science-based recommendations that align N applications with user-defined goals while highlighting the environmental and economic implications of each management strategy.
Validation
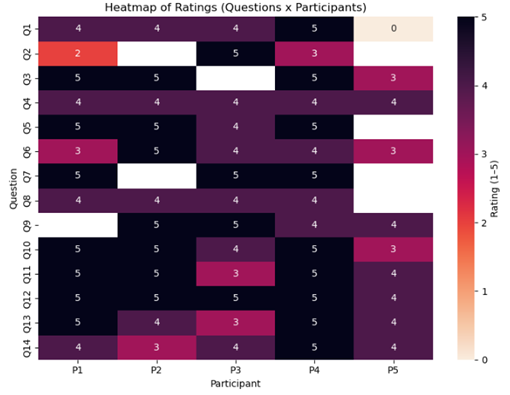
User validation: Based on figure 9, it could be seen that the average rating of the tool was 4.17, when a set of 5 users tested the tool, showcasing the easiness in using the tool. The distribution of responses shows that 74% of ratings were 4 or 5, demonstrating consistent positive user experience across different evaluation criteria. The list of the questions would be available upon request as this work is still in the progress of publication.
While in the case of field testing, we are still in the process of testing the tool performance from Dr. Quinn’s experimental plots.
References:
- Thorburn, P. J., Biggs, J. S., Puntel, L. A., Sawyer, J. E., Everingham, Y. L., & Archontoulis, S. V. (2024). The nitrogen fertilizer conundrum: why is yield a poor determinant of crops’ nitrogen fertilizer requirements?. Agronomy for Sustainable Development, 44(2), 18.
- Baum, M. E., Sawyer, J. E., Nafziger, E. D., Huber, I., Thorburn, P. J., Castellano, M. J., & Archontoulis, S. V. (2023). Evaluating and improving APSIM's capacity in simulating long-term corn yield response to nitrogen in continuous-and rotated-corn systems. Agricultural Systems, 207, 103629.
- Gibbons, S. (2019), Dot Voting: A simple decision-making and prioritizing technique in UX, url: https://www.nngroup.com/articles/dot-voting/. Date accessed July 30, 2025
- Winn, C. A., Archontoulis, S., & Edwards, J. (2023). Calibration of a crop growth model in APSIM for 15 publicly available corn hybrids in North America. Crop Science, 63(2), 511-534.
- Deb, K., Pratap, A., Agarwal, S., & Meyarivan, T. A. M. T. (2002). A fast and elitist multiobjective genetic algorithm: NSGA-II. IEEE transactions on evolutionary computation, 6(2), 182-197.
- Frank, R., & Krueger, S. (2025). Gallery walk as research method in information science. Information Research an international electronic journal, 30(iConf), 171-179.
Educational & Outreach Activities
Participation summary:
Awards:
- Winner of NSF Tricenter Research Symposium – Poster presentation, Virtual
- Second prize in perfect pitch competition, IoT4Ag NSF Engineering Research Center
- First prize in IoT4Ag Shark Tank Competition
Educational/Outreach workshops:
- Software design workshop with extension educators. Total number of people participated #7. March 2024.
- The company named Upside Robotics reached out to learn of the N advisory tool. Presentation given to CEO and CTO in March of 2024.
- Software evaluation workshops with extension educators and domain experts. Total number of people participated #4
- Presented in John Deere Agronomy Community of Practice, June 10, 2025 (virtual, around 35 people)
- Upcoming Bayer talk on September 09, 2025
Presentations:
- Pathak, H., OPTICORN: A nitrogen fertilizer management tool in corn production system, Purdue University, Agricultural and Biological Engineering, Graduate Industrial Research Symposium, 06 March, 2025 (Oral)
- Pathak, H., Dominguez, K., Ona-Morales, A., Buckmaster, D., Raturi, A., Quinn, D., Krogmeier, J. V., Biophysics enabled informed nitrogen fertilizer management in corn production, The Open Ag Technology and Systems Center Conference, Purdue University, West Lafayette, USA, 06 – 08 February 2025 (Oral)
- Pathak, H., Raturi, A., Buckmaster, D., Ona-Morales, A., Dominguez, K., Quinn, D. (2024), OPTICORN: Evaluating the effect of nitrogen fertilizer in corn production, ACRE 75, West Lafayette, USA, 06 September 2024 (Poster)
- Pathak, H., Warren, C.J., Buckmaster, D., Wang, D. (2024), Advancing adaptive agricultural strategies: Unraveling impacts of climate change and soils on corn productivity using APSIM, ICPA Conference, Manhattan, USA, 21-24 July 2024 (Oral)
Peer-review article:
- Pathak, H., Dominguez, K., Raturi, A., Ona-Morales, A., Buckmaster, D., Quinn, D., Krogmeier J., OPTICORN: A decision support tool for nitrogen fertilizer management in corn field, Smart Agricultural Technology (under preparation)
Media Coverage:
- https://youtu.be/nczlglIAW88?si=UR_P7lXTUY9kiViF
Project Outcomes
Based on our knowledge, this tool represents one of the first applications designed to assist users in making nitrogen fertilizer management decisions during the growing season while considering their specific environmental conditions and management strategies. The tool enables users to conduct what-if scenarios and perform optimization to enhance both economic and environmental sustainability. Additionally, it provides a foundation for initiating discussions with domain experts and can serve as a decision support tool for collaborative planning. As the tool continues to evolve through the incorporation of user recommendations and additional scientific knowledge, such as input fields for initial soil nitrogen conditions and moisture content, we anticipate further improvements in tool performance and user utility.
Challenges and Limitations
The primary objective of this work was to create a generalized N fertilizer recommendation tool that could serve as a foundation for integrating human intelligence into corn field fertilizer applications to achieve economic, environmental, and social sustainability. In this study, we tested the tool's performance across several fields by initializing soil data using SURGO, employing generic cultivars readily available in APSIM Next Generation, and utilizing gridded datasets for field-specific nitrogen fertilizer recommendations. However, the project's scope did not allow for establishing comprehensive experiments across diverse locations throughout Indiana or calibrating the tool for each specific soil type, cultivar, and corresponding management practice. This limitation reflects the reality that cultivars and management practices represent continuously evolving fields across the entire state, making comprehensive calibration beyond the current project's capacity. Furthermore, hosting this tool and supporting it would be one of the challenges as well.
The objective of this project was to design OPTICORN, a user-centric decision support tool for nitrogen fertilizer management in corn production. Throughout the development process, I gained valuable insights into principles for understanding user perspectives and requirements, particularly how to simplify complex processes to save users' time while maintaining functionality. The technical integration of Shiny with apsimx presented significant challenges, especially when embedding previous years' weather datasets in real-time applications. Developing cognitive workshop questions proved particularly enlightening, teaching me how to systematically plan and observe user interactions with the tool. I also discovered that plotly's user-friendly interface offered substantial advantages over ggplot for this application, as the person can zoom in/out at region of interest. This grant also provided me with the valuable opportunity to mentor three undergraduate students, enhancing my leadership and teaching skills. Additionally, I was able to present my work at numerous venues, which improved my communication abilities and expanded my professional network within the research community. Overall, the experiences gained through this grant have deepened my understanding of user-centric design principles, knowledge that will undoubtedly improve adoption rates for future tools and applications.
The directions and recommendations for future work involve:
- Experimental validation at diverse locations: While we are currently validating the tool's performance using commercial-scale corn field experiments conducted by Dr. Daniel Quinn, additional experimental trials across varied locations are necessary to provide a more comprehensive assessment of the tool's performance and reliability.
- Field-scale extrapolation: The tool currently simulates a selected point within the field and assumes users possess sufficient knowledge about their farm's characteristics and soil type variations. Future iterations should incorporate field-level simulation capabilities to provide users with a more comprehensive understanding of their entire field's fertilizer requirements.
- Integration with remotely sensed imagery: Implementing ensemble modeling that incorporates multiple data sources, including satellite imagery and remote sensing data, could enhance the tool's accuracy and understanding. This integration would also enable scaling the model to county-level applications, broadening its impact and utility for regional agricultural planning.