Final report for GNC23-374
Project Information
Agriculture is a vital component of life and is needed to provide food for a growing population. However, conventional agricultural practices can have negative environmental consequences like sedimentation and eutrophication of downstream waterbodies. Therefore, research is needed on agricultural conservation practices that reduce soil and nutrient loss to protect both farmers from financial losses, as well as water quality in downstream waterways. Winter cover crops are a conservation practice whereby fields are planted with green cover during the fallow season, instead of being left bare. Vegetative cover can retain topsoil and nutrients, especially during storms or snowmelt, by reducing water erosion. Much of the past cover crop research has focused on headwater streams, but their effect on nutrient and sediment export to downstream systems and how these exports compare to those from larger river basins remains a critical understudied issue. Many of these large river basins are of great concern for nutrient and sediment export, as they feed into the Mississippi River which drains much of the US. Placing small agricultural watersheds with high cover crop coverage into the context of larger basin export, especially for river basins of concern in key agricultural states like Indiana, will help improve our understanding of the benefits of cover crops at multiple spatial scales. This context will also be critical as climate change increases the frequency and intensity of storm events in the North Central Region. Here, we used a combination of grab-sample data, sensor data, and USGS monitoring data to quantify the effects of cover crops on nutrient and sediment export at the field-, agricultural watershed-, and river basin-scales. This work involved year-round field work and built on the larger “Indiana Watershed Initiative” project that started in 2015. We shared our data and findings with producers, resource managers, government officials, and others in order to convey the potential benefits of cover crops on water quality. Throughout the duration of the project, we checked our progress through frequent data downloads and analyses, with progress reports and summarized findings given to project partners. The learning and action outcomes of this project provided quantitative support and knowledge on the effects of cover crop implementation on sediment and nutrient export in agricultural watersheds using long-term, multi-year data that incorporates hydrologic variation over space and time.
Learning Outcomes:
I provided producers and resource managers [i.e., Soil and Water Conservation District (SWCD)] with data quantifying the effects of cover crops on nutrient and sediment export at the field-, watershed-, and river basin-scales. I compared nitrate-N (NO3--N) and sediment export over 7 years, for two small agricultural watersheds in Indiana using grab sample and sensor data. I also compared these sediment data to export from major Indiana river basins with a range of cover crop coverage using publicly available data. This approach placed export estimates into context with larger systems and enabled us to examine the scale of cover crop impacts on fluvial export. Our research impact extended beyond watershed science; I shared our findings at a farmer field day and with government officials, thus translating our research to diverse audiences.
Action Outcomes:
Our working relationship with landowners and resource managers in two small agricultural watersheds began in 2008. Since then, our year-round field sampling and monitoring continues to support SWCD efforts to encourage adoption of conservation practices by producers including planting cover crops. The analysis of multi-year data enhanced our understanding of cover crop benefits, including their impacts on nutrient and sediment transport. Findings will enable SWCD staff to communicate the benefits of cover crops to producers using data-informed examples. We shared our findings at local, regional, and national interdisciplinary meetings. Lastly, we communicated results to government stakeholders and agencies to better inform policy and management decisions.
Cooperators
- (Researcher)
- (Educator)
Research
Study Sites
We sampled two agricultural watersheds as part of the larger Indiana Watershed initiative project (Hanrahan et al. 2018; Trentman et al. 2020; Speir et al. 2022; Vincent et al. 2025): Shatto Ditch Watershed (Kosciusko County, IN) and Kirkpatrick Ditch Watershed (Jasper County, IN), which are two small agricultural watersheds that are dominated by row crop agriculture (>85%; soybean-corn rotation; Hanrahan et al. 2018) and include subsurface tile drainage and channelized ditches (Figure 1). They differ in size; Kirkpatrick drains 2660 ha while Shatto drains 1333 ha. Shatto drains into the Tippecanoe River, and Kirkpatrick drains into the Iroquois River, which are both major rivers in the state of Indiana. Both watersheds are drained primarily by subsurface tile drainage, and overland flow was rare during the study period. We measured continuous discharge (Q) at U.S. Geological Survey gages at the outlet of each watershed (Shatto: #03331224; Kirkpatrick: #05524546; U.S. Geological Survey 2025). The two watersheds also differ in cover crop (CC) coverage (Table 1); in Kirkpatrick, the CC coverage was between 8-30% with an average of 17% over the multiyear study period (water years 2016-2022), and in SDW, there was between 23% and 68% CC coverage over the same period, with an average of 50%. At Kirkpatrick, planted CCs included oats (Avena sativa), radish (Raphanus sativus), cereal rye (Secale cereale), and annual rye (Lolium multiflorum). Farmers at Shatto generally planted annual rye or cereal rye. During this period, mean Q was generally higher in Kirkpatrick than Shatto.
Sample Collection and Analysis
To quantify the impact of CCs on suspended sediments, we deployed Hach Hydrolab MS-5 sondes (Hach Hydromet, Loveland, CO) at the outlets of both watersheds to collect continuous water column turbidity (in NTU) at a 30 min interval over the 2016-2022 (Kirkpatrick) or 2016-present (Shatto) water year period. We collected biweekly turbidity samples from tile drains and upstream sites, measured using a handheld turbidimeter (Hach 2100Q; Hach, Loveland, CO). We sampled n=21 tile drains and n=9 stream sites in Shatto, and n=16 tile drains and n=6 stream sites in Kirkpatrick. Here, we are only including tile drains that drain a single field rather than a “county” drain (Speir et al. 2022; Shatto n=17, Kirkpatrick n=18). We quantified tile drain instantaneous Q (L s-1) by measuring the volume of water coming from a tile drain over a specific period of time (Speir et al. 2022). To measure TSS, we collected water samples at the outlets of both watersheds over the study period using a 1 L Nalgene bottle (Thermo Fisher Scientific, Waltham, Massachusetts), which we returned to the laboratory and filtered onto a pre-ashed and weighed Type A/E glass fiber filter. We dried the filter at 60°C for 24 hours, and reweighed for dry mass. To calculate TSS concentration (mg L-1), we subtracted the filter weight from the dried sample plus filter, then divided by the volume of water filtered.
In addition to turbidity measurements, we also measured nitrate (NO3--N) concentration from tile drains, stream sites, and the watershed outlets by filtering 45 mL of water through a Type A/E glass fiber filter (Pall, Ann Arbor, MI) into 50-mL centrifuge tubes (Thermo Fisher Scientific, Waltham, Massachusetts). We analyzed all samples on a Lachat Flow Injection Auto-analyzer (Lachat Instruments, Loveland, CO, USA) for NO3--N using the cadmium reduction method (APHA 2017). We also measured NO3--N at the outlets of both watersheds every 30 minutes during the period using a Submersible Ultraviolet Nitrate Analyzer (SUNA).
Data Analysis
To generate a Turbidity-TSS relationship, we related continuous turbidity data to biweekly grab samples for total suspended solids using a linear regression (Figure 1):
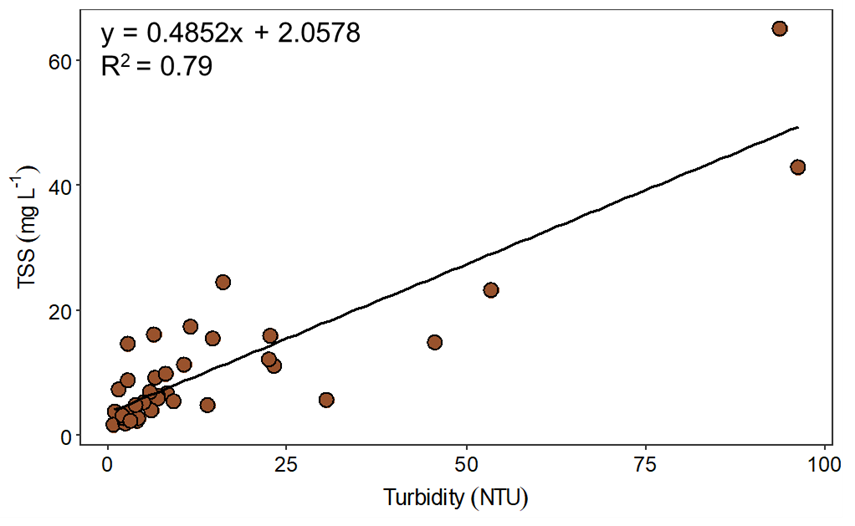
We calculated a multiyear record of daily TSS loads exported from each watershed outlet using this relationship and the record of sonde turbidity data. Our Hydrolab MS5 recorded turbidity every 30 minutes, producing 48 turbidity measurements per day. After using the turbidity-TSS relationship to calculate TSS for each of those turbidity measurements, we took the average TSS concentration for each day to create a daily time series of TSS concentrations. For each day, we calculated TSS load by multiplying TSS concentration by Q. We interpolated missing data using the Loadflex modeling package in R (Appling et al. 2015) to calculate TSS for days where we had a sensor malfunction. Briefly, this model included inputs of TSS concentration calculated from the turbidity-TSS relationship, as well as continuous Q from the USGS gauges. We used the rectangular interpolation function within Loadflex to estimate daily TSS loads, which accounts for the poor relationship between the predictor variables (Appling et al. 2015). To compare between Shatto and Kirkpatrick, which have different watershed areas, we divided load estimates by watershed area to calculate watershed TSS yield. For tile drain TSS, we use the same relationship as above to estimate TSS concentration for each tile drain on each sampling date. To calculate tile drain TSS and NO3--N losses, we multiplied tile drain Q by TSS or NO3--N concentration.
To understand how flow impacted TSS and NO3--N yields in Shatto and Kirkpatrick, we performed a flow duration analysis to determine the proportion of TSS lost at different flow categories (low, medium, high flow). We ranked all days in the study period from lowest to highest Q for each watershed separately, then categorized each day as low flow (<60th percentile of flow), medium flow (60-90th percentile of flow), or high flow (>90th percentile of flow; i.e., storms).
To understand how CCs impact TSS loads, we estimated TSS loads from Shatto and Kirkpatrick using the Soil and Water Assessment Tool (SWAT; Neitsch et al. 2011) at current CC coverages and at 100% CC coverage using the method described in Aboelnour et al. (2025). Briefly, we used ArcSWAT to establish the model configurations for each watershed, then calibrated and validated the model using daily streamflow data from the two watershed USGS gauges. We used our TSS estimates from each watershed across current CC scenarios to further calibrate the model. In the model, we set planting and terminating dates as October 21 and May 5 of each year, respectively, as these are common planting and termination dates in this area (personal observation). We performed four iterations of 2000 simulations using the Sequential Uncertainty Fitting program algorithm version 2 (SUFI-2) of the SWAT-CUP interface (Abbaspour 2011) to estimate monthly TSS loads under no CC and 100% CC (assuming all annual ryegrass) scenarios for each watershed.
To compare our two small agricultural watersheds to major Indiana river basins, we used the publicly available Purdue lthia Water Quality Trending Tool (https://lthia.agriculture.purdue.edu/trending/). This tool allows users to see water quality data, including TSS loads, from 1992 to present day for multiple rivers in Indiana (Harbor 1994; Liu et al. 2015). Loads within the tool are calculated using adjusted maximum likelihood estimation (AMLE) in LOADEST (Runkel et al. 2004), with streamflow and concentration as inputs to the model. We used data from the Purdue trending tool to estimate annual TSS export during our 2016-2022 water year study period from three large rivers in Indiana with varying sizes and CC coverage, including the Tippecanoe River, Kankakee River, and Wabash River basins.
References
Field-Scale TSS Losses
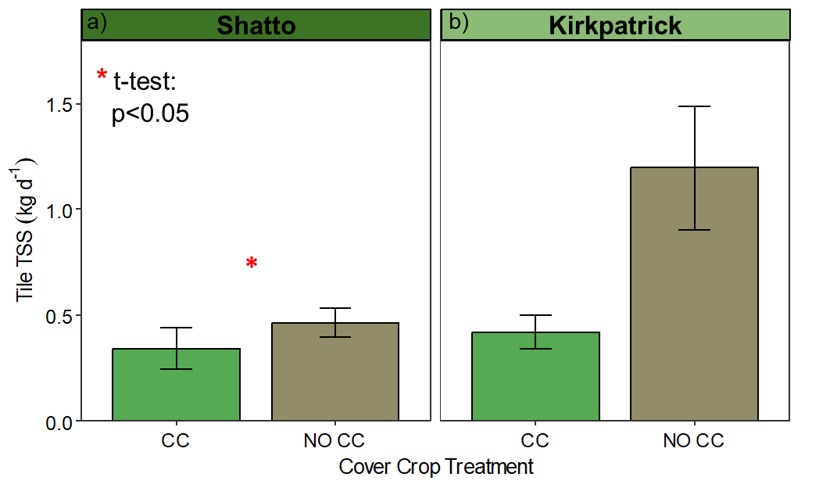
To understand how CCs influence field-scale TSS losses, we compared TSS losses from tile drains draining fields with and without CCs in winter and spring when CCs are present for both watersheds (Figure 2). Average tile drain TSS loss in Shatto was 0.34±1.7 kg d-1 for CC drains and 0.46±1.1 kg d-1 for No CC drains. Average tile drain TSS loss in Kirkpatrick was 0.42±0.79 kg d-1 for CC drains and 1.2±3.7 kg d-1 for No CC drains. Tile drain TSS losses were higher in winter and spring from tiles draining fields without CCs than with CCs in Shatto (Figure 2a; t-test; p<0.001), but not in Kirkpatrick (Figure 2b; t-test; p=0.43). The enhanced soil structure due to CC root stability likely led to the reduction in TSS losses in Shatto (Wong et al. 2024). differences between watersheds could be due to differences in soil type between the two watersheds, as CCs may not have as large of an impact on certain soils (Koudahe et al. 2022). The type of CC planted can also influence the impact CCs can have on solute and particle transport (Kaur et al. 2024), and Kirkpatrick farmers often planted oats and radish which don’t make it through the spring like ryegrass.
Field-Scale NO3--N Losses at Shatto
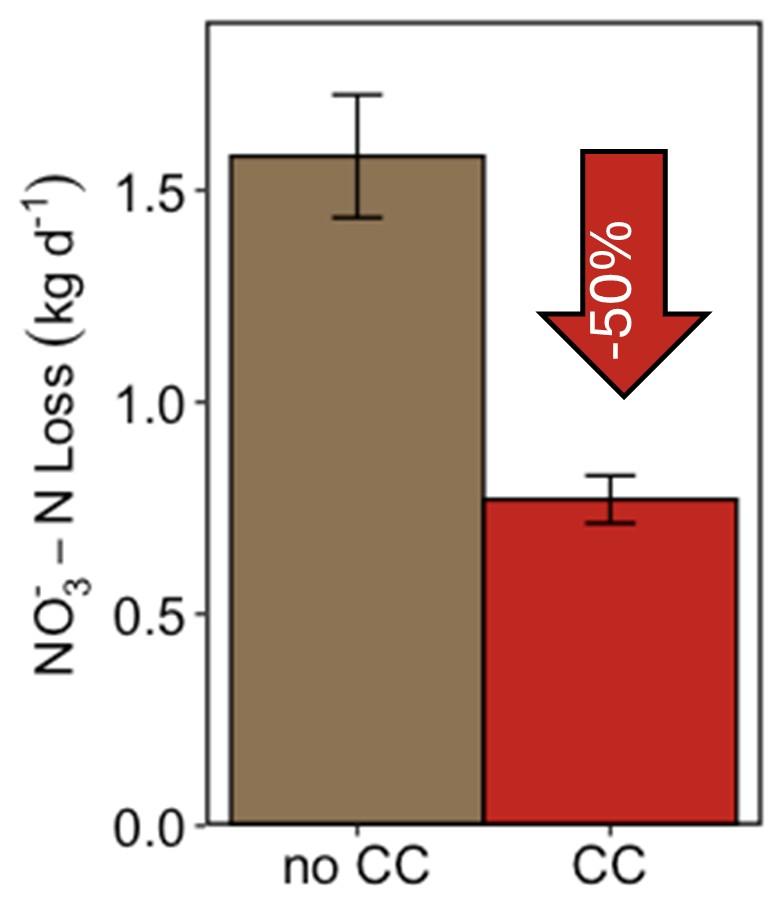
To understand how CCs influence field-scale NO3--N losses in Shatto Ditch Watershed, we compared TSS losses from tile drains draining fields with and without CCs in winter and spring when CCs are present (Figure 3). We found that average tile drain losses were higher for tiles draining No CC fields compare to CC fields. In fact, No CC tiles lost 50% more NO3--N than CC-draining tiles. In Shatto, more NO3--N was lost daily from tiles than TSS, and the effect of CCs was more apparent. This is likely due to NO3--N being dissolved rather than particulate, making it easier to flow through soil macropores into tile drains. The reasons for this reduction in losses of NO3--N with CCs remains the same as with TSS, though, as CCs take up water and nutrients, reducing the amount able to leave the field.
Watershed-Scale TSS Export
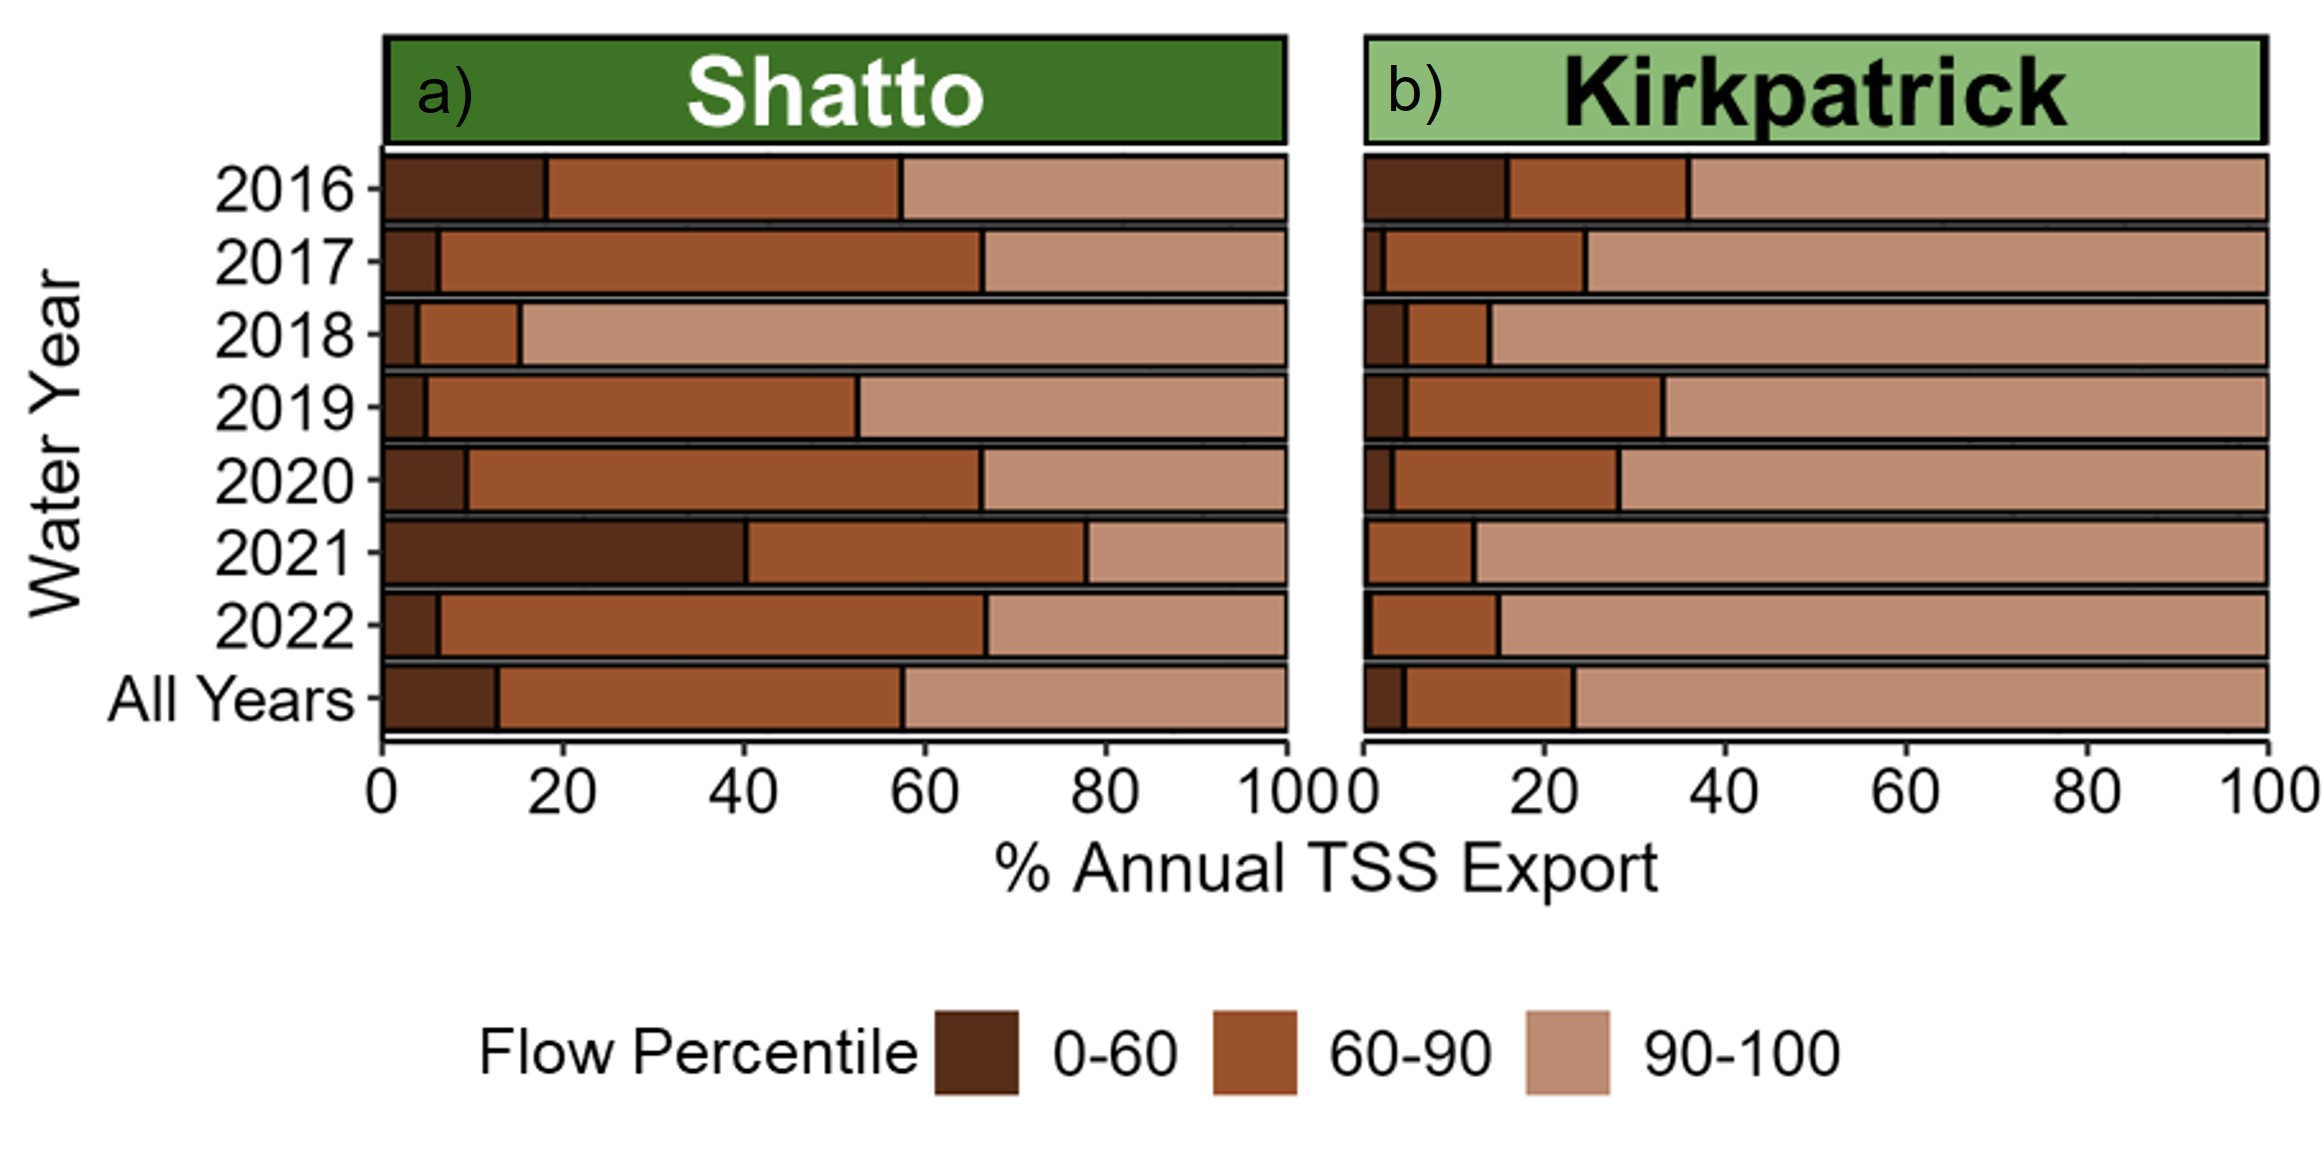
To understand how TSS yields varied by flow category, we performed a flow duration analysis (Figure 4). Differences in TSS yields were more pronounced when we partitioned TSS export from storm flows relative to base flow conditions; TSS yield was ~9X lower in Shatto (Figure 4a) than Kirkpatrick (Figure 4b) when we partitioned TSS export for the top 10% of flows. The lowest flow category (0-60th percentile of flows) made up 4 to 40% of TSS yield at Shatto, and 0 to 16% of TSS yield at Kirkpatrick. In Shatto only in 2021 did the lowest flow category produce the largest TSS yields (40%). On average, the lowest flow category made up 13% of TSS yield at Shatto and 5% of TSS yield at Kirkpatrick. The medium flow category (60-90th percentile of flows) made up 11 to 61% of TSS yield at Shatto, and 9 to 28% of TSS yield at Kirkpatrick. The medium flow category produced the highest TSS yields in four of seven water years at Shatto, and never at Kirkpatrick. On average, the medium flow category made up 45% of TSS yield at Shatto and 19% of TSS yield at Kirkpatrick. The highest flow category (90th-100th percentile of flows) made up 22 to 85% of TSS yield at Shatto, and 64 to 88% of TSS yield at Kirkpatrick. The highest flow category, which is primarily storm flows, produced the largest TSS yields at Shatto in three of seven years, and was always the most important category for TSS yields at Kirkpatrick. A larger portion of TSS export occurred during these highest flows at Kirkpatrick (77%) than at Shatto (43%) on average. A significant portion of TSS export in streams often happens during high flows and storm events (Meybeck et al. 2003; Korup 2012; Ross et al. 2018). The effect of CCs on TSS export under different flows has yet to be studied, but previous nutrient studies in these watersheds showed that CCs reduced N and P losses during high flow events (Hanrahan et al. 2021; Speir et al. 2021). We found that the top 10% of flows were much more important for TSS export in Kirkpatrick than in Shatto, showing that there was more resilience in Shatto soils and sediments to storm events. Our results suggest CCs may effectively reduce watershed-scale export of TSS during storm flows. Cover crops can increase the time for runoff to start, thus reducing sediment export and increasing resilience (Blanco-Canqui 2018).
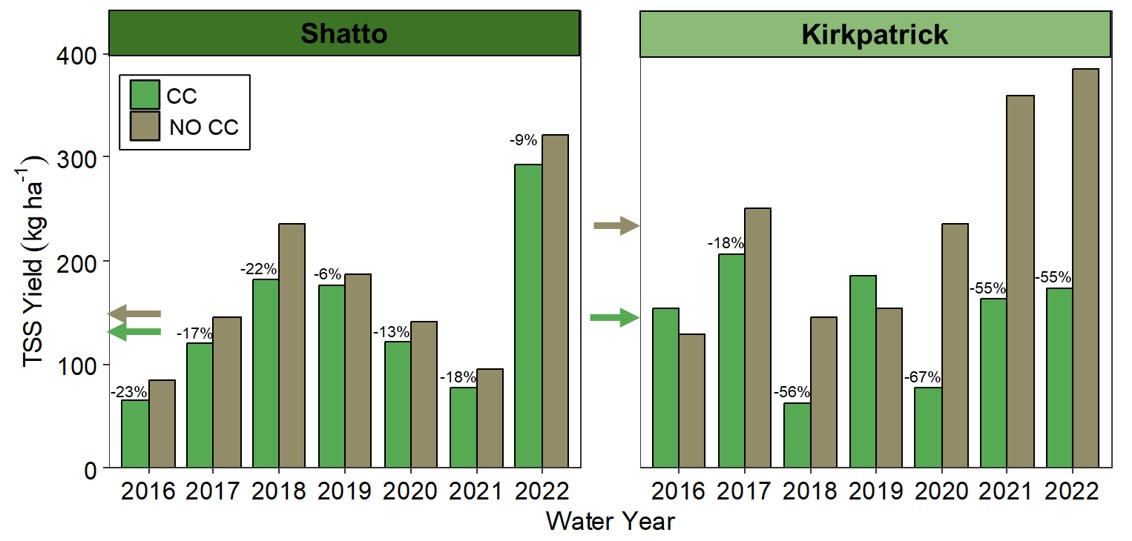
To understand how CCs influence watershed-scale TSS yields, we used a SWAT model to compare annual TSS yields from our two study watersheds with and without 100% CC cover on the fields (Figure 5). We found that TSS yields varied annually with and without CCs, but CCs generally decreased watershed TSS yields. In Shatto (Figure 5a), yields with CCs ranged from 65.4 to 176.3 kg ha-1 yr-1 (mean= 148.3±77.7 kg ha-1 yr-1) and without CCs ranged from 84.5 to 235.8 kg ha-1 yr-1 (mean= 173.0±83.7 kg ha-1 yr-1). In Kirkpatrick (Figure 5b), yields with CCs ranged from 63.1 to 206.0 kg ha-1 yr-1 (mean= 146.0±54.5 kg ha-1 yr-1) and without CCs ranged from 128.4 to 384.6 kg ha-1 yr-1 (mean= 236.7±103.4 kg ha-1 yr-1). In Shatto, 100% CC coverage reduced annual TSS yields compared to No CC coverage by 6 to 23%, with reductions in all seven water years. In Kirkpatrick, 100% CC coverage reduced annual TSS yields compared to No CC coverage by 18 to 67%, with reductions in five out of seven water years. Within each watershed, there was no significant difference between 100% CC coverage and No CC coverage (t-test; Shatto p=0.60, Kirkpatrick p=0.07). Reductions here ranged from 6 to 67%, and in the two years in Kirkpatrick in which we saw higher TSS losses with CCs on the field, the difference between CC and No CC scenarios was minimal. This shows the potential for CCs, when planted on more fields, to reduce soil erosion and subsequently reduce TSS export. Additionally, it can take 10 years to see changes or improvements in soil properties and water quality with the use of CCs due to a lag time in responses (Meals et al. 2010; Waring et al. 2024). With CCs planted on all fields, we see an immediate improvement in water quality when using the SWAT model. Expanding the use of conservation practices, such as planting CCs, will be essential for reducing sediment loads downstream to rivers and reservoirs, as has been found with nutrients (Speir et al. 2022; Aboelnour et al. 2025).
Nitrate Export Across Flows
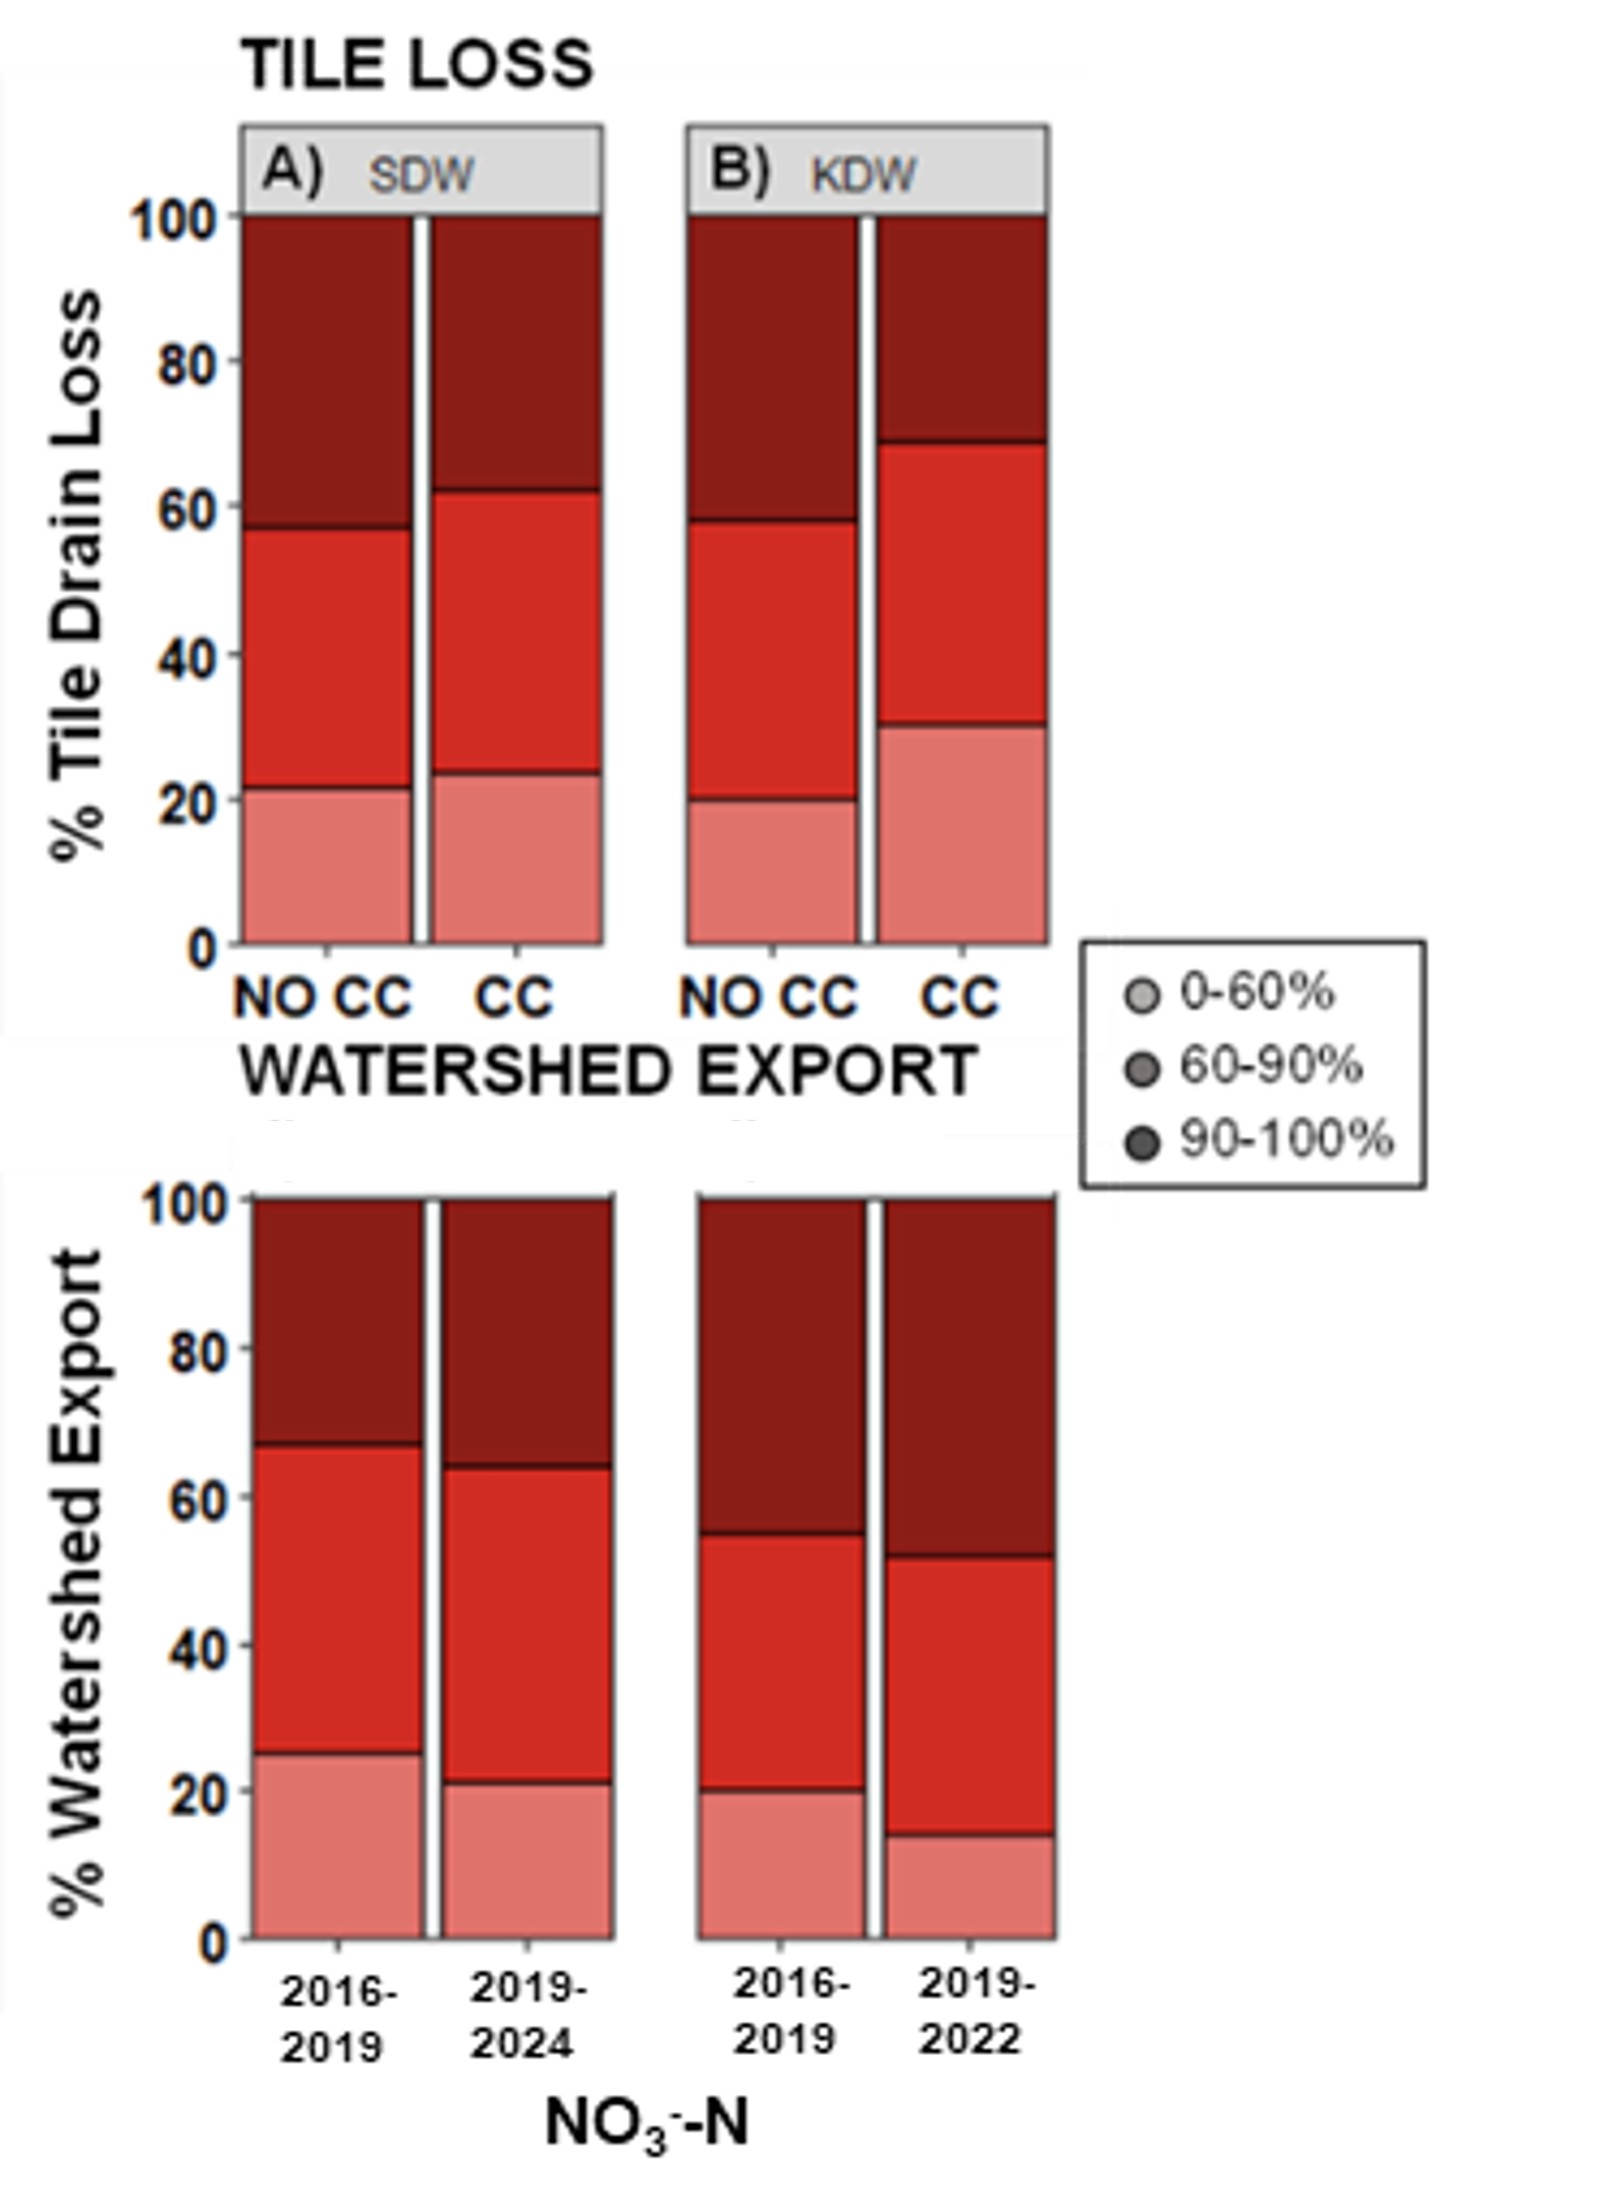
To understand how flow impacts NO3--N loss and export, we performed a flow duration analysis on both tile losses and water-scale export of NO3--N (Figure 6). Flow duration analyses for our two watersheds (Shatto and Kirkpatrick) show that the majority of NO3--N loss and export occurs during storms (top 90-100% of flows). We found that at the field scale, the proportion of total annual export that occurred during high flow was 31-43% for NO3--N. At the watershed scale, the proportion of total annual export that occurred during high flow was
33-48% for NO3--N. At the field-scale, CCs reduced the amount of NO3--N lost during the highest flows in both watersheds, similar to TSS, further suggesting that CCs improve resilience. Shatto (Figure 6a) and Kirkpatrick (Figure 6b) showed similar similar patterns at both the field- and watershed-scale in terms of percent of total annual NO3--N losses and export in each flow category. At the watershed-scale, there were more CCs planted between 2016-2019 compared to 2019-present as we provided incentives between 2016-2019 to plant CCs. In both watersheds, there was slightly lower NO3--N export in the highest flow category from 2016-2019, when there were more CCs planted. While it is not as apparent as at the field-scale, this further shows increased resilience to storm events, and like with TSS, expanding the use of conservation practices, such as planting CCs, will be essential for reducing nutrient loads downstream to rivers and reservoirs as well.
Comparing TSS yields across Watersheds
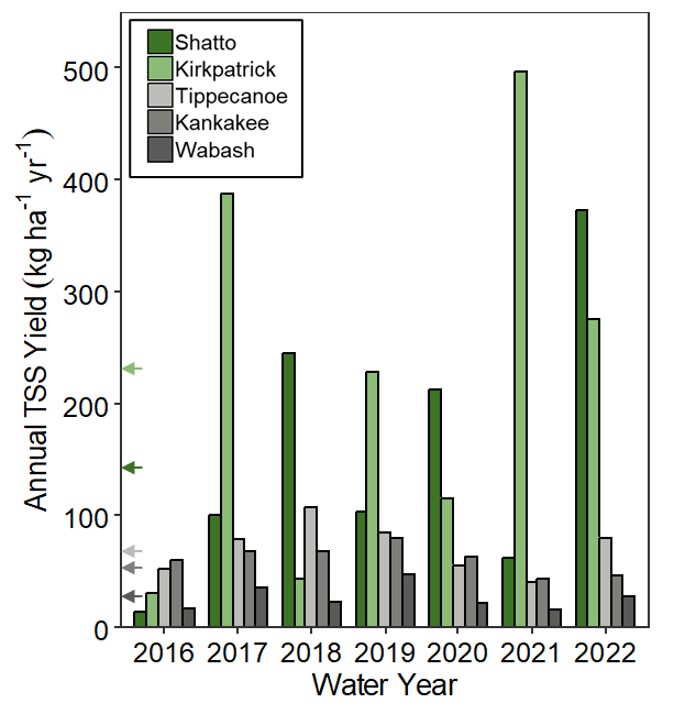
To compare TSS yields across watersheds of different sizes, we compared our small watersheds (Shatto and Kirkpatrick) with TSS yields from larger watersheds in Indiana (Tippecanoe, Kankakee, Wabash River basins (Figure 7). Across watersheds, TSS yield varied by water year. For the Tippecanoe River basin, TSS yield ranged from 39.8 to 108.9 kg ha-1 yr-1 (mean= 71.8±23.4 kg ha-1 yr-1). For the Kankakee River basin, TSS yield ranged from 43.6 to 79.9 kg ha-1 yr-1 (mean=61.3±12.7 kg ha-1 yr-1). For the Wabash River basin, TSS yield ranged from 15.4 to 48.2 kg ha-1 yr-1 (mean= 27.4±11.4 kg ha-1 yr-1). In general, annual TSS yields were higher in Shatto and Kirkpatrick than in the three large watersheds. The three large watersheds did not produce TSS yields that were significantly different from each other (ANOVA; p>0.9 for all). There was a significant difference between TSS yields in the three large watersheds compared to TSS yields in Kirkpatrick (ANOVA; p<0.05 for all), but not between the large watersheds and Shatto (ANOVA; p>0.1 for all), and not between Shatto and Kirkpatrick (ANOVA; p=0.70). Export of TSS may vary between rivers and their tributary streams, but past studies on the relationship between TSS yields and watershed size have shown variable results depending on characteristics of the river basin (Dedkov et al. 2004; Birkinshaw and Bathurst 2006). The larger river basins in this study include larger areas of land uses other than agriculture, such as urban and forested areas, whereas the two small watersheds are primarily made up of agricultural land use. Previous studies have shown differences in TSS export with land use, where TSS concentrations generally decrease with urban and forest area, and increase with cropland area (Dodds and Whiles 2002). Dams and reservoirs within a watershed can also reduce sediment yields (Walling and Fang 2003). Additionally, large rivers are further from their headwaters, which can be a major source of sediment (Morris and Fan 1997). Rivers contribute notably to global sediment transport, and have played an important role in shaping landscapes (Ward et al. 2002). While rivers can play a large role in reservoir and downstream sedimentation, our findings highlight that small agricultural watersheds are major contributors of sediment loads to these larger watersheds.
References
Educational & Outreach Activities
Participation summary:
First, I participated in a Farmer Meeting (marked above as a "field day") for which I created two one-pagers describing our results. Attendants included farmers at Shatto Ditch Watershed (~15 estimated), as well as employees (~5 estimated) at the Kosciusko County Soil and Water Conservation District. We distributed the one-pagers to all attendees.
I am preparing a journal article, to be submitted to an agriculture-based journal by May 2025 using the data from this project. This project is also a chapter in my dissertation.
Finally, I also took part in the 2024 Indiana Science Communication Day at the Indiana Statehouse. I presented research from this project in the form of a poster to state legislators. The title of the poster was "Bare ground, big problems: soil erosion peaks during fallow periods, posing threats to future crop yields."
Project Outcomes
Overall, we show that sediment export at the watershed-scale is variable but CCs may limit sediment and nutrient loss at the field-scale and during storm events which are vulnerable periods when fields would otherwise be bare. However, our findings also emphasize the need for targeted management of small watersheds, as they are the primary sources of sediment and nutrient export compared to large river basins. Reducing TSS and NO3--N export is especially important, as nutrients and contaminants, such as heavy metals, can adsorb to sediment particles, increasing downstream eutrophication and water quality degradation. Advances in high frequency sensor technology have improved NO3--N and turbidity measurements, and subsequently TSS measurements, allowing for better estimates of sediment export from streams and rivers of all sizes. These advances in monitoring will become increasingly beneficial as climate change influences the frequency and intensity of storm events and runoff, impacting the magnitude of TSS and NO3--N yields. Better management of small watersheds, such as through the planting of CCs, will help reduce the impact of climate change on NO3--N and TSS yields and downstream sedimentation and eutrophication.
Cover crops can have many benefits for farmers, both now and in the future. Reduced soil and nutrient loss from fields (which we show with our tile drain results) provides both an economic and environmental benefit. This will save farmers money, as they may not need to use as much fertilizer if more of it ( and nutrient-dense topsoil) stays on the field. Additionally, this will improve water quality downstream. Through these economic and environmental benefits, social benefits are also provided to farmers: improved water quality for rural communities, improved climate resilience, and healthier soils will benefit communities and improve farmland quality so future generations can continue growing food.
Throughout this project, we learned deepened our understanding of the benefits of CCs at the field-, watershed- and large river basin-scales. We refined our ability to analyze large datasets, including a large dataset of water quality data from large river basins in Indiana. In the larger "Indiana Watershed Initiative" study, we had not compared nutrient or sediment export to larger watersheds in the state. In our previous studies, we have seen how CCs improve water quality at the field-scale, but how difficult it can be to see those effects at the watershed-scale. In this study, we found the same thing to be true, but by comparing our watersheds to the Tippecanoe, Kankakee, and Wabash rivers, we really showed how important it is to reduce sediment and nutrient losses from small agricultural watersheds, as that is where the majority of these sediments and nutrients moving downstream are coming from. Overall, this project strengthened our commitment to sustainable agriculture by highlighting the important of conservation practices in improving both water quality and farm resilience and health.