Progress report for GNC23-376
Project Information
Title: Developing A Genomic Breeding Program for Indiana Bee Breeders
Context: Genomic Selection (GS) has revolutionized animal breeding by reducing generation intervals and allowing for predictive selection. Bee breeding plays an essential role in maintaining the health and abundance of honey bee colonies across the United States but beekeepers have yet to incorporate GS in to breeding practices due to technical hurdles and lack of information. My stakeholders, The Indiana Queen Breeders Association (IQBA) have worked to develop and distribute high-quality honey bees across the US. Their work has created a locally-adapted breed that is productive and useful in industry. Unfortunately, the long generation interval and the unpredictability of bee mating in traditional breeding programs makes the process challenging, slow, inaccurate, and expensive. My stakeholders want to incorporate GS into their practices to alleviate these challenges, but lack the required expertise or funds. I propose to work directly with one of Indiana’s largest commercial beekeepers and the IQBA to implement GS in honey bees.
Methods: For the next three years, I plan to integrate a phenotyping and genotyping scheme into existing IQBA bee breeding practices. I plan to build a dataset of economically desirable traits for nearly 2,000 colonies and use GS to breed bees more rapidly and accurately than previously possible and establish IQBA as the first genomic-driven bee breeders in the country.
Outcomes: I will create a GS method that integrates with existing bee breeding infrastructure and practices. This will create a unique, well-selected, locally adapted genetic resource, allowing breeders to produce more productive and robust colonies. This method will be communicated widely through Purdue workshops and extension publications. Stakeholders will learn how to incorporate genomics and evaluate stock robustly.
Evaluation: Success is quantified as increases in phenotypic performance of colonies; profitability of the breeding program in the hands of the IQBA; and an increase in their understanding of GS (utilizing standard pre- and post-surveys).
Relevance: My stakeholders in the NC Region and beyond want to use genomic tools. Throughout the proposed project, I will work directly with them to design and execute a first-of-its kind breeding program. This will result in a more robust bee for Indiana and the NC region and a blueprint for future bee breeding efforts nationwide.
The Purdue Bee Lab works with beekeepers and bee breeders locally and nationwide. Locally, the Indiana Queen Breeders Association (IQBA) and Clover Blossom Honey Company have explicitly expressed interest in this proposal. With the help of Mr. Shenefield (Letter of Participation), I will be working towards four direct outcomes:
- Breeders will learn how to generate, interpret, and implement genomic data, with assistance from Purdue’s existing Sequencing Services
- The IQBA will develop and maintain a Genomic Selected population of honey bees, and continue to use these methods past the end of the project
- The IQBA will experience an annual increase in genetic gain (and thus profitability) of their population
- Breeders nationwide will increase their use of genomic tools through participation in workshops and utilization of extension materials produced as a result this project.
In addition, by working in tandem with one of Indiana’s largest commercial bee breeders, six undergraduate field technicians will receive high quality training in the trade over the course of the project. We hope this will inspire them to pursue research applicable to commercial apiculture, helping bridge the gap between the commercial and academic realms. Finally, upon completion of my PhD, I intend to utilize the skills and knowledge developed during the project in an industry career in honey bee genomic selection.
Cooperators
- (Educator and Researcher)
Research
- Colony setup
- in the early spring, virgin queens were grafted and raised from multiple breeding sources ("breeders") including randomly-chosen queens to establish pre-selection genetic baseline
- queenless "test colonies" were created at multiple locations via splitting overwintered colonies
- all test colonies split near same time, supplying the same quantity of bees, open/closed brood, and honey in two "deep" 10-frame brood boxes formatted on 2x2 palettes with 24 colonies per location
- all test colonies were given a queen cell from a breeder queen (above) one day after splitting such that each location contained queen offspring from >1 breeder and offspring of each breeder went to >1 location
- up to 400 colonies were tracked per year. All colonies were marked in paint pen (using the international standard color for queens for the given year) with a unique number, the identity of the breeder, and the date the cell was added
- queens were allowed 2 weeks (or longer in case of foul weather) to open mate and begin laying
- all colonies then promptly treated against Varroa mites using a towel soaked in organic acid applied to the brood chamber to level any random effect of colony-of-origin. Treatments were rotated each year between available active ingredients as standard practice to avoid development of resistance.
- all colonies were monitored throughout the season
- if a colony became queenless, a new cell from a known breeder was provided. If the colony had also dwindled, a 5-frame nucleus colony (also with a queen from a known breeder) was added. Method of introduction, breeder identity, and date were recorded in paint-pen as specified.
- supersedure or swarming events (evidenced by construction of queen cells) noted
- an excluder and honey supers added to each colony as needed before large flows to allow for honey production
- Phenotypes were gathered in the fall during harvest and during a colony inspection ~1week later
- weight of each super recorded during harvest. To minimize interruption in established harvest protocol, the net weight of a beekeeper plus super and the identity of the colony it came from were recorded using a ground-based digital scale as supers were carried from the apiary to the transport vehicle. Beekeepers were weighted each hour (with carried equipment) to allow for reasonable correction.
- brood pattern scored on 1-5 scale following with identity of observer recorded as a random effect
- counts for frames of bees and frames of brood estimated to nearest 0.25-frame. Estimated for top brood box only.
- brood disease (bacterial or fungal) and worker disease (deformed wings, paralysis) symptoms noted on 4-point scale: 0 (none), 1 (slight), 2 (moderate), 3 (severe)
- 1/3-cup sample of workers taken from brood nest and stored in 60% ethanol in "whirl-paks" labeled with colony ID for rapid field collection
- samples were taken back to a lab space and processed for mite count using standard procedures (noting weight of bees collected)
- ~ 30ml of workers per colony were packaged in vials for genomic sequencing and kept in cold (-20C) storage
- colony survival noted at three time-points: fall harvest, winter (near solstice), and following spring (just prior to next round of breeding)
- Data analysis
- beekeeper cooperatoors were consulted to produce a selection index partitioning total desired progress into each measured trait
- workers were genotyped using restriction sites associated sequencing and sequences assembled using the ipyrad package
- queen genotypes were inferred given their respective worker offspring genotypes using a custom software
- the full genomic relationship matrix G including queens and worker groups was constructed following published methods
- the pedigree relationship matrix A was constructed for the final queens residing in all colonies accounting for breeder of origin and any supercedure events using custom script
- the H matrix was constructed following published methods to incorporate both pedigree and genetic data into a single entity
- phenotypes adjusted:
- honey: weight of beekeeper, super, and wax cappings subtracted for estimate of honey yield per super. Supers belonging to colonies added together to give full yield per colony. Colonies with no harvestable supers considered 0.
- mite count: number of mites per 100g of bees in sample
- pattern: adjusted for observer bias
- survival: coded as 0 (died before harvest), 1 (present at harvest, died before winter, 2 (present at winter, died before spring), 3 (survived until spring)
- all quantitative traits were standardized across colonies
- Phenotypes fit using the following mixed model equations
- Yijklm = μ + wi + qj + ck + sl + rm+ e
- where: μ is the population mean, s is the fixed starting condition (split, nuc, or swarm), r is the fixed requeening condition (none, cell, or nuc), c is random contemporary group (location and year) with diagonal covariance σc2I, w and q are the random worker and queen effects with covariance σw2H and σq2H, and e is the random residual with covariance σe2
- variance components (σw2, σq2, σc2, σe2) were estimated using the REML method (airemlf90 software) for quantitative traits and Gibbs sampling (thrgibbsf90 software) for threshold traits
- mixed model equations solved for worker and queen effects, which are equivalent to breeding values, using blupf90 software
- queens ranked using breeding values, genetic covariances, and index following published methods
- Breeding Cycle
- the highest performing surviving queens on the index were selected as breeding individuals for next generation with no more than 4 from a single mother (to promote maintenance of population diversity)
The Methods section above represents up-to-date revisions, given our protocols have undergone considerable modification after experience with field realities and input from beekeepers. Refinement of these methods is an important goal of this study. Results have been recorded for the first two years of the project (792 combined colony records) with two years remaining (we anticipate 1600 total records).
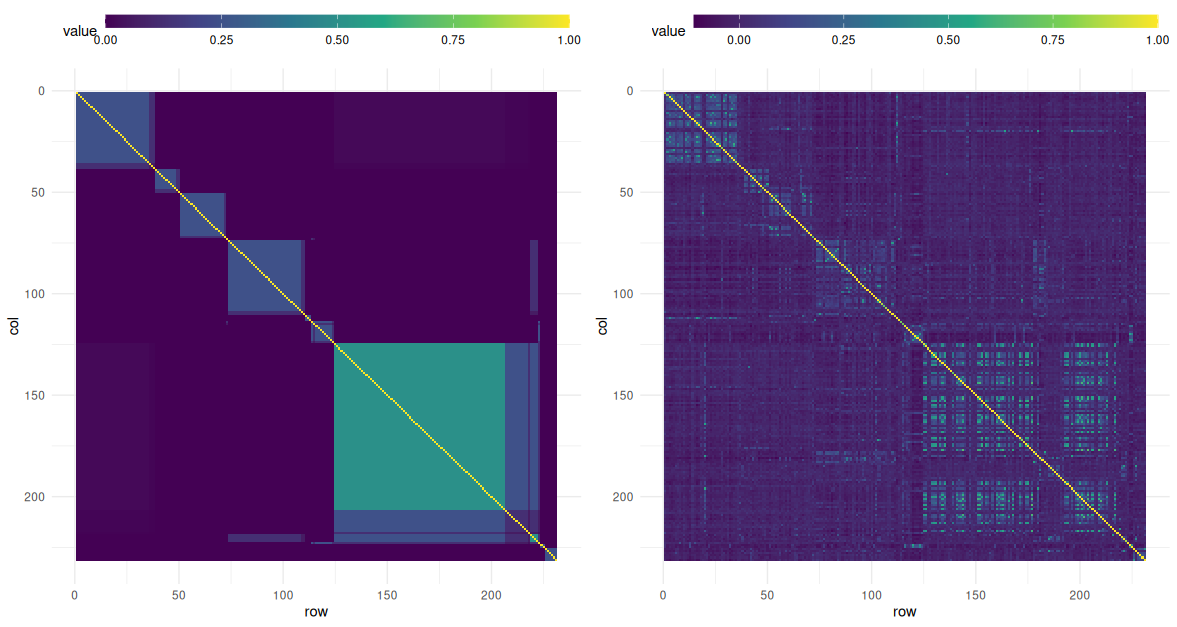
For 2023 data, the full pedigree (Figure 1) was used to estimate genetic (co)variances for each trait of interest (Table 1). In the first year, lack of sequence data prevented inclusion of worker effects, so only queen effects are shown. We found high heritabilities in honey production, brood pattern, and survival; suggesting these traits have high potential for improvement through selection. However, inclusion of more years of data and fitting of queen effects will impact these estimates. Unexpectedly-high winter mortality as well as space and labor constraints in the breeding apiary limited the number of selected colonies to four. These queens were used as breeders for the 2024 season. Sequence data for 2023 colonies was received too late to incorporate in breeding decisions, but is being used to refine 2024 models. Relatedness based on sequence data roughly validates expectations of the pedigree, but notable outliers (mis-classified individuals) are apparent (figure 4).
For 2024 data, genetic analysis is still ongoing at the time of this report, but preliminary results suggest significant variance between "family groups" (offspring of individual 2024 breeders) which could indicated heritability is still high. Phenotypic records suggest population-wide improvement in most traits except honey production (figures 2 and 3). Seasonal variation, particularly climate, has an extreme impact on colony traits. The true rate of improvement will be much more clear after more seasons of data allow proper accounting of seasonal effects. Over-winter survival for the 2024 season is not yet able to be measured.
Table 1
| honey | pattern | mites | survival | dwv | brood disease | |
| honey | 0.89 | -0.062 | 0.12 | |||
| pattern | -0.062 | 0.87 | -0.13 | |||
| mites | 0.12 | -0.13 | 0.082 | |||
| survival | 0.25 | -0.08 | -0.036 | |||
| dwv | -0.08 | 0.13 | 0.061 | |||
| brood disease | -0.036 | 0.061 | 0.11 |
This table shows estimated genetic (co)variances of queen effect for traits in 2023 test colonies. Because all traits are standardized, the diagonal is equivalent to heritability. Because quantitative and threshold traits were estimated separately using REML and Gibbs sampling respectively, their covariances were not estimated. Negative covariance between survival and disease symptoms is to be expected. Negative covariance between honey production and brood patterns and positive covariance between honey production and mite counts is notable given these are undesirable in terms of stock improvement.
Figure 1
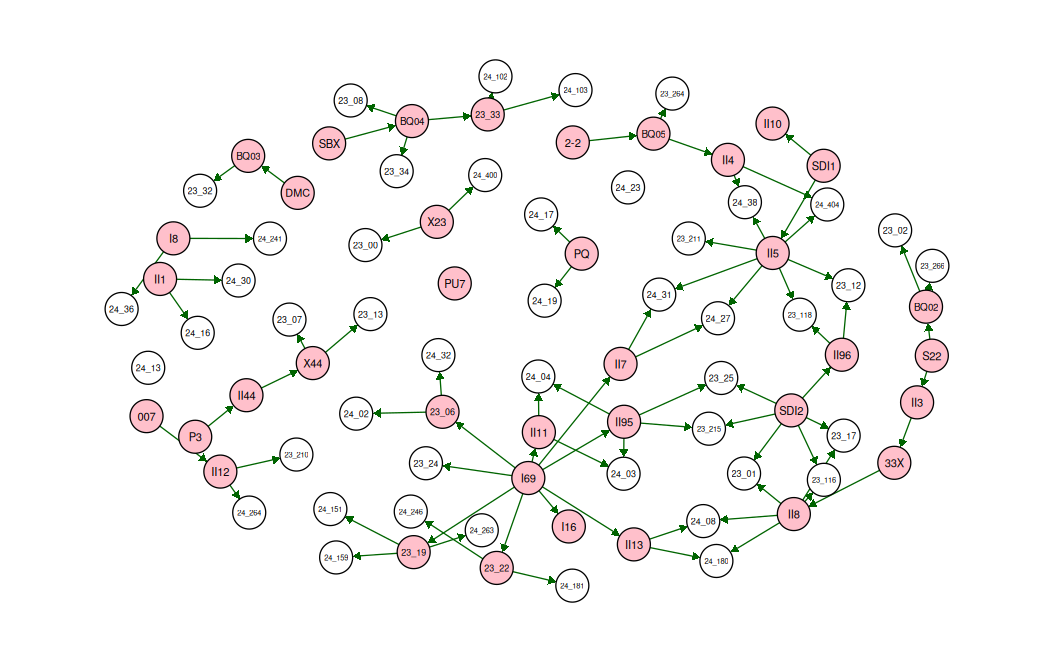
Figure 2
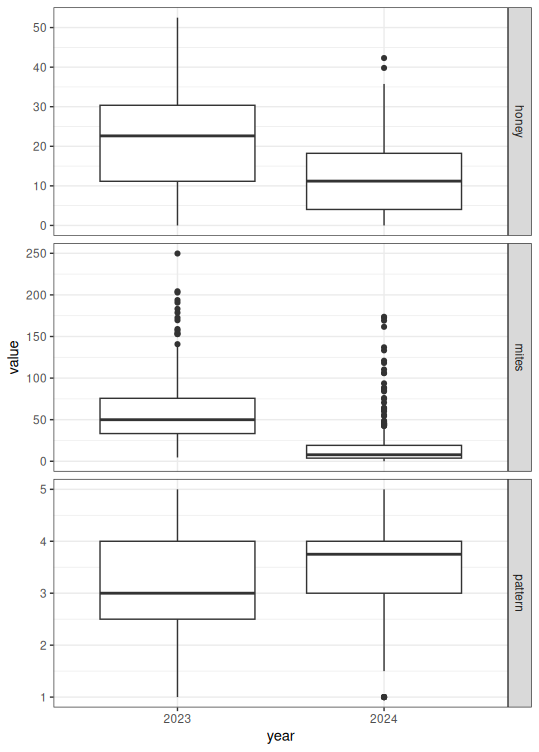
Figure 3
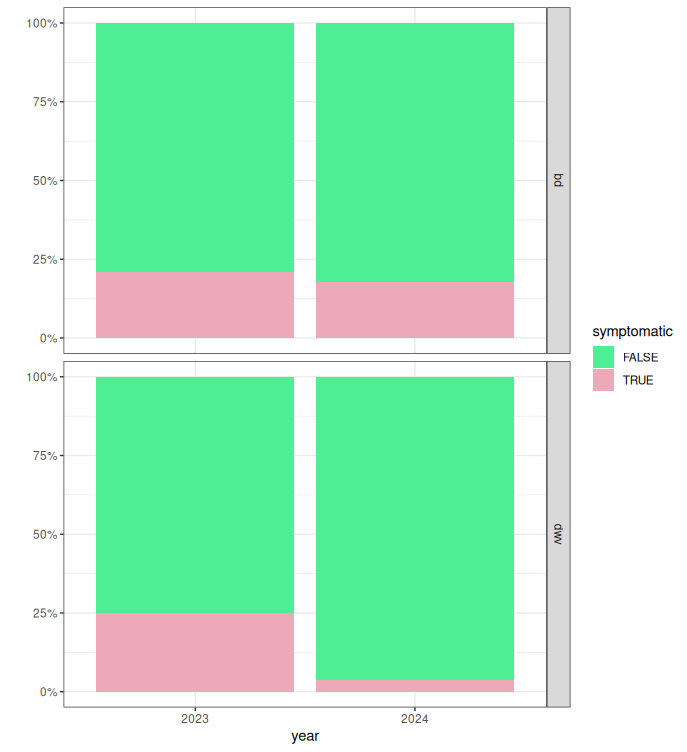
Figure 4
Educational & Outreach Activities
Participation summary:
Purdue Field Day
Purdue hosts the annual summer meeting of The Beekeepers of Indiana as a Field Day where commercial and hobbyist beekeepers are invited to participate in classroom-style and hands-on workshops. More information is available at https://thebeekeepersofindiana.com/purdue-field-day/
During 2023, I hosted a workshop attended by about 50 beekeepers using the outline of this project to teach concepts in bee breeding. In 2025, I an scheduled to host another workshop highlighting the results from this project as mounting evidence of the efficacy of bee breeding in increasing productivity and health of colonies. This workshop will include more specific examples on how beekeepers can emulate the methods of our project. I will collect feedback using Purdue's standard online system that can help inform the development of an extension publication.
Presentations to Clover Blossom Honey Company and Indiana Queen Breeders Alliance
The Beekeepers of CBH and IQBA and research cooperators for this project have met twice annually to discuss the progress of the project and propose changes to the protocol. Through these meetings, we've been able to transfer knowledge and techniques assisting CBH in their bee breeding decisions and assist IQBA in their valuable work. These bee breeders have expressed growing interest in the project as results begin to show progress and have been increasingly willing to incorporate our methods into their operations. Our goal is for CBH and IQBA to be self-sufficient in data collection and analysis informing their breeding efforts by the end of the project.
Presentations and Webinars
I have been invited to present to smaller groups of stakeholders in person and virtually across the NC region including The Land of Lincoln Beekeeping Club (IL, 20 attendees), Montgomery CO. Beekeeping Club (IN, 15 attendees), Northeast Indiana Beekeepers Association (100 attendees), and The Sustainable Beekeepers Guild of Michigan (scheduled).
Extension Publication
We are in the beginning phases of drafting an extension publication outlining methods for genomic selection relevant to the US bee breeding industry. This project will serve as an example of successful implementation and evidence that these methods can lead to rapid population progress.
Project Outcomes
Adoption of Genomic Selection
Beekeepers at Clover Blossom Honey company are enthusiastically engaged in the project, recognizing the impact it can make in their population. They are developing the knowledge and data-management infrastructure to continue this work even after the completion of the project.
Through our annual workshop and extension publications, we aim to spread awareness about Genomic Selection and its potential impact for American beekeepers. These will also communicate the basic methods and techniques in an accessible and appropriate manner for beekeepers to actually implement Genomic Selection in their apiaries. To assist with some of the more technical aspects (e.g., calculation of genomic relationship matrix, solving mixed model equations, variance component estimation), we will be able to host existing software in a publicly-accessible interface (e.g., "shinyapps," https://www.shinyapps.io/) where beekeepers can input their records in a simple format and quickly receive breeding value estimations. Interaction with these apps along with surveys included in publication materials and at the end of workshop presentations will allow us to gauge industry uptake and receive valuable feedback.
Honey Bee Stock improvement
We have already measured improvement in our selected "test" population compared to existing stock maintained by traditional techniques. With more seasons of data, we will be able to more accurately measure improvement and account for variation due to season.
Genomic Selection has caused revolutionary progress in many crop and livestock systems, but its application to beekeeping is still in initial phases. Our preliminary results suggest it can be successfully applied to the US beekeeping industry, opening a new avenue for improvement of the health and productivity of honey bee colonies. Not only will this benefit the beekeeping industry, but agriculture more broadly by ensuring reliable pollination services through increased survival and strength of colonies.
Protocol Refinement
During the first two seasons of the project, we worked with beekeepers at Clover Blossom Honey Company to develop a method of data collection in their apiary. Our goals have been to track a wide diversity of genetic lineages, accurately account for effects due to environmental and apicultural differences between colonies, assess all colonies on the most biologically and economically relevant traits, and select the breeding individuals which will maximize population progress in traits while maintaining genetic diversity. We aimed to achieve this while minimizing complexity and labor on the part of the beekeeper. Throughout the process, we learned a great deal about how GS can meet the needs and fit within the constraints of the US industry. Important techniques identified were:
- standardization of breeding, splitting, treating, and harvesting across colonies
- grafting from more than one breeder queen per grafting event, ensuring offspring queens will be distributed to multiple locations and each location will receive offspring of more than one breeder queen
- tracking identity of breeder queens by marking "bars" of cells in cell-building colonies with tape and the ID of the queen, transferring this tape to "cases" of cells for transport, and writing the identity on the colony in paint-pen. Further records of dates of grafts and breeder queens included also helped to sort our ambiguity
- transcribing all records onto data sheets at two time-points (after mating of queens can be confirmed in spring and during fall phenotyping), minimizing labor involved in record-keeping
When completed, this project will represent the first implementation of Genomic Selection in US beekeeping, incorporating unique aspects of the industry such as use of breeder queens, open-mating, large scale, and instrumental insemination. While we have been learning more about the needs and constraints of the beekeeping industry, our beekeeper collaborators have been learning more about genetics and breeding. Through our series of meetings, we have been able to transfer a basic working knowledge of honey bee genetics and breeding theory so that the beekeepers we work with understand the principles underlying the project and can help explain and promote these ideas more broadly.
Knowledge Produced
The first year of data has already produced estimates for heritability for several important colony traits. These are widely useful in understanding genetic components underlying honey bee health and productivity, and help inform other breeding efforts. For populations that are genetically similar to ours, they may even provide reasonable starting estimates for variance components--allowing bee breeders to sip the technical hurdle of REML estimation in applying GS. Furthermore, we have provided estimates of genetic covariance between traits, which has seldom been reported in the literature. This allows bee breeders to develop more robust and nuanced breeding indicies. For example, if two traits have "beneficial" positive genetic covariance, breeders can select using which ever trait is easier to measure and still achieve progress in the unmeasured trait. On the other hand, if two traits have a "detrimental" correlation, as we have measured in honey production and Varroa infestation, breeders must be careful in selection not to accidentally decrease a trait (Varroa resistance) while breeding for the correlated trait (honey production).
Tools and Techniques
Through our process of data collection and analysis, we have developed several techniques and tools in-house to fill gaps in implementing GS in the US bee breeding industry. Firstly, we developed a script for calculating a full genomic relationship matrix including queens and worker groups incorporating haplodiploid inheritance, polyandry, uncertain mating, instrumental insemination, and open mating at multiple locations. This script takes as an input a relatively simple tabular pedigree in a format accessible to most bee breeders. Secondly, we developed a script to use sequence data from worker offspring to assemble worker genotypes and infer the mother queen's genotype using a maximum likelihood method. This script outputs full genotype files and a genomic relationship matrix for queens and worker groups. These can be used to augment pedigree data in GS using the single-step method or incorporated into further analyses including genome-wide association studies.