Final report for GNC23-377
Project Information
This project, “How farmer cognition of complexity in agroecosystems affects decision-making about cover cropping”, aimed to understand how farmers are grappling with uncertainties and complexities of agroecosystems and how they decide to adopt, continue, or forgo cover crops on their fields. Specifically, this project mapped farmer cognition of complexity (the patterns of relationships among causal factors that reveal an individuals’ understanding of a system), examined how the levels of cognition of complexity are related to cover crop decisions, and determined if or how farmers may be using cognitive biases during their decision-making process.
The educational approach began with sharing pilot survey drafts with extension agents and farmers for feedback, ensuring the survey questions were relevant and grounded in farmer experience. Insights from these exchanges, along with preliminary interview data, informed the design of a large-N survey that was distributed to row-crop farmers in the Midwest (North Central Region States) which was ultimately completed by 179 row-crop farmers. Surveys collected information on cover crop use, farmer perceptions of their agroecosystems, cognitive biases, and farmer demographic information.
The research approach applied dual-process theory as a framework to understand how farmers made decisions regarding cover crops. Survey responses were analyzed through three regression models predicting cover crop adoption, status quo (SQ) bias, and recency (RC) bias, followed by a path model to explore relationships among these variables. Survey responses offered insight into the cognitive biases influencing farmer decisions and provided information for developing cognitive maps. By mapping farmer decision-making, this project identified which factors farmers view as crucial to their agroecosystems and how they perceive agroecosystem dynamics of said factors. This was foundational for understanding the role of systems thinking in farmer cover crop decisions.
Research conclusions show that systems thinking (cognition of complexity) was not significantly associated with cover crop adoption or cognitive biases, contrary to expectations. However, both SQ and RC biases (System 1) negatively affected cover crop adoption, suggesting that farmers less prone to such biases are more likely to adopt cover crops. These findings highlight how cognitive shortcuts may contribute to low rates of cover crop adoption in the U.S. and underscore the importance of addressing decision-making processes (not just agronomic or financial constraints) when designing conservation outreach.
This work deepened researchers' understanding of farmer perspectives and cognitive processes, while also offering farmers an opportunity to reflect on their own biases and decision-making around cover crops. Insights into how farmers view agroecosystems can inform more effective engagement strategies and help clarify relationships in the system that may otherwise be overlooked or overemphasized. These findings can strengthen future outreach and education efforts, ultimately supporting farmers in linking their management practices to environmental outcomes and enabling stakeholders to work together toward more sustainable land management.
This project was an opportunity to engage a large group of row-crop farmers, learn farmer thought processes, and map their cognition of the complex interactions that structure the agroecosystems in which they work. Learning outcomes included a deeper understanding of farmer perspectives that can inform future collaborations among researchers, extension professionals, and farmers. Researchers also gained insight into farmer characteristics that are related to increased levels of complexity and cover crop adoption. Though cognition of complexity was not a significant predictor of cover crop adoption, learning farmer perspectives can help prospective outreach professionals approach farmers to increase cover cropping behavior with farmer priorities in mind. Cognitive mapping and evaluation of cognitive biases could also be valuable information to farmers who may become more aware of biases they hold. Farmers may also benefit by comparing their thinking patterns to other farmers. The knowledge gained from this research contributes to literature by expanding our knowledge of decision-making; it advances our grasp on farmer-perceived agroecological complexity and farmer reliance on biases (i.e., recency bias, status quo bias).
Actionable outcomes included highlighting the role of cognitive shortcuts in decision-making and showing how these may reduce cover crop adoption. Learning what biases are employed in decision-making offers researchers the opportunity to intervene with strategic framing of recommendations or simply by making farmers aware of the limitations of using biases. This project also leverages novel methods of cognitive map analysis (i.e., network analysis) to shed light on decision-making, which constitutes a methodological contribution to the broader research community.
Research
Methods
Survey Design
Prior to data collection, survey materials were approved by The Ohio State University Institutional Review Board. A pilot survey was designed and sent to producers in Darke County, Ohio through the Darke County Extension Office to test the clarity and flow of the survey and identify any technical issues with the survey interface. Farmer feedback was reported back through an extension agent and recommendations were incorporated in the final survey if they were deemed feasible.
The finalized survey was administered to row-crop farmers across the Midwest that farmed under 5100 acres. The initial question provided an overview of the research, explained the risks and benefits of participation, outlined participant rights, and asked respondents for consent for participating in the survey. If respondents consented, they proceeded to the first section, which focused on their cover cropping experience, including their past, present and intended future use of cover crops. The next section presented scenario-based questions designed to identify whether farmers relied on status quo bias or recency bias in their decision-making. In the following section, farmers who took the survey online reviewed a list of 12 agroecological factors and selected those they considered important with the option of writing in two additional factors they deemed important. For each selected factor, they were then asked to indicate whether it impacted any of the other important factors. Farmers who took the print survey were presented all 12 agroecological factors in a circle and asked to draw arrows illustrating the factors they felt impacted each other. The final section included demographic questions and questions capturing farm characteristics. To conclude, respondents were invited to share their email address if they wished to receive research briefs summarizing the study's findings.
Survey Distribution and Response
Between February and April of 2024, the Qualtrics survey was distributed in one of three ways: via an email containing a survey link, through a mailed postcard that included both a survey link and a QR code, and as a printed survey packet mailed directly to farmers with prepaid return postage and an envelope.
Contact information for farmers was purchased from DTN Farm Market ID. Initially, to be eligible for contact, farmers needed to own and operate farms ranging from 50 to 1,500 acres and reside in the North Central region. A total of 35,000 contacts were purchased. Of this total, 22,109 contacts were used for emails sent through Qualtrics, 12,004 were used for postcards, and 898 were used for mailed surveys. However, because the database used for contact information was outdated, some respondents reported operating farms as large as 5,100 acres, 993 emails bounced, and 10 contacts emailed saying they were ineligible for participation (e.g., farmer was deceased, contact was not a farmer, etc.). For print surveys, five mailed surveys were returned to sender, and 13 contacts who were mailed surveys sent back the packet with a note indicating reasons for ineligibility or incompletion.
Of the electronic surveys, a total of 21,116 farmers were emailed a link to the survey, and 12,004 farmers were mailed a postcard with a link and QR code to the survey. Of these 33,120 electronically contacted farmers only 129 responses were received, and 115 of these responses were usable responses. Of the 890 printed surveys that were mailed to farmers, 64 mailed them back, 13 of which were incomplete or ineligible, leading to 51 usable responses. Electronic surveys had a response rate of 0.3%, printed surveys had a response rate of 5.7%. Evidently, printed surveys were a much more effective strategy for survey responses from row-crop farmers across the Midwest. Ultimately, there were 166 usable survey responses for analysis.
Data Preparation
Cover crop adoption questions:
Farmers were asked to indicate if they had used cover crops in the past, were currently using cover crops, or intended to use them in the future. From their responses, a composite score (ranging 0-3) was calculated, zero being a farmer who never cover cropped and never planned to and three being a farmer who had cover cropped, was currently cover cropping and planned to continue. We will refer to this dependent variable as the cover crop adoption.
Cognitive bias questions
There were two sets of two cognitive bias questions, all four presenting a scenario where farmers were asked to make a decision regarding cover crop adoption or continuation. One set aimed to identify the presence or absence of status quo bias and the other set for recency bias. Responses to these questions were on a 4-point Likert scale ranging from very likely to very unlikely. To calculate the cognitive bias score, a value from 0 to 3 was assigned to each question based on their Likert scale response (e.g., very likely = 3, likely = 2, unlikely = 1, very unlikely = 0). The values from the two questions addressing status quo bias were summed, resulting in a composite bias score ranging from 0 to 6 which was standardized to a value from 0 to 1 by dividing by the maximum possible score. This process was repeated for the recency bias score. To ensure the scores calculated for the bias variables were appropriate based on the survey questions asked, a Cronbach’s alpha was calculated for each bias score. Because of the low Cronbach's alpha value (0.41), one survey question indicating recency bias was dropped for the final analyses, so scores for recency bias ranged from 0 to 3 and were then standardized to a value from 0 to 1 as well. The final, standardized scores will be referred to as status quo bias and recency bias
Cognitive map questions:
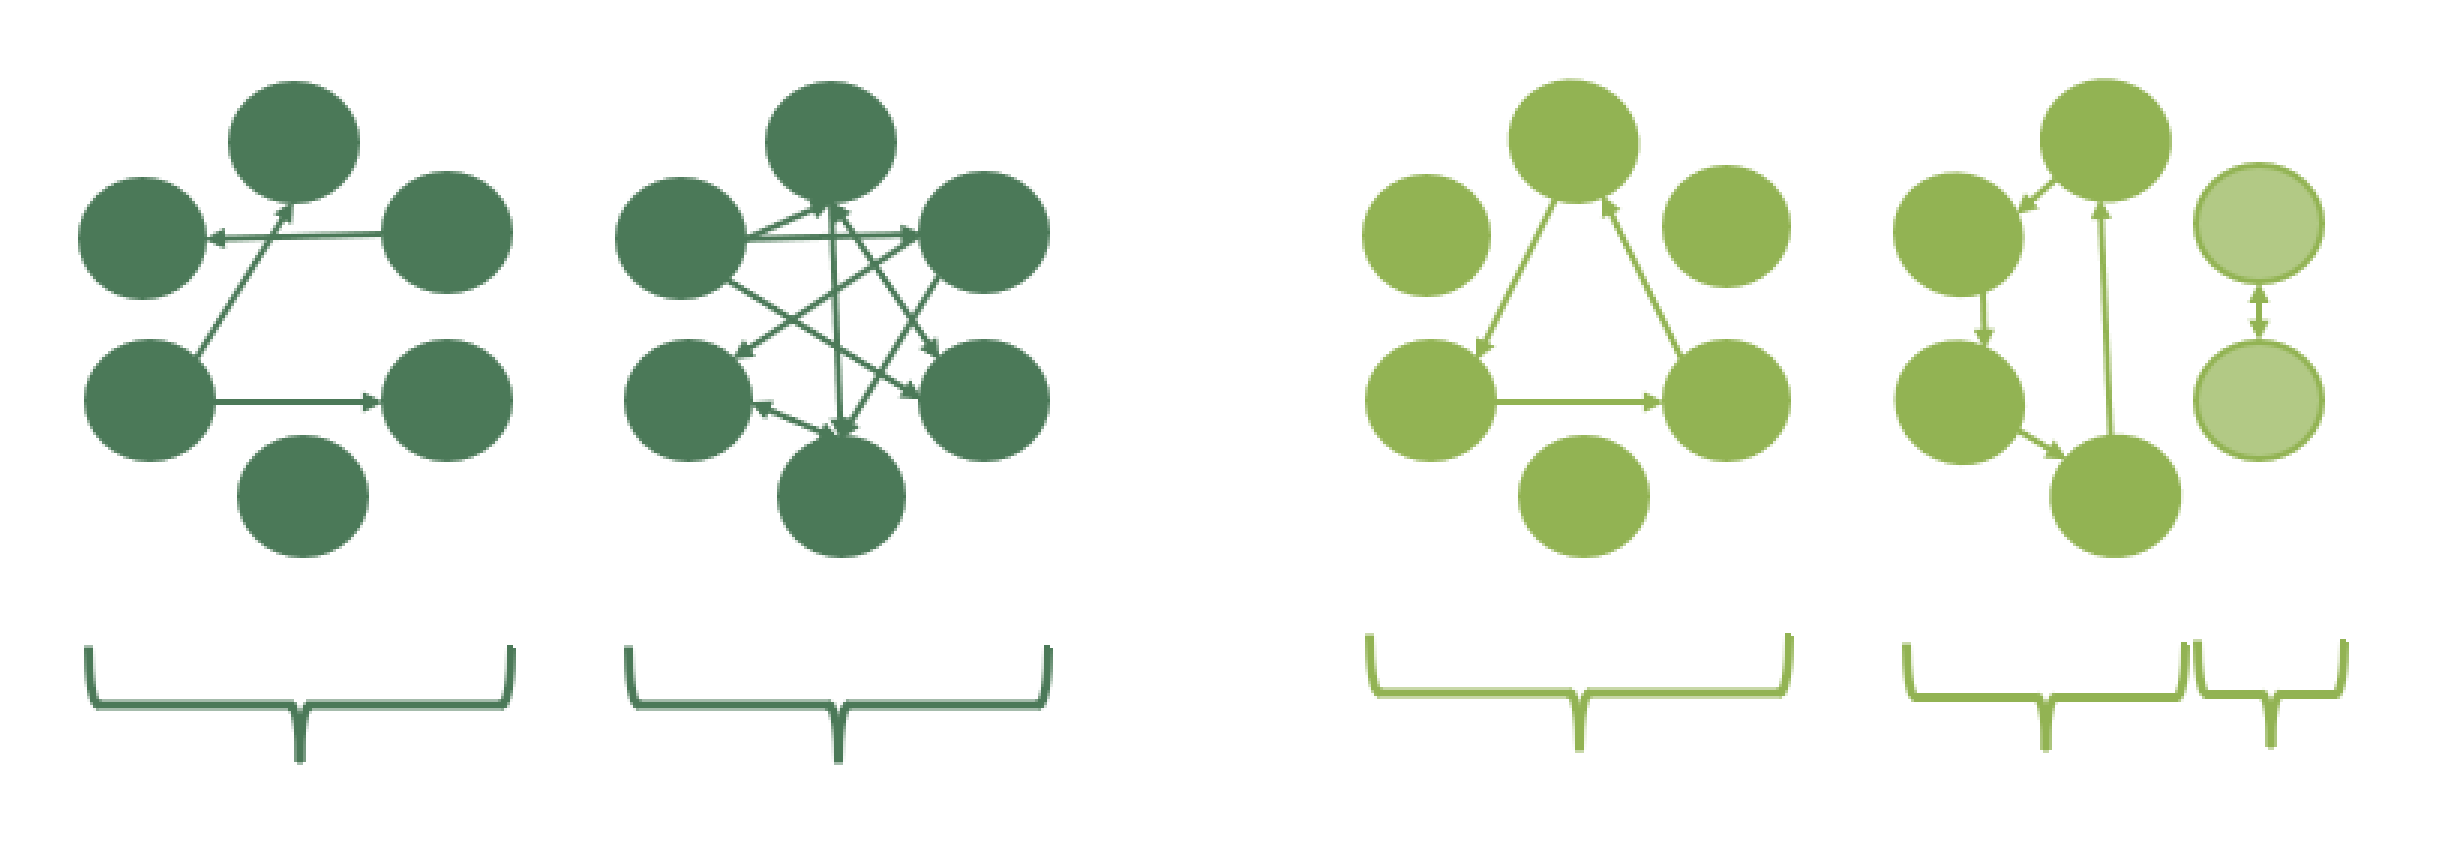
Questions from the fourth section of the survey (agroecological factor selection and impact) were used to develop a cognitive map (network) for each participant's response. Farmers cognitive maps included up to 12 agroecological factors: cover crops, soil tilth, soil organic matter level, soil organism quantity, soil nitrogen level, crop yields, conservation payments (for example: EQIP, CRP, Carbon Credits, etc.), biocide application, equipment use, time spent working on-farm, farm revenue, fertilizer/amendment application. Responses indicating that one factor impacted another factor were represented as directional arrows (edges in the network) on the cognitive map. These responses were used to create an edge list, which was then converted into an adjacency matrix. This matrix served as the basis for constructing cognitive map networks, which were in turn used to calculate two complexity indicators for each respondent (Figure 1). The first indicator, map density (connectivity) represents the number of perceived connections in a cognitive map. A higher density would suggest that more of the agroecological complexity is perceived by the respondent, indicating a higher-level systems thinking. The second complexity indicator, feedback loops, are motifs where three factors in a cognitive map all influence and are influenced by each other, also known as a cyclic triple (Levy et al., 2018). For the purposes of this study, bidirectionality and feedback loops involving more than three factors were also categorized as feedback loops. Prior studies (Levy et al., 2018; Hamilton et al., 2022) found feedback loops to be rare yet meaningful markers of cognition of complexity as they are evidence of non-linear thinking.
|
Figure 1
a b c d e |
|
Figure 1. Visualization of complexity indicators. Density is illustrated as low (a) and high (b). Feedback loops are depicted as a cyclic triple (c), as a cyclic quad (d), and as a bidirectional pair (e). |
|
Data Analysis
Once all analysis variables were drawn or calculated from raw data, data analysis and visualization was conducted using R Program version 4.3.3 (R Core Team 2024). Our analysis began with three models each predicting one of three response variables: cover crop adoption score, status quo bias, and recency bias. We used an ordinal regression model to evaluate cover crop adoption, which was measured in levels. Models for status quo bias and recency bias were run as linear regression models.
Results of the regression models were used to inform the variables included (i.e., significantly correlated variables) in a path model. Path models offer a robust analytical approach that extends beyond simple correlational analysis to uncover both direct and indirect causal pathways among variables. This method not only provides more nuanced information, but also enables visualization of relationships, helping to illustrate the extent to which independent variables explain the variation in dependent variables in the model.
Farmer cognitive maps
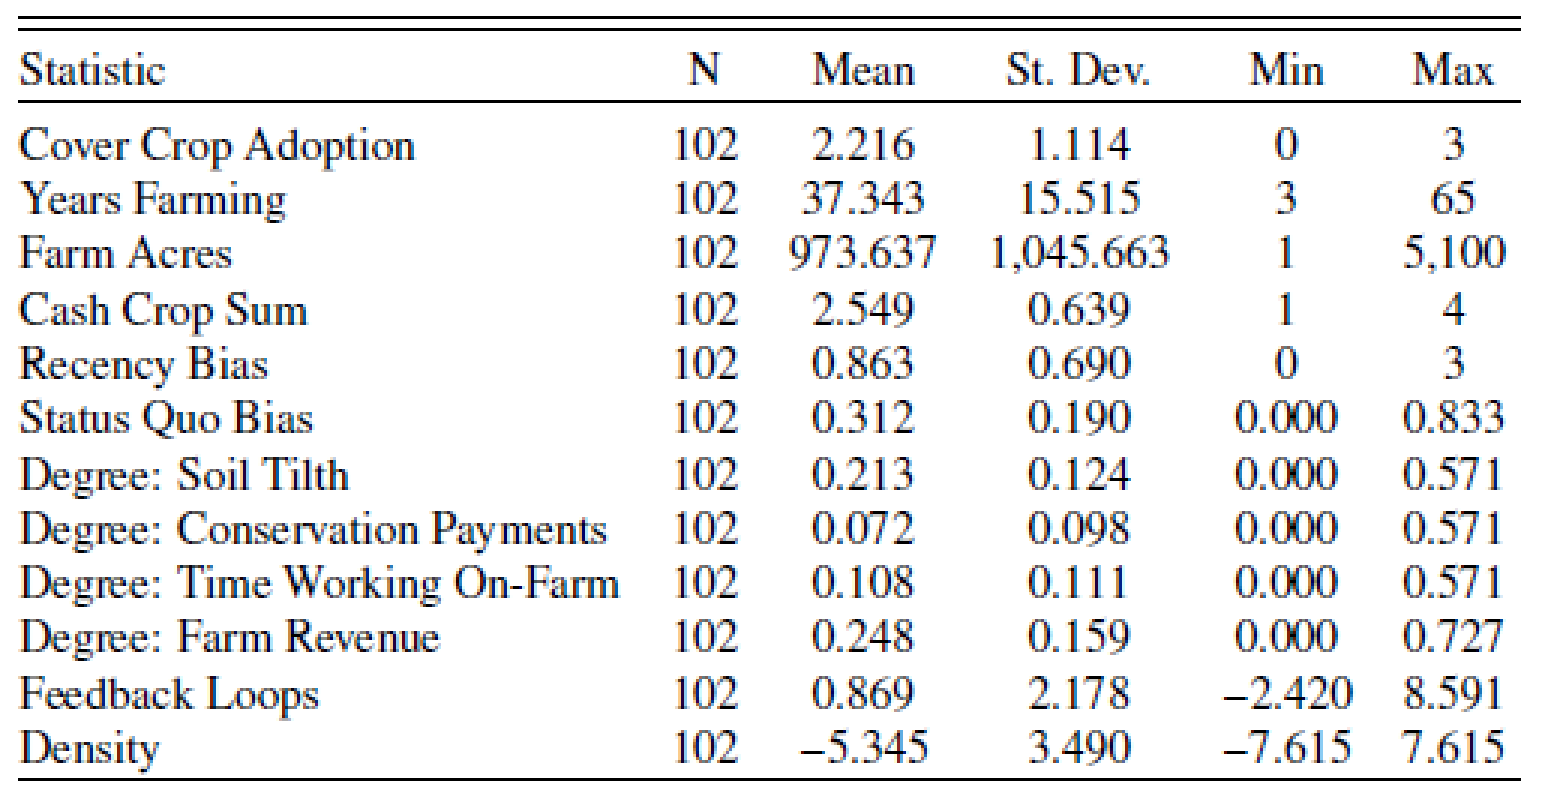
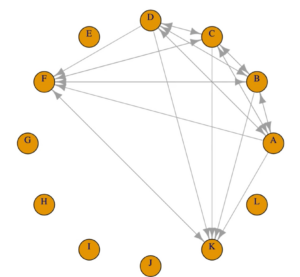
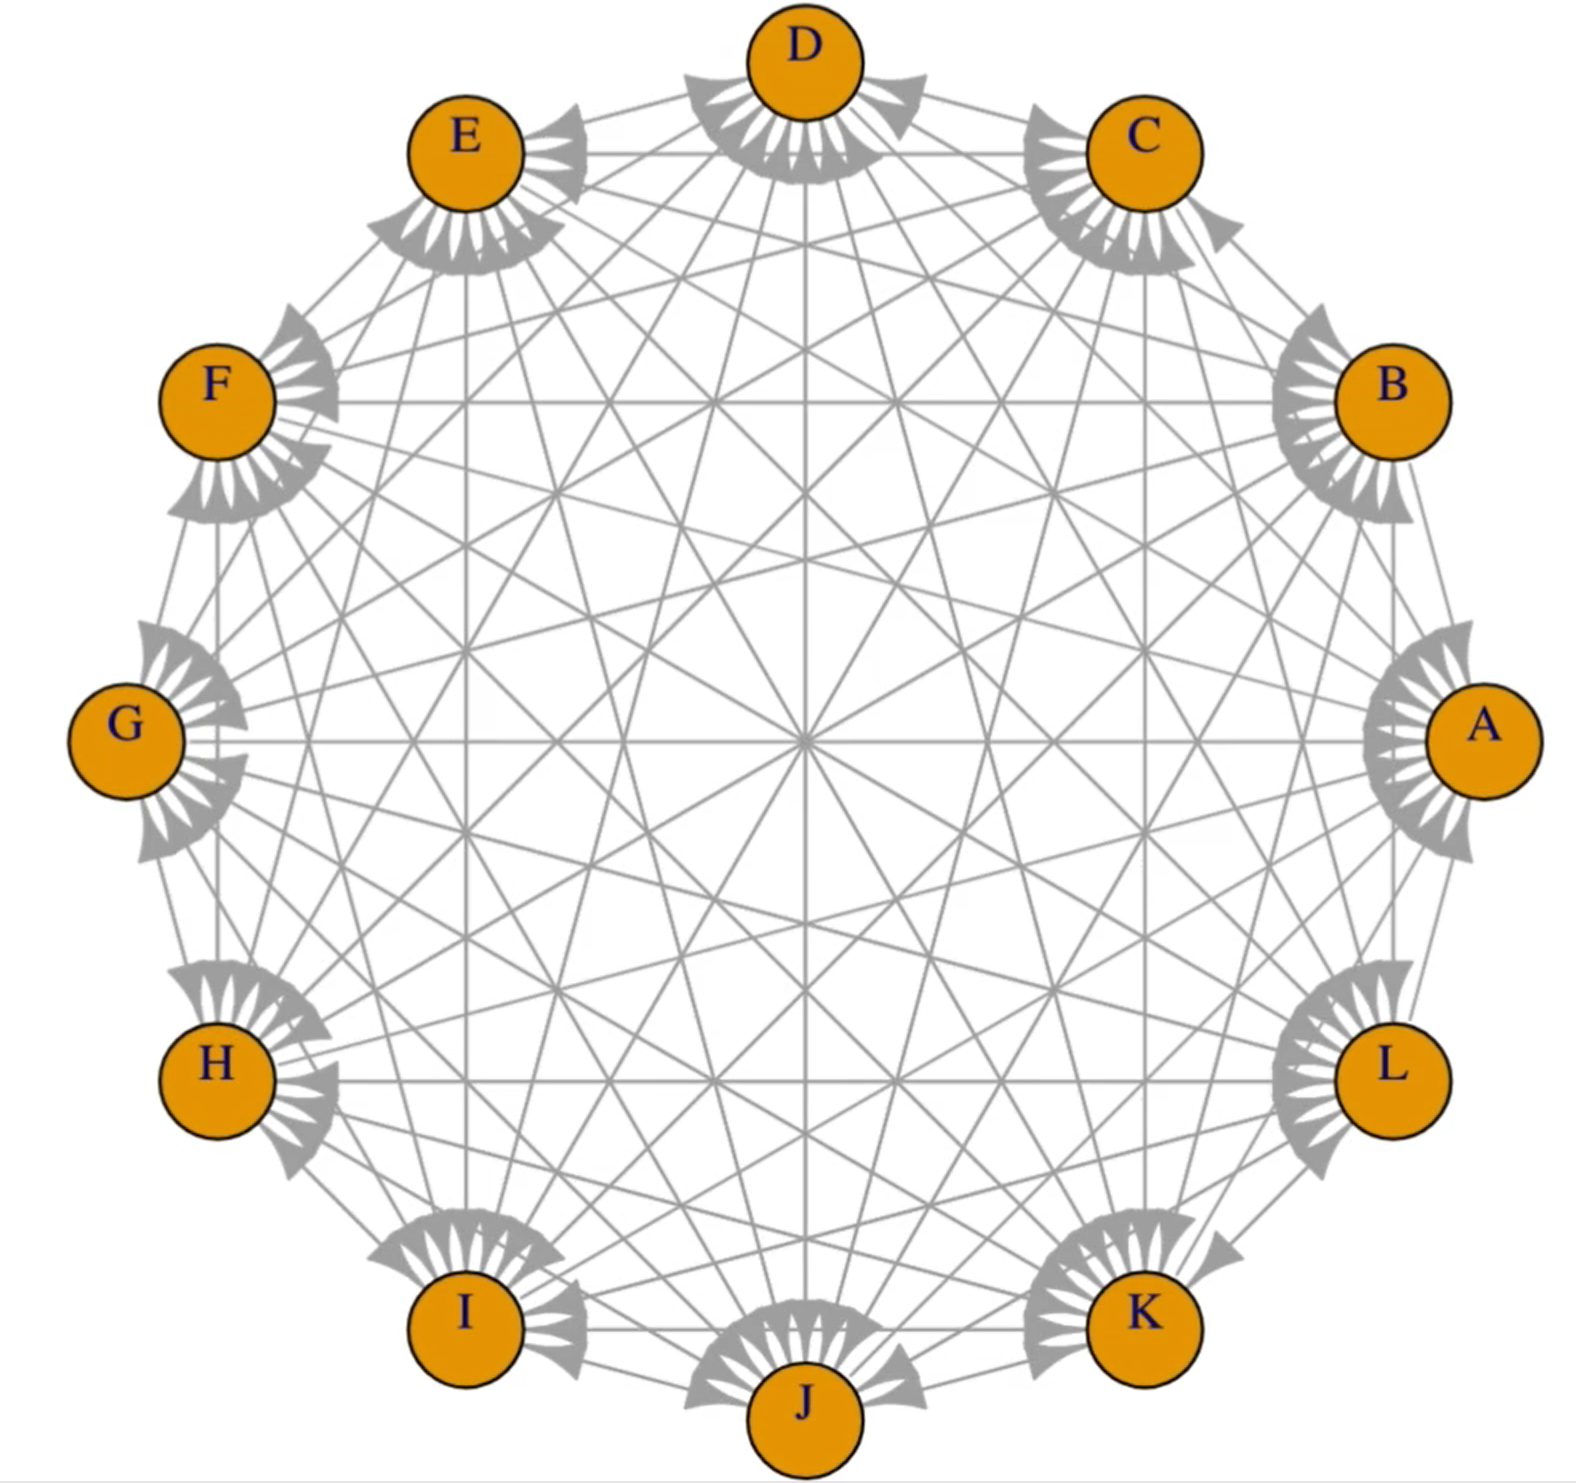
Each farmer's response was used to represent their mental model of the agroecosystem as a cognitive map like the examples shown in Figure 2. There were several surveys where farmers wrote or indicated that all factors were important and impacted one another, so their maps were fully connected (Figure 2b).
|
a |
b |
|
Figure 2. Examples of farmer cognitive maps. Map (a) displays a less dense cognitive map, Map (b) displays the densest (fully connected) cognitive map. |
|
RESULTS
On average, nodes with the highest indegree and outdegree centrality (most popular) in farmer networks included “Soil Organic Matter”, “Crop Yields”, “Cover Crops”, “Farm Revenue”, and “Soil Tilth”. Nodes with the least degree centrality included “Biocide Application”, “Conservation Payments”, “Fertilizer/Amendment Application”, and "Time Working On-Farm” (Figure 3). Assessment of indegree and outdegree centrality for cognitive maps offers insight on which factors were most popular across farmer cognitive maps. By extension, this is an indication of what factors farmers deemed most important in their agroecosystem.
a 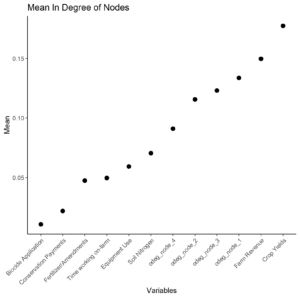 b
b 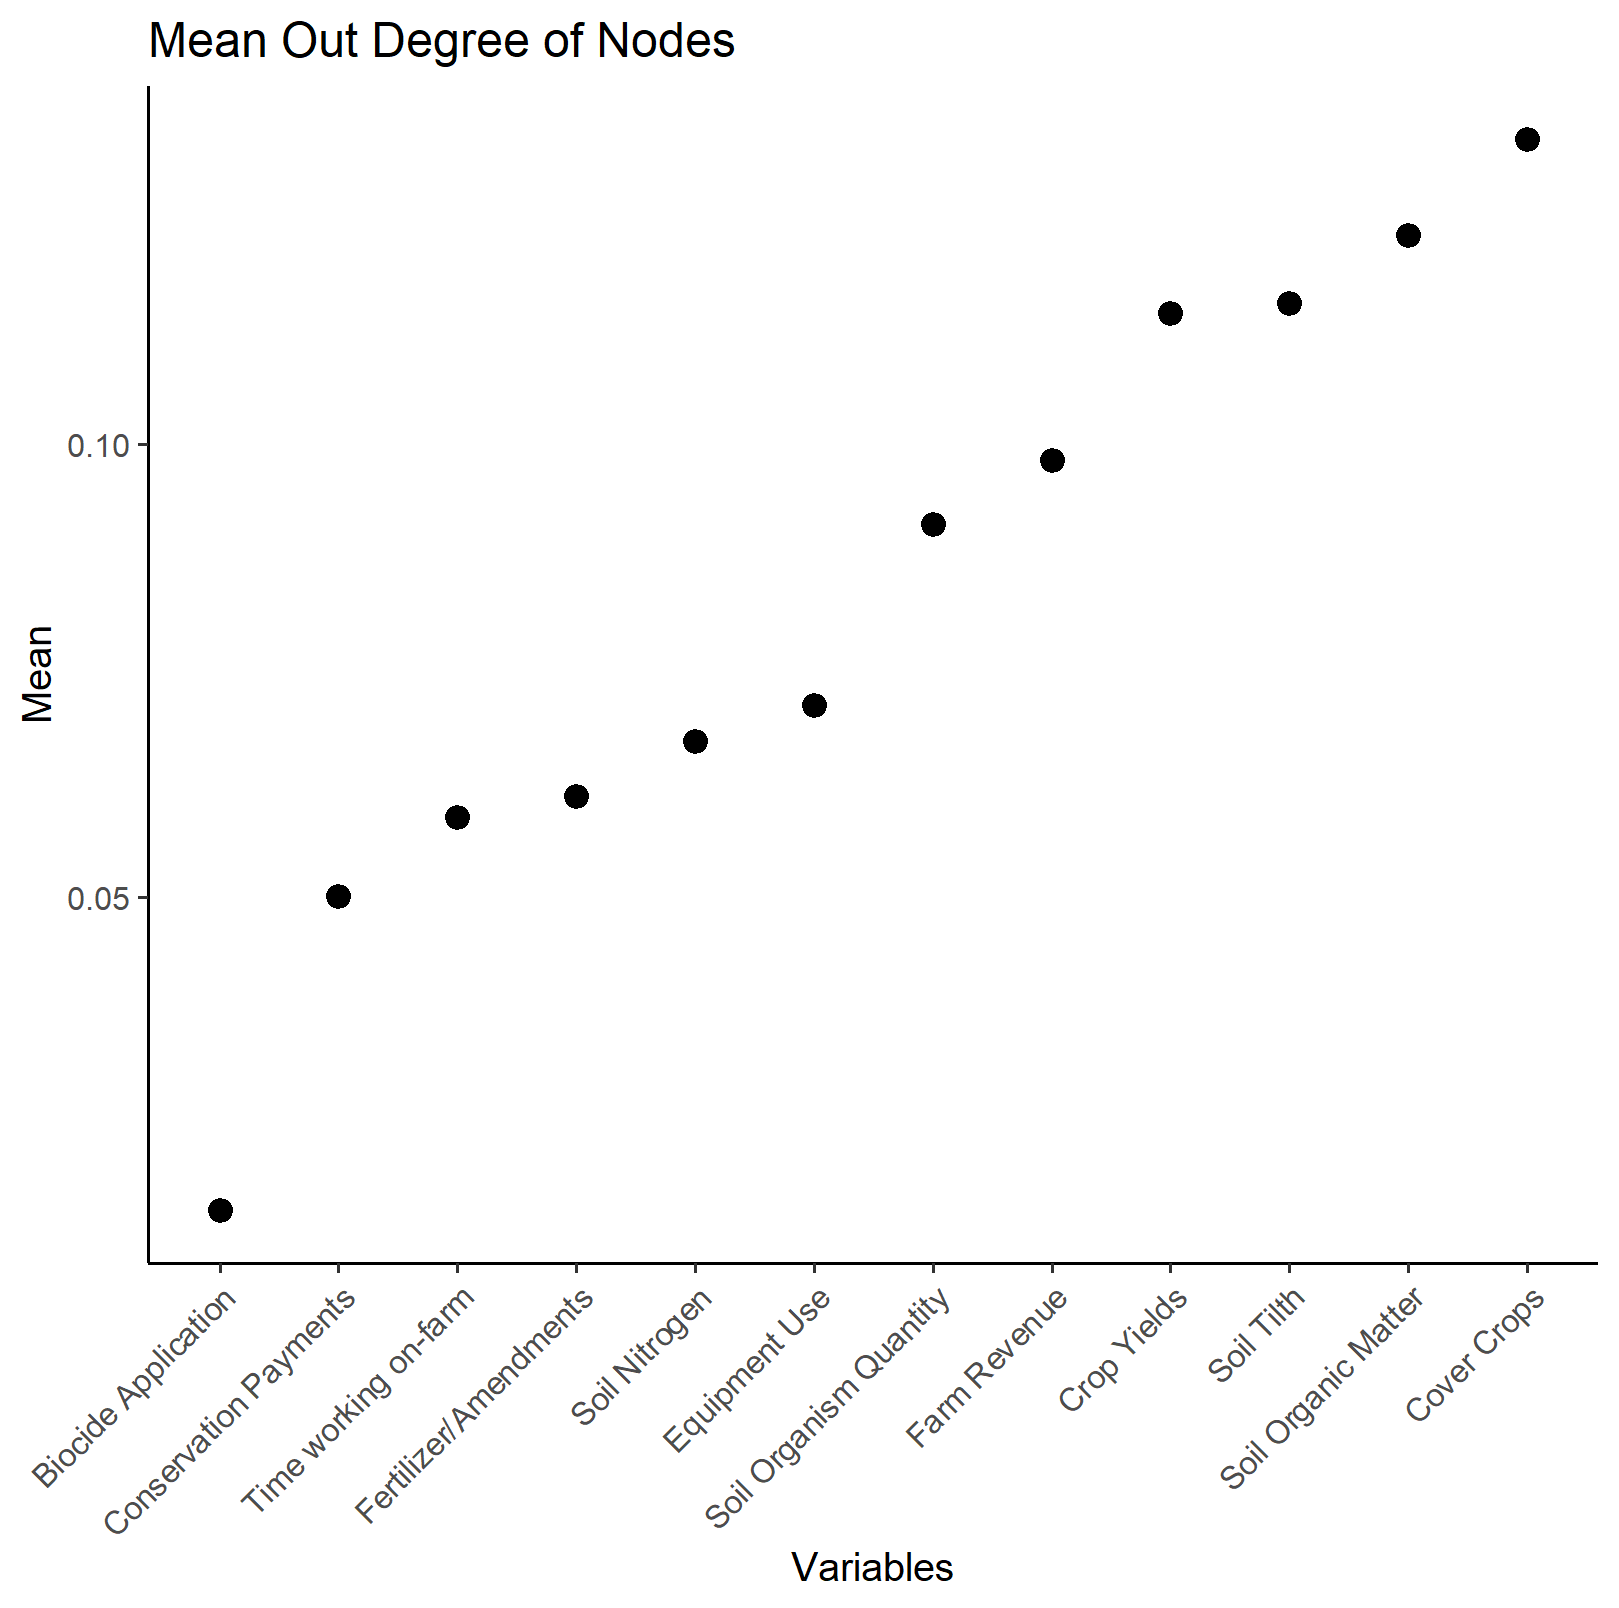
Figure 3. Mean indegree (a) and outdegree (b) of nodes in farmer cognitive maps
Linear Regression
Three separate regression models were run to predict cover crop adoption, status quo bias, and recency bias (Figure 4). An ordered logistic regression was used to predict cover crop adoption (ordinal dependent variable), and a linear regression was used to predict status quo bias and recency bias. The independent variables included in these models fall into four distinct categories: farm and farmer characteristics (which we refer to as "controls," and include to account for the influence of farm and farmer characteristics), cognitive biases, network factors (nodes), and complexity indicators. Contrary to our hypotheses, results of the ordered logistic regression model indicate that complexity indicators (e.g., feedback loops and density) are not significant predictors of cover crop adoption. Notably, the strongest predictors of cover crop adoption were cash crop sum and status quo bias (p<0.01). Cover crop adoption increased among farmers with greater diversity in crop rotations (greater cash crop sum) and cover crop adoption decreased among farmers with higher indicators of status quo bias. Based on the number of ties (degree centrality) of the network factors, we found the only factors whose prominence was significantly correlated to cover crop adoption were “Soil Tilth” and “Time Working On-Farm” (p<0.05). Both factors were positively associated with cover crop adoption. Results of the linear regression models indicate that recency bias and status quo bias were significant, positive predictors of each other (p<0.001). Aside from recency bias, prominence of the network factor “Conservation Payments” was significant, but negatively correlated to status quo bias (p<0.05) and cash crop diversity index was also a significant and negatively correlated to of status quo bias at the p<0.1 level. So, as the prominence of “Conservation Payments” increased, status quo bias decreased and as the results of these models suggest that cover crop adoption is directly linked to status quo bias with possible indirect effects of recency bias.
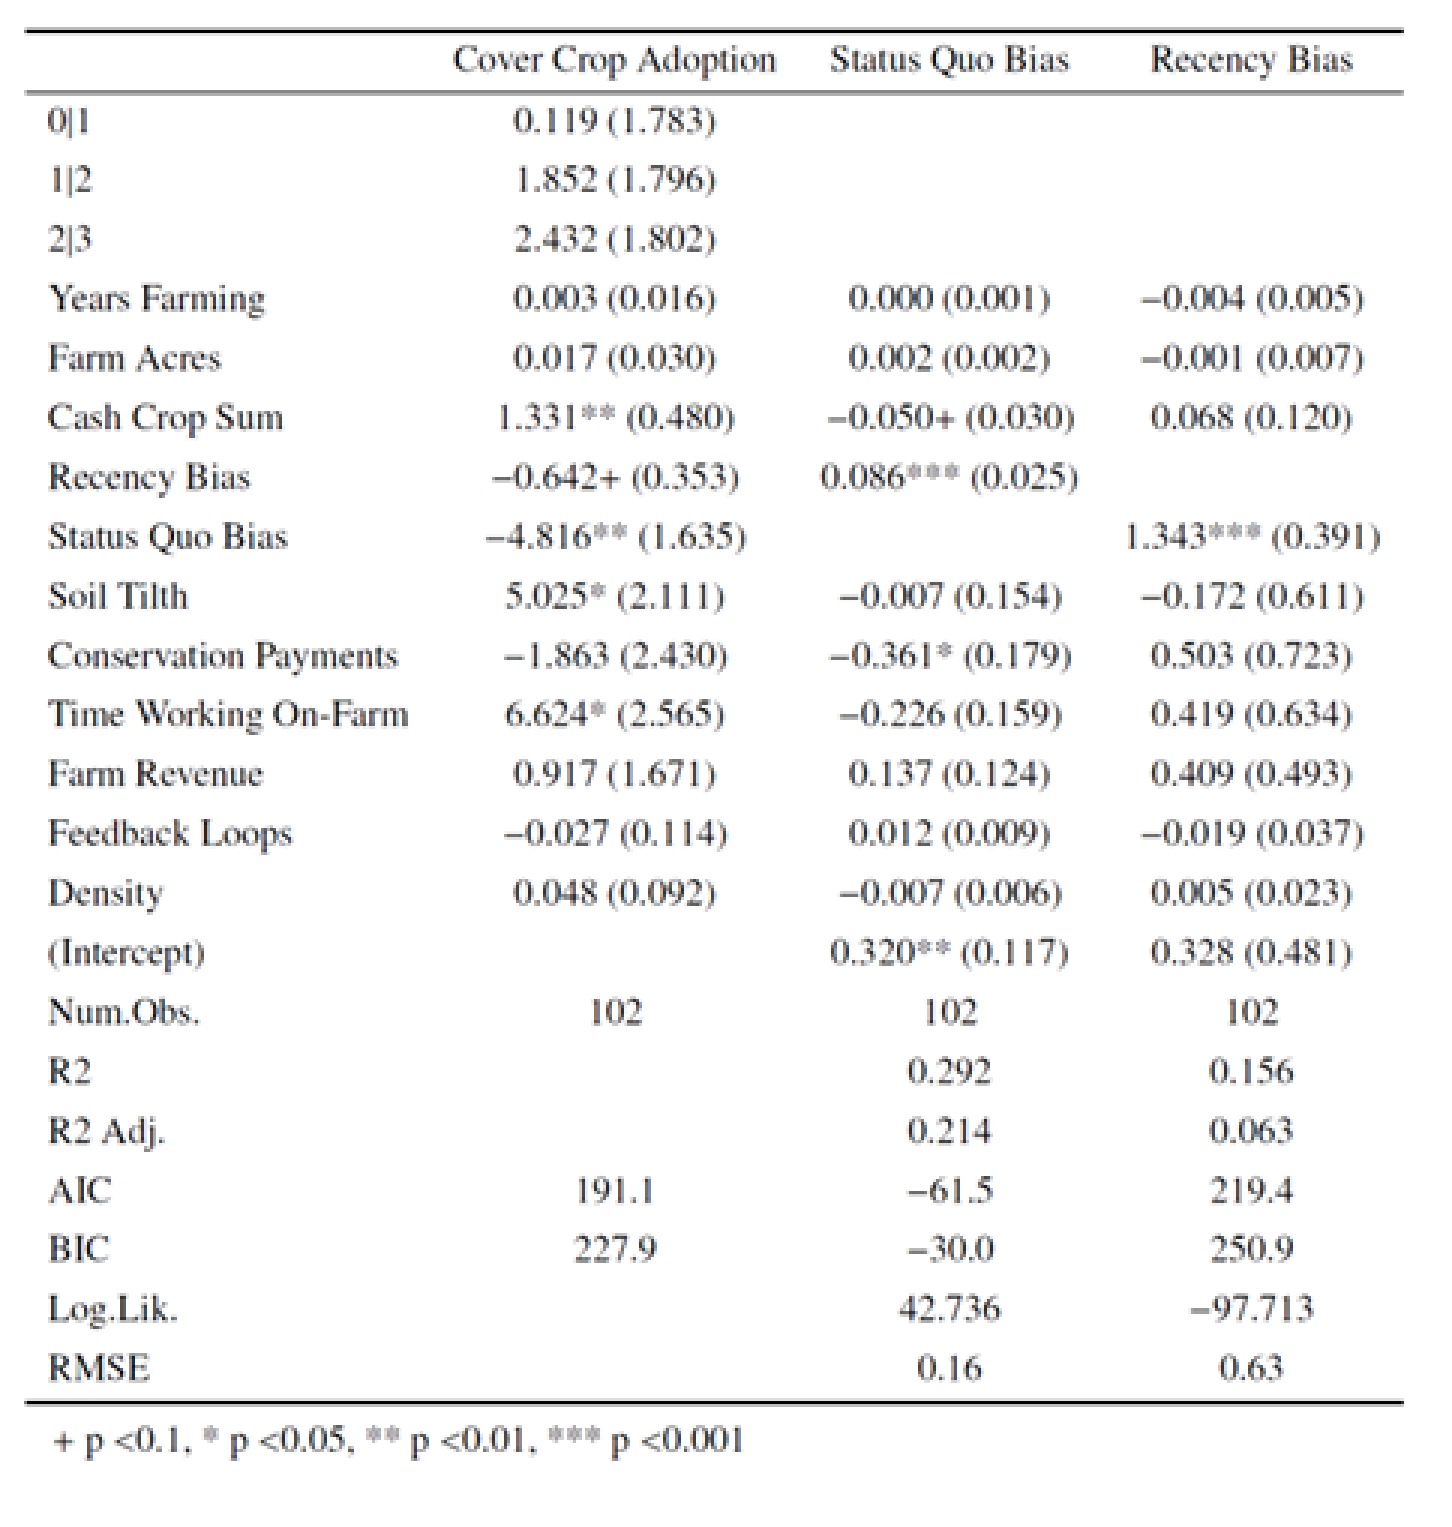
Figure 4. Model summary of three regression models predicting cover crop adoption, status quo bias, and recency bias. Note: Farm Acres was a scaled variable, calculated in units of hundreds of acres.
Path Model
To further explore the effect of recency bias on cover crop adoption, a structural equation model was used to map the relationships of all significant variables from the regression models. From the path model (Figure 5) we can determine the effects of several observed, exogenous variables on multiple endogenous variables (SQ bias and cover crop adoption). Additionally, the benefit of path analysis after the regression is that it allows for modeling and statistically testing causal pathways between variables while simultaneously sharing the variances of endogenous variables.
With standardized estimates, we see that RC bias had a significant, positive relationship to SQ bias (0.319), meaning that farmers with high RC bias were likely to have high SQ bias as well. Prominence of conservation payments has a significant, negative impact on SQ bias (-0.244), meaning farmers who had a highly prominent “conservation payments” node on their cognitive maps were less likely to have high status quo bias. From this model we also know that RC bias had a stronger effect on SQ bias than the prominence of conservation payments. However, according to standards established by Chin (1998), SQ bias has a weak r-square value (0.163), so we can conclude that a large portion of SQ bias was not explained by the exogenous variables included in this model.
The path model is also a plausible explanation of the drivers of cover crop adoption. Status quo bias has the strongest significant effect on cover crop adoption (-0.328), followed by cash crop diversity (0.237), prominence of soil tilth (0.212), and then prominence of time working on-farm (0.191). The path model also informs us that there is a significant indirect effect of RC bias on cover crop adoption through SQ bias (-0.104) as a mediating variable, but a non-significant (p = 0.057) direct effect of RC bias on cover crop adoption (-0.170). R-square value of cover crop adoption (0.302) tells us that the exogenous variables in this model weakly-moderately explains the variance in cover crop adoption.
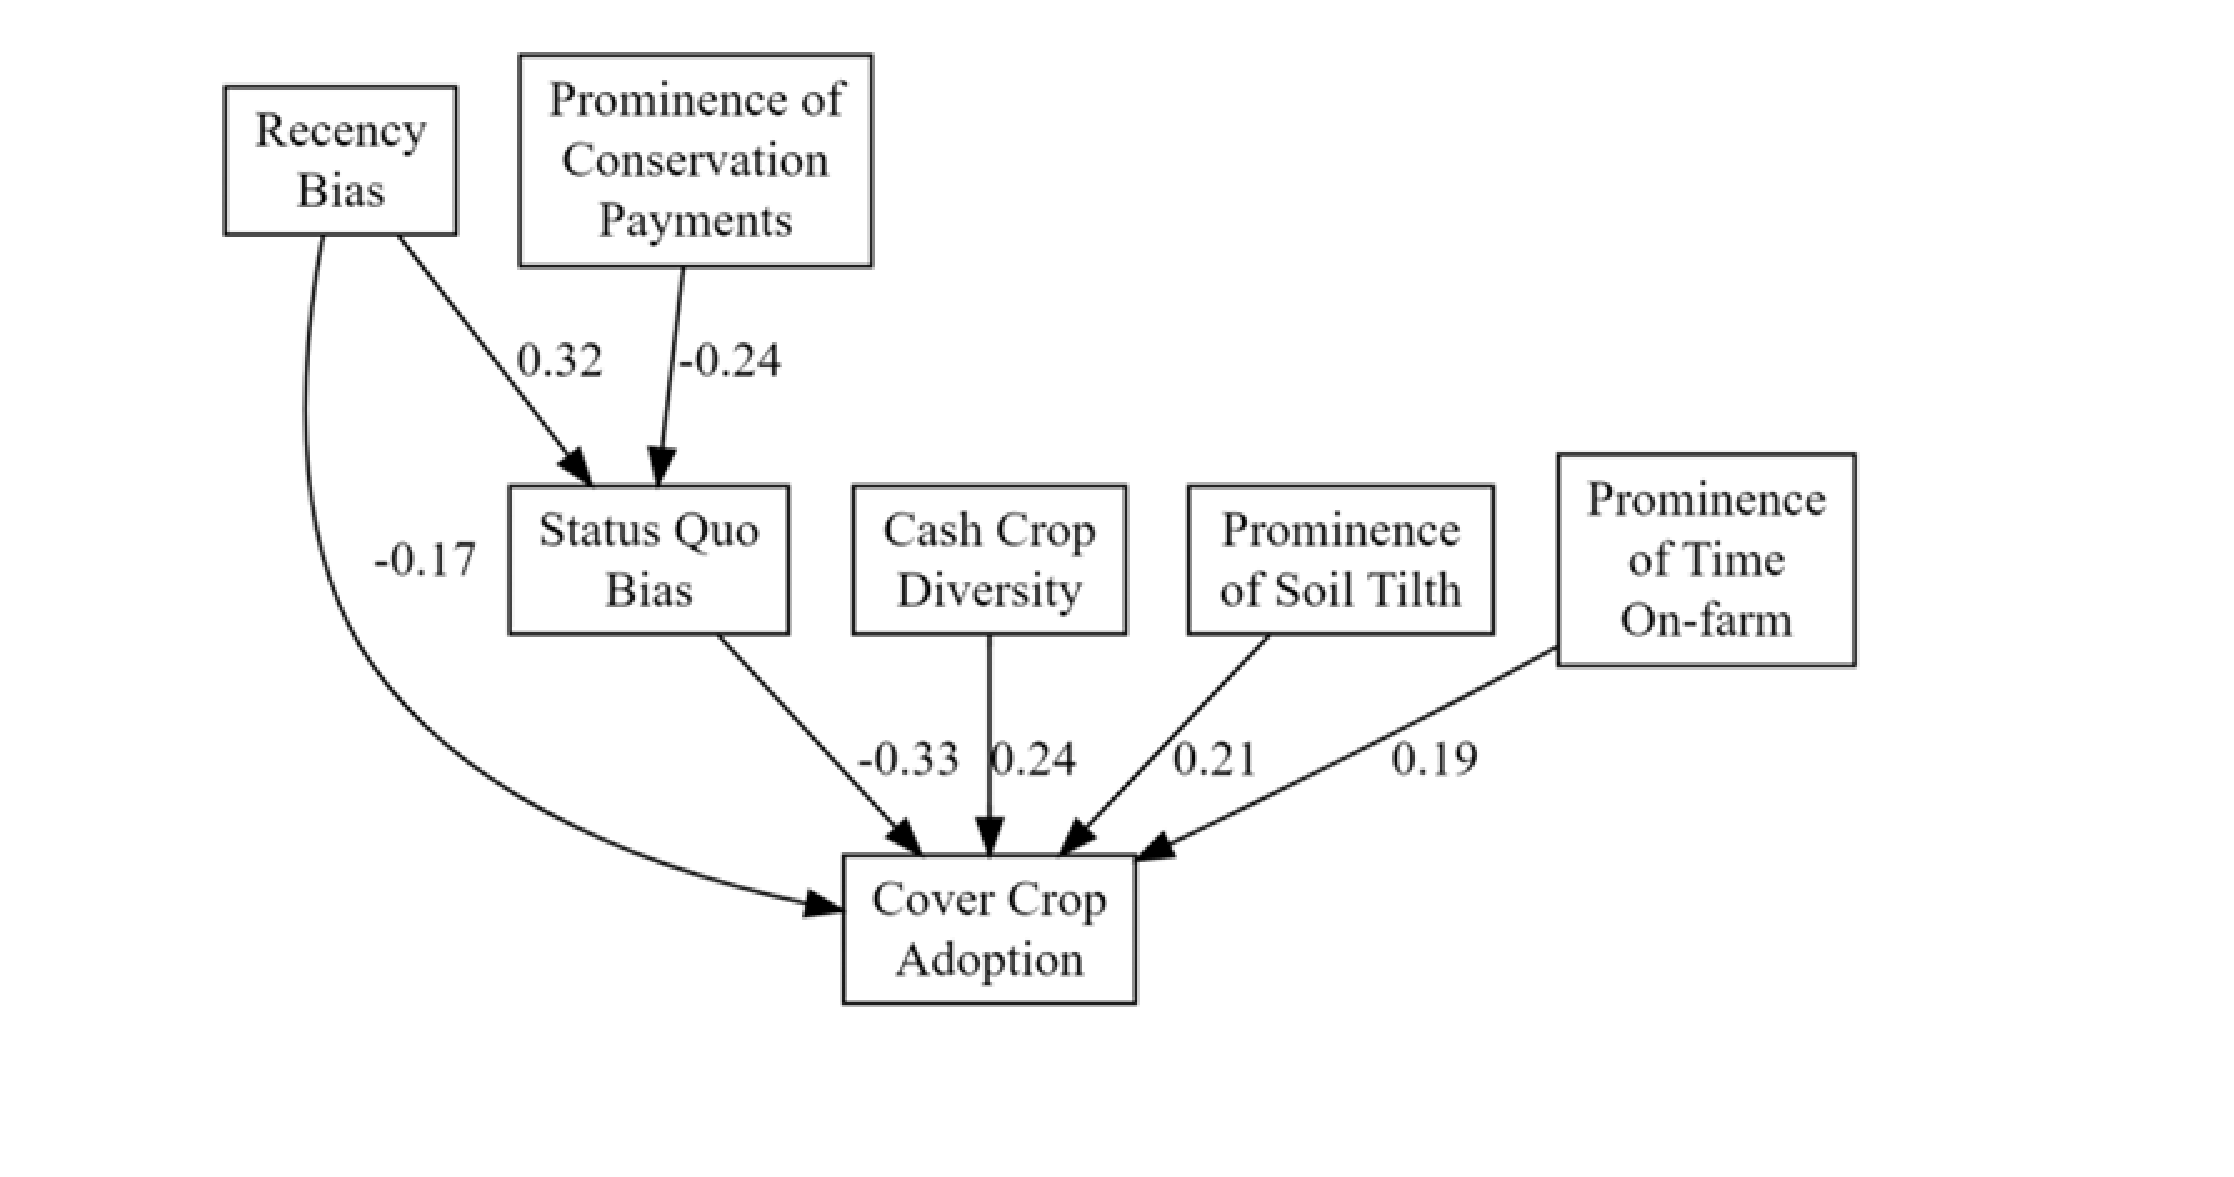
Figure 5. Path Model displaying the relationship between exogenous and endogenous variables.
References:
Chin, W. W. (1998). The partial least squares approach to structural equation modeling. Modern methods for business research, 295(2), 295-336.
Hamilton, M., Salerno, J., & Fischer, A. P. (2022). Cognition of feedback loops in a fire-prone social-ecological system. Global Environmental Change, 74, 102519.
Levy, M. A., Lubell, M. N., & McRoberts, N. (2018). The structure of mental models of sustainable agriculture. Nature Sustainability, 1(8), 413-420.
DISCUSSION
After deriving farmer cognitive maps from surveys and analyzing their cognition of complexity, we found no significant relationship between high cognition of complexity and cover crop adoption or cognitive biases, contrary to our hypothesis. However, there is evidence of a causal pathway between cognitive biases (recency bias and status quo bias) and cover crop adoption. This reinforces the role of System 1 thinking—quick, intuitive decision-making—in shaping farmer behavior. Since status quo bias significantly influences farmer decisions directly and acts as a mediating variable between recency bias and cover crop adoption, efforts to address this bias could improve adoption rates. Canales et al. (2023) explains that deviating from one’s existing practices introduces uncertainty and added risk, while maintaining the status quo offers familiarity and stability, making it a lower-friction choice. As a result, individuals are naturally inclined to adhere to existing practices. Given that the farmers in our study were both owners and operators, our findings also align with Ranjan et al. (2019), who found that landowners are more prone to status quo bias, which serves as a barrier to cover crop adoption. The significant direct effect of status quo bias, and the significant indirect effect of recency bias on cover crop adoption, underscores the dominance of intuitive, heuristic-based thinking (System 1) in farmer decision-making, even in complex agroecosystems.
Although cognition of complexity did not have a direct effect on cover crop adoption, findings suggest that farmers whose cognitive maps had highly connected “soil tilth” and “time spent working on-farm” nodes are more likely to adopt cover crops. We also found that farmers with greater cash crop diversity were more likely to use cover crops, aligning with Singer et al. (2007), who identified crop diversity as the most consistent and important factor influencing cover crop adoption. This relationship may stem from the agronomic benefits of diverse rotations—such as improved soil health—or from underlying behavioral traits, such as lower risk aversion, that make some farmers more inclined to experiment with varieties cash crops and cover crops. Our findings also support Roesch-McNally et al. (2017), who found that farmers with a “whole system” approach actively adjust several management practices—including nutrient application and equipment use—to optimize cover crop success. These farmers also engage in social networks to exchange strategies for overcoming management challenges, reinforcing the idea that systems thinking fosters conservation practice adoption. While System 1 biases may initially shape decision-making, ongoing engagement in adaptive management and farmer networks may serve as a pathway for shifting farmers toward more deliberate, System 2 reasoning over time.
Our findings also indicate that there is no significant relationship between cognition of complexity (as measured by feedback loops and cognitive map density) and cognitive biases (status quo and recency biases). However, we did find a significant negative relationship between the prominence of conservation payments and status quo bias. Farmers who had a highly prominent “conservation payments” factor on their cognitive maps were less likely to exhibit high status quo bias. This suggests that when farmers perceive conservation payments as a critical part of their agroecosystem—demonstrated by more connections to and from “conservation payments” in their cognitive maps—they are less likely to rely on habitual, intuitive decision-making, potentially engaging in more deliberate reasoning about the costs and benefits of conservation practices. In other words, financial incentives may serve as an anchor that encourages farmers to engage System 2 thinking by weighing trade-offs more carefully rather than defaulting to the status quo.
This aligns with the review conducted by Dessart et al. (2019), which highlights how financial risk perceptions influence farmer decision-making, recognizing that more deliberate, analytical reasoning (System 2) is still influenced by subjective, intuitive judgements (System 1). Our findings suggest that financial incentives, like conservation payments, may serve as a mechanism to counteract biases by prompting farmers to engage in a more thoughtful evaluation of conservation practices. Additionally, Dessart et al. (2019) emphasize the importance of flexible management programs in addressing perceived risks. Such flexibility may help mitigate the uncertainty associated with status quo bias, offering farmers pathways to experiment with cover crops in a way that reduces the perceived risk of change.
One potential explanation for the lack of a strong relationship between cognition of complexity and cover crop adoption lies in how complexity was defined and measured. In this study, we assessed feedback loops and the density of cognitive maps to determine a farmer’s cognition of complexity. However, we observed that the densest cognitive maps often resulted from broad, generalized statements (e.g., "It is all important, everything is connected"). While such statements indicate an awareness of agroecosystem complexity, they may not fully capture deep, analytical reasoning. In contrast, a farmer who carefully selects each factor and explicitly considers how they interconnect may demonstrate a different, yet equally sophisticated, form of cognition of complexity. This latter approach better aligns with System 2 thinking, as it reflects deliberate, effortful processing. Consequently, our operationalization of cognition of complexity may not have fully distinguished between different levels of analytical thinking, potentially masking its relationship with adoption behavior.
As recognized by Levy et al. (2018), there are instances in which System 2 thinking can be cumbersome or time-consuming and when simple heuristics are more efficient and still effective. In the context of cover crops, farmers often have a narrow window for planting or termination (Roesch-McNally et al., 2017), a challenge further compounded by unpredictable climate conditions. In such situations, adaptive thinking and rapid decision-making may be essential. However, when farmers have the time and resources to assess soil health, evaluate their cash crop’s nutrient needs, or experiment with different practices, engaging in System 2 thinking can be beneficial. This approach enables thorough research into suitable cover crop varieties and careful consideration of costs and benefits before making a final decision. Moreover, because agroecosystems are complex socio-ecological systems, applying systems thinking can help farmers recognize interdependencies and avoid unintended consequences that may arise from overly narrow or simplistic decision-making (Levy et al., 2018).
Understanding the interplay between System 1 and System 2 thinking can help policymakers design interventions that support farmers in navigating uncertainty and making more informed conservation choices. Notably, surveys by Myers & Wilson (2023) indicate that 80% of farmers who have not yet adopted cover crops remain open to doing so. Given this substantial proportion of potential adopters, efforts should prioritize engaging these farmers rather than focusing on the 20% who are resistant to change—an approach aligned with Everett Rogers’ diffusion of innovations theory (1962; 2003). By identifying and addressing the factors that shape farmer decision-making, this research provides valuable insights into the cognitive processes and perceptions influencing cover crop adoption. The path model offers a plausible explanation of key factors driving adoption, underscoring the need for targeted programs and outreach strategies that consider farmer perspectives and effectively support farmers in transitioning to conservation practices.
REFERENCES
Aminpour, P., Gray, S. A., Beck, M. W., Furman, K. L., Tsakiri, I., Gittman, R. K., ... & Scyphers, S. B. (2022). Urbanized knowledge syndrome—erosion of diversity and systems thinking in urbanites’ mental models. Npj Urban Sustainability, 2(1), 11.
Canales, E., Bergtold, J. S., & Williams, J. R. (2023). Conservation intensification under risk: An assessment of adoption, additionality, and Farmer preferences. American Journal of Agricultural Economics, 106(1), 45–75. https://doi.org/10.1111/ajae.12414
Glas, Z. E., Getson, J. M., Gao, Y., Singh, A. S., Eanes, F. R., Esman, L. A., … Prokopy, L. S. (2018). Effect of Monetary Incentives on Mail Survey Response Rates for Midwestern Farmers. Society & Natural Resources, 32(2), 229–237. https://doi.org/10.1080/08941920.2018.1530815
Lee, D., Arbuckle, J. G., Zhu, Z., & Nowatzke, L. (2018). Conditional causal mediation analysis of factors associated with cover crop adoption in Iowa, USA. Water Resources Research, 54(11), 9566–9584. https://doi.org/10.1029/2017wr022385
Levy, M. A., Lubell, M. N., & McRoberts, N. (2018). The structure of mental models of sustainable agriculture. Nature Sustainability, 1(8), 413-420.
Milo, R., Shen-Orr, S., Itzkovitz, S., Kashtan, N., Chklovskii, D., & Alon, U. (2002). Network motifs: simple building blocks of complex networks. Science, 298(5594), 824-827.
Myers, R. L., & Wilson, K. R. (2023). Farmer perspectives about cover crops by non-adopters. Frontiers in Sustainable Food Systems, 7. https://doi.org/10.3389/fsufs.2023.1011201
Ranjan, P., Wardropper, C. B., Eanes, F. R., Reddy, S. M. W., Harden, S. C., Masuda, Y. J., & Prokopy, L. S. (2019). Understanding barriers and opportunities for adoption of conservation practices on rented farmland in the US. Land Use Policy, 80, 214–223. https://doi.org/10.1016/j.landusepol.2018.09.039
Roesch-McNally, G. E., Basche, A. D., Arbuckle, J. G., Tyndall, J. C., Miguez, F. E., Bowman, T., & Clay, R. (2017). The trouble with cover crops: Farmers’ experiences with overcoming barriers to adoption. Renewable Agriculture and Food Systems, 33(4), 322–333. https://doi.org/10.1017/s1742170517000096
Rogers, E. (2003). Diffusion of innovations: 5th ed (5th ed.). Free Press.
Educational & Outreach Activities
Participation summary:
A research brief outlining the core ideas of this project was included in my dissertation, which is now published and accessible through OhioLINK. In addition, one journal article based on this work is in the process of being submitted to Agricultural Systems.
The research has been presented at four academic meetings and seminars to gather feedback on research design and analysis from scholars and professionals in the field. It was also presented at the Hayes Research Forum at The Ohio State University, where it received first place in the poster competition for the College of Food, Agricultural, and Environmental Sciences. In April 2025, the research was presented during my dissertation defense to my committee, and in June 2025, it was shared at the International Association for Society and Natural Resources (IASNR) conference in Vancouver.
For this research a pilot survey was designed and shared with several academics and extension agents for review. Extension agents also shared this pilot survey with 5 farmers in their local county to ensure the clarity and effectiveness of the survey design. After receiving feedback and modifying the pilot survey, a finalized survey was distributed to farmers in the North Central Region and 179 farmers responded.
Project Outcomes
This study advances existing research on systems thinking and the use of cognitive maps to explore decision-making in agroecosystems. It uniquely combines dual-process theory with systems thinking concepts, providing a new lens to understand farmer decision-making. By developing cognitive maps, assessing farmers' cognition of complexity, and examining the influence of status quo and recency biases (System 1), this research provides new insights into cover crop adoption. This research also offers practical insights for policymakers and agricultural advisors, helping them develop programs that consider farmers' perspectives and create more tailored and effective outreach strategies. Ultimately, this study highlights the role of systems thinking and demonstrates how cognitive biases and mental models shape real-world decisions, bridging the gap between theory and practice in agricultural contexts.
This project offers knowledge on the farmers perspective and visualizes their mental models as cognitive maps. From these maps, we learned that our created variable of cognition of complexity does not strongly impact cover crop adoption which was contrary to our hypothesis and a unique finding relative to research on mental models and systems thinking. We do, however, see a direct relationship between status quo bias and cover crop adoption and an indirect relationship between recency bias and cover crop adoption.
The cognitive maps reveal how farmers perceive the benefits and challenges of conservation practices, providing a window into their decision-making processes. While complexity of cognition may not drive adoption, other psychological factors, such as bias and prior experiences, appear to play a stronger role. This underscores the importance of designing outreach strategies that not only provide technical knowledge but also address behavioral and perceptual barriers to adoption.
Additionally, we gained practical insights into the most effective survey methods for engaging Midwest farmers, emphasizing the need for tailored approaches to collecting reliable data on agricultural decision-making.
One challenge in this research was achieving a sufficient survey response rate from farmers. We observed a notably low response rate for electronic surveys distributed via email and postcard QR codes (0.35%), prompting us to adapt our sampling methods to include print surveys, which yielded a higher response rate (5.73%). Despite this improvement, the overall response rate remains low, and we acknowledge that our findings may not fully represent the experiences of all row-crop farmers in the population. This reflects the broader decline in farmer survey participation over the past few decades. These challenges suggest that future studies should prioritize print surveys, incorporate incentives to boost response rates, and explore alternative methods such as interviews, phone surveys, or focus groups to capture a more representative range of farmer perspectives
Also, given the many ways complexity can be measured, future research could include measurements for complexity could be expanded to include additional network motifs as outlined by Milo et al. (2002) and used by Aminpour et al. (2022) and Levy et al. (2018).