Final report for GNC24-389
Project Information
Biodiversity is a fundamental component of ecosystem function and soil health; however, agricultural intensification is a known driver of declining biodiversity. Efforts to mitigate the impact of agricultural intensification on biodiversity and ecosystem services (including decomposition) in the form of sustainable agricultural management are rising in adoption. Detecting the impact of sustainable agriculture on soil health is often challenging due to the extended time necessary to observe discernable changes. A bioindicator of soil health, connected to decomposition, C/N cycling, and microbial activity, would provide agricultural producers with a reliable tool capable of assessing the impact of management decisions early after adoption. Diptera (flies) are undervalued as ecosystem service providers but recognized for their role in decomposition and nutrient cycling. Quantifying the contributions of Diptera to decomposition in agriculture will establish this key insect taxon as a comprehensive bioindicator for soil health. I propose investigating the effect of sustainable agricultural management practices on cover crop decomposition, nutrient cycling, and soil insect diversity, with a particular emphasis on Diptera. Objectives of our project include quantifying the diversity and abundance of Diptera in sustainably and conventionally managed annual row crops, evaluating decomposition rates and C/N release of a cover crop, and assessing the relationship between Diptera emergence and cover crop decomposition. I will conduct my research at the W. K. Kellogg Biological Station in Michigan, where the United States Department of Agriculture (USDA) Long-Term Agroecosystem Research (LTAR) Aspirational Cropping Systems Experiment (ACSE) is established. The LTAR ACSE compares sustainable "Aspirational" systems with conventional "Business as Usual" systems, focusing on aspects including crop rotation, tillage, and cover cropping. I aim to advance the understanding of the relationship between sustainable agricultural management practices, soil biodiversity, and ecosystem function. By identifying the contributions of Diptera to decomposition processes, this project will provide valuable insights for agricultural management practices aimed at enhancing soil health and sustainability.
Learning Outcome(s): I will educate row crop growers about an underappreciated guild of beneficial insects in agriculture, the decomposers facilitating nutrient cycling. These agricultural producers will learn the efficacy of using a cover crop mixture of red clover, alfalfa, chicory, and annual ryegrass in soil nutrient cycling which will foster informed decision-making in agricultural management. Additionally, they will understand how soil biodiversity can be used as a bioindicator for assessing nutrient cycling and soil health.
Action Outcome(s): Empowered with a holistic understanding of sustainable soil management and biodiversity, row crop growers will be equipped to make informed decisions when adopting cover cropping and no-till, optimizing the efficacy of nutrient cycling. I expect my work will allow producers to integrate sustainable soil management with other management practices like insecticide applications to develop management strategies that reduce the disruption to soil biodiversity and the efficacy of adopting cover cropping and no-till. This will help agricultural producers convey how their management decisions translate into sustainable agriculture and meet industry priorities to the broader public.
Cooperators
- (Researcher)
- (Researcher)
- (Researcher)
Research
Study Site and System
This study was conducted at the W. K. Kellogg Biological Station (KBS), located in southwestern Michigan, USA (42.403729, -85.379327), a temperate agroecosystem dominated by corn–soybean production. The site has a humid continental climate with a mean annual precipitation of 926 mm and a mean annual temperature of 9.2 °C (Robertson et al., 2024). During the study, the site received 277 mm of precipitation in 2024 and 217 mm in 2025. Soils at the site are classified as a Kalamazoo series loam (fine-loamy, mixed, active, mesic Typic Hapludalfs).
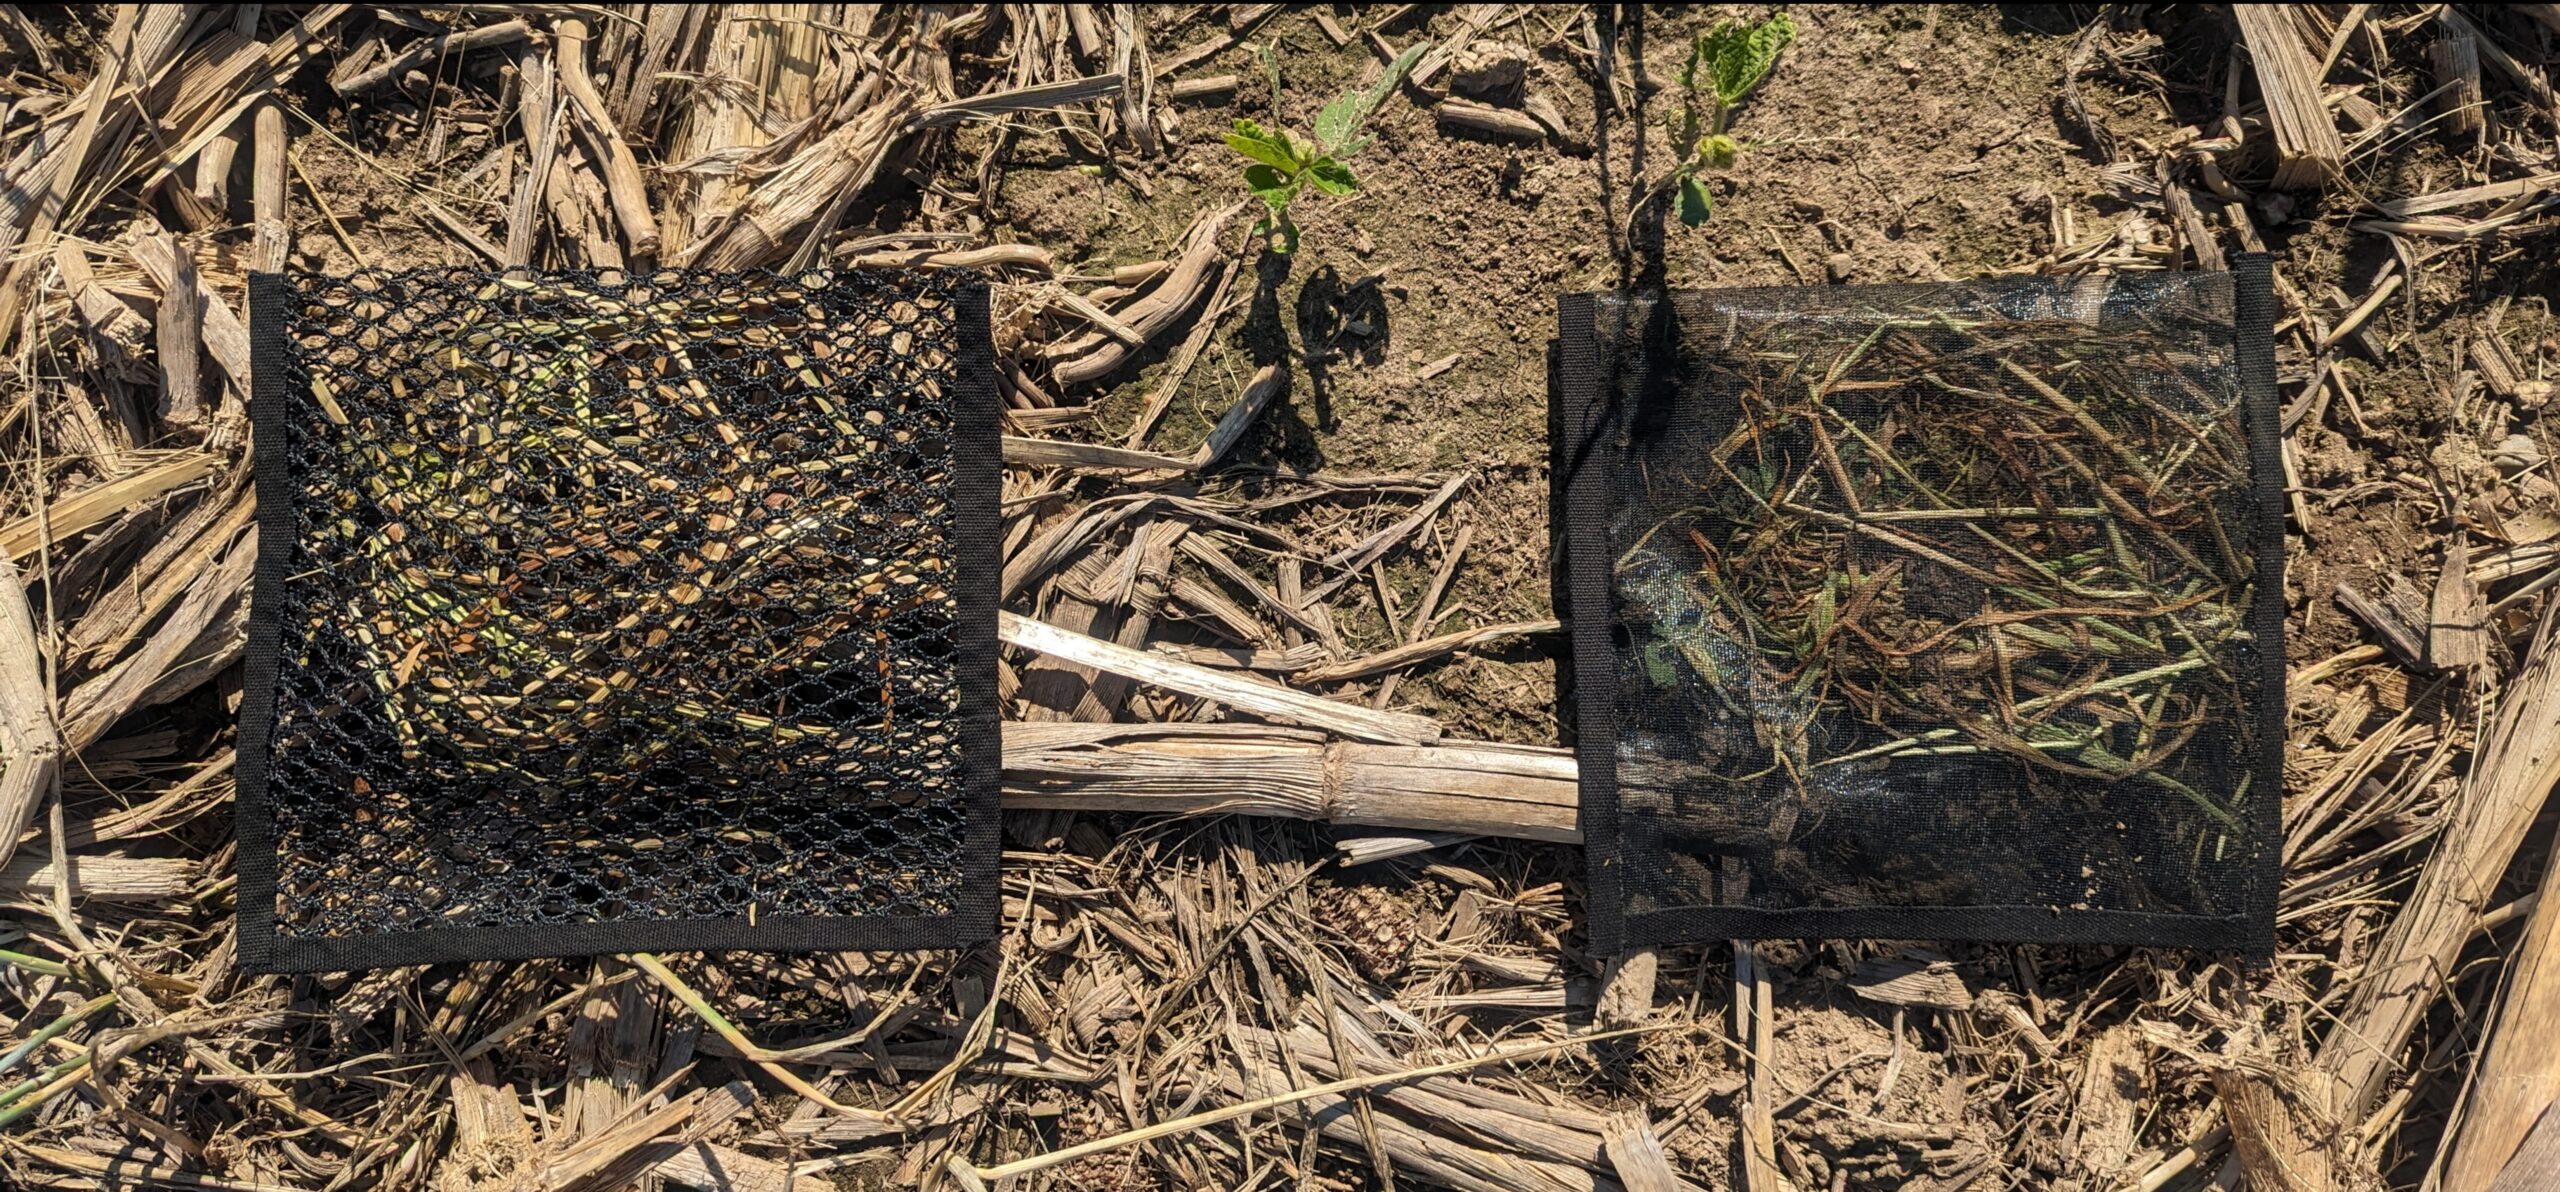
Figure 1. Coarse- and fine-mesh litter bags filled with cover crop residue (red clover, alfalfa, annual ryegrass, and chicory) used to quantify decomposition. Fine-mesh bags excluded mesofauna and macrofauna, whereas coarse-mesh bags permitted access by a broader range of fauna.
Established in 2022, the Aspirational Cropping Systems Experiment (ACSE) is part of the United States Department of Agriculture Long-Term Agroecosystem Research (LTAR) Common Experiment (Spiegal et al., 2018; Robertson et al., 2024). The LTAR ACSE compares an “aspirational” management system designed to evaluate sustainable intensification, a “business-as-usual” conventional system representative of dominant agricultural practices in southwestern Michigan, and a 22-species restored grassland prairie. Restored prairies were reconstructed from historically prominent native species and designed to enhance biodiversity and ecosystem services. Aspirational management integrates a five-crop rotation (corn–soybean–winter wheat–winter canola–forage), no-till, precision technologies, adaptive management, organic amendments, cover cropping, and continuous ground cover. Composted manure is applied as an organic amendment prior to corn planting. Cover crops are established during the corn and wheat phases of the rotation. A mix of crimson clover (Trifolium incarnatum), Dwarf Essex rapeseed (Brassica napus), and wild radish (Raphanus raphanistrum) is interseeded into corn, followed by cereal rye (Secale cereale) post-harvest. After the wheat harvest, sorghum sudan grass (Sorghum bicolor × drummondii), pearl millet (Pennisetum glaucum), and sunn hemp (Crotalaria juncea) are planted. Business-as-usual management comprises a two-crop rotation, reduced tillage (chisel plow), and preventive management. Detailed agronomic data from the ACSE are available in the W. K. Kellogg Biological Station Data Repository (KBS Long-Term Ecological Research, 2025).
We sampled a subset of the ACSE, focusing on corn and soybean present in both aspirational and business-as-usual systems, and compared these management systems to the restored prairie system. Five systems were sampled in 2024 and 2025: restored prairie, aspirational corn and soybean, and business-as-usual corn and soybean. Each system had four replicates (N = 4). Plots measured 28 × 85 m and were separated by grass alleyways at least 4 m wide. A perennial forage with broad functional diversity is rotated into corn as a spring-terminated cover crop within the aspirational system (Table 2). We used biomass harvested from this cover crop as a reference substrate to compare the effects of management on decomposition mediated by soil fauna, quantified by mass loss, realized microbial respiration, microbial respiration potential, and total carbon and nitrogen.
Table 2. Species included in the perennial forage of the Long-Term Agroecosystem Research Aspirational Cropping Systems Experiment and their associated functional traits. Adapted from the USDA Natural Resources Conservation Service PLANTS Database and Agricultural Research Service Cover Crop Chart (Version 4.0).
|
Species |
Plant Type |
Root Depth |
Nitrogen |
C:N Ratio |
Predicted Decomposition |
|
|
Fixation |
Scavenger |
|||||
|
Red clover (Trifolium pratense) |
Legume
|
Shallow– Medium |
Medium |
Low |
Low (15–23) |
Fast |
|
Alfalfa (Medicago sativa) |
Legume |
Deep |
High |
Medium |
Low (11–13) |
Fast |
|
Annual Ryegrass (Lolium multiflorum) |
Grass |
Medium |
– |
High |
High (45) |
Medium– Slow |
|
Chicory (Cichorium intybus) |
Forb |
Deep |
– |
Medium– High |
Medium (27–48)a |
Medium |
aAdapted from Gardner et al., (2024).
Mass Loss
Mass loss was estimated using the litter bag technique (Bärlocher, 2020). Litter bags (20 × 20 cm, 100% polyester; Seattle Fabrics, Seattle, Washington, United States of America) were assembled with fine (Pore size: 0.65–0.75 mm, No-See-Um Mosquito Netting) or coarse (Pore size: 6–8 mm, 8600 Dive Mesh) mesh and sealed with weatherproof canvas repair tape (King Mountain). Fine-mesh excluded, whereas coarse-mesh allowed access by mesofauna and macrofauna (Figure 1). Each litter bag was filled with 30 ± 0.01 g of fresh cover crop biomass within 24–72 hours of harvest and deployed on 23 May 2024 and 28 May 2025 following spring planting. Biomass was harvested using a sickle bar mower from a separate plot planted adjacent to the experiment the previous year to standardize the source. Twelve additional biomass samples were dried at 57°C for at least 48 hours to a constant mass to determine the initial dry mass and establish a baseline for evaluating mass loss. Nine bags of each mesh size were randomly placed on the soil surface at the center of each plot, spaced 15 cm apart (total = 360). Cover crop decomposition and nutrient release peak within 8 weeks post-deployment in a humid continental climate (Jahanzad et al., 2016); therefore, we collected three subsamples of each mesh size per plot at 20, 40, and 60 days. Each subsample was immediately weighed, and 0.50g of litter was transferred into a 50 mL conical centrifuge tube for realized microbial respiration and microbial respiration potential. After microbial respiration was measured, the 0.50 g of litter was weighed to a constant mass and added to the remaining subsample to quantify water content and dry mass loss. Mass loss was modeled as an exponential decay function:
M_t=M_0 e^(-kt)
where Mₜ = mass remaining at time t, M₀ = initial mass, and k = decay constant. Half-life was calculated as:
(ln(2))/(|k|)
where k = decay constant.
Realized Microbial Respiration
Each 50 mL conical centrifuge tube was sealed with a modified 20 mm butyl septum cap under a fume hood to standardize ambient CO2, wrapped in Parafilm, and incubated for 24 hours at 24 ± 2 °C and 40–60% relative humidity. Following incubation, 1 mL of headspace gas was extracted with a syringe and injected into a CO₂/H₂O gas analyzer (LI-850; LI-COR, Lincoln, Nebraska, United States of America), which operated at 51.5 °C with a flow rate of 300 mL min⁻¹, using 100% N₂ as the carrier gas. Calibration standards (1% CO2 in 99% N2) were run pre- and post-sample to verify instrument consistency.
Microbial Respiration Potential
After realized microbial respiration was measured, each tube was filled with DI H2O, saturated for 10 minutes, then decanted over a fine-mesh screen (180 μm) to recover any plant material lost that had been lost, and the recovered material was returned to the tube. Incubation and CO₂/H₂O gas analysis were repeated. Several tubes contained less than 0.50g of litter after 60 days due to limited remaining material. When this occurred, the tube was filled with all remaining litter, and respiration was corrected to the dry litter mass. CO₂ concentration (ppm) was converted to mg CO₂ g ⁻¹ litter day⁻¹ using the following equation:
mg CO_2 g^(-1) biomass day^(-1)=(ΔC ×P × V ×M_(CO_2 ))/(R ×T ×m ×t)
where = change in CO₂ concentration (ppm) during incubation, = atmospheric pressure (1 atm), = headspace volume (L), = molar mass of CO₂ (44.01 mg mmol⁻¹), = ideal gas constant (0.0821 L atm mol⁻¹ K⁻¹), = temperature (K), = dry litter mass (g), and = incubation time (days).
Total Carbon and Nitrogen
Remaining litter from mass loss measurements, not used for microbial respiration, was pulverized (Electric Pill Crusher; Cool Knight, Richmond, VA, USA). Homogenized subsamples of 2-5 mg of ground plant material were packed into tin capsules (D1009, 5 x 9mm; EA Consumables, Marlton, NJ, USA). Each capsule was then combusted in an elemental analyzer (UNICUBE; Elementar, Langenselbold, Hesse, Germany) to quantify total carbon and nitrogen. Samples with insufficient remaining material following microbial respiration measurements were excluded from combustion analysis.
Diptera Monitoring
Diptera communities were sampled in eight management systems: 1) restored prairie, 2) aspirational corn, 3) aspirational soybean, 4) aspirational wheat, 5) aspirational canola, 6) aspirational forage, 7) business-as-usual corn, and 8) business-as-usual soybean. Townes-style malaise traps (ez-Malaise Trap II; L165 × W180 × H180 cm; BugDorm, Taichung, Taiwan) and soil emergence traps (Soil Emergence Trap II; W60 × D60 × H60 cm; BugDorm, Taichung, Taiwan) were deployed concurrently to enable complementary passive sampling of the Diptera community. Malaise traps broadly sample mobile adult flies engaged in dispersal or foraging, whereas soil emergence traps target resident flies that emerge from local substrates within the plot. Together, these methods characterize the adult Diptera community while mitigating sampling bias (Brown, 2021).
Sampling was conducted monthly from May through September in 2023 and 2024. Each sampling event lasted no more than two weeks and was timed to avoid agronomic operations (e.g., chemical applications). Replicates were sampled in a randomized sequence, with malaise and soil emergence traps deployed simultaneously in separate plots for 48 hours. After each sampling period, traps were relocated to the next replicate until all plots had been sampled with both trap types. Traps were positioned at the center of each plot, at least 14 m from the plot edges, and fitted with 500 mL polypropylene collection bottles (7.5 × H15 cm) containing 100–150 mL of 70% ethanol. Following collection, bottles were rinsed with 70% ethanol to ensure complete specimen recovery, and samples were transferred to 95% ethanol for storage prior to identification.
Results
Mass Loss
Residue mass declined over time, except for in fine-mesh bags in the business-as-usual corn management system (Figure 2). Significant two-way interactions were observed between sampling date and crop (F4, 898 = 33.26, P < 0.001) and between sampling date and mesh size (F1, 896 = 260.07, P < 0.001. The model explained 74% of the variance in mass loss (marginal R2 = 0.74; conditional R2 = 0.76). Cover crop residue decomposition was fastest in the restored prairie for both coarse- and fine-mesh bags, although these rates did not differ significantly from those in the aspirational systems (Table 3). In coarse-mesh bags, decomposition of corn and soybean was 41% faster under aspirational management than under business-as-usual management. In fine-mesh bags, management effects were less pronounced: residue decomposed faster in aspirational corn than in business-as-usual corn, whereas decomposition rates did not differ among soybean management systems. Estimated residue half-lives ranged from 27 to 43 days in coarse-mesh and 46 to 173 days in fine-mesh. Half-life could not be estimated for fine-mesh business-as-usual corn because no measurable mass loss was observed.
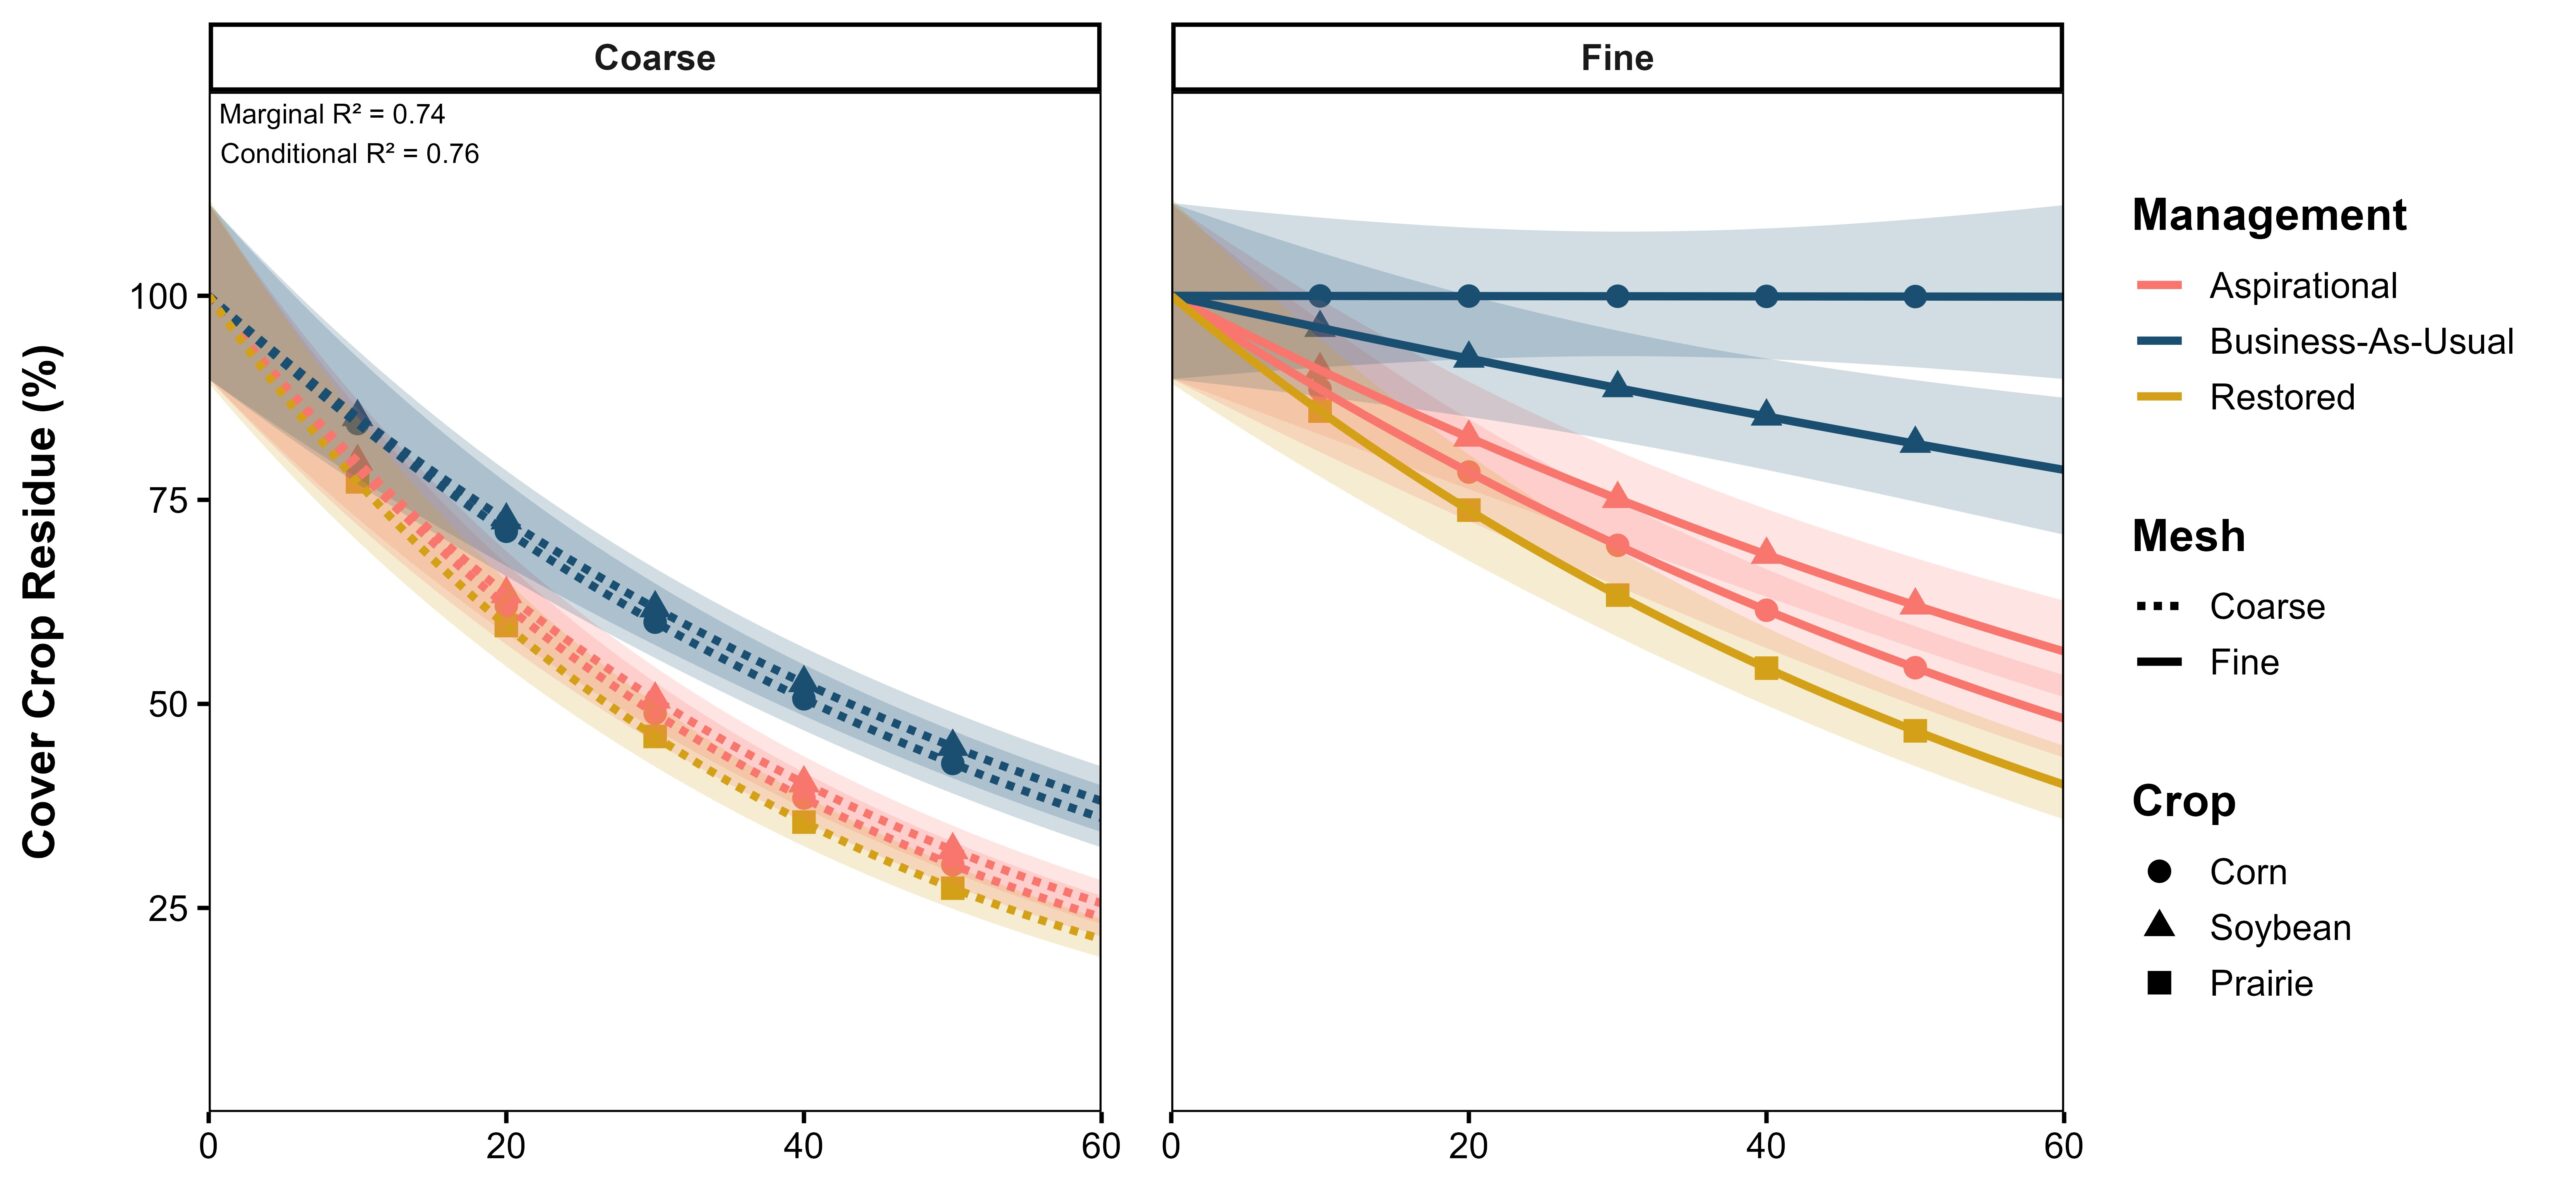
Figure 2. Predicted cover crop residue decomposition (± 95% confidence intervals) over a 60-day period for aspirational, business-as-usual, and restored management, separated by mesh size. Significant two-way interactions were observed between sampling date and crop (F4, 898 = 33.26, P < 0.001) and between sampling date and mesh (F1, 896 = 260.07, P < 0.001).
Table 3. Model-estimated exponential decay rates (k) and corresponding half-lives of cover crop residue across crop and mesh size during the 60-day decomposition period.
|
Management |
Crop |
Mesh |
k |
95% CI |
Half-life) |
|
|
|
|
|
|
Lower |
Upper |
(Days |
|
Restored |
Prairie |
Coarse |
0.0259 a |
0.0223 |
0.0294 |
27 |
|
Aspirational |
Corn |
Coarse |
0.0239 a |
0.0203 |
0.0274 |
29 |
|
|
Soybean |
Coarse |
0.0227 a |
0.0192 |
0.0263 |
31 |
|
Business-As-Usual |
Corn |
Coarse |
0.0170 b |
0.0135 |
0.0206 |
41 |
|
|
Soybean |
Coarse |
0.0161 b |
0.0125 |
0.0196 |
43 |
|
Restored |
Prairie |
Fine |
0.0152 bc |
0.0116 |
0.0188 |
46 |
|
Aspirational |
Corn |
Fine |
0.0122 bc |
0.0086 |
0.0157 |
57 |
|
|
Soybean |
Fine |
0.0095 cd |
0.0060 |
0.0131 |
73 |
|
Business-As-Usual |
Corn |
Fine |
0.0000 e |
-0.0036 |
0.0036 |
n/aa |
|
|
Soybean |
Fine |
0.0040 de |
0.0004 |
0.0076 |
173 |
a Negligible mass loss in fine-mesh business-as-usual corn prevented the calculation of a half-life.
Realized Microbial Respiration
Realized microbial respiration rates were low (Figure 3), ranging from 0.000 to 8.321 mg CO2 g-1 biomass day-1 (1st Quartile = 0.011, Median = 0.044, 3rd Quartile = 0.528). Mesh significantly affected realized microbial respiration (F1, 671 = 4.03, P = 0.045), and a significant two-way interaction between sampling date and crop was observed (F4, 671 = 6.31, P < 0.001). The model explained 21% of the variance in realized microbial respiration (marginal R2 = 0.21; conditional R2 = 0.57). Across all systems, respiration was 40% greater in the fine-mesh than in the coarse-mesh bags. Within fine-mesh bags placed in soybean under business-as-usual management, respiration was greater than under aspirational management on days 40 and 60. No other significant differences among systems were detected across sampling date and mesh size.
Moisture was a primary driver of realized microbial respiration (Figure 4). A significant two-way interaction was observed between moisture content and crop (F4, 569 = 3.77, P = 0.005). The model explained 39% of the variance in realized microbial respiration (marginal R2 = 0.38; conditional R2 = 0.53). Aspirational corn exhibited the strongest positive relationship between moisture content and respiration (β = 0.201, 95% CI: 0.155–0.247); however, the slope was only significantly different from that of business-as-usual corn (β = 0.116, 95% CI: 0.079–0.153). Slopes for aspirational soybean (β = 0.140, 95% CI: 0.103–0.177), business-as-usual soybean (β = 0.142, 95% CI: 0.102–0.183), and restored prairie (β = 0.146, 95% CI: 0.112–0.179) did not differ significantly between either corn management system.
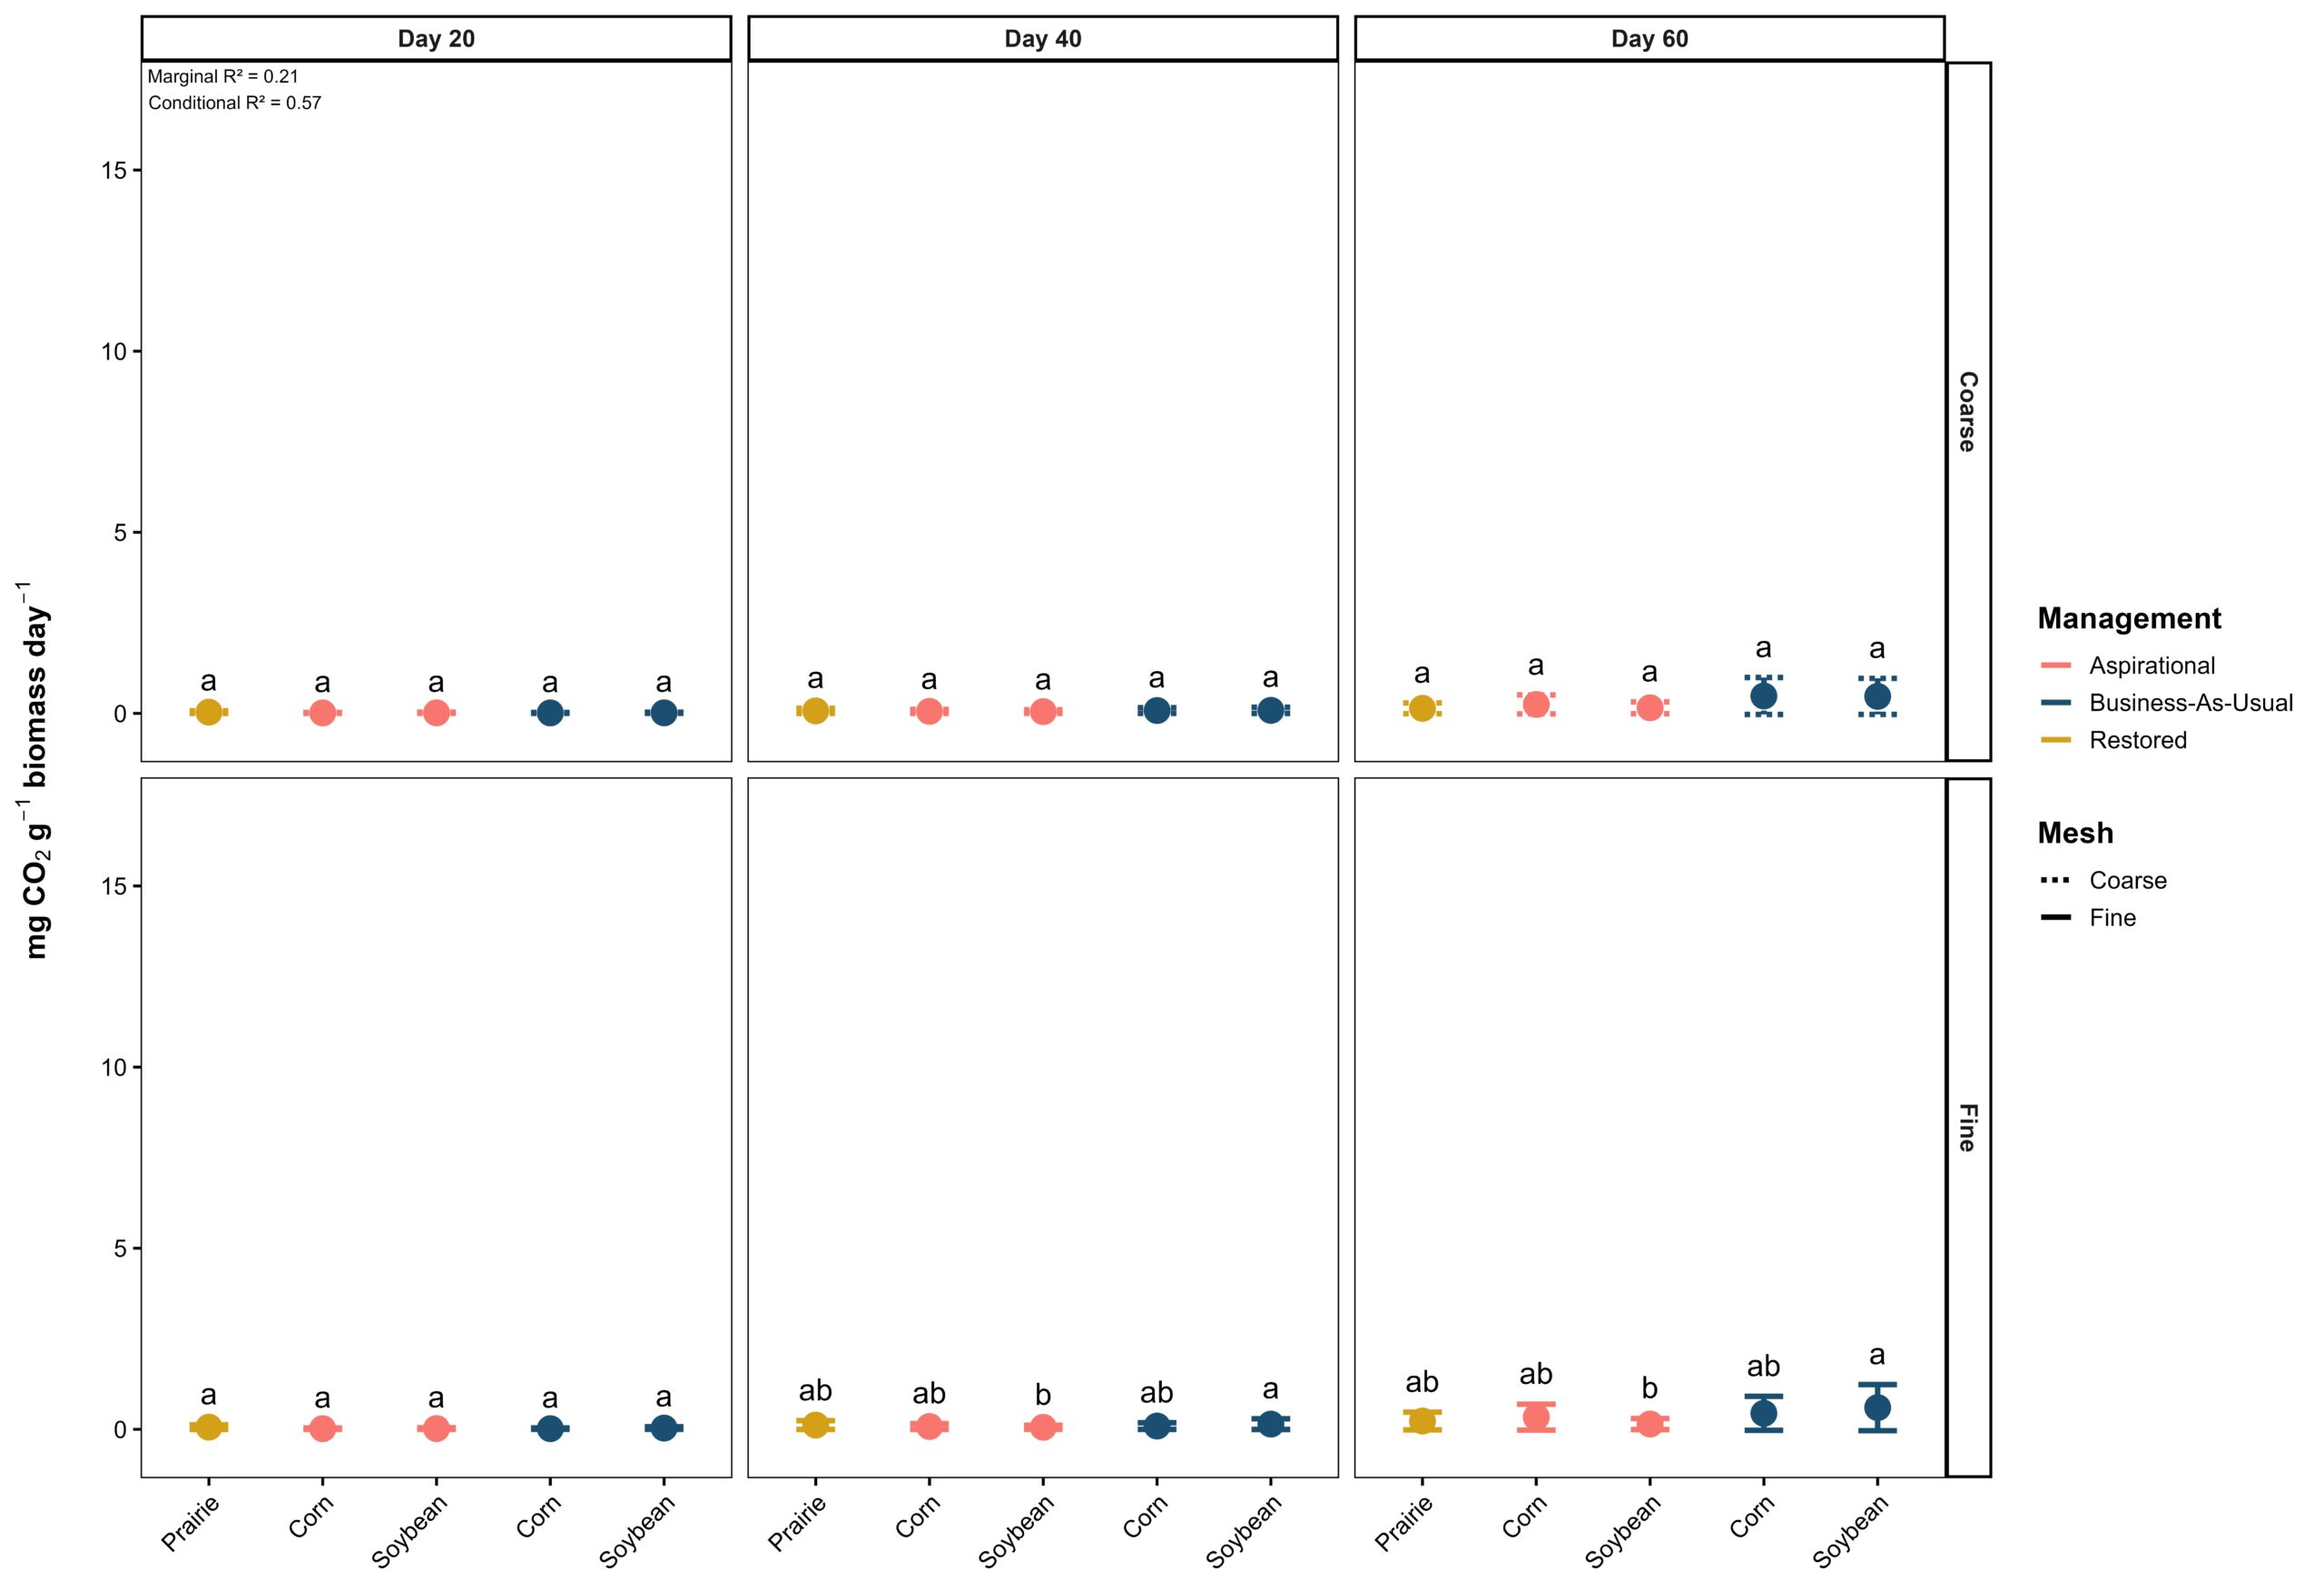
Figure 3. Mean realized microbial respiration (mg CO2 g-1 biomass day-1 ± standard error) from decomposing cover crop residue in fine- and coarse-mesh measured at 20, 40, and 60 days across aspirational, business-as-usual, and restored management systems. Letters indicate significant differences among groups within each panel. Mesh significantly affected realized microbial respiration (F1, 671 = 4.03, P = 0.045), and a significant two-way interaction between sampling date and crop was observed (F4, 671 = 6.31, P < 0.001).
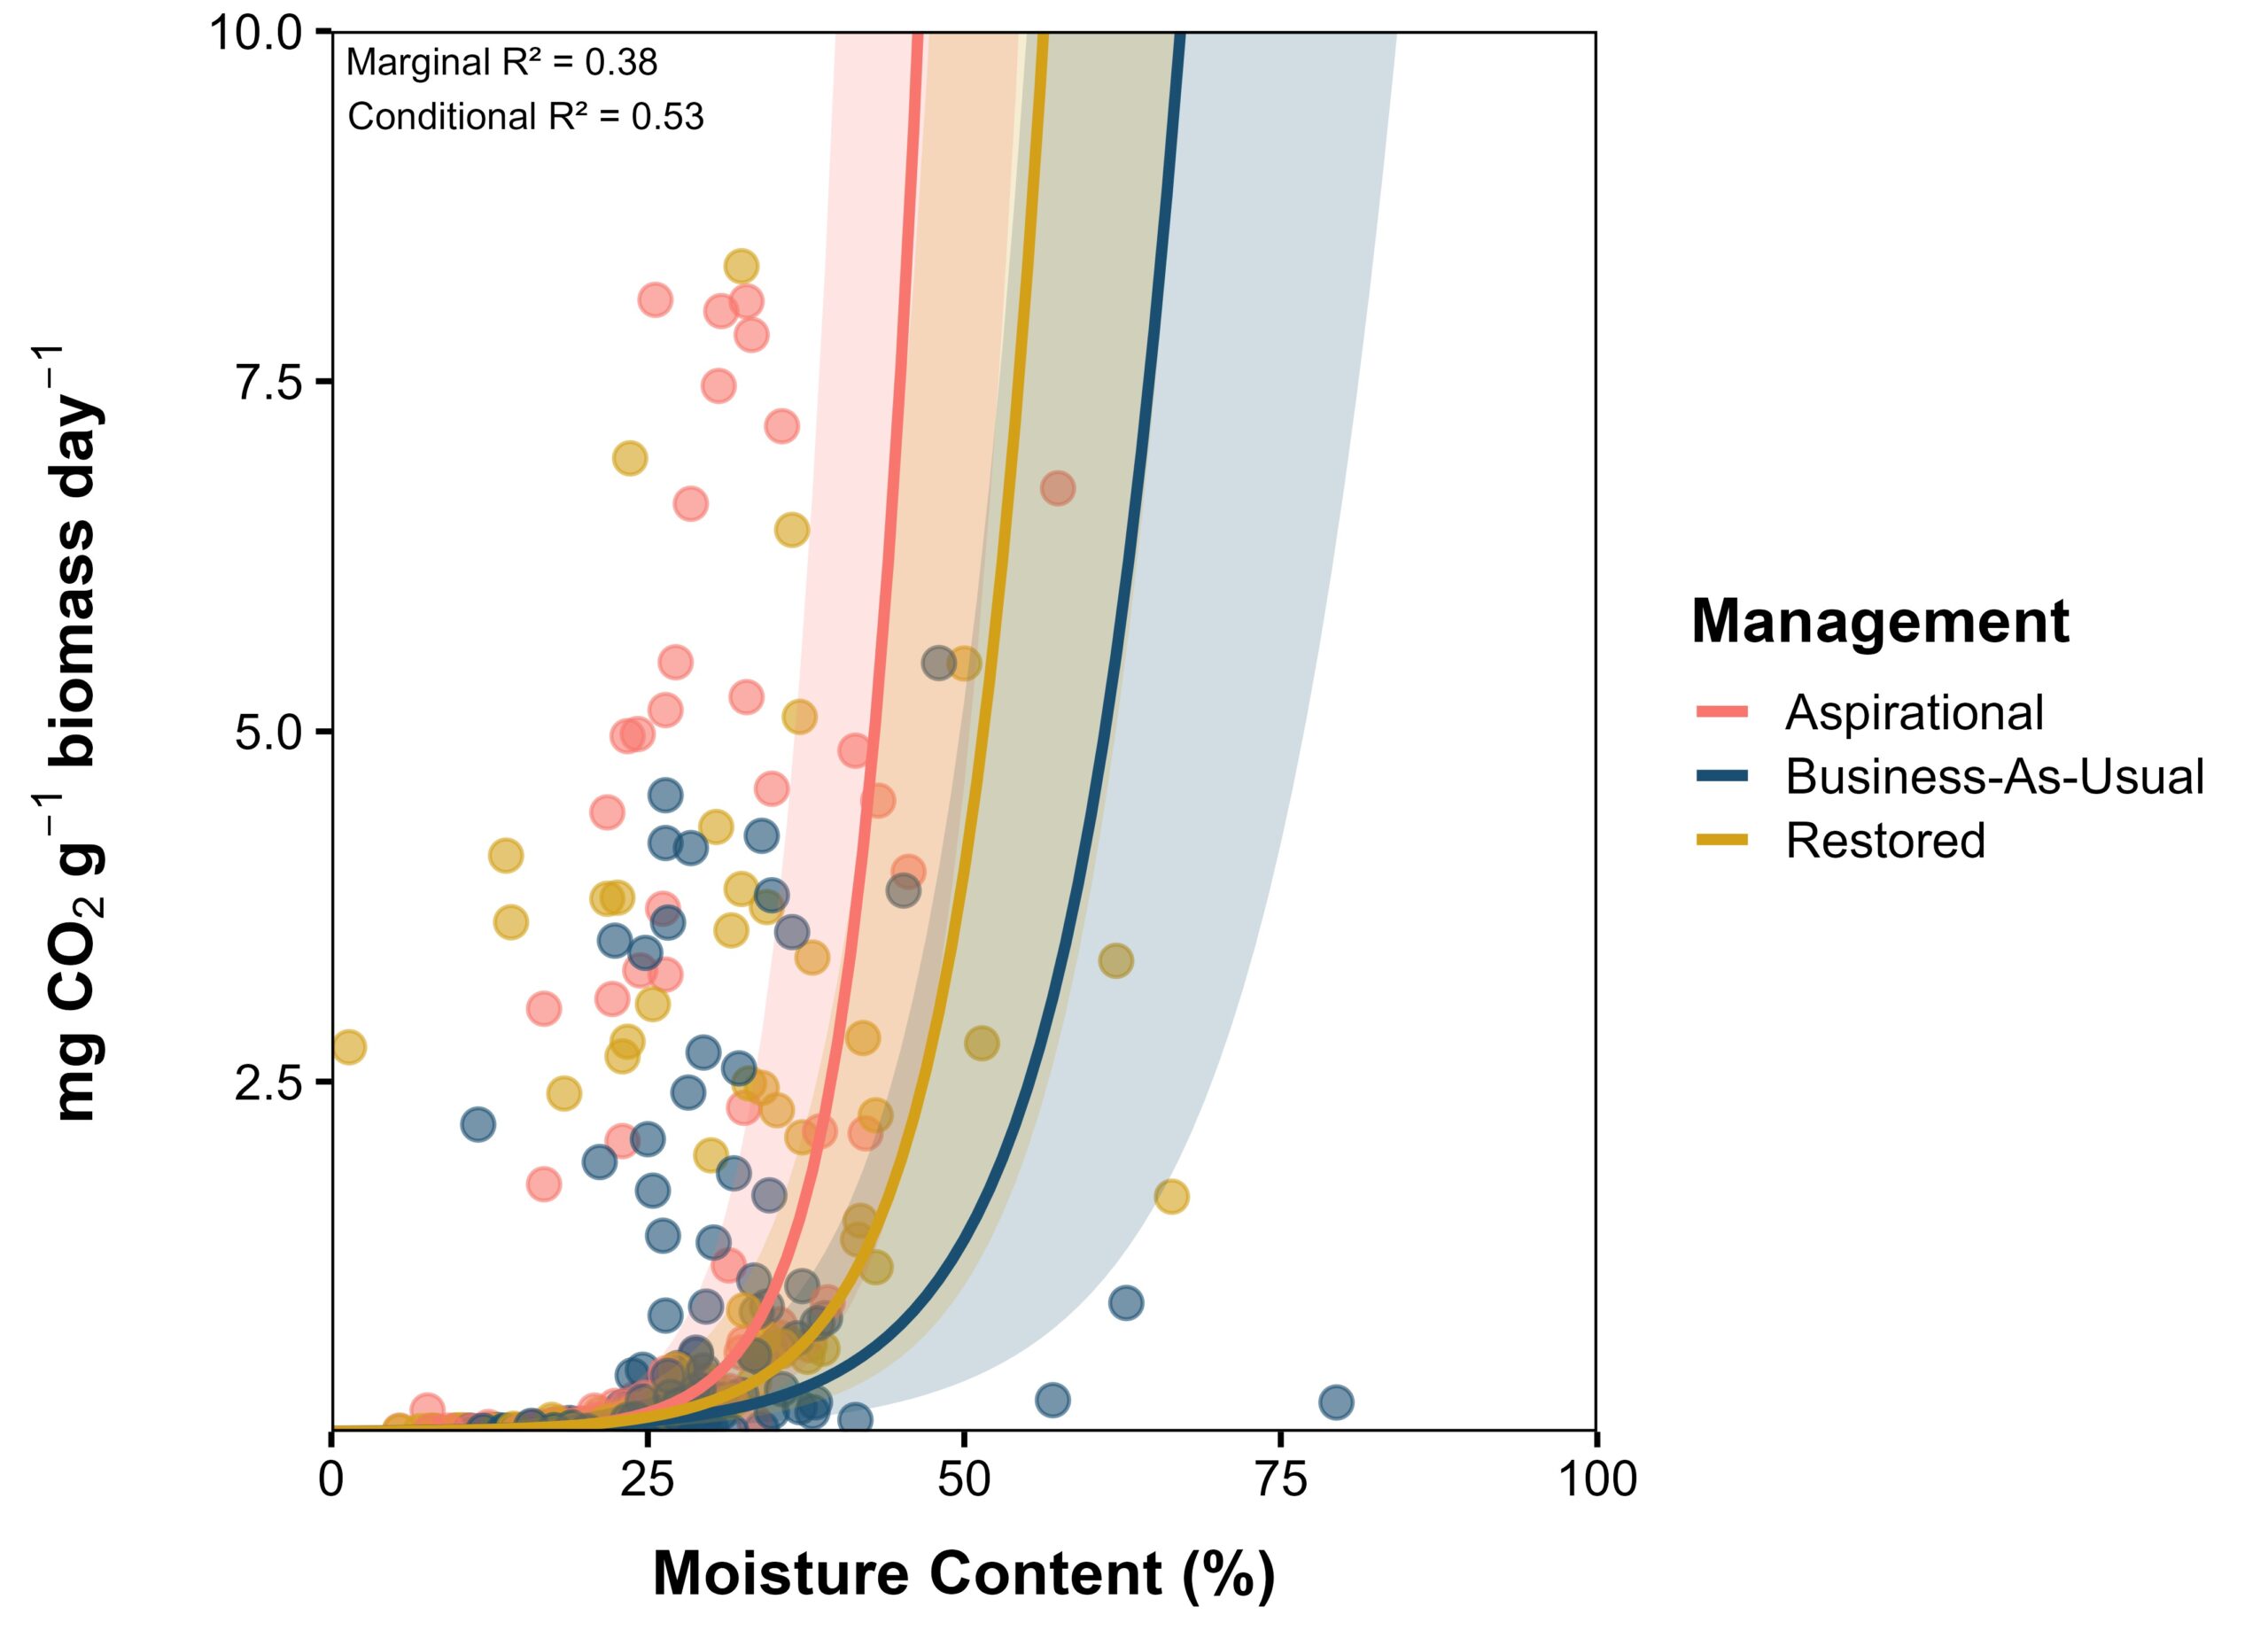
Figure 4. Realized microbial respiration (mg CO2 g-1 biomass day-1 ± 95% confidence intervals) during cover crop residue decomposition as a function of moisture content across a 60-day period for aspirational corn, business-as-usual corn, and restored prairie systems. A significant two-way interaction was observed between moisture content and crop (F4, 569 = 3.77, P = 0.005). Aspirational and business-as-usual soybean were omitted because their responses were statistically similar to those of the restored prairie and were visually redundant.
Microbial Respiration Potential
Microbial respiration potential rates were consistently higher than realized microbial respiration and declined over time (Figure 5). A significant three-way interaction was observed among sampling date, crop, and mesh size (F4, 663 = 2.43, P < 0.05). The model explained 59% of the variance in microbial respiration potential (marginal R2 = 0.59; conditional R2 = 0.66).
At 20 days, microbial respiration was highest in fine-mesh bags placed in aspirational corn (13.11 ± 2.38 mg CO2 g-1 biomass day-1) but was comparable to the restored prairie (9.79 ± 1.84 mg CO2 g-1 biomass day-1). Aspirational corn exceeded aspirational soybean and both business-as-usual systems (5.13–8.82 mg CO2 g-1 biomass day-1). Aspirational management increased microbial respiration in corn by 156% relative to business-as-usual but had no significant effect on soybean. In coarse-mesh bags, differences were less pronounced; the only significant comparison was between aspirational corn (7.75 ± 1.40 mg CO2 g-1 biomass day-1) and business-as-usual soybean (5.03 ± 0.91 mg CO2 g-1 biomass day-1).
After 40 days, microbial respiration declined, though trends in the fine-mesh remained consistent. Aspirational corn again exhibited the highest microbial respiration (6.32 ± 1.04 mg CO2 g-1 biomass day-1), not differing from restored prairie (5.17 ± 0.89 mg CO2 g-1 biomass day-1), but exceeding aspirational soybean and both business-as-usual systems (2.35–4.53 mg CO2 g-1 biomass day-1). Aspirational management increased microbial respiration by 169% in corn and 69% in soybean relative to business-as-usual. Trends for residue in coarse-mesh bags mirrored those observed in fine-mesh bags.
By 60 days, microbial respiration reached its lowest levels across corn, soybean, and prairie, regardless of management or mesh size. In fine-mesh bags, aspirational corn did not differ from restored prairie and aspirational soybean (2.32–3.04 mg CO2 g-1 biomass day-1); however, both aspirational systems remained higher than the business-as-usual systems (1.07–1.16 mg CO2 g-1 biomass day-1). Aspirational management increased microbial respiration in corn by 184% and in soybean by 100% relative to business-as-usual. In coarse-mesh bags, aspirational corn maintained the highest microbial respiration (3.06 ± 0.56 mg CO2 g-1 biomass day-1), exceeding restored prairie, aspirational soybean, and both business-as-usual systems (1.07–1.75 mg CO2 g-1 biomass day-1). Aspirational corn exhibited 75% greater respiration than restored prairie and 186% greater than business-as-usual corn. Aspirational soybean did not differ from business-as-usual soybean.
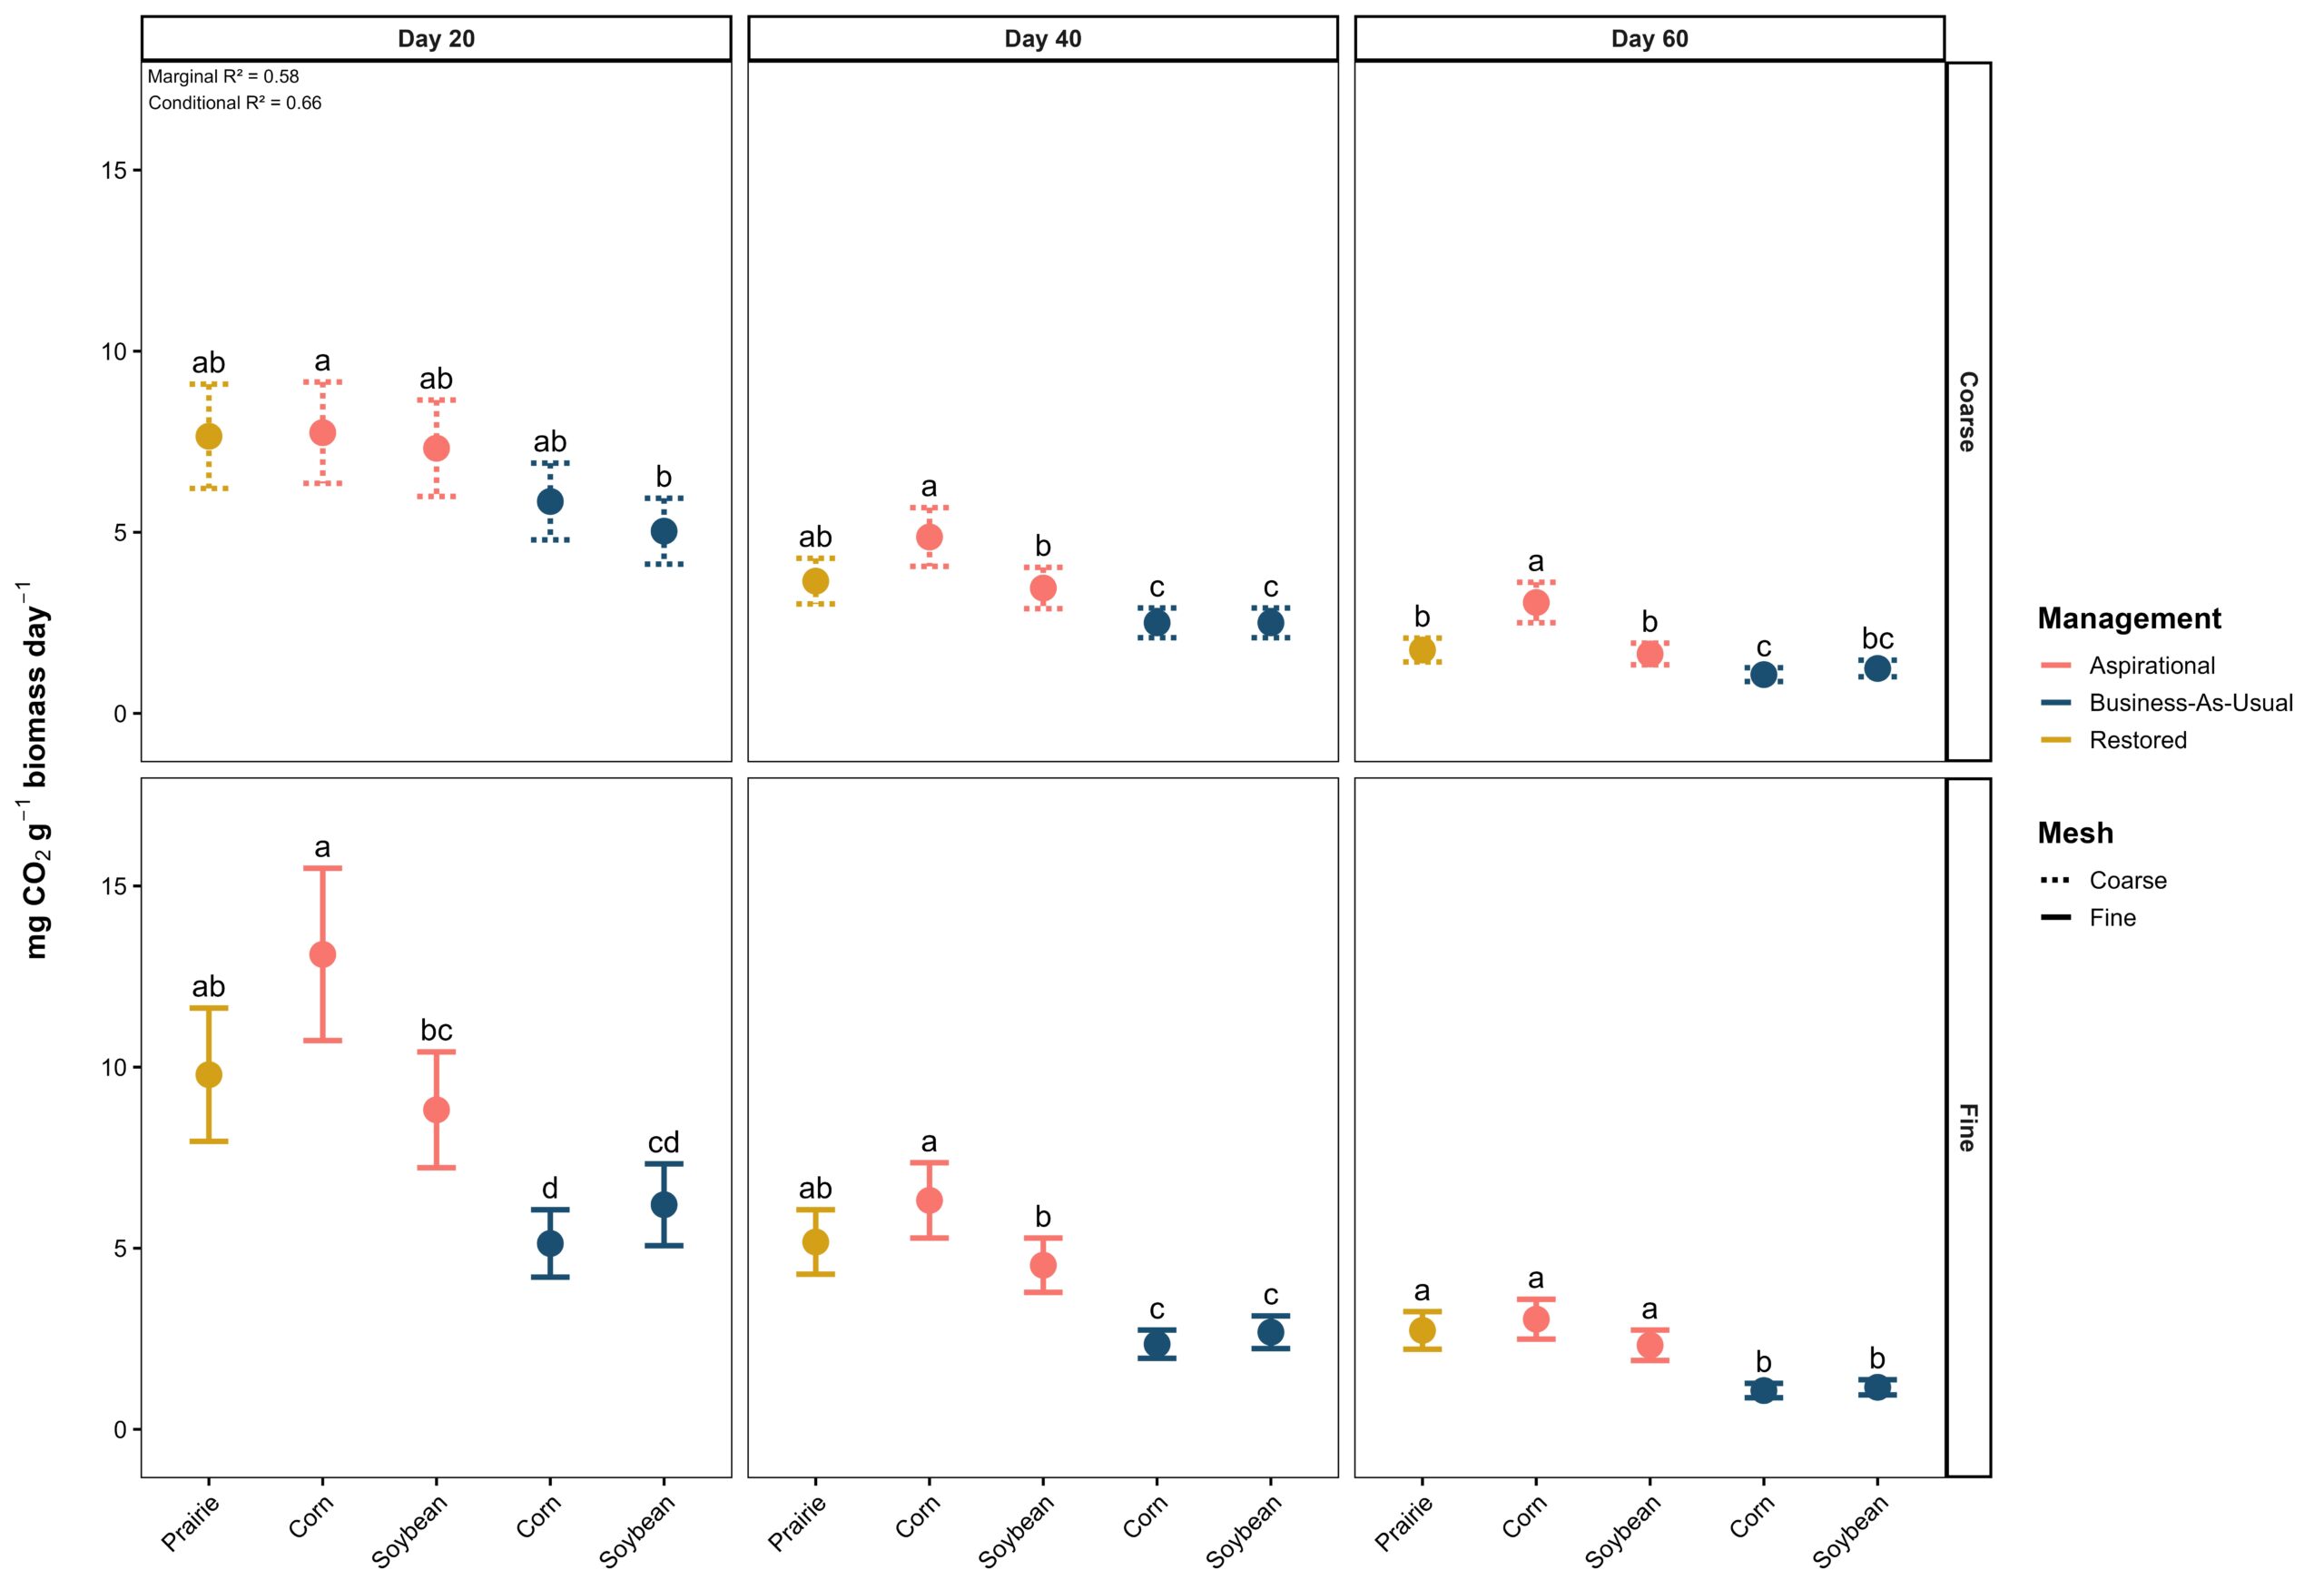
Figure 5. Mean microbial respiration potential (mg CO2 g-1 biomass day-1 ± standard error) from decomposing cover crop residue in fine- and coarse-mesh measured at 20, 40, and 60 days across aspirational, business-as-usual, and restored management systems. Letters indicate significant differences among groups within each panel. A significant three-way interaction among sampling date, crop, and mesh was observed (F4, 663 = 2.43, P < 0.05).
Total Carbon and Nitrogen
Echoing the mass loss, total nitrogen declined across all management systems, and mesh size had a strong impact over time (Figure 6). For nitrogen, significant two-way interactions were observed between sampling date and mesh size (F1, 675 = 201.40, P < 0.001) and between crop and mesh size (F4, 675 = 260.07, P = 0.003). The model explained 72% of the variance in nitrogen release (marginal R2 = 0.72; conditional R2 = 0.77). .
nitrogen release were consistently greater in coarse-mesh bags placed in the restored prairie and aspirational systems than in the business-as-usual systems. After 20 days, restored prairie (31.2 ± 3.5%) and aspirational soybean (29.1 ± 3.1%) retained the least nitrogen in the remaining residue, followed by aspirational corn (43.8 ± 4.6%), while business-as-usual corn (61.1 ± 6.5%) and soybean (63.8 ± 6.8%) retained the greatest amount of nitrogen. Carbon dynamics followed a similar trend, but system differences were weaker, with no significant differences between restored prairie and the aspirational systems. Fine-mesh bags retained substantially more carbon and nitrogen. At 20 days, remaining nitrogen ranged from 58.1–88.6%. Aspirational corn (59.1 ± 6.1%) was significantly lower than business-as-usual corn (88.6 ± 9.2%) but did not differ from the restored prairie (59.9 ± 6.8%). No significant differences were observed between soybean management systems. For carbon, the only significant difference observed was between the restored prairie (68.1 ± 6.3%) and business-as-usual corn (88.8 ± 7.9%).
Similar differences in remaining carbon and nitrogen persisted through days 40 and 60. By day 60, coarse-mesh bags in the restored prairie and aspirational systems retained only 19.1–21.2% of initial carbon and 9.8–14.6% of initial nitrogen, compared with 26.2–30.8% carbon and 20.0–23.4% nitrogen in the business-as-usual systems. The remaining nitrogen was lowest in the restored prairie and the aspirational soybean, followed by the aspirational corn, with both aspirational systems exhibiting significantly less total nitrogen than business-as-usual systems. The remaining carbon did not differ significantly between aspirational corn and soybean but did between business-as-usual corn and soybean. In fine-mesh bags, restored prairie and aspirational systems retained 40.3–50.5% of initial carbon and 42.6–59.6% of initial nitrogen, whereas business-as-usual corn and soybean systems retained 50.9–56.3% carbon and 61.4–69.5% nitrogen. The restored prairie retained significantly less carbon and nitrogen than the aspirational and business-as-usual systems, which did not differ significantly from one another.
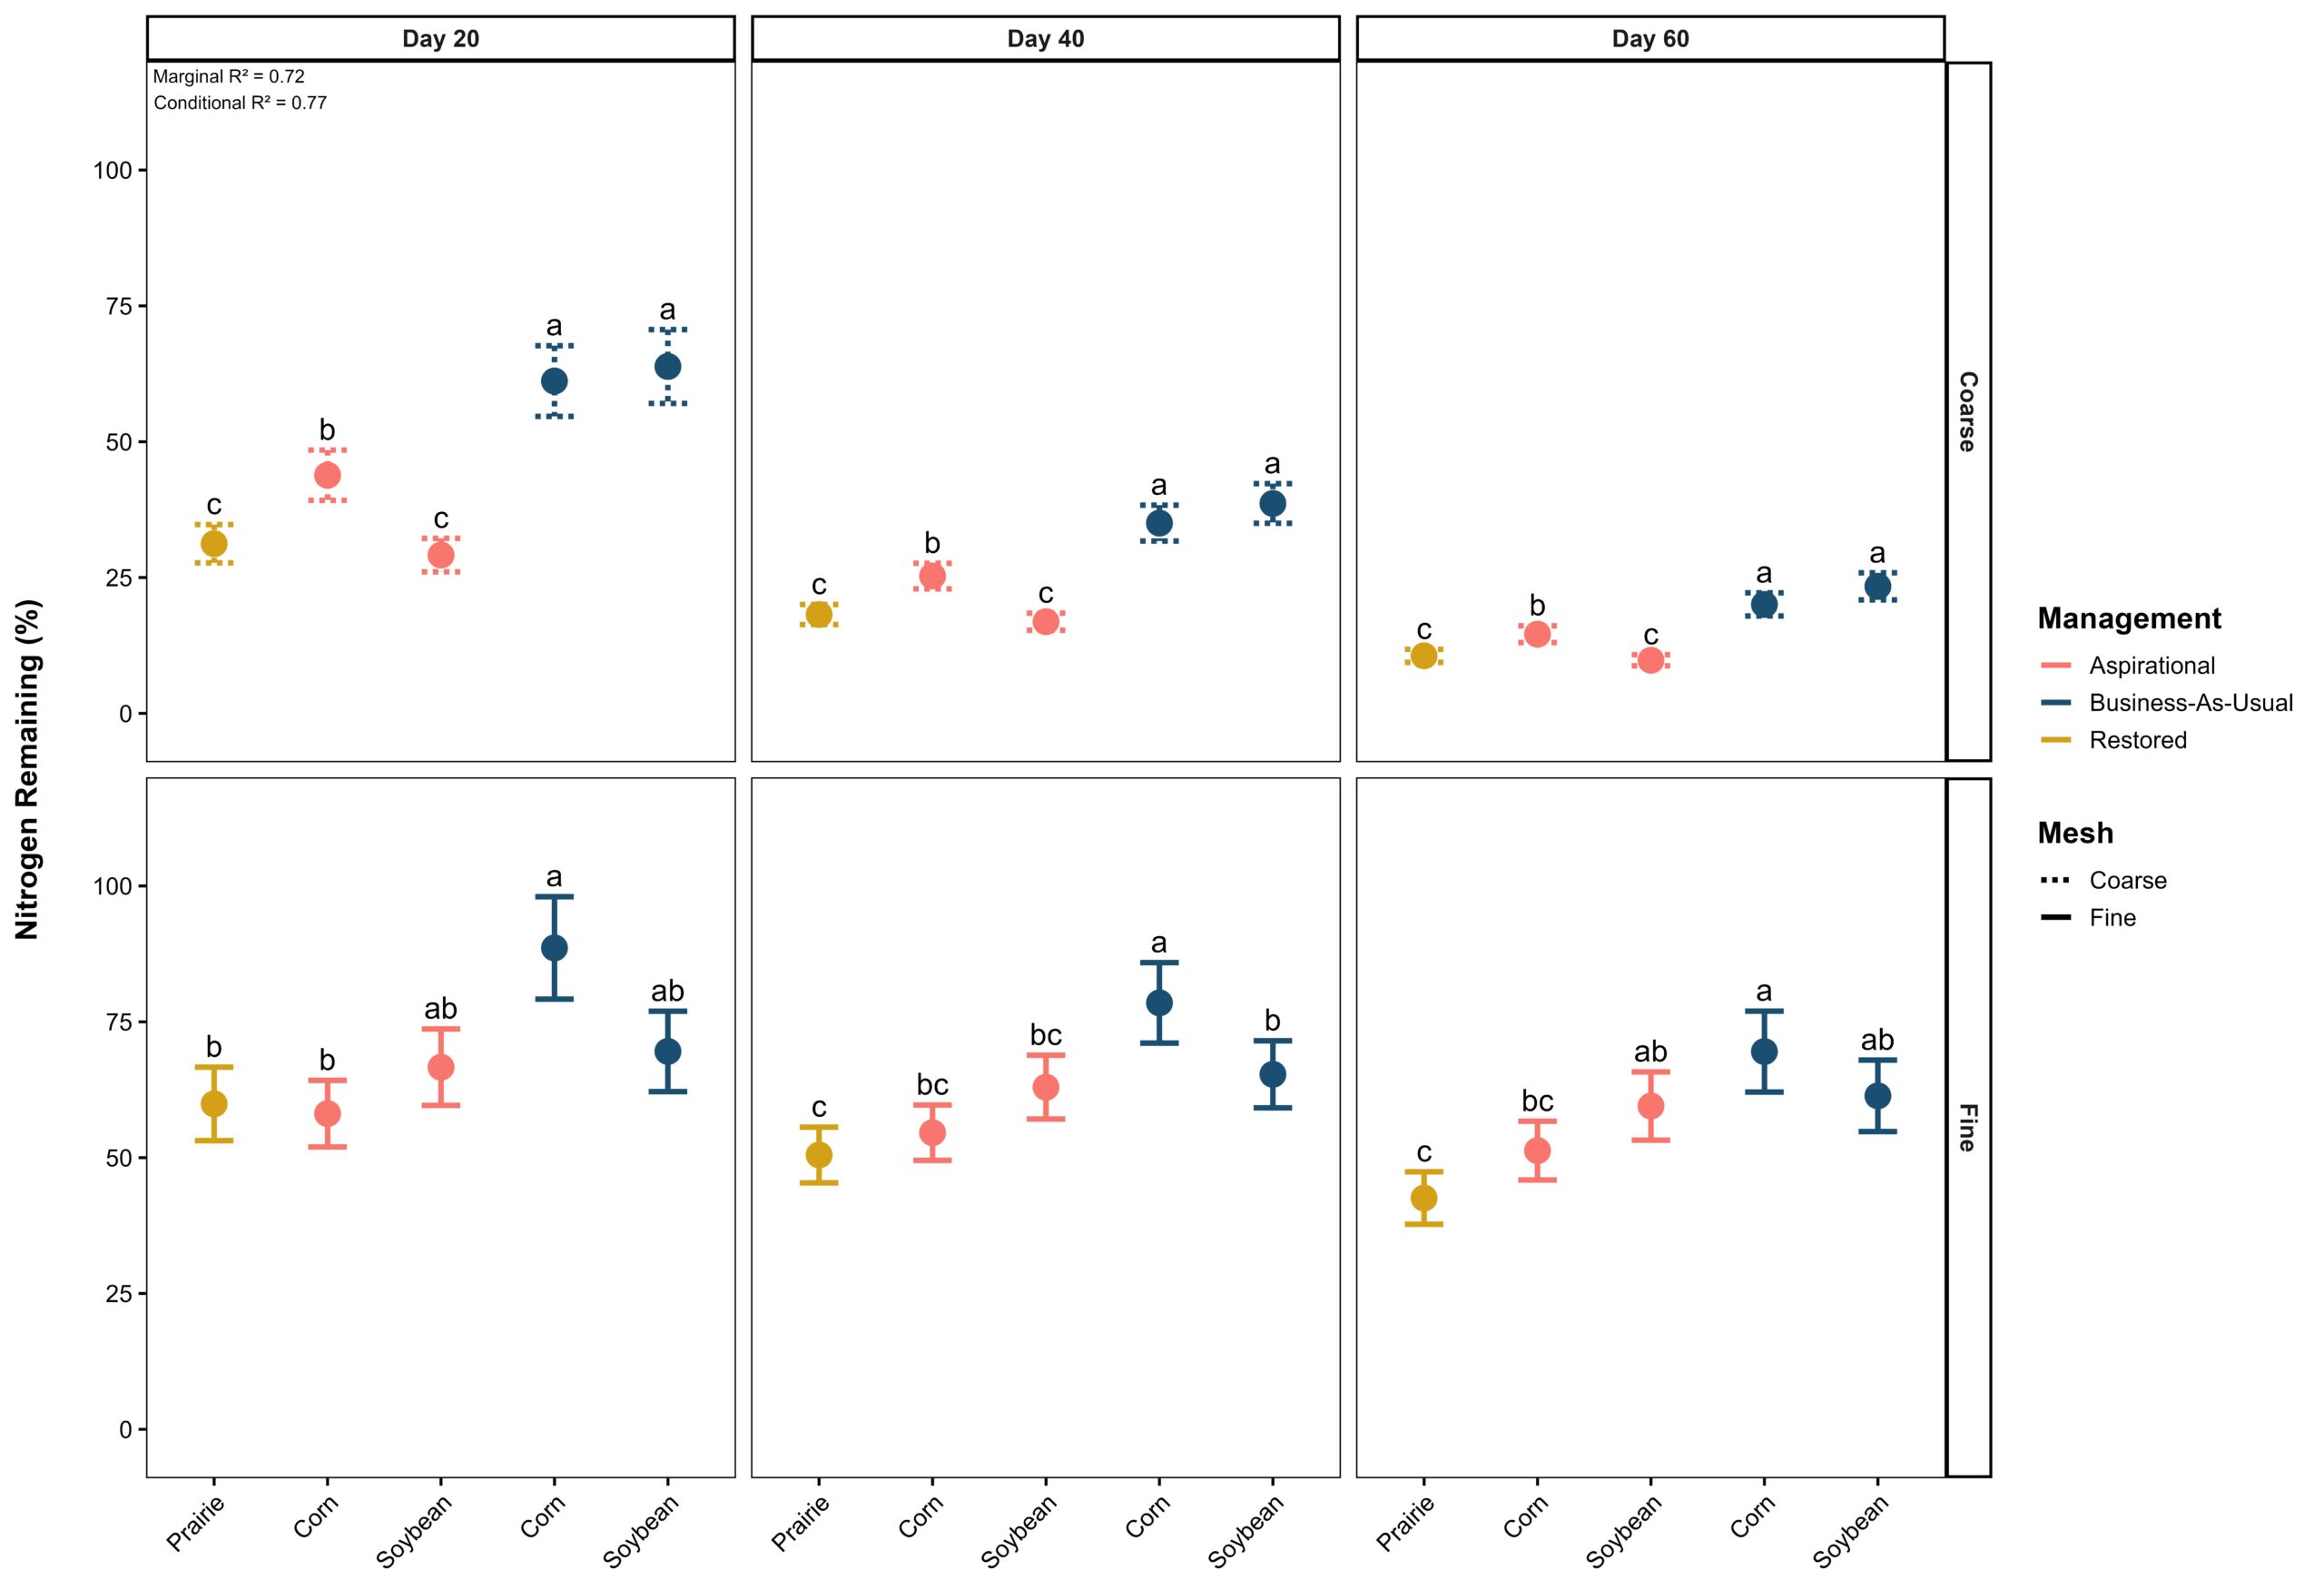
Figure 6. Mean proportion of nitrogen remaining (± standard error) in cover crop residue in fine- and coarse-mesh measured at 20, 40, and 60 days across aspirational, business-as-usual, and restored management systems. Letters indicate significant differences among groups within each panel. Significant two-way interactions were observed between sampling date and mesh (F1, 675 = 201.40, P < 0.001) and between crop and mesh (F4, 675 = 260.07, P = 0.003).
Diptera Biodiversity
During 2023 and 2024, a total of 88,716 flies from 70 families were collected across soil emergence and malaise traps, revealing distinct trophic composition between sampling approaches (Figure 7). Detritivores and herbivores dominated emergence trap communities, while malaise trap communities were primarily comprised of detritivores and nectarivores. Nearly half of all flies within the malaise trap community lacked an assignable trophic guild, driven primarily by Cecidomyiidae, Chironomidae, and Sciaridae.
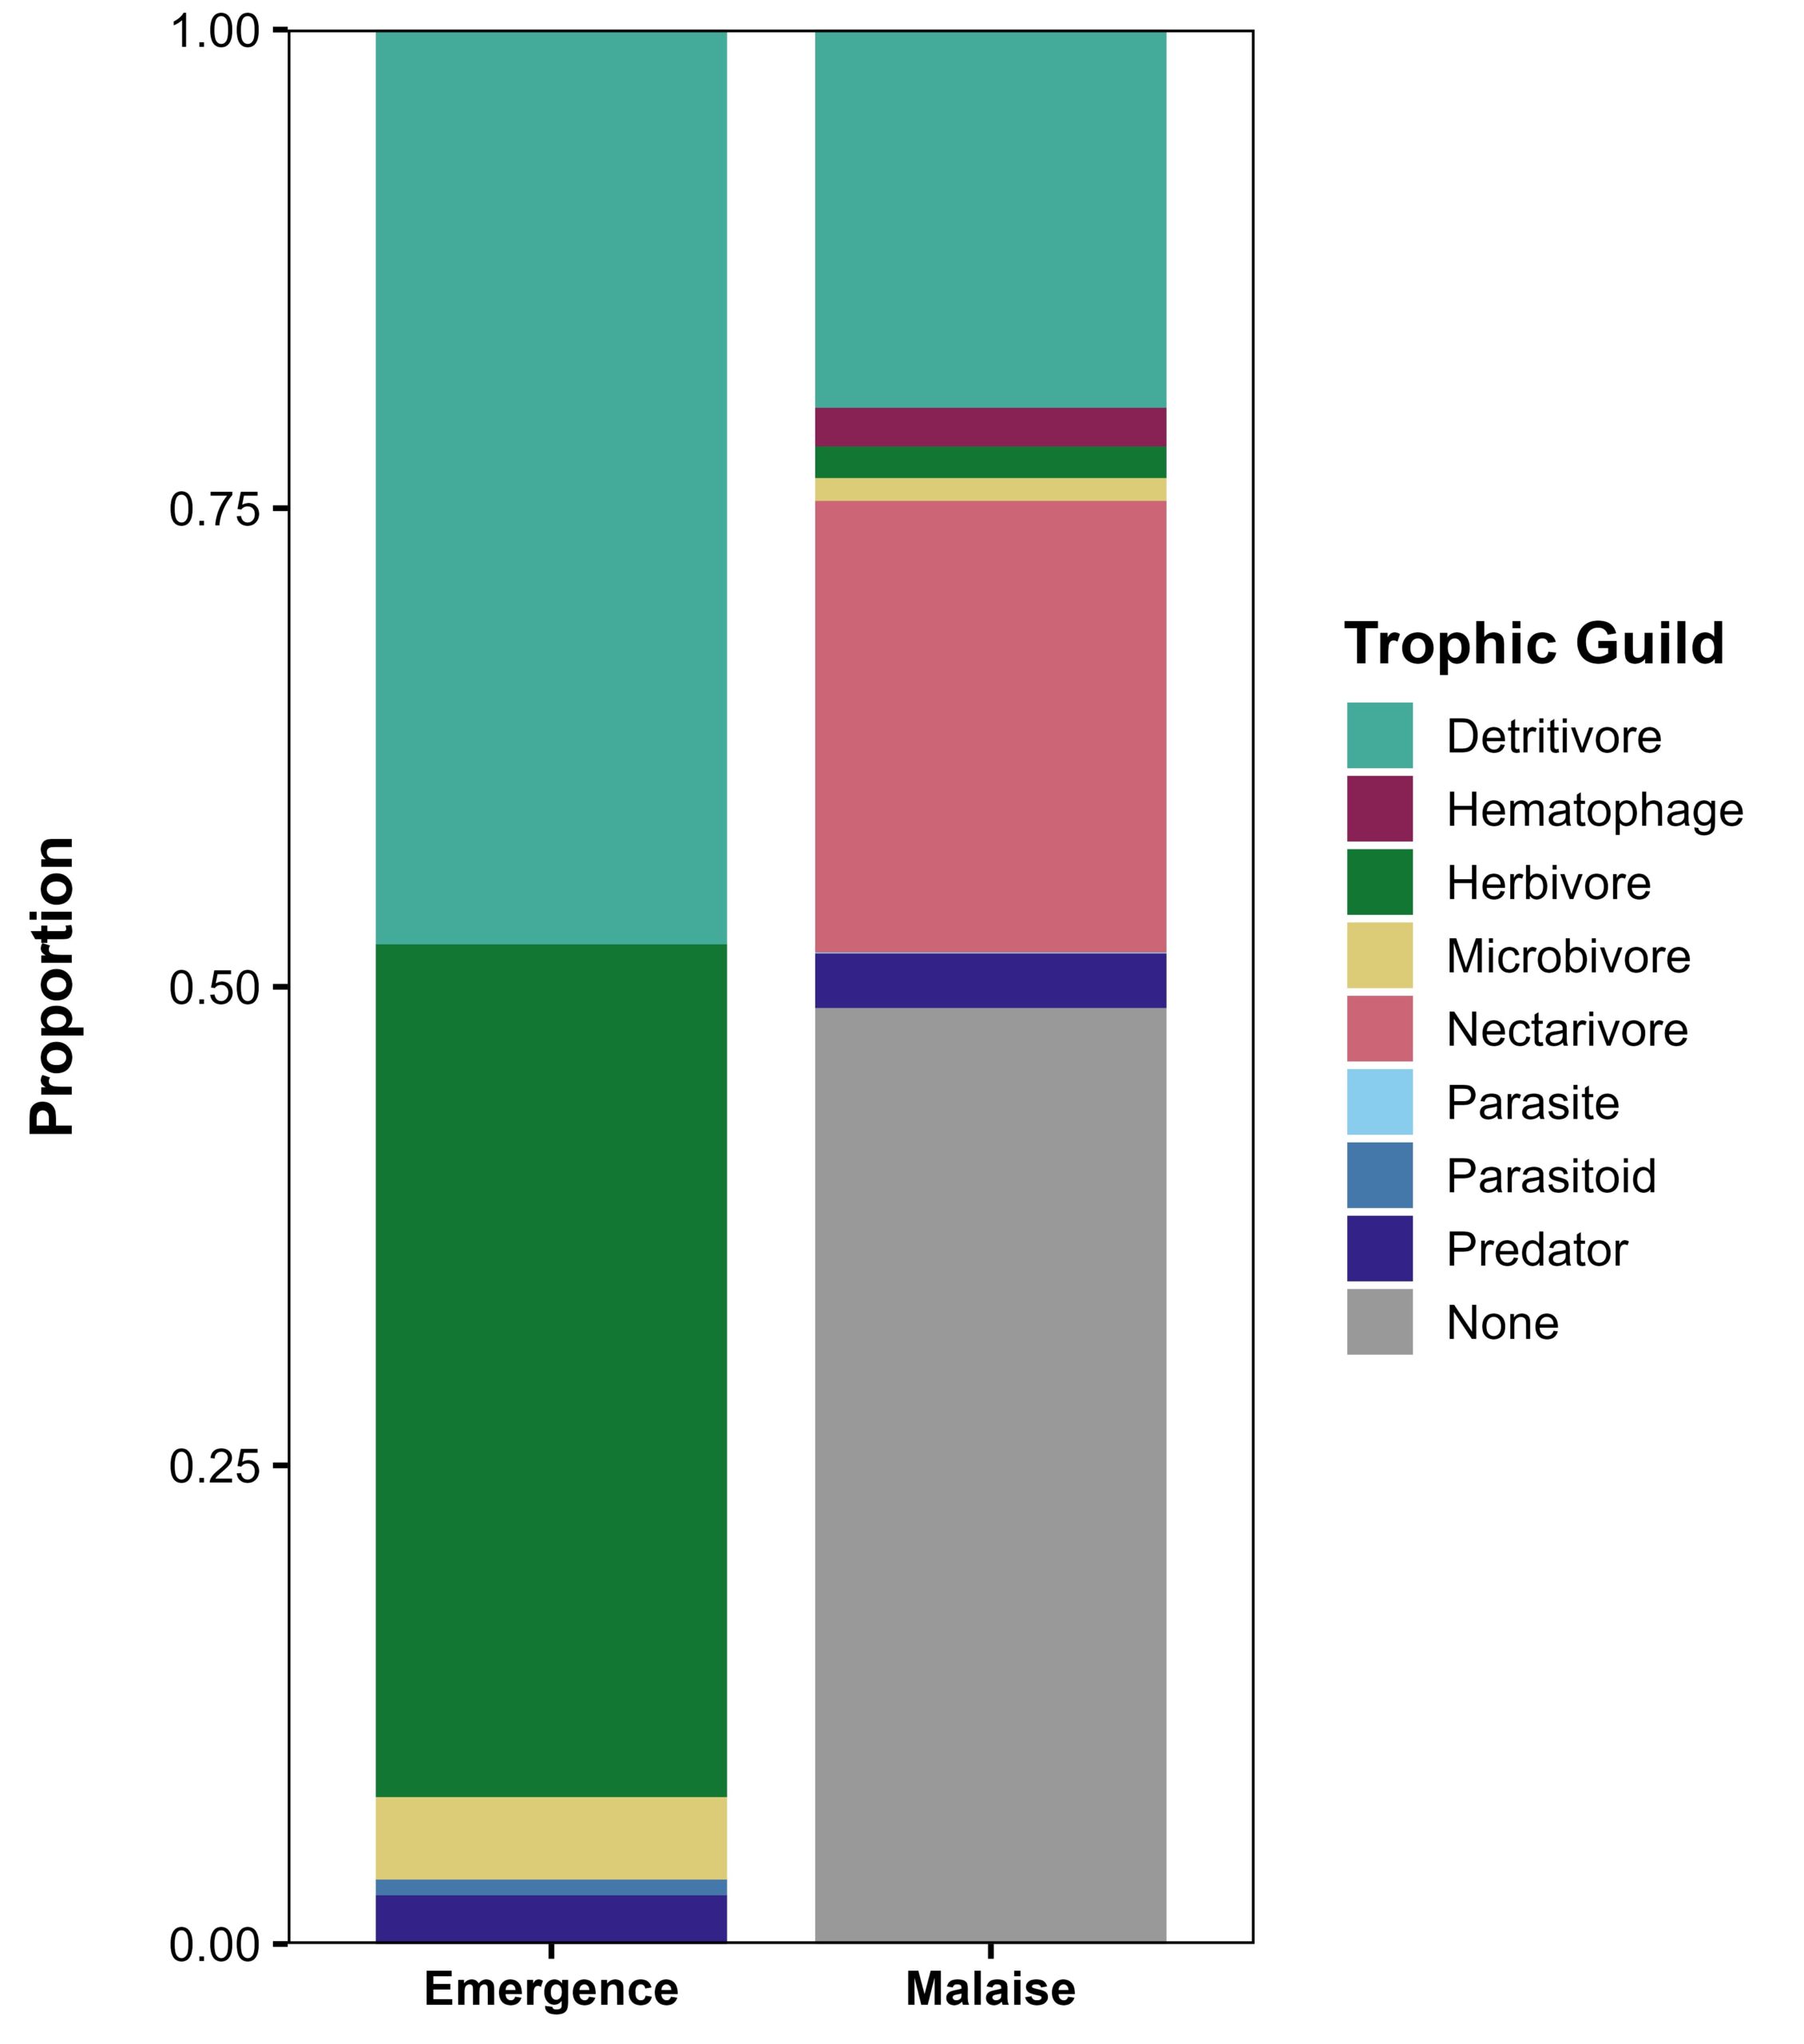
Figure 7. Relative Diptera trophic guild composition sampled using soil emergence and malaise traps in the Long-Term Agroecosystem Research (LTAR) Aspirational Cropping Systems Experiment (ACSE) during 2023–2024. Emergence—detritivore (47.8%), herbivore (44.6%), microbivore (4.3%), predator (2.5%), and parasitoid (0.8%). Malaise—nectarivore (23.6%), detritivore (19.8%), predator (2.8%), hematophage (2.0%), herbivore (1.6%), microbivore (1.2%), parasite (< 0.1%), and none (48.9%),
Multivariate GLMs revealed that the trophic guild composition of emergence trap communities was significantly affected by management system (Deviance = 213.25, df = 7, p = 0.001) and year (Deviance = 80.42, df = 1, p = 0.001), while block had no significant effect (Deviance = 11.44, df = 3, p = 0.777). Management system influenced all five trophic guilds: detritivores (Deviance = 60.00, p = 0.001), herbivores (Deviance = 51.25, p = 0.001), microbivores (Deviance = 31.60, p = 0.003), parasitoids (Deviance = 26.95, p = 0.004), and predators (Deviance = 52.46, p = 0.001). Malaise trap trophic guild composition was similarly affected by management system (Deviance = 173.34, df = 7, p = 0.001) and year (Deviance = 198.70, df = 1, p = 0.001), as well as block (Deviance = 43.06, df = 3, p = 0.036). At the guild level, management system influenced detritivores (Deviance = 29.03, p = 0.005), microbivores (Deviance = 48.16, p = 0.001), nectarivores (Deviance = 38.57, p = 0.002), but not hematophages (Deviance = 12.54, p = 0.337), herbivores (Deviance = 15.05, p = 0.315), parasites (Deviance = 14.06, p = 0.337), or predators (Deviance = 15.94, p = 0.304).
Univariate GLMMs confirmed that management system significantly affected the abundance of all trophic guilds in the emergence trap communities: detritivores (χ² = 77.90, df = 7, p < 0.001), herbivores (χ² = 81.49, df = 7, p < 0.001), microbivores (χ² = 34.54, df = 7, p < 0.001), parasitoids (χ² = 35.55, df = 7, p < 0.001), and predators (χ² = 59.98, df = 7, p < 0.001; Figure 8). Detritivores were significantly more abundant in all the aspirational systems except for aspirational forage compared to the restored prairie (1.7–2.2× increase), and only lower in business-as-usual corn (54.8% decrease). Herbivore abundance was only lower than the restored prairie in business-as-usual corn (73.3% decrease), with no other management systems differing significantly. Microbivores were more abundant in aspirational corn, aspirational wheat, aspirational canola, and business-as-usual soybean (5.6–8.6×). Parasitoids were consistently less abundant across all aspirational and business-as-usual (72.7–90.9% decrease) management systems. Predator abundance was higher in aspirational corn, aspirational canola, and business-as-usual soybean (2.6–3.6× increase).
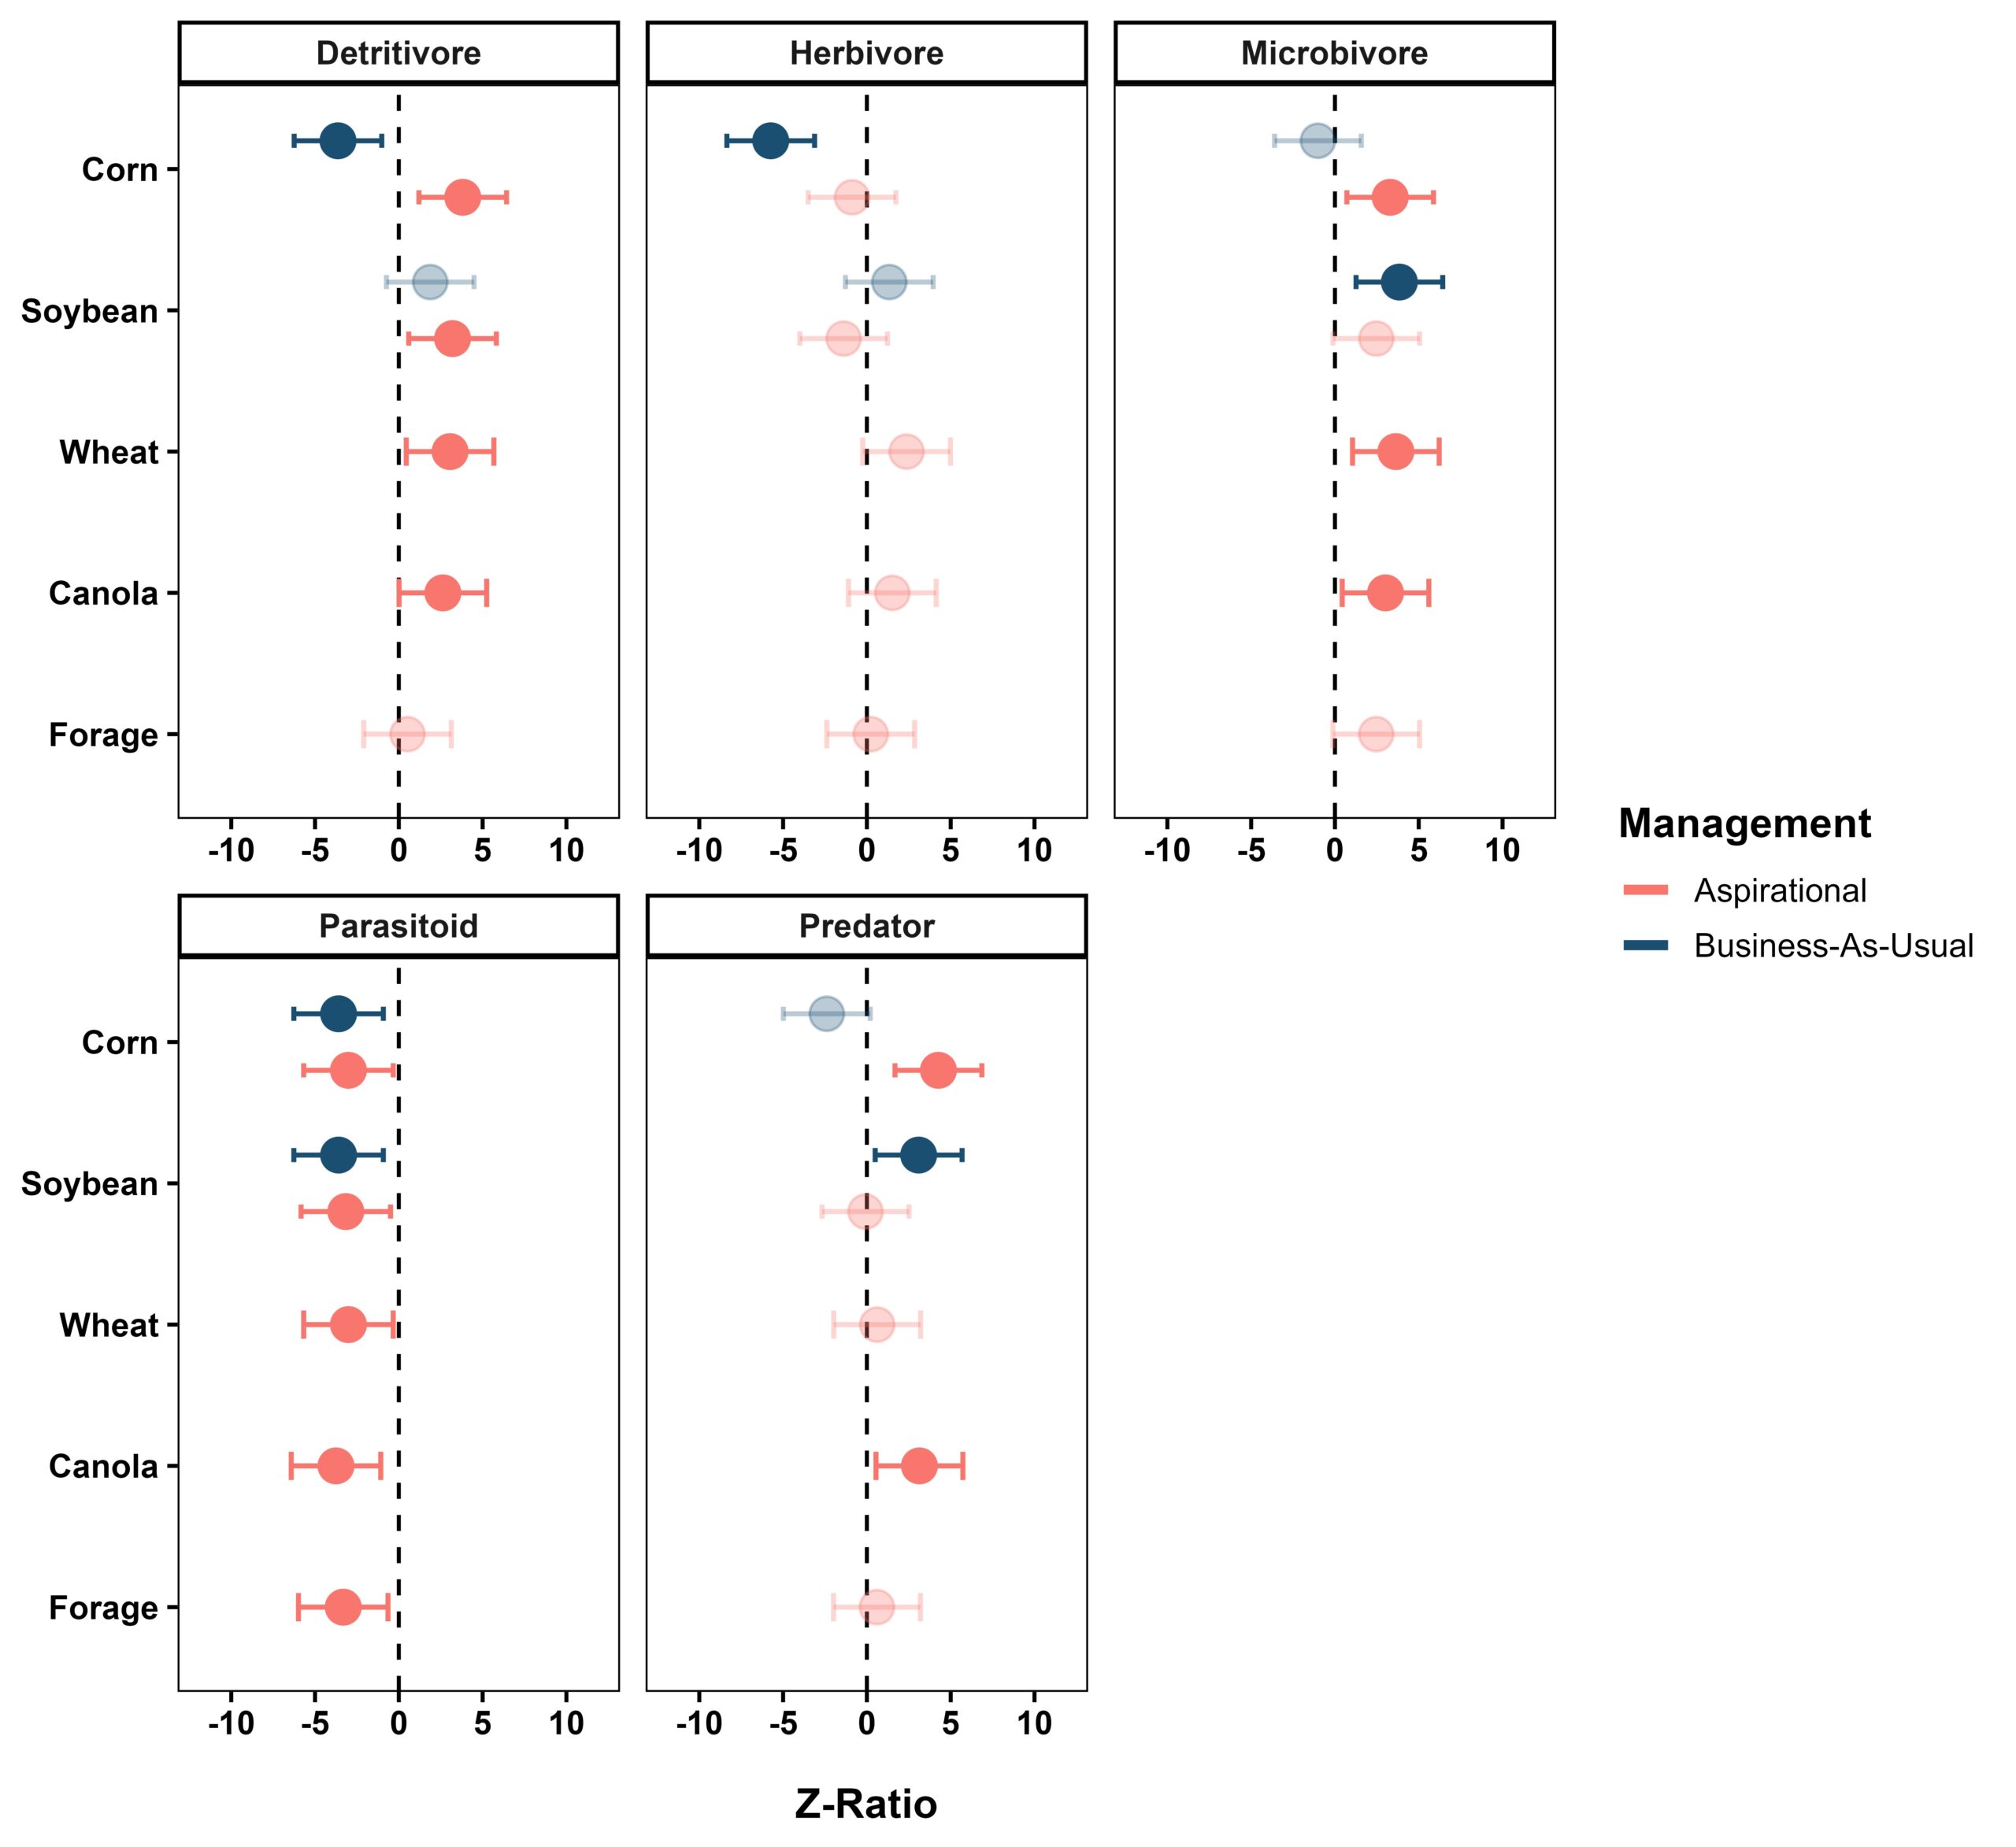
Figure 8. Pairwise contrasts (± 95% confidence intervals) of aspirational and business-as-usual management systems relative to the restored prairie for each significant trophic guild in emergence trap communities: detritivores (χ² = 77.90, df = 7, p < 0.001), herbivores (χ² = 81.49, df = 7, p < 0.001), microbivores (χ² = 34.54, df = 7, p < 0.001), parasitoids (χ² = 35.55, df = 7, p < 0.001), and predators (χ² = 59.98, df = 7, p < 0.001). Points represent estimated marginal contrasts for each management system; values greater than zero indicate higher abundance than the restored prairie, and values less than zero indicate lower abundance. Solid points denote significant differences.
Similarly, univariate GLMMs also corroborated that the management system significantly influenced detritivore (χ² = 35.43, df = 7, p < 0.001), microbivore (χ² = 65.91, df = 7, p < 0.001), and nectarivore (χ² = 47.68, df = 7, p < 0.001) abundance in malaise trap communities (Figure 9). Detritivore abundance was significantly higher in aspirational corn, aspirational soybean, aspirational forage, business-as-usual corn , and business-as-usual soybean than in the restored prairie (1.5–1.6× increase). Microbivores were more abundant in nearly every aspirational corn, aspirational wheat, and aspirational forage as well as business-as-usual corn and business-as-usual soybean (2.4–6.2× increase). Nectarivore abundance was higher in aspirational corn, aspirational canola, aspirational forage, and business-as-usual corn (1.4–1.9× increase).
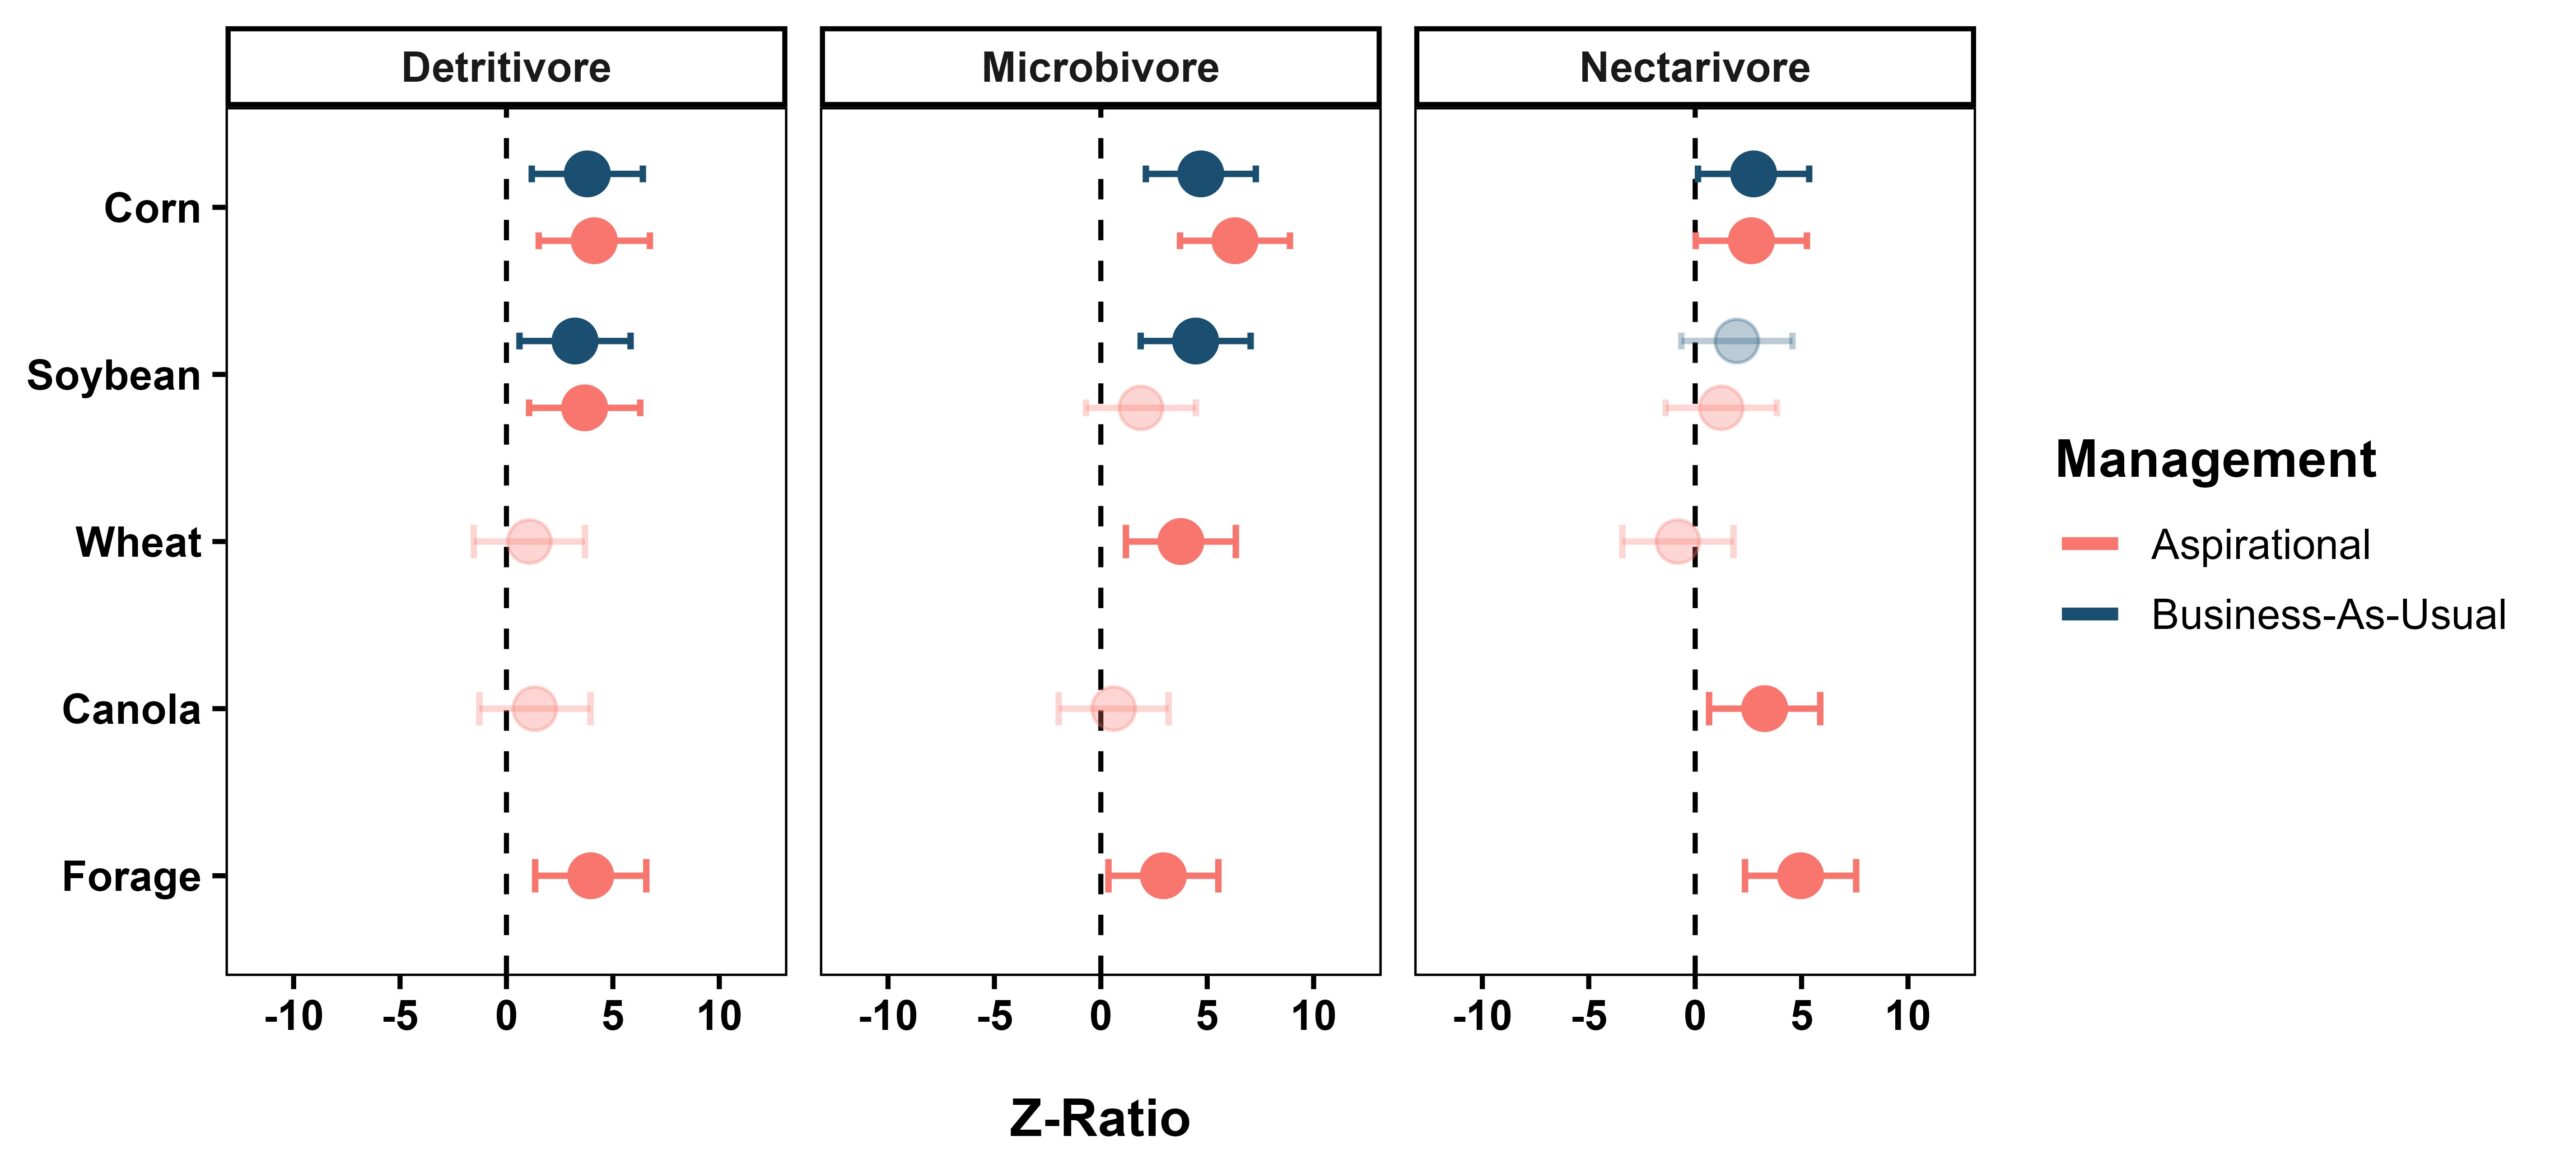
Figure 9. Pairwise contrasts (± 95% confidence intervals) of aspirational and business-as-usual management systems relative to the restored prairie for each significant trophic guild in malaise trap communities: detritivores (χ² = 35.43, df = 7, p < 0.001), microbivores (χ² = 65.91, df = 7, p < 0.001), and nectarivores (χ² = 47.68, df = 7, p < 0.001) . Points represent estimated marginal contrasts for each management system; values greater than zero indicate higher abundance than the restored prairie, and values less than zero indicate lower abundance. Solid points denote significant differences.
Detritivore phenology varied significantly across management systems throughout the growing season in emergence trap communities (χ² = 87.74, df = 28, p < 0.001), with differences most pronounced from May through August and dissipating by September (Figure 10). Business-as-usual corn consistently harbored the fewest detritivores each month. Early in the season, aspirational corn and aspirational wheat had the greatest detritivore activity (33.2 ± 12.6 and 32.2 ± 12.3, respectively), outpacing all other management systems (5.9–10.0) except aspirational canola (14.0 ± 5.4). Aspirational corn retained the highest abundance into June (30.9 ± 11.8), with aspirational soybean also increasing in activity (20.7 ± 7.9), while aspirational wheat (19.3 ± 7.4) was only greater than the restored prairie (5.49 ± 2.2) and business-as-usual corn (3.8 ± 1.6). By July, business-as-usual soybean increased to support the greatest detritivore abundance (25.7 ± 9.8), exceeding the restored prairie (8.2 ± 3.3) and business-as-usual corn (4.6 ± 1.9). Peak August abundance shifted to aspirational canola and aspirational soybean (25.5 ± 9.7 and 23.8 ± 9.1, respectively), while business-as-usual corn remained the lowest (3.0 ± 1.3). By September, differences among management systems were subtler, with only business-as-usual (2.5 ± 1.2) remaining lower than the restored prairie (10.7 ± 4.2) and aspirational soybean (13.1 ± 5.1).
Herbivore phenology followed a broadly similar seasonal trend, though with some notable differences in which management systems stood out each month (χ² = 81.76, df = 28, p < 0.001). As with detritivores, herbivores were consistently less abundant in business-as-usual throughout the season. Aspirational wheat drove the strongest early-season signal (35.2 ± 14.0), supporting higher herbivore abundance than aspirational soybean (5.0 ± 2.1), aspirational forage (7.6 ± 3.2), business-as-usual corn (4.1 ± 1.8), and business-as-usual soybean (6.8 ± 2.8). Aspirational wheat retained the highest abundance into June (24.4 ± 9.7), though the gap among systems narrowed considerably, with only aspirational soybean (6.1 ± 2.6) and business-as-usual corn (2.2 ± 1.0) remaining lower. A shift occurred in July, when business-as-usual soybean rose to the highest herbivore abundance (39.9 ± 15.8), exceeding aspirational corn (11.2 ± 4.6) and business-as-usual corn (5.9 ± 2.5). In August, aspirational canola (31.6 ± 12.5) and aspirational forage (23.3 ± 9.3) became the most abundant systems, while aspirational corn (3.3 ± 1.5) and business-as-usual corn (2.5 ± 1.2) remained the least abundant again. By September, herbivore abundances declined substantially across all systems, with only business-as-usual corn (0.4 ± 0.3) remaining lower than aspirational wheat (5.0 ± 2.1) and aspirational corn (4.1 ± 1.8).
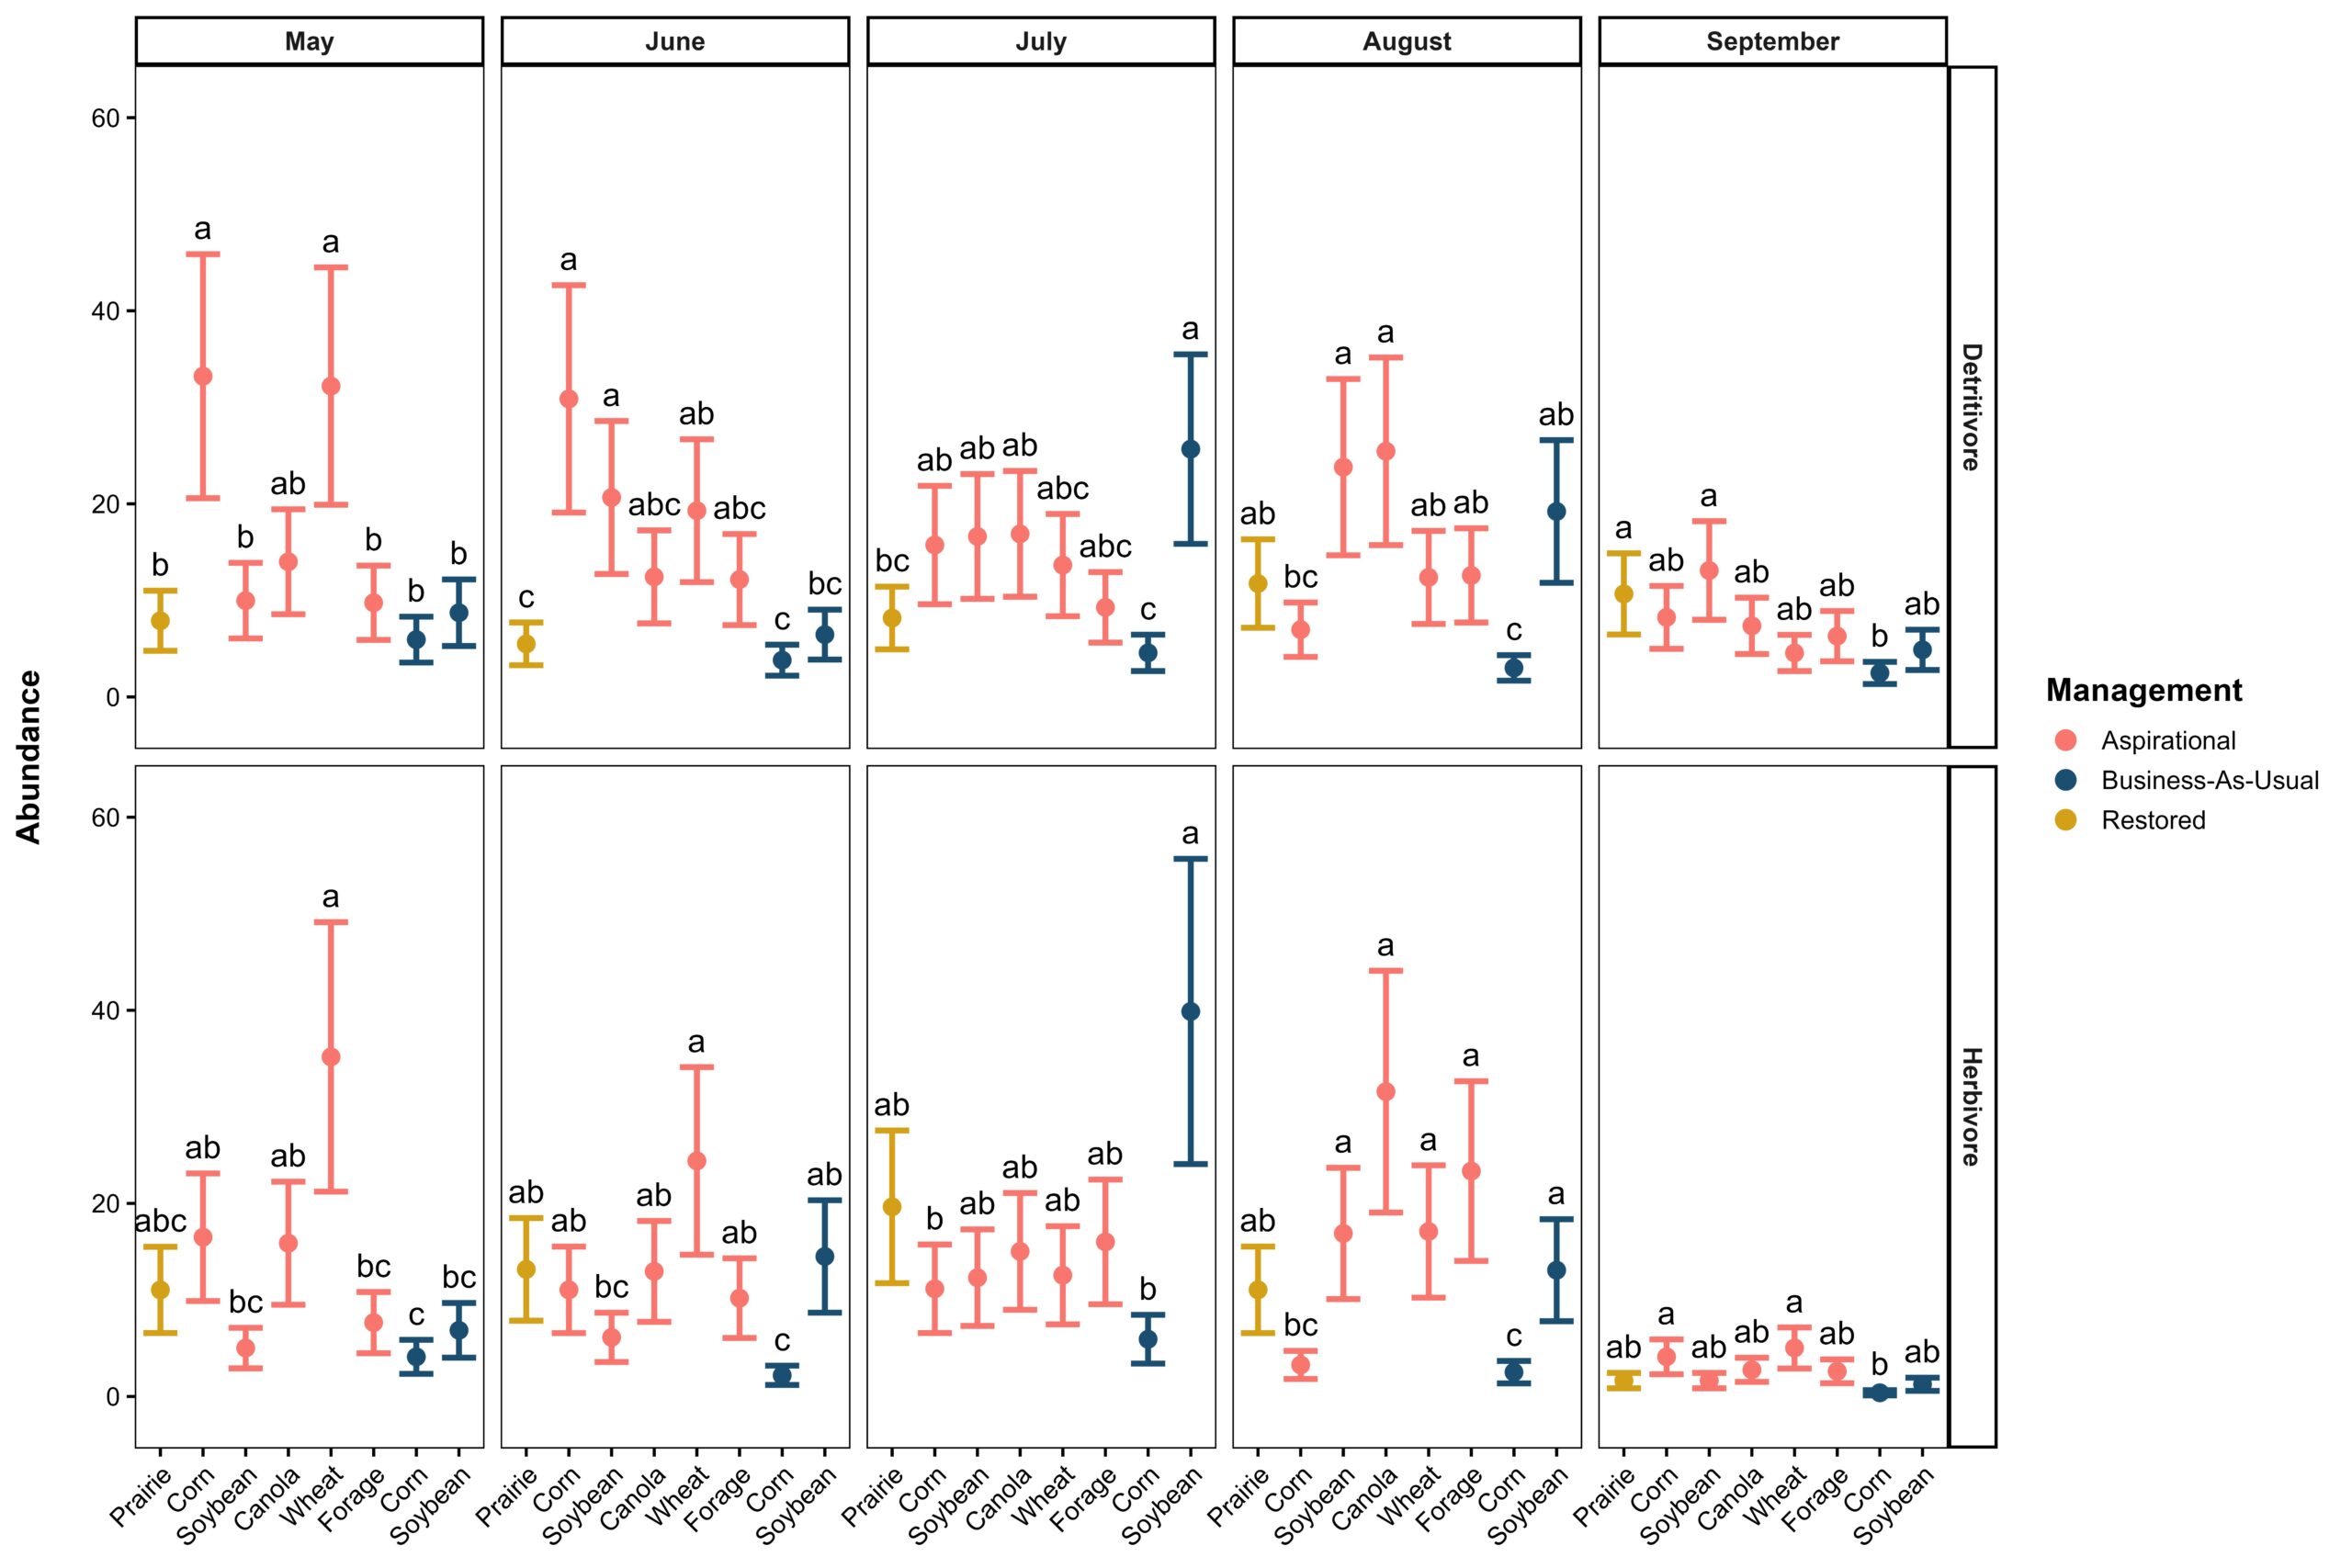
Figure 10. Estimated marginal means (± standard error) of detritivore and herbivore abundance in emergence trap communities across aspirational, business-as-usual, and restored prairie management systems from May through September. Letters indicate significant differences among groups within each panel. Detritivore (χ² = 87.74, df = 28, p < 0.001) and herbivore (χ² = 81.76, df = 28, p < 0.001) abundance were significantly affected by management system.
Detritivore phenology also varied significantly across management systems throughout the growing season in malaise trap communities (χ² = 50.15, df = 28, p = 0.006), though differentiation among systems was considerably weaker than in emergence traps (Figure 11). Aspirational corn had the greatest abundance early in the season (50.9 ± 16.3) but only exceeded aspirational wheat (18.5 ± 6.0) and the restored prairie (15.7 ± 5.1) in May. Business-as-usual soybean surged in abundance in June (96.4 ± 30.6), well above aspirational wheat (36.8 ± 11.8) and aspiration canola (29.3 ± 9.4), while remaining indistinguishable from all other systems. Differences in detritivore abundance among management systems effectively disappeared from July through August.
Nectarivore phenology exhibited a markedly stronger response among management systems throughout the season (χ² = 1446.69, df = 28, p < 0.001). In May, aspirational corn supported the greatest nectarivore abundance (147.7 ± 11.7), more than all other management systems. Restored prairie (68.2 ± 5.8), aspirational canola (58.4 ± 5.1), and aspirational wheat (52.6 ± 4.6) contained the fewest nectarivores. Aspirational forage led nectarivore abundance in June (115.7 ± 9.3), well above aspirational wheat (51.8 ± 4.6), which remained the lowest. By July, aspirational forage, business-as-usual corn, and aspirational canola converged with the highest abundance (93.9 ± 7.7, 92.8 ± 7.6, and 91.2 ± 7.5, respectively). August brought a prominent reversal, and aspirational canola abundance was greater than every other management system (89.9 ± 7.4) and aspirational corn fell to the lowest (16.7 ± 1.9). Through September, nectarivore activity declined broadly but aspirational forage and aspirational wheat retaining the highest abundances (18.6 ± 2.1 each) and business-as-usual soybean finishing the season lowest (5.1 ± 0.9).
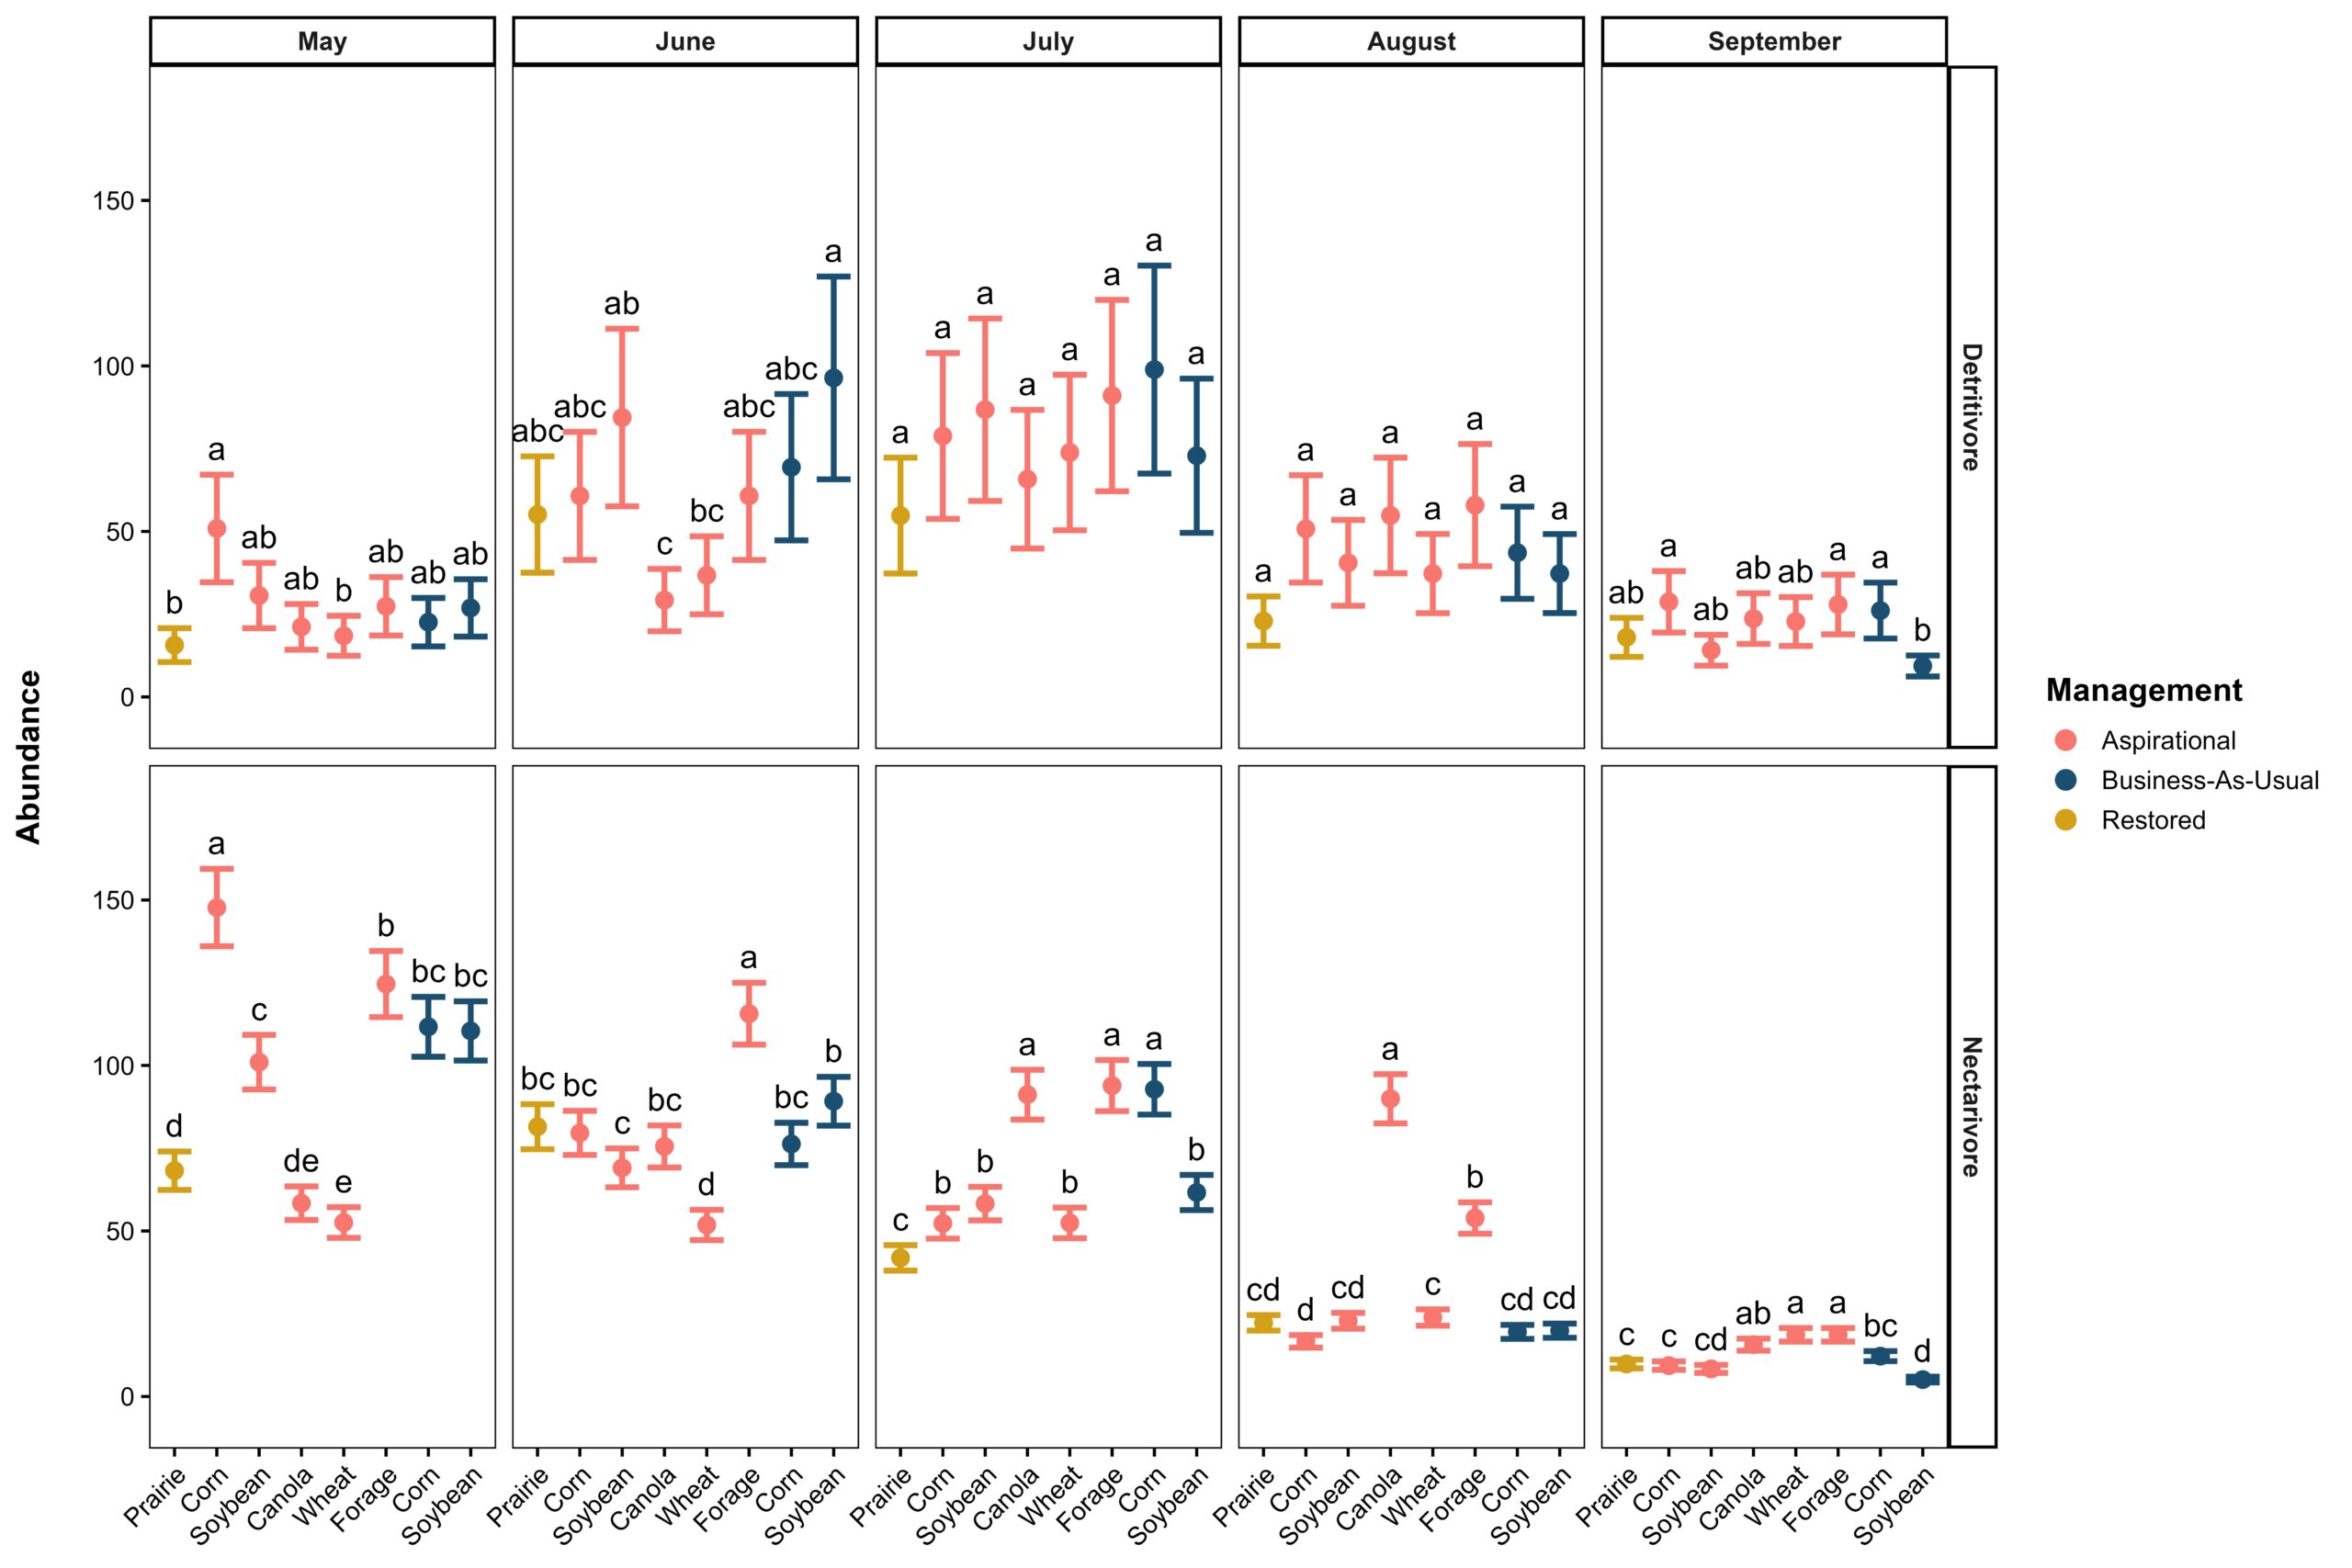
Figure 11. Estimated marginal means (± standard error) of detritivore and nectarivore abundance in malaise trap communities across aspirational, business-as-usual, and restored prairie management systems from May through September. Letters indicate significant differences among groups within each panel. Detritivore (χ² = 50.15, df = 28, p = 0.006) and (χ² = 1446.69, df = 28, p < 0.001) abundance were significantly affected by management system.
Discussion
Integrating soil health practices into a sustainably intensified cropping system increased decomposition, microbial functional capacity, and nutrient release relative to conventional management. After only two to three years of establishment, aspirational systems approached the level of ecosystem functioning observed in a restored prairie, suggesting that management diversification can restore ecological processes often attenuated by conventional agricultural intensification. More importantly, these findings indicate that agricultural management influences not only the rate of cover crop decomposition but also reorganizes the mechanistic structure of the detrital food web. Synergistic above- and belowground interactions can enhance ecosystem function in intensively managed agroecosystems (Giller et al., 1997), but these interactions emerge from an intricate detrital food web constrained by environmental conditions.
Multi-Trophic Effects on Decomposition
The conventional cover crop decomposition model frames residue turnover primarily as a function of substrate quality and environmental conditions, while multi-trophic interactions between microorganisms and soil fauna often overlooked or left unevaluated (Thapa et al., 2022; Adhikari et al. 2024). The initial quality of cover crop residue, expressed as the C:N ratio, was 18.8 in 2024 and 22.2 in 2025. Based on these values, predicted decomposition constants (k) in a no-till agronomic system with soil faunal exclusion range from 0.014 to 0.015 ( ; Thapa et al., 2022). The similarity between these predicted and observed decomposition rates from fine-mesh litterbags in the restored prairie and aspirational systems suggests that these systems exhibit the expected functional capacity given substrate quality (Table 3). In contrast, decomposition rates in the business-as-usual systems were substantially lower than predicted, falling below even the minimum reported by Thapa et al. (2022). Because the fine mesh excluded mesofauna and macrofauna, this discrepancy is most parsimoniously attributed to differences in microbial communities, consistent with the lower microbial respiration potential observed in business-as-usual systems.
Notably, decomposition constants from the coarse-mesh litterbags told a different story: values in business-as-usual systems converged toward predicted levels, while those in the restored prairie and aspirational systems were considerably higher than expected. This pattern suggests where conventional management suppresses microbial-mediated decomposition, soil fauna may partially compensate by assuming an expanded role in residue turnover. A key implication is that faunal access further homogenized decomposition rates across systems, narrowing the differences observed under fine-mesh exclusion. While microbial communities are often depicted as the foundation of the detrital food web (Hendrix et al., 1986), these results suggest that soil fauna act as a independent driver of residue decomposition rather than simply amplifying microbial functional capacity.
Managing Residue for Nutrient Efficiency
The agronomic value of decomposition depends in part on synchronizing nutrient release with crop demand (Drinkwater & Snapp 2007). Therefore, differences in decomposition have direct implications for nutrient-use efficiency. Contrary to our findings, previous studies have reported that reduced or conventional tillage practices—such as double disking—either have no effect on decomposition rates or accelerate them (Lupwayi et al., 2004; Poffenbarger et al., 2015; Singh et al., 2020). However, comparisons between no-till and tilled systems are complicated by residue incorporation, which accelerates decomposition by placing residue within the soil profile (Jahanzad et al., 2016; Sievers & Cook, 2018). While residue incorporation reflects common agricultural practice, it also introduces a confounding factor that obscures the effect of management on ecosystem function. By standardizing residue placement on the soil surface, we were able to isolate the influence of management on decomposition dynamics.
Approximately 50% of cumulative nitrogen uptake in corn occurs between the V8 and VT growth stages, while sidedress nitrogen applications typically target V6 (Bender et al., 2013). Relative to this timeline, when faunal access was permitted, residue in aspirational corn release 45% more nitrogen by V6 (20 days), and 7% more by VT (60 days) than business-as-usual corn. The narrowing of this difference by VT might suggest nitrogen release becomes comparable between systems over time; however, nitrogen release does not equate to plant uptake, which itself depends on the detrital food web. Microbial communities, rather than soil fauna, mineralize nitrogen (Hopkins & Dungait, 2010). Soil fauna, in fact, consume residue while in competition with microbial decomposers. By excluding mesofauna and macrofauna using fine-mesh litterbags, we were able to isolate decomposition mediated by microbial activity. Under faunal-exclusion, residue in aspirational corn released 268% more nitrogen by V6 (~20 days), and 60% more by VT (~60 days) than in business-as-usual corn. This larger divergence may more accurately reflect differences in nitrogen mineralization between systems and is consistent with higher microbial respiration potential in aspirational corn relative to business-as-usual corn. Even so, real system dynamics do not occur in isolation from soil fauna, and the relative contributions of fauna versus microbes to nitrogen release in the field remain unclear.
Trophic Complexity and Ecosystem Function
Biodiversity-ecosystem function theory predicts that increasing trophic complexity produces correspondingly complex ecosystem properties (Loreau et al., 2001; Hooper et al., 2005). Our results offer partial support for this prediction, though trophic complexity also made it more difficult to disentangle the relative contributions of soil fauna and microbial communities to decomposition. Coarse-mesh exclusion did not allow us to isolate whether faunal effects on decomposition operated directly, through physical fragmentation and ingestion of litter, or indirectly, by altering the microbial communities responsible for residue turnover. Once soil fauna were granted access, decomposition reflected the combined output of faunal processing and microbial activity, and these pathways could not be readily distinguished. This is further complicated by the observation that the influence of fauna on microbial activity appeared context dependent. Employing complementary approaches that monitor energy flux through soil fauna and microbial communities under exclusion using stable isotopes is necessary to address ongoing priorities for research on soil biodiversity and ecosystem functioning (Eisenhauer et al., 2026).
Decoupling Realized Activity from Functional Capacity in Microbial Communities
Realized microbial respiration was primarily driven by moisture content rather than management. Across systems, respiration increased with moisture content, with aspirational corn exhibiting the strongest positive relationship, likely reflecting the addition of organic amendments, which have been shown to increase crop yields by 27% because of microbial function (Luo et al., 2018). Soil moisture strongly regulates microbial metabolism because water availability governs substrate diffusion, nutrient transport, and microbial access to decomposable carbon sources. The dominant role of moisture observed here is consistent with previous studies identifying water availability as a primary control on soil respiration and decomposition (Orchard & Cook, 1983; Thapa et al., 2022). Given that ambient moisture inherently constrains realized respiration, we also measured respiration potential by saturating litter. In contrast to realized respiration, microbial respiration potential significantly differed among management systems. Aspirational and restored systems exhibited higher respiration potential than business-as-usual systems. These result suggest management either increases abundance or metabolic capacity of microbial communities, but this capacity may not be expressed under dry field conditions. Respiration potential also declined over time across all systems, likely reflecting progressive depletion of labile carbon pools during decomposition (de Graaff et al., 2010). Early decomposition is typically characterized by rapid consumption of readily available substrates, whereas later stages increasingly involve more recalcitrant compounds requiring greater energetic investment to decompose. This temporal decline suggests that the management-driven differences in respiration potential observed early in decomposition may narrow as the labile carbon pool is depleted across all systems, regardless of management.
Restoring Function to Production Systems
Restoration of agricultural land to native habitat is increasingly promoted as an alternative to agricultural production (Rey Benayas & Bullock, 2012), offering benefits such as increased biodiversity and enhanced provisioning of ecosystem services (Schulte et al., 2017). This approach is framed as a viable option for marginal lands to render them ecologically, if not economically, productive (Csikós and Tóth, 2023). Less often considered is the possibility of restoring ecosystem function and economically viable. There is no one-size-fits-all approach to management, and the degree of landscape simplification resulting from agricultural intensification should determine whether the goal is to restore integrity, increase multifunctionality, or pursue sustainable intensification (Landis, 2017). Sustainable intensification offers a viable alternative for increasing the functionality of agricultural land while remaining economically predictable and supporting ecosystem services through systems-based management (Giller et al., 2015).
Economic outcomes from 2023-2025 suggest that ecological benefits were not achieved at a fixed economic cost, and in some cases coincided with equal or greater profitability. In 2024, the business-as-usual system outperformed the aspirational system ($154 ha-1 versus $123 ha-1), driven by higher soybean returns ($192 ha-1 versus $93 ha-1), despite lower corn returns ($117 ha-1 versus $154 ha-1; KBS Long-Term Agroecosystem Research, 2025). However, aspirational soybean also experienced significant slug herbivory that went untreated, resulting in additional replants and poor stands—issues that may have been avoided with appropriate management. In 2025, this relationship reversed: the aspirational system outperformed business-as-usual system ($131 ha-1 versus $86 ha-1), with substantially higher returns for both corn ($181 ha-1 versus $102 ha-1) and comparable soybean returns ($81 ha-1 versus $71 ha-1; KBS Long-Term Agroecosystem Research, 2026). While economic performance varied across years, these results suggest that sustainable intensification can narrow the gap between ecological restoration and continued agricultural production, offering an alternative management framework to recover ecosystem function.
Management System Shapes Above- and Belowground Diptera Biodiversity
Belowground dipteran communities demonstrated high sensitivity to management practices that dictate soil disturbance, residue retention, and increased agrochemical inputs. The severe suppression of detritivores and herbivores in conventional corn relative to all other systems strongly supports our first hypothesis and aligns with established literature documenting the destructive impacts of inversion tillage and broad-spectrum inputs on soil invertebrates (De Graaff et al., 2015). Mechanical tillage physically disrupts the larval microhabitats and fragile puparia of soil-dwelling flies, while burying organic matter reserves away from surface-active colonizers (Wardle, 1995). Conversely, the elevated abundance of detritivores across the aspirational systems in sustainably intensified corn and sustainably intensified wheat relative to the restored prairie suggests that sustainable intensification generates resource-rich conditions highly favorable to larval flies. The combination of no-till management and high crop residue retention provides a continuous supply of decaying plant material, promoting microbial biomass that nourishes microbivorous and detritivorous larvae (Mathew et al., 2012; Zuber & Villamil, 2016). Interestingly, the sustainably intensified perennial forage phase was an exception, remaining indistinguishable from the restored prairie. This likely stems from the establishment of a stable plant community and undisturbed soil matrix, which fosters a more structurally balanced Diptera community mirroring natural reference states rather than the volatile resource pulses of annual crops.
The systematic decline of larval parasitoids across all managed systems compared to the restored prairie represents a critical functional vulnerability. Even within the structurally complex and diverse agricultural systems, parasitoid emergence dropped significantly. Dipteran parasitoids require stable host populations, overwintering refugia, and continuous floral resources to sustain their complex life cycles (Al-Dobai et al., 2012). The dramatic suppression observed here confirms our second hypothesis and strongly indicates that within-field diversification alone cannot substitute for the stable ecological conditions provided by native, unmanaged semi-natural habitats. Restored grasslands clearly act as irreplaceable source habitats for these critical natural enemies within the wider agricultural mosaic.
Adult trophic guild responses in malaise trap communities were more selective, with management system significantly affecting detritivores, microbivores, and nectarivores. Among adult guilds, nectarivores exhibited the most pronounced and dynamic shifts. Sustainably intensified forage and sustainably intensified corn supported significantly higher annual nectarivore abundances than the restored prairie. Rather than indicating a true resource deficit in the prairie, this trend highlights a seasonal phenological mismatch and competitive dynamics. Reconstructed grasslands exhibit distinct floral gaps between early spring and late summer blooms, leaving flies temporary resource-limited (Delaney et al., 2015). Furthermore, highly competitive social bees often monopolize floral resources, with potential to displace solitary adult Diptera toward adjacent crop canopies where cover crops or weeds provide accessible, underutilized nectar resources because they are not dependent on high quality resources for a hive (Inouye et al., 2015; Lindström et al., 2016; Wignall et al., 2020).
Seasonal Dynamics in Trophic Guild Abundance
Evaluating seasonal phenology revealed that annual aggregation masks critical temporal windows during which management systems exert disproportionate functional control. In emergence trap communities, our third hypothesis was partially corroborated: fall-planted sustainably intensified winter wheat along with cover-cropped corn fields drove a massive detritivore and herbivore emergence pulse in early May. This provides robust empirical evidence for the green bridge effect for a trophic guild other than herbivores, predators, and parasitoids. By maintaining active root systems and accumulating vegetative organic matter throughout the winter and early spring, these systems sustain early-season larval development long before spring-planted conventional systems have accumulated meaningful biomass. As the season progressed, resource availability shifted dynamically across the rotation. The dramatic surge of detritivores and herbivores within conventional soybean fields in July potential for soybean to serve as a high-quality resource for some herbivorous taxa that may not necessarily be crop pests. By August, peak functional activity shifted back to aspirational canola and perennial forage tracking the late-season resource accumulation unique to these extended rotations. The near-complete convergence of detritivore and herbivore emergence by September points to a seasonal homogenization of belowground functional processes. This temporal compression highlights the necessity of multi-date sampling regimes; single-date assessments carried out late in the summer would completely fail to capture the critical early-season functional contributions maintained by sustainable intensification practices.
Implications for Agroecosystem Management
Synthesizing these findings demonstrates that neither sustainable intensification nor targeted habitat restoration alone can maintain the full functional complement of agricultural Diptera. Sustainable intensification effectively maximizes internal production services by enhancing detritivorous decomposition, microbivorous nutrient cycling, and adult nectarivore activity. However, the chronic suppression of parasitoid communities across all production treatments illustrates a persistent ecological limitation of working lands. Conventionally managed corn emerged as a clear functional sink for larval trophic guilds, consistently reducing abundances across almost every trophic guild temporally. The functional deficit observed in conventional corn underscores that the ecological penalties of intensive monoculture extend far beyond simple taxonomic richness metrics to structurally compromise the foundational biotic pathways that drive long-term soil health and pest suppression. These results firmly support an integrated landscape-level conservation framework that views sustainable intensification and land sparing as highly complementary, non-exclusive strategies (Kremen, 2015). Simultaneously, interspersed patches of restored prairie are mandatory to serve as stable ecological reservoirs, provisioning the landscape with the essential natural enemy complexes required to secure robust, long-term biological control. Diptera have the potential to serve as a bioindicator, ecosystem function, and soil health in agroecosystems, and detritivores respond strongly to sustainable intensification.
Educational & Outreach Activities
Participation summary:
Over the course of the project, we shared results with a wide range of audiences, beginning with stakeholders at the annual Long-Term Agricultural Research (LTAR) field day at the Kellogg Biological Station, where we presented on the effects of sustainable intensification on decomposition and nutrient cycling in both 2024 and 2025; results were also shared directly with the LTAR Stakeholder Advisory Board to help guide development of the experiment. In 2024 and 2025, we brought these findings to the scientific community through four oral presentations at the Entomological Society of America (ESA) annual meeting, and mentored three undergraduate students who presented posters on this work at the Michigan State University (MSU) Mid-SURE Research Symposium. Outreach to agricultural producers continued in 2026 through participation in the Washtenaw County Farm Bureau Pesticide Applicator Education program, where we presented on integrating soil biodiversity, decomposition, and nutrient cycling into Integrated Pest Management (IPM). Looking ahead, we are in discussion with the LTAR outreach coordinator to develop additional extension materials showcasing the full breadth of the project's results, and three manuscripts are currently in preparation for submission, two on Diptera biodiversity in agroecosystems and one on cover crop residue decomposition.
Project Outcomes
This project demonstrate that sustainably intensified agricultural systems can recover soil biodiversity and related ecosystem services in a relatively short period of time following adoption (~ 2 years). More specifically, corn saw the largest benefit from sustainably intensified practices and was more economically profitable than conventional management because of the reduced input costs. The sustainably intensified agricultural system explored in this study has the potential to provide stakeholders with resilient practices that reduce reliance on expensive synthetic agrochemicals and protect the soil biodiversity responsible for continued production. This project establishes a understudied insect taxa as a bioindicator that rapidly responds to agricultural management and provides immediate feedback on the viability of management systems. Changes in soil health properties can take years to respond to management, time that a grower does not have in order to determine if a given practice is providing added benefit. Leveraging flies as a biondicator provides the knowledge that the practices are effective and operating as intended even if no immediate change in soil health is observed.
This project deepened our understanding of how sustainable agriculture practices affect Diptera (flies), an insect group that remains understudied in agroecosystem research. While we expected a measurable response, its magnitude far exceeded our expectations, demonstrating how readily Diptera populations respond to agricultural change. These results also suggest that Diptera could serve as a bioindicator of soil health, though the mechanistic connection between Diptera and nutrient flux remains poorly understood and warrants further study. Beyond their value as an indicator group, we found that principles drawn from sustainable agriculture can inform native habitat restoration efforts in conservation. On the production side, agricultural producers showed a strong, immediate interest in soil biodiversity as a component of soil health, although practical resources to help them integrate this knowledge into their operations are still being developed. Finally, among the many practices that can be incorporated into sustainable agriculture, integrated livestock and perennial forages emerged as particularly important, a finding we had not initially prioritized. Although livestock can be challenging to integrate, they appear to be an essential component of both agroecosystem function and insect biodiversity.