Final Report for GNE12-033
Project Information
The demand for locally sourced hops by Northeastern microbreweries continues to fuel increased acreage and improved quality of hops grown and processed by the farming community. There has been a sharp increase in the number of Northeast hop producers from six in 2009 to over 150 in 2014. These growers are small scale and produce anywhere from 0.25 to 18 acres of hops. The majority of hop growers in the Northeast are new to farming and have limited experience with pest identification and control. In this three-year study, the abundance of major arthropod pest species and their natural enemy groups were evaluated in an Alburgh, VT hop yard under drive row cover crop treatments. Hop yield, quality, and susceptibility of hop cultivars to major arthropod pests were also evaluated.
Hop plants (cv. ‘Nugget’ and ‘Cascade’) were sampled on twelve dates for three consecutive years (2012-2014) using vacuum and sticky trap sampling techniques. Three cover crop treatments included 1) Control: mowed clover/resident weed control, 2) Clover: red clover, Trifolium pretense, and 3) Diverse: a mixture including common yarrow, Achillea millefolium, beebalm, Monarda fistulosa, red clover, T. pretense, and annual sunflower, Helianthus annuus. The major hop arthropod pests are two-spotted spider mite (Tetranychus urticae Koch), potato leafhopper (Empoasca fabae Harris), and hop aphid (Phorodon humuli Schrank). Each of these pests has a group of natural enemy arthropods that can help to manage pest population levels. Natural enemy groups were strong predictors of the number of each pest on hop plants, meaning that there was a natural enemy community in this hop yard that was predatory and parasitic on the major pest species. Two-spotted spider mites and hop aphids did not differ significantly by cover crop treatment on hop plants. In 2013, the number of potato leafhoppers was significantly higher on hop plants in Diverse treatments and highest in Clover cover crop vegetation. A large, established stand of un-mowed red clover is suggested as a trap crop for potato leafhopper in Northeastern hop yards.
Introduction:
The United States ranks second to Germany as the largest producer of hops in the world. Washington, Oregon and Idaho have the highest American acreage, making the Pacific Northwest the major hop growing region of the USA. (Turner et al. 2011, Almaguer et al. 2014). Hop production in Northeastern states was at its prime between 1840 and 1860 (Staudter and Krakowski 2014). Vermont produced a total of 289,690 kg dried hops in 1860 (Kennedy 1860). A combination of the spread of hop downy mildew (Pseudoperonospora humuli), the expansion of production in western states, and the passing of prohibition laws later in the 1920s contributed to the decline of 19th century Northeastern hop industry. With demand from micro-breweries for local brewing ingredients in Vermont, hops are resurging to Northeast farms as a specialty crop. Vermont is a state known for its local agriculture and there is interest from farmers on how to grow hops conventionally, using IPM tools, and under organic certification. Traditionally, hop yards are heavily managed perennial systems where drive rows are kept as bare soil and pesticides are an IPM staple (Grasswitz and James 2009). Due to two-spotted spider mite (Tetranychus urticae Koch), hop aphid (Phorodon humuli Schrank), and disease pest pressure, growing hops organically has challenges (Turner et al. 2011). IPM tactics are requested by both organic and non-organic growers.
Hop yards, akin to orchards and vineyards, offer a less disturbed and more structurally complex perennial habitat for natural enemies in comparison to annual agricultural systems. This inherent agronomic strength can be enhanced by providing additional habitat for antagonistic arthropods (Landis et al. 2000 and Simon et al. 2009). Cover crops have been studied in numerous perennial cropping systems to provide habitat and alternative food resources, such as pollen and nectar, for predatory and parasitic natural enemy arthropods. These resources have been shown to enhance parasitoid fertility in addition to searching and flight ability (Lu et al. 2014). Drive row cover crops in apple orchards, are reported to aid in spider mite (Altieri and Schmidt 1986, Alston 1994, Tuovinen 1994) and aphid (Wyss 1995, Gontijo et al. 2013) population control. Rieux et al. (1999) and Wan et al. (2014) showed vegetative ground covers to reduce pest outbreaks in peach and pear orchards, respectively. Silva et al. (2010) increased abundance and diversity of natural enemy arthropods in lemon orchards with ground vegetation in comparison to bare soil. The basis for these studies is the “enemies hypothesis” proposed by Root (1973) which states that top down control by natural enemies reduces pest arthropod damage to plants. While cover crops in perennial systems have been a successful IPM tool, there are also cases where ground cover had a negative effect on pest control. For example, Meagher and Meyer (1989) reported higher two-spotted spider mite populations on peach trees in cover crop treatments. Clover and vetch cover crops in pecan orchards had little impact on aphid populations (Smith et al. 1995).
Arthropod communities are a reflection of climate, landscape, and management practices (Schweiger et al. 2005). The hop growing region of the Pacific Northwest is a much drier climate than the Northeast and therefore pest management must be regionally adapted. Two-spotted spider mite and hop aphid are the arthropod pests of economic importance in the Pacific Northwest and are continually managed with insecticides (Turner et al. 2011). Since the hop resurgence in the Northeast region approximately 8 years ago, the native potato leafhopper (Empoasca fabae Harris), has been observed as a third arthropod pest of importance in addition to two-spotted spider mite and hop aphid. Because managing disease and arthropod pests is critical to producing high yielding and high quality hops, insecticides are the go-to management tool. With this tendency, natural enemy control of pest arthropods is suppressed and the risk of secondary pest outbreak fuels the continued use of insecticides. With the goal of reducing pesticide use on farms by promoting ecosystem strengths, we hypothesized that flowering red clover and flowering multi-species mixture cover crops would attract more natural enemy arthropods, therefore reducing two-spotted spider mites, aphids, and potato leafhoppers.
Few studies have investigated the use of cover crops as a pest management tool in hop yards. A three-year Washington State study indicated that incorporating flowering plants between rows of hops attracts effective natural enemy arthropods and reduces populations of two-spotted spider mite. Spider mite populations were reduced on cover crop plot plants yet aphid populations showed more variable levels in ground cover treatments (Grasswitz and James 2009). Aphid populations were highest on hop plants with a mowed fava bean (Vicia faba L.) ground cover in Germany (Goller et al. 1997). There has also been recognition of the need to reduce herbicide use and manage erosion in hops (Lepecki and Berbec 1997). Cover cropping would be a logical step toward improving hop production sustainability. However, appropriate cover crop plant species must be identified for successful pest management (Geneau et al 2012 and Gontijo et al. 2013).
- Work collaboratively with growers to identify beneficial and harmful insects attracted to hop plants in the Northeast, and create resource material that will enable them to easily and reliably identify pests in their hop yards and provide them with viable control options.
- Evaluate the impact of flowering cover cropping on natural enemy and pest arthropod abundance in a Vermont hop yard.
- Assess ‘Cascade’ and ‘Nugget’ hop cultivars for their susceptibility to three major arthropod pests of hops in the Northeast.
- Measure cover crop impact on hop yield and quality.
Cooperators
Research
Study Site. A research hop yard was constructed in the spring of 2010 at Borderview Farm in Alburgh, VT. This hop yard was set up and continues to be managed based on industry standard agronomic practices. Six meter tall cedar posts were set on the Benson rocky silt loam soil type, making a finished trellis height of 4.8 m. After the trellis was constructed, two rhizomes were planted per hill on 4 August 2010. The entire research hop yard has an area of .3 ha. The cover crop trial took place on the southern .1 ha of the yard where cultivars ‘Cascade’ and ‘Nugget’ alternate rows. The hop yard is surrounded by yearly rotating field crops including wheat, barley, sunflower, canola, and pasture. Along the eastern edge of the hop yard is a 20 x 200 m un-mowed pasture strip with two trees in the Ulmus genus. The hop yard is approximately 300 m from a hard wood forest, which includes tree species in the genera Acer, Fraxinus, and Betula.
Experimental Design and Management. Cover crop treatments were planted on 15 May 2012 in a split strip plot design replicated three times. The main plot was the cover crop treatment and the subplot is the cultivar. Cover crop treatments included mowed clover/resident weed control, red clover, Trifolium pretense, and a more diverse mixture including common yarrow, Achillea millefolium cv. ‘strawberry seduction’, beebalm, Monarda fistulosa, red clover, Trifolium pretense, and annual sunflower, Helianthus annuus cv. ‘Durango’. Hereafter, cover crop treatments will be referred to as “Control”, “Clover”, and “Diverse”. Cover crops were planted in the drive row between rows of hard wood mulched hops. In our region, the majority of hop yard drive rows are currently maintained as mowed sod or weeds. Therefore, our control plots were mowed clover where weeds were allowed to fill in. Red clover was chosen as a cover crop treatment due to interest from hop growers. The mixture of flowering plants in Diverse plots were chosen with the goal of continued flower from June-August and for structural complexity.
Each hop row is 45.7 m long in a North-South orientation and consists of approximately 21 hills. Each cover crop plot contained two rows of hops with seven hills in each row. Each hill had two coir strings clipped into the ground and tied to the top of the trellis. Three-four climbing bines were trained to each string. Due to the prevalence of hop downy mildew caused by Pseudoperonospora humuli, all hop plants in this study were sprayed every 10 days with copper hydroxide based fungicide (Champ WG). Insecticides were not applied. Control and treatment plots were crowned, weeded, mulched, fertilized, trained, and pruned identically.
The plots were prepared with a moldboard plow, disked and finished with a spike tooth harrow. Red clover in Control, Clover and Diverse plots were seeded with a 3.08 m Kvernaland drill. Clover was seeded at a rate of 1.4 kg/ha every 11.4 cm Control and Clover plots and every 22.8 cm Diverse plots. All clover was planted to a depth of 7 cm. Each Diverse plot consisted of ten planted rows to create mixed species plots. This mix was planted in a random rotating order of yarrow, beebalm, red clover, sunflower rows. Yarrow and beebalm second year plugs from North Creek Nurseries in Oxford, PA were planted by hand in rows of nine in each Diverse plot. Annual sunflower seeds were planted by hand in rows of nine in May each season yet only flowered in 2012. Original perennial plugs and red clover stand remained undisturbed for the duration of the three-year study. Each cover crop replicate was bordered on each side by one mowed drive row and two rows of hops. Cover crops plots were driven over with tractors on occasion.
Hop plants were drip irrigated with 5977 liters/ha per week June-August in all years of this study. Hop plants were fertilized on 7 May 2012 and 28 May 2013 with North Country Organics Pro-Booster (10-0-0) and ProGro (5-3-4) for a goal of 13.8 kg/ha plant available N, 8.3 kg/ha P, and 11.0 kg/ha K. In 2013, an additional 11.0 kg/ha of Chilean Nitrate was applied on 18 June. In 2014, hop plants were first amended with Chilean Nitrate to provide 8.5 kg/ha plant available N on 27 June. The hop yard was fertigated on 10 June, 28 June, 4 July, 2014 with soy based Ferti-Nitro Plus produced by Ferti-Organic. Each fertigation application was applied to provide 0.55 kg/ha for a total of 10.1 kg/ha plant available N in 2014. Every year .36 kg/ha of Boron and .92 kg/ha Zinc were applied.
Arthropod Collection. Three methods of arthropod collection were performed once weekly for 12 consecutive weeks over three seasons (2012, 2013, and 2014). Collection began the first week of June and continued approximately every seven days until harvest began in late August. Collection methods included vacuum, sticky trap, and detail sampling. Of the three middle hills of each cultivar, two hills were chosen at random each week for vacuum and detail sampling. The order in which plants and plots were vacuumed was randomized weekly. Vacuum sampling was performed mid-day between 10am and 2pm using a reverse leaf blower with a 25 CC 2-cycle gas engine (Poulan PRO BVM210VS, Charlotte, NC). A 20 cm long chiffon bag was attached to the end of the vacuum arm to catch the incoming sample. Each hill was vacuumed up and down for 40 s. The cover crop ground vegetation was also vacuumed for 40 s. This drive row space was sampled by zig-zagging through the ground vegetation while vacuuming. Samples account for 0-3 m height of each hill (as high as we could reach). The vacuum was left on while the mesh bag was removed from the vacuum. The sample was placed into a kill jar containing ethyl acetate and left for 2-5 minutes while the rest of the plot samples were collected. Once all hills and the cover crop treatment had been sampled, arthropod samples in kill jars were transferred into labelled 250 ml glass jars containing 30ml 70% ethyl alcohol. A total of 45 jars were taken back to the lab in Burlington, VT for sorting. After a hill was vacuumed, detail sampling occurred which included the examination of 3 leaves chosen at random by hand. Any remaining arthropods were counted and recorded. Sticky traps were un-baited 7.6 x 12.7 cm yellow cards hung between the two strings of the middle plant in each plot, 1.5 m off the ground on a coir rope held with wooden close-pins. There was one trap for each variety in each plot hung between bines on the center plant for a total of 18 traps weekly. Traps were hung after vacuum and detail sampling each week and collected before sampling the following week.
Arthropod Identification.Vacuum and sticky trap samples were sorted into pest and natural enemy groups using a Zeiss Stemi DV4 stereo microscope. Major pest arthropods were identified to species while natural enemies were identified to functional group. Major pest arthropods included hop aphid, potato leafhopper, and two-spotted spider mite. Natural enemy groups were formed based on previous studies that show predation or parasitism of aphids, leafhoppers, and two-spotted spider mite. Aphid and leafhopper parasitoid families included Mymaridae, Chalcidoidea, Braconidae, Aphelinidae (Lovinger et al. 2000). Aphid and leafhopper parasitoid families were not sorted separately but lumped into one “parasitoid” category. Two spotted spider mite natural enemies included predatory mites (Phytoseiidae), spider mite destroyers (Stethorus punctum punctum) and minute pirate bugs (Anthocoridae). Table 1 depicts natural enemy groups assigned to each major pest.
Plant Phenology. In 2012, plant species and flower presence was recorded. In 2013 and 2014, a 1m2 quadrat was thrown twice randomly into each cover crop plot weekly. The quadrat measured .5 m by .5 m and was made of PVC pipe. The number of plants/m2 and flower presence of each cover crop species were recorded. Three heights of each cover crop species were measured per quadrat. Weed species were noted.
Hop Harvest Yield and Quality. Each year, harvest of cover crop plots took two days. Each cultivar (‘Cascade’ and ‘Nugget’) were harvested in a single day once cones reached 23% dry matter. Hop bines were cut in the field and brought indoors to be handpicked in 2012 and run through a hop harvester in 2013 and 2014. The number of plants/plot were counted. Bine pre-pick and total cone weights were recorded. In 2012, we compared yield and quality between hand harvested and mechanical harvested hops. Additionally, we compared yield and quality between vacuumed plants and plants that were not vacuumed. Picked hops were weighed on a per plot basis, 100-cone weights were recorded, and percent dry matter was determined using a food dehydrator. Harvested hops were air dried in a 40.5ºC oast. Once hops reached 92% dry matter (typically overnight) a representative 100g sample of each cultivar in each plot was collected, vacuum sealing in a plastic bag and stored in the freezer for later quality analysis. Harvest samples were sent to Alpha Analytics in Yakima, WA where they were analyzed for alpha and beta acids using spectrophotometry as per the American Society of Brewing Chemists (ASBC) Method of Analysis entitled Hops 6a.
Data Analysis. Arthropod count data was square root transformed. Residuals were inspected and it was concluded that the data matched a normal distribution. A linear mixed model with repeated measures (PROC LMM, SAS Institute 2014) was used to evaluate pest arthropods and their respective natural enemies by cover crop treatment, cultivar, and collection date for each collection method. Vacuum plant, vacuum cover crop, and sticky trap arthropod data was analyzed separately because these collection methods did not have the same sampling unit. For all collection methods factors were considered fixed with the exception of replication. Fixed effects included natural enemy group, cultivar, cover crop treatment (Control, Clover, Diverse), treatment x cultivar, collection date, cultivar x collection date, and treatment x collection date. Replication was considered the only random variable.
Years of data collection were not pooled due to weather variation which impacted pest populations. We report two-spotted spider mite statistics using the vacuum model and leafhoppers and aphids using sticky trap model. Total counts from vacuum and sticky trap sampling methods were used to calculate pest : natural enemy ratios. For ratios, “pests” included two-spotted spider mites, potato leafhoppers, and hop aphids and “natural enemies” included Anthocoridae, Geocoridae, Nabidae, Chrysopidae, Hemerobiidae, Coccinellidae, Syrphidae, Parasitica, and Spiders. Pest season sum was divided by natural enemy group season sum.
Hop quality is represented using alpha and beta acid percentage which are measured of brewing quality. Yield per acre calculations were performed using the Borderview Farm hopyard spacing of 784 hills per acre. Cover crop treatment yield and quality were compared using the generalized mixed model procedure (PROC GLM, SAS Institute 2014). Yield and quality data were run separately and included the same fixed effects: year, cultivar, year x cultivar, cover crop treatment, year x treatment, cultivar x treatment, and year x cultivar x treatment. All statistics were run at the .05 LOS and generated using SAS software, Version 9.4 (Copyright 2014 by SAS Institute Inc., Cary, NC, USA).
Arthropod Pests and Their Natural Enemies. Vacuum samples captured higher abundance of two-spotted spider mites in comparison to sticky traps or detail sampling. Sticky traps captured potato leafhopper and aphid populations more accurately than vacuum plant samples and detail samples (see Appendix A). Parasitoids were the most abundant natural enemy for both vacuum and sticky trap collection methods in all years. The next most abundant natural enemies were spiders, minute pirate bugs, and spider mite destroyers respectively. As expected, vacuum samples captured two-spotted spider mites and spiders more effectively than sticky traps and sticky traps captured flying insect abundance more accurately than vacuum samples. 2012 exhibited the highest number of two-spotted spider mite. Potato leafhoppers were most abundant in 2012 and 2013 while hop aphid counts indicate a steady population level across years. There was an overall pest : natural enemy ratio of 1.38:1 in 2012, 1.28:1 in 2013, and 1.29:1 in 2014.
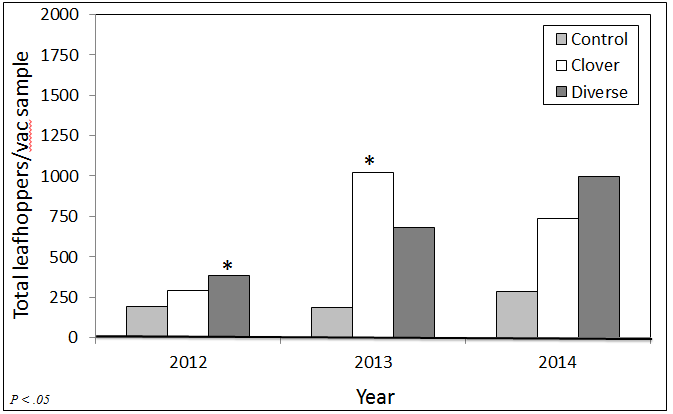
There was no significant difference in pest or natural enemy group abundance between cover crop treatments on hop plants for any of the three sampling methods with the exception of potato leafhoppers in 2013. In this year the number of potato leafhoppers was significantly higher on hop plants in Diverse plots (Figure 1) and in cover crop vegetation of Clover plots. In 2012, potato leafhoppers were significantly higher on hop plants in Diverse plots.
For vacuum plant samples, the two-spotted spider mite population was highest in 2012. Being slightly cooler, more moist seasons, 2013 and 2014 had lower spider mite populations (Table 2). When spider mites were abundant in 2012, spider mite natural enemies were a strong predictor of spider mites on hop plants (P < .0001). Two spotted spider mites showed significantly higher populations on ‘Nugget’ in all years.
The highest leafhopper population was observed in 2012 with an early peak date followed by a similar 2013 peak date in July. Potato leafhoppers arrived late in 2014 with a population size approximately half of that in the previous two years. In all years, our potato leafhopper natural enemy group was a strong predictor of potato leafhoppers (P < .0001). A significantly higher number of potato leafhoppers in diverse treatments in 2013 were observed (Figure 1). There was a significantly higher number of potato leafhoppers observed on ‘Nugget’ compared to ‘Cascade’ in 2013.
Aphid populations were moderate in both 2012 and 2014 with a peak dates in early to mid-August. In 2013 aphids were less abundant with an earlier peak date in June. Our aphid natural enemy group was a strong predictor of aphids in 2012 and 2014 (P < .0001). In 2012 and 2014 there were significantly higher numbers of aphids on ‘Cascade’. There was no significant difference in the number of hop aphids by cultivar in 2013. Vacuum samples from cover crop plot vegetation showed potato leafhopper and hop aphid natural enemy groups to be strong predictors of these pest populations in all years (P < .0001). Potato leafhopper abundance was significantly higher in Diverse cover crop vegetation in 2012 yet significantly higher in Clover plots in 2013 (Figure 2). Overall, both 2012 and 2013 exhibited high potato leafhopper abundance. Potato leafhoppers arrived late in 2014, resulting in low pressure from this pest.
Hop Harvest Yield and Quality. There was no significant difference in yield or quality between cover crop treatments. Hop yield increased significantly from 2012 to 2014 harvests. Mean ‘Cascade’ yield increased from 56.04 kg/ha in 2012 to 134.49 kg/ha in 2014 (Figure 3). Mean ‘Nugget’ yield increased from 77.02 kg/ha in 2012 to 139.87 kg/ha in 2014 (Figure 4). ‘Cascade’ and ‘Nugget’ cultivars differed significantly in yield and quality, as expected. ‘Cascade’ and ‘Nugget’ showed yearly variation in hop quality for both alpha and beta acids (Figures 5-8). In 2013 the south side of the experimental hop yard was sprayed mistakenly with 2-4D broadleaf herbicide. This reduced hop yield in 2013. These plants recovered and yielded well in 2014.
Cover Crop Vegetation Composition. Although plants in cover crop treatments were not altered after planting in 2012, succession was observed. Control plots contained a mean of 18 clover plants/m2 in 2013 and 2 clover plants/m2 in 2014. Fox tail (Hordeum sp.), plantain (Plantago sp.), lamb’s quarters (Chenopodium sp.), and dandelion (Taraxacum sp.) were resident weeds allowed to fill into all plots but were especially present in the mowed control. Clover plots contained a mean of 22 clover plants/m2 in 2013 and 5 clover plants/m2 in 2014. Clover flowered in all years in Clover plots. In 2012, the Diverse cover crop was dominated by annual sunflowers. Sunflowers were planted in 2013 and 2014 yet did not germinate. This allowed the clover, yarrow and beebalm to fill in Diverse plots. Clover, yarrow, and beebalm flowered in Diverse plots 2012-2014. In 2013, there was a mean of 17 clover plants/m2, 6 yarrow plants/m2, and 2 beebalm plants/m2 in Diverse plots. In 2014, there was a mean of 4 clover plants/m2, 4 yarrow plants/m2, and 1 beebalm plant/m2 in Diverse plots. Overall, there was a higher number of clover plants/m2 in Clover plots compared to Diverse and Control plots with the least clover in the mowed Control treatment.
- Figure 4. Nugget yield at 92% dry matter (kg/ha) across three years for each cover crop treatment (Control, Clover, and Diverse). Yield increased significantly over the course of the study (P < .0001) and did not differ by treatment.
- Figure 1. Sum of potato leafhoppers on ‘Nugget’ and ‘Cascade’ combined by year from sticky trap samples on hop plants. In 2013, Diverse treatments had a significantly higher number of potato leafhoppers on hop plants (P < .05).
- Table 2. Peak date and mean number of individuals/sample or sticky trap (± Standard Error of the Mean) for each major hop pest. Values are from the most representative collection method (plants vacuumed or sticky traps) for each pest and year.
- Figure 3. Cascade yield at 92% dry matter (kg/ha) across three years for each cover crop treatment (Control, Clover, and Diverse). Yield increased significantly over the course of the study (P < .0001) and did not differ by treatment.
- Figure 2. Sum of potato leafhoppers by year from vacuum samples in cover crop vegetation. In 2012, before the Clover was established in a full stand, the Diverse cover crop vegetation had a significantly higher number of potato leafhoppers. In 2013, Clover vegetation had a significantly higher number of potato leafhoppers from vacuum samples (P < .05).
- Figure 8. Mean ‘Nugget’ beta acid percentage did not vary by cover crop treatment (Control, Clover, Diverse). Beta acid percentage varied significantly by year (Table 8). Beta acid levels were within industry standards (4.2-5.8 percent).
- Figure 5. Mean ‘Cascade’ alpha acid percentage did not vary by cover crop treatment (Control, Clover, Diverse). Alpha acid percentage varied significantly by year (Table 8). Alpha acid levels were within industry standards (4.5-7 percent).
- Figure 6. Mean ‘Cascade’ beta acid percentage did not vary by cover crop treatment (Control, Clover, Diverse). Beta acid percentage varied significantly by year. Mean beta acid levels were higher than industry standards (4.8-7 percent).
- Figure 7. Mean ‘Nugget’ alpha acid percentage did not vary by cover crop treatment (Control, Clover, Diverse). Alpha acid percentage varied significantly by year (Table 8). Alpha acid levels were generally within industry standards (11.5-14 percent) with the exception of 2012.
- Appendix A: Pests by Collection Method
Arthropods. Under our second objective we sought to measure abundance of the three major Northeast arthropod pests on hop plants and their natural enemy groups by cover crop treatments. We observed natural enemy groups to be statistically significant predictors of two-spotted spider mites, potato leafhoppers, and aphids. The number of hop aphids and two-spotted spider mites did not differ by cover crop treatment. Importantly, these two pests that are economically damaging in the Pacific Northwest did not reach outbreak levels in this study. We did not need to spray insecticide any year of the study. The absence of insecticides, low P:NE ratios, and predictive natural enemy groups means that there was a healthy natural enemy population that kept these pests in check throughout the study. In addition to conservation biological control, cover crop vegetation may increase moisture and limit dusty conditions in hop yards, a tactic known to hinder two-spotted spider mite populations (Jeppson et al. 1975).
Potato leafhoppers were a different story. A migratory species, reliant on wind currents, potato leafhopper presence and abundance in the Northeast is unpredictable. Leafhopper abundance was high in 2012 and 2013. The leafhopper population in 2014 was approximately half the size in number compared to the previous two years. Adult females arrived late to northern Vermont in 2014 with a peak date of August 12 in comparison to the 2012 and 2013 peak date of July 10 (Table 2). A full stand of clover was not established yet in 2012 and potato leafhoppers were highest in Diverse cover crop plot vegetation. In 2013, potato leafhopper numbers were highest on plants in Diverse plots yet highest in the Clover cover crop vegetation. This indicates that a full, established stand of clover was preferred by potato leafhopper over hop plants and the Diverse polyculture cover crop treatment. While clover was a member of the Diverse treatment mix there was a lower density of clover in Diverse plots. This is a reported phenomenon for potato leafhopper in alfalfa systems. Straub et al. (2012) provide evidence that potato leafhopper populations are higher in alfalfa monocultures than in mixed species alfalfa stands. If clover is a preferred host plant in comparison to hops, a non-mowed clover stand would serve as a potato leafhopper trap crop. This observation begs more questions than can be answered from this study and should be further investigated.
With higher natural enemy ratios than those reported in other studies (Rieux et al. 1999), we believe our research hop yard exhibits a high level of biological control of the major hop arthropod pests, reducing the risk of pest outbreak. Cover crops themselves showed similar pest population trends to arthropods on hop plants. Annual sunflower seed was added to the Diverse cover crop because it added structural height to the mixture and was easily accessible. This was not an effective choice due to its ability to outcompete establishing perennials and lack of attraction to natural enemy arthropods (Isaacs et al. 2009). Farms in the Northeast generally sit in a diverse landscape which provides natural enemy arthropods with overwintering and alternative food sources. In the case of this study, it is unclear whether the Diverse perennial mixture cover crop increased natural enemy presence in the whole hop yard or not. Because the surrounding landscape of the research farm hop yard is so diverse, there may already be sources of natural enemies. Red clover was the most effective cover crop treatment because it is very attractive to potato leafhoppers, a hop pest of special concern to first year growers.
Cultivar Susceptibility to Pests. Under our third objective, we report significant differences in the number of two-spotted spider mite, potato leafhopper, and hop aphid on ‘Cascade’ and ‘Nugget’ cultivars. These observations are not surprising as cultivar variation in susceptibility to pests has been observed for two-spotted spider mite and hop aphid in other hop growing regions of the world. This topic is of particular interest because both organic and non-organic hop growers in our region require a regionally specific hop IPM program. The suite of top-down and bottom-up factors that impact cultivar susceptibility to phytophagous arthropods are mechanisms that should be incorporated into sustainable pest management programs (Lewis et al. 1997).
Two spotted spider mites showed significantly higher populations on ‘Nugget’ in 2013 and 2014. Few studies have investigated the relationship between leaf morphology and pest incidence in hops. Control of this secondary pest became miticide based yet with the development of spider mite resistance to control products, alternative management tactics are critical (James 2003). Differences in susceptibility of hop cultivars to two-spotted spider mites have been documented and high farnesol concentration in leaves has been suggested as a possible mechanism of increased susceptibility (Regev and Cone 1975). Peters and Berry (1980) report variation in the density of leaf trichomes on different hop cultivars. It was observed that two-spotted spider mite development time was higher on leaves with higher leaf trichome density (Peters and Berry 1980). While there is variation in hop cultivar susceptibility to two-spotted spider mite, we suggest that the most effective management practice would include natural enemy conservation through the use of narrow spectrum sprays when controlling hop aphids.
It is well documented that hop cultivars have different susceptibility to hop aphid (Campbell 1983, Dorschner and Baird 1988, Weihrauch and Moreth 2005). Aphids varied by cultivar in all years with a significantly higher number of aphids on ‘Cascade’ in 2012 and 2014. Aphid numbers were not significantly higher on either cultivar in 2013. High susceptibility of ‘Cascade’ to hop aphid is consistent with previous research conducted in the Pacific Northwest (Dorschner and Baird 1988). Cultivar susceptibility to hop aphid has been linked to high essential oil content with cariophyllene and farnesene highlighted as hop aphid feeding compounds (Kralj et al. 1998).
Potato leafhoppers are known to be repelled by glandular trichomes produced at different densities on alfalfa (Shockley and Backus 2002), potato (Kaplan et al. 2008), and dry bean (Gonzales et al. 2004) cultivars. Hop as a host for potato leafhopper has not been studied since the 1940s (Magie 1944) and as an emerging pest in Northeastern hop production, further research is underway. Scouting efforts on our research hop yard preliminarily indicate that different hop cultivars are more susceptible to potato leafhopper damage than others. In comparison to other cultivars such as ‘Liberty’, ‘Mt. Hood’, ‘Newport’, and ‘Crystal’, we have observed ‘Cascade and ‘Nugget’ to have lower numbers of potato leafhopper per leaf with ‘Cascade’ having lower levels of infestation than ‘Nugget’. These observations are consistent with results presented here where ‘Nugget’ had a significantly higher number of leafhoppers per sticky trap than ‘Cascade’ in 2013. Cultivar susceptibility research on two-spotted spider mite and hop aphid have been conducted as described above. We suggest that similar research is needed for potato leafhopper.
Hop Yield and Quality. Our fourth objective was to measure the impact of cover crop treatments on hop yield and quality. Hop yield peaks in years 3-10 of a commercial hop yard (Neve 1991). The yearly variation in hop quality parameters seen in both cultivars is most likely due to improved management practices and hop plant age. Specifically, the significantly lower hop yield in 2012 is likely due to a combination of factors including hop plant age and high two-spotted spider mite population. As aphid levels remained relatively stable over the course of this study, the increase in yield and the approach of hop quality to market standards over time is not due to hop aphid presence. In the case of this study, neither yield nor quality differed between cover crop treatments. Our yield remains below the industry standard yet quality was within the industry standard range for ‘Cascade’ alpha acids, ‘Nugget’ alpha, and ‘Nugget’ beta acids. Beta acid levels for ‘Cascade’ were higher than the industry standard.
Education & outreach activities and participation summary
Participation summary:
Presentations and field days to farmers and outreach professionals were given throughout the duration of this project.
Presentations
- L. Calderwood. February 2015. IPM Options for Hop Production in the Northeast. Vermont Hops Annual Winter Conference, Burlington, VT. 181 attendees.
- L. Calderwood. February 2015. Cover Cropping as an IPM Tool in Northeastern Hops. Plant and Soil Science Seminar, Burlington, VT.
- L. Calderwood. February 2014. What Hops in a Hopyard? Vermont Hops Annual Winter Conference, Burlington, VT. 173 attendees.
- L. Calderwood. November 2014. Using Cover Crops as an IPM Tool in Hops. New York State Annual Hop Conference, Morrisville, NY. 300 attendees.
- L. Calderwood. February 2013. Hop Cover Cropping: Preliminary Results. Vermont Hops Annual Winter Conference, Burlington, VT. 202 attendees.
- L. Calderwood. April 2012. Evaluation of Cover Cropping as Biological Pest Control in Northeastern Hops: Project Expectations. University of Vermont Research Conference, Burlington, VT.
Field Days
UVM Extension Crops and Soils Field Day. Held on July 24, 2014 at Borderview Farm in Alburgh, VT. Field day showcasing UVM Extension research. 200 attendees.
UVM Extension Crops and Soils Field Day. Held on August 10, 2013 at Borderview Farm in Alburgh, VT. Field day showcasing UVM Extension research. 180 attendees.
See attached factsheets and field guides to pest and natural enemy arthropods found in Northeast hopyards.
Project Outcomes
Yield and Quality. Neither yield nor quality differed between cover crop treatments. This indicates that the presence of the cover crop species and mixtures studied in here do not have a negative effect on the cash crop. Growers are concerned about the possibility of cover crop vegetation trapping moisture and therefore increasing the presence of hop downy mildew. Although this study did not address disease incidence and plots were preventatively sprayed with copper hydroxide fungicide, the presence of downy mildew was observationally clear. If downy mildew had a negative impact on yield, lower yield would have been observed in Diverse and Clover plots. However, farms have different microclimates. Alburgh, VT, being a peninsula reaching out into Lake Champlain, is a well-ventilated, windy site for a hop yard.
Clover Trap Crop. In 2011, potato leafhoppers killed some of our first year hop plants. While the economic impact of potato leafhoppers on hop yield has not been studied, we think this pest has the largest impact on first year plants. We have begun studying potato leafhopper further and can report that three potato leafhopper adults/leaf reduce net photosynthesis of first year hop leaves in the field.
A red clover cover crop is a relatively low cost seed for farmers. One 10 pound (4.5 kg) bag of Mammoth red clover costs $53.35 from Territorial Seed Company (Cottage Grove, OR). Two, five pound bags cost $75.90 from Johnny’s Selected Seeds (Winslow, ME). Northeastern farmers are generally familiar with clover seeding rates (8lbs/acre) and planting as a forage crop.
Farmer Adoption
After our 2015 Hop Conference (February 20, 2015), we asked growers to answer survey questions on their pest management practices. As of February 27, 2015 31 growers have answered the survey. 67.7% of respondents (21 of 31 responses) indicated that UVM Extension has helped them improve scouting and increase insect identification knowledge. Approximately 50% of respondents who grow hops are scouting for spider mite, leafhopper, and hop aphid arthropod pests. However, 81.3% of respondents (13 of 16 responses) indicated that they scouted for hop downy mildew and 75% of respondents (12 of 16 responses) indicated that they scouted for Japanese beetles. This indicates that growers are very aware of hop downy mildew as a pest in regional hop production. Japanese beetles are a minor pest of hops, yet they are the largest arthropod out in hop yards, making them very visible to new growers. Six growers reported that they spray pesticides in their hop yard. They are spraying for hop downy mildew, spider mites, aphids, and Japanese beetles. After pesticide applications downy mildew and spider mites are reported to be a continued problem by growers that spray.
Clover trap crop findings were recently presented at the 6th Annual UVM Hop Conference on February 20, 2015. Growers were very interested in hearing more about how a clover trap crop for potato leafhoppers could work in their specific situations. A grower in NY State has a hop yard surrounded by an alfalfa field, a known source for potato leafhopper. This grower is going to plant alfalfa intentionally in the drive rows between hop plants as a trap crop.
Areas needing additional study
While we have reached hundreds of current and potential hop growers there are constantly people interested in growing hops in the Northeast. Many members of this cohort are new to farming and pest identification. Education on scouting and IPM options must continue to avoid the use of broad-spectrum pesticides that can cause serious yield and quality damage from secondary pest outbreak.
Studies have stressed that plant species selection is critical to maximize biological control services in cover cropping studies (Geneau et al. 2012, Gontijo et al. 2013). It is clear that future studies should evaluate flowering cover crops for biological control in sites with ample space between treatments to ensure independent sampling. In the Northeast region such sites are rare. Increased habitat diversity in many forms such as forests, hedgerows, and cover crops are well known to increase biological control in agricultural systems (Landis et al. 2000 and Rusch et al. 2010). While it was not our objective to investigate landscape scale impacts on biological control, our results lead us to inquire about the surrounding sources of natural enemies in the landscape. Habitat diversity in the Northeast region is high yet farmers require additional methods of pest management. There is not only a lack of habitat management studies in hop production but also an overall lack of conservation biological control research specific to the Northeast region.
With few IPM options available for organic growers other than pesticides, we believe further regional research should be aimed at habitat management for hop aphid and potato leafhopper natural enemies. If habitat can be provided for the natural enemy groups of these two pests, it is likely that these pest populations will be kept in check, reducing the need for broad-spectrum insecticide applications. Two-spotted spider mites are largely a secondary pest that reaches economically damaging levels when broad-spectrum pesticides are sprayed for aphids or leafhoppers (Huffaker et al. 1969, Jeppson et al. 1975). For potato leafhopper specifically, the size and seeding rate of a clover trap crop that is more attractive than hops to potato leafhopper needs to be addressed. Some trap crop systems remove the pest from the trap crop before the pest spreads to the cash crop (Boucher et al. 2003). It is unclear whether late season potato leafhoppers that trickle over to hop plants from a clover trap crop have any impact on hop yield or not.
Although this hop yard site was not sprayed with insecticides, there is evidence that copper sulfate fungicides, primarily used for hop downy mildew control, were used to manage potato leafhopper populations indirectly in the 1800s (Magie 1944). Champ WG, the fungicide used in this study, is copper hydroxide based. The impact of fungicides on two-spotted spider mite, hop aphid and natural enemies has been investigated in the Pacific Northwest (James 2002, James 2003, Gent et al. 2009, Woods et al. 2012). Further research on indirect potato leafhopper management from copper based fungicides should be addressed.
There are additional cover crop benefits such as nutrient availability and erosion control that were not addressed in this study. The limited number of product choices and high price of organic fertilizers warrants further study on cover crop incorporation for hop plant nutrition.