Final Report for GNE14-077
Project Information
High tunnels are inexpensive, greenhouse-like structures used to extend the growing season and to increase crop quality and yields without increasing cultivated land area. High tunnels experience reduced leaching from precipitation and higher fertilization rates, but also much higher crop yields than are seen in the field. As a result, high tunnel soils typically show high macronutrient and soluble salt levels when subjected to field soil testing methods. Over- and under-fertilization of high tunnel crops is commonly seen in New England, despite regular soil testing and fertility monitoring programs.
The methodology of high tunnel soil testing is inconsistent between states in the Northeast and there have been no previous studies comparing the efficacy of these methods in high tunnel environments. The soil tests used in this study were the commonly used field soil tests in New England, (Mehlich-3 (M3) and Modified Morgan (MM)), as well as the Saturated Media Extract (SME) test. For these experiments, we focused on organic potassium (K), as it is an important macronutrient in tomato yield and quality and is commonly managed with organic sources in high tunnels.
In addition, we assessed the relationship between soil K with both high tunnel tomato yield and yellow shoulder incidence. Applied K had a significant effect on marketable yield, however critical soil K levels could not be established. Applied and soil K had significant effects on yellow shoulder.We also tested the hypothesis that the SME test in conjunction with the M3 or MM test can be used to improve our ability to predict soil nutrient availability for high tunnel tomatoes. The field soil and SME tests were significantly correlated in their ability to measure soil K. As a result, their combination could not increase soil K prediction strength. These results can improve year-round high tunnel production of tomato in the Northeast.
Introduction:
Soils under high tunnels are different from field soils in terms of both weather exposure and how they are managed. High tunnels have the potential for to affect soil characteristics such as increased nutrient mineralization from warmer temperatures and increased salinization from the lack of precipitation (Hoskins, 2013). Coupled with typically increased soil organic matter, increased soluble salt content, and increased macro-nutrients as compared with field soils (Hoskins, 2013; Knewston et al., 2010; Fitzgerald and Hutton, 2012; Sideman unpublished), there is a potential for high tunnel soils to greatly differ from field soils.
Land grant universities in the Northeastern U.S. commonly use the Mehlich-3 (M3) and Modified Morgan (MM) soil tests for field soils, and the Saturated Media Extract (SME) test for soilless media in greenhouses. While these soils tests have been calibrated to predict nutrient status in New England field soils (MM and M3) and greenhouses (SME), they have not been calibrated for high tunnel soils
Without the calibration of MM, M3 or SME soil testing methods to high tunnel soils, accurate interpretations of soil nutrient profiles and fertility recommendations cannot be made. Among land-grant universities in the Northeast, high tunnel soil testing methodologies are inconsistent and controversial, and more research is needed to support current testing protocols and their efficacy. Grubinger (2010) and Hoskins (2013) have proposed that measuring the immediately available nutrients in the soil solution using SME, in combination with MM or M3, may give a more accurate indication of nutrient availability to the high tunnel crop. While soil-testing laboratories in the Northeast have recently started to follow this protocol, little to no research exists to verify this method.
Before a combination of field soil and greenhouse media tests can be confidently recommended to improve soil nutrient status predictions, the ability of field soil tests (M3 and MM) and the SME test to predict soil K must be assessed. One goal of our research was to determine the relationships between the field soil tests and the SME test and their ability to predict soil K in high tunnels in the Northeast, and thereby provide justification to continue or discontinue the combination of field soil tests with SME. The ultimate goal was to improve the interpretation of soil K test values and provide more accurate fertility recommendations to growers. In addition, this research also aims to address how measured soil K levels affect the yield and quality of high tunnel tomato in our region. We hypothesized that both the M3 and MM tests would strongly correlate with the SME test and that soil K prediction values of all tests would strongly correlate with tomato yield and quality.
In the northeast, crops are commonly grown in high tunnels because they offer a longer growing season, warmer overall temperatures, more controlled irrigation management, and less disease than field sites. As a result, crops grown in high tunnels often exhibit increased biomass production, nutrient uptake, and yields than in open fields (Goldy, 2012; Jett, 2010; Reeve and Drost, 2012; Biernbaum, 2013). Because of these increased growth characteristics, field tomato fertility management may not be optimal for high tunnel tomato production systems and establishing critical soil nutrient levels was an objective in our experiment. In addition, many high tunnel tomato growers in the northeast use organic fertility sources, regardless of certification (Sideman, unpublished), which is why our experiment focused on organic fertility sources.
The lack of soil nutrient critical levels indicates the potential for soil test interpretations by soil laboratory personal and crop specialists to be under or overestimating utilization of nutrients by tomato, resulting in inaccurate fertility recommendations to growers. Such inaccurate recommendations may prevent growers from attaining optimal yields.
While understanding the relationship between all macro and micronutrients and high tunnel tomatoes could lead to more accurate fertility recommendations and potentially higher yields, the analysis of multiple nutrients and their varying yield effects would be difficult to study simultaneously. Therefor, the focus will be on K, as it is one of the three macronutrients and considered one of the most important nutrients for fruit production (Ahktar et al., 2010; Besford and Maw, 1975; Fontes et al., 2000; Hartz et al., 1999; Hartz et al., 2005; Liu et al., 2008; Lachover, 1972; Mikkelson, 2008; Serio et al., 2007).
Potassium is an essential nutrient for the ripening of tomato fruit (Ramirez et al., 2009; Serio et al., 2007; Trudel and Ozburn, 1970; 1971). As a result, K can potentially affect the tomato ripening disorder known as ‘yellow shoulder’, which is commonly seen in high tunnel tomato production in the Northeast (Sideman, unpublished). The relationship between soil K level and yellow shoulder is not fully understood. The relationship is further complicated by other factors such as moisture, temperature and tomato genotype (Hartz et al., 1999; 2005; Hunter et al. 2010; Picha et al., 1987). The relationship between organic sources of K and the frequency and severity of yellow shoulder in high tunnel tomatoes is not known in the northeast.
The objective of this component of the research is to assess whether or not a relationship exists between the organically-fertilized soil K levels and the frequency or severity of yellow shoulder.
We hypothesize that the soil K levels from the M3, MM, and SME tests will correlate with one another and with yield and yellow shoulder; and that a yield and yellow shoulder frequency or severity response in high tunnel tomatoes will be seen with increasing rates of supplemental K
Objective 1. Characterize the relationship between soil potassium and yield response and yellow shoulder incidence for high tunnel tomatoes.
In 2014, several levels of K (0 through 900 lbs./acre) were applied in a randomized and replicated design in five high tunnels (three in Monmouth, ME, one in Durham, NH, and one in North Haverhill, NH). In 2015, the experiment was repeated in Maine and in North Haverhill with no additional K, and at a new experimental site in Durham that received a new range of K levels (0 to 750 lbs./acre). Throughout the growing season, soil K levels, plant tissue K and N levels, plant growth characteristics, yield and fruit quality were measured. Except for the 2015 Monmouth, ME experimental site, the 2014 and 2015 data did not show significant correlations between soil K and yield or yellow shoulder response. As a result, the data suggests that soil K may affect yield and yellow shoulder, but it is not the only influential factor.
Objective 2. Determine the correlation strength between Mehlich 3, Modified Morgan, and SME testing methods in high tunnel soils for potassium.
Throughout each growing season at all locations, multiple soil tests were taken per site to be analyzed with the M3, MM, and SME testing methods. In 2014 and 2015 in all locations, significant correlations were seen between M3/MM, M3/SME, and MM/SME test’s ability to predict soil K (r values = .94 to .99). This data indicated that there was no difference in either soil test's ability to predict soil K status.
Objective 3. Determine if the use of the SME test in conjunction with the Mehlich 3 or Modified Morgan tests improves predictions of available soil K.
The combination of the SME test with the M3 or MM soil tests did not improve the ability to predict available soil K. This is because all soil testing methods were significantly correlated, indicating that all soil testing methods measured the same soil K pools.
Cooperators
Research
High Tunnel Structure and Site preparation
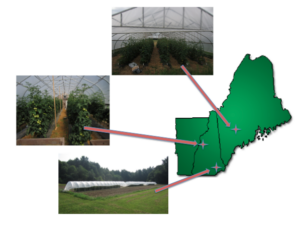 The 3 research sites in 2015.
In 2014, this study was conducted at the New Hampshire Agricultural Experiment Station’s Fairchild Research Center in Durham, New Hampshire, at Grafton County Farm in North Haverhill, NH, and at the Maine Agricultural Experiment Station’s Highmoor Farm in Monmouth, ME. In 2015, the experiment was repeated in the same locations in North Haverhill, NH and Monmouth, ME, but in Durham, NH the experiment was moved due to space limitations to the New Hampshire Agricultural Experimental Station’s Woodman Horticultural Research Farm.
Durham, New Hampshire
In the Durham, NH location in 2014, the high tunnel used was a Ledgewood Farms High Tunnel (Moultonborough, NH) and was 29.2 m (96 ft) long by 9.1 m (30 ft) wide. The gothic-style steel frame was covered with a double layer inflated of 6 mil, 4-year UV treated polyethylene and polycarbonate/wood endwalls with swinging doors. The roll up sides and southern endwall remained open throughout the growing season.
The soil was a poorly drained Buxton silt loam with 15% organic matter. The site was entering its second summer growing season under a high tunnel. The cropping history prior to this study was winter greens, summer tomatoes, and winter greens. Six raised beds were prepared with a bed shaper/mulch layer to be 0.9 m (3 ft) wide by 24.3 m (80 ft) long. Each bed constituted one block and was divided into 9 plots that were 0.9 m (3 ft) wide by 2.4 m (8 ft) long. After fertility application, beds were covered with black plastic mulch. Six plants per block were planted at 0.4 m (16 in) spacing and data were collected only on the inner four plants per plot. See table 4.2 in the appendix for preplant soil nutrient status.
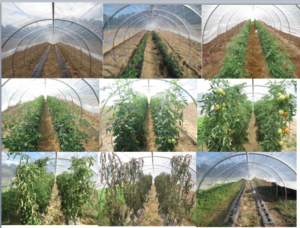 The 2015 growing season, in Durham, starting in top left.
In the Durham, NH location in 2015, three new high tunnels were constructed for the experiment. Each tunnel was 18.3 m (60 ft) long and 3.6 m (12 ft) wide. The caterpillar-style steel frame was covered with a single layer of 6 mil, 4-year UV treated polyethylene and the polyethylene was gathered at the ends and secured to a stake. When temperatures were below 21.1° C (70° F), generally during the nights of the first and last few weeks of the season, and during heavy rain events, the push up sides were pushed down. Otherwise, they remained up throughout the growing season.
The soil type was an adequately drained Charleston fine sandy loam with 3% organic matter. The site was entering its first year under a high tunnel. Prior to tillage, the field was predominately mixed grasses and forbs. Two raised beds per tunnel were made with a bed shaper/mulch layer to be 0.9 m (3 ft) wide by 18.3 m (60 ft) long. Each bed constituted one block, resulting in six total blocks. Each block was divided into six plots that were 0.9 m (3 ft) wide by 2.4 m (8 ft) long. After fertility treatments were applied, beds were covered with black plastic mulch. Six tomatoes per block were planted at 0.4 m (16 in) spacing and data were collected only on the inner four plants per block.
North Haverhill, New Hampshire
In both 2014 and 2015, in the North Haverhill, NH location, a 6.7 m x 21.9 m (22 ft x 72 ft) Rimol High tunnel (Rimol Greenhouse Systems, Inc., Hooksett, NH) was used. Tomatoes were only planted in a 6.7 m x 15.4 m (22 ft x 50 ft) area. The tunnel was moved to its current location in the fall of 2013. Prior to the experiment, only mixed greens were grown with no fertility applications. Before the tunnel was in place, the location had been used for mixed vegetable field production with yearly manure applications. When temperatures were below 21.1° C (70° F), generally during the nights of the first and last few weeks of the season, and during heavy rain events, the roll up sides were closed. Otherwise, they remained open throughout the growing season.
The soil type was a well-drained Windsor loamy sand. Four raised beds were prepared by hand to be 0.9 m (3 ft) wide by 14.6 m (48 ft) long. Each bed constituted one block and was divided into six plots that were 0.9 m (3 ft) wide by 2.4 m (8 ft) long. After fertility treatments were applied, beds were covered with black plastic mulch. Six plants per block were planted at 0.4 m (16 in) spacing and data were collected only on the inner four plants per plot.
Monmouth, Maine
In both 2014 and 2015 in the Monmouth, ME location, three 7.9 m x 14.6 m (26 ft x 48 ft) Rimol Rolling Thunder (Rimol Greenhouse Systems, Inc., Hooksett, NH) high tunnels were used. Prior to experiment in 2013, the location was uncovered and planted in lettuce using a 10-10-10 fertilizer at 560 kg/ha (500 lbs/ac). Prior to high tunnel construction in 2012, the location was in a long-term sod. When temperatures were below 21.1° C (70° F), generally during the nights of the first and last few weeks of the season, and during heavy rain events, the roll up sides were closed. Otherwise, they remained open throughout the growing season.
The soil type was a Woodbridge sandy loam. Five raised beds were prepared with a bed layer to be 0.9 m (3 ft) wide by 14.0 m (46 ft) long per tunnel with the middle row of each tunnel excluded from the experiment. Two adjacent beds per tunnel constituted one block and were divided into ten plots that were 0.9 m (3 ft) wide by 2.0 m (6.6 ft) long. After fertility treatments were applied, beds were covered with black plastic mulch. Five tomatoes per block were planted at 0.4 m (16 in) spacing and data were collected only on the inner three plants per plot.
Cultivar Selection
In 2014 in both the Durham and North Haverhill, NH locations, the cultivar ‘Geronimo’ (Johnny’s Selected Seeds, Waterville, ME) was grown. ‘Geronimo’ was selected as it is widely grown in the area and expresses resistance to leaf mold (Fulvia fulvum), a common high tunnel tomato disease. Plants were seeded in a heated greenhouse on 2 Apr. 2014 and were transplanted on 4 Jun. 2014 in Durham, NH and in North Haverhill, NH. In the Monmouth, ME location, the cultivar ‘Rebelski’ was grown because not enough ‘Geronimo’ plants were available due to unanticipated poor germination. Rebelski’ was selected due to its similar characteristics to ‘Geronimo’. Rebelski’ plants were seeded in a heated greenhouse on 23 Apr. 2014 and were transplanted on 10 Jun. 2014 in Monmouth, ME. Plants in all locations were pruned to a single leader and trellised.
In 2015 in all locations, the cultivar ‘Big Beef ‘was grown (Harris Seeds, Rochester, NY). ‘Big Beef ‘was selected because it does not posses the ‘uniform green’ trait, which makes it more susceptible to showing yellow shoulder, which was desirable to help identify potassium thresholds in the experiment. All plants were seeded on 24 Mar. 2015 and transplanted on 29 May 2015 in Durham, NH and Monmouth, ME and 18 May 2015 in North Haverhill, NH.
Fertility Treatments
In 2014, composite soil samples were taken at all sites to a depth of 15 cm (6 in) from each of the experimental sites and were assessed by the University of Maine Soil Analytical Lab. Ten fertility treatments were assigned to create seven levels of soil K. For the organic K levels, potassium sulfate (North Country Organics, Bradford, VT) was used. To meet crop needs, a combination of blood meal and soy meal was used as a nitrogen source. All materials were applied immediately before transplanting and raked into the soil surface to a depth of approximately 5 cm (2 in) in Durham, NH and Monmouth, ME, and incorporated into the soil with a broadfork to a depth of approximately 10-15 cm (4-6 in) in North Haverhill, NH. In North Haverhill, the highest K treatment was dropped due to space.
In 2015 before site preparation in Durham, NH, the soil was sampled with identical methodology as in 2014 to assess initial soil K. The highest K treatment was dropped due to space. As in 2014, 0-0-51 potassium sulfate (North Country Organics, Bradford, VT) was used for the organic K source and was applied up to a week before transplanting and raked into the soil surface to a depth of approximately 5 cm (2 in). Because the potassium levels in the blood and soy meal nitrogen sources in 2014 were unexpectedly high, a lower K nitrogen source (Naturesafe, Darling, TX) was used in 2015, thus lowering the overall levels of K in the treatments.
Additional K was not applied in 2015 in the North Haverhill or Monmouth, ME locations, where the experimental sites remained the same as 2014. Because of the soil K applications in 2014, a strong K gradient was established between the experimental plots in both sites. As a result, no additional K was applied to either site as the residual K gradient between plots was sufficient for the experimental design. Application of Naturesafe was split with 50% of the fertility immediately before transplanting and 50% at first harvest.
The preplant applications were raked into the soil surface to a depth of approximately 5 cm (2 in) in Durham, NH and Monmouth, ME and incorporated into the soil with a broadfork to a depth of approximately 10-15 cm (4-6 in) in North Haverhill, NH. The first-harvest applications were mixed into the soil around the base of the plants approximately 15 m (6 in) from the stem in all directions with a trowel under the black plastic.
Harvest
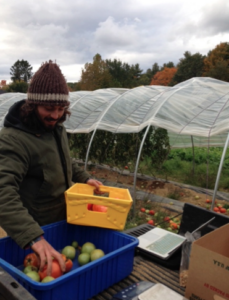 Data collection at the final harvest in Durham, 2015
Starting on 6 Aug. 2014 in Durham, NH, 18 Aug. 2014 in North Haverhill, NH, and on 19 Aug. 2014 in Monmouth, ME, yield data were collected. All ripe fruit were harvested on a per-plant basis and weight of harvested fruit, number of harvested fruit, fruit size, marketability, and fruit defect data (yellow shoulder, radial cracking, concentric cracking, blossom end rot, etc.) were collected. Harvests were repeated weekly until 16 Sep. 2014, 30 Oct. 2014 in North Haverhill, NH, and 14 Oct. 2014 in Monmouth, ME. On the last harvest, in addition to ripe fruit, unripe fruit were harvested, sorted into breaker (stage of fruit development where if picked, will ripen) or non-breaker (stage of fruit development where if picked, will not ripen), and weighed.
In 2015, starting on 27 Jul. 2015 in Durham, NH, 25 Jul. 2015 in North Haverhill, NH, and 23 Jul. 2015 in Monmouth, ME, yield data were collected. Data collection methodology was identical to 2014 except regarding yellow shoulder.
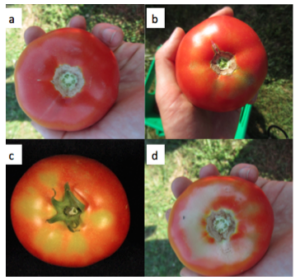
In addition to yellow shoulder frequency, the severity of yellow shoulder was also recorded. Each fruit was rated on a scale of zero to three, where zero indicated no yellow shoulder, one was still considered marketable and the fruit area exhibited less than 10% of yellow shoulder, two was considered unmarketable and the fruit area exhibited 10-50% of yellow shoulder, and three was considered unmarketable and the fruit area exhibited over 50% of yellow shoulder (Figure 4.1). Harvests were repeated weekly until 14 Oct. 2015 in Durham, NH, 17 Oct. 2015 in North Haverhill, NH, and 19 Oct. 2015 in Monmouth, ME.
Soil Sampling
In both years, soil was sampled in each plot at the first and the last harvest, as well as prior to transplanting in 2015 in North Haverhill, NH and Monmouth, ME. Soil was collected from each block to be archived and analyzed. To collect a sample, soil was extracted to a depth of 15 cm from three different areas within each plot, through the black plastic. The soil samples were mixed in a bucket, and an approximate two-cup sample was extracted. Soil samples were dried in a ventilated greenhouse for one week. After drying, one cup was archived for later use and one cup was sent to the University of Maine Soil Analytical Lab for analysis using the MM, M3, and SME soil tests. Because the M3 and MM tests were so strongly correlated throughout the 2014 samples and the 2015 preplant sample, the M3 treatment was dropped in 2015 to lower experimental costs.
Petiole Sampling
In both years, petiole sap K and N were measured for each plot at the first and the last harvest. Petiole sap K and N were measured to estimate current K and N status of the plant. At the first harvest sampling date in all sites, one petiole was selected from the one healthiest, largest, and greatest fruit set plant among the four center plants per plot considered. One sample per plot was chosen in order to reduce the impacts of leaf removal on plant growth mid-season. At the last harvest sampling date in all sites, one petiole from each of the four inner plants per plot was selected. The four petioles per plot were treated as one composite, more representative sample. The most recently expanded leaf, the fourth or fifth leaf from the apex, from each chosen plant, was harvested for analysis. Leaves were immediately stored on ice in a cooler until analysis, which occurred one to two hours after harvest, as recommended by Rosen et al. (1996).
To extract petiole sap, all leaflets and petiolules were removed from each leaf, leaving only the petiole. The petioles were chopped using a kitchen knife into one cm-long pieces and their juice was extracted with a handheld garlic press. For the final harvest composite sample, all the sap from four petioles was extracted and mixed as one composite sample. For nitrate analysis, sap was measured at no dilution and for potassium analysis, sap was diluted in a 1:10 ratio with deionized water. The sap was analyzed for nitrates using a LAQUA Twin Nitrate Meter and for Potassium using a LAQUA Twin Potassium Meter (Spectrum Technologies, Inc., East Plainfield, IL). To ensure consistency, both meters were recalibrated using two-point calibration every five samples. In 2014, a malfunction in the LAQUA twin nitrate meter prevented petiole sap N data from being obtained.
Data Analysis
All statistical analysis was conducted using JMP Pro 12 (SAS Institute, Inc., Cary, NC). For all correlations, the strength of r statistics was interpreted as follows: -1.0 to -0.5 or 1.0 to 0.5 = strong, -0.5 to -0.3 or 0.3 to 0.5 = moderate, -0.3 to -0.1 or 0.1 to 0.3 = weak, and <-0.1 to 0.1 = none.
Soil and Petiole Potassium
Soil K data from M3, MM, and SME soil tests from all sample periods and sites were compared using a Pearson product-moment correlation model. Correlation r-values in all paired combinations (M3*MM, M3*SME, and MM*SME) were obtained. Correlations were also performed between measured soil K and the applied K treatment. Petiole K from all sample periods per site-year were compared with each other, with the per-plot harvest data, and with soil K from all sample periods per corresponding site year. Correlation r-values and corresponding p-values were obtained.
Soil K data from M3, MM, and SME soil tests from all sample periods and sites were also compared using the same model with plant yield and fruit traits. Because soil variables were taken on a plot-basis, correlations were performed using plot averages of per-plant values for all fruit yield traits. From this, the following data were selected for analysis: marketable weight (all fruit with no defects), unmarketable weight (all fruit with any defect except yellow shoulder), yellow shoulder weight (all fruit exhibiting yellow shoulder), yellow shoulder frequency (the frequency of total fruit exhibiting yellow shoulder), yellow shoulder severity (mean yellow shoulder severity score for all fruit that had yellow shoulder), and total weight (all marketable, unmarketable fruit, and yellow shoulder fruit). The soil K data from M3, MM, and SME soil tests from all sample periods and sites were compared with the cumulative mean harvest data using a Pearson product-moment correlation model. Correlation r-values and corresponding p-values were obtained.
Treatment
Analysis of variance (ANOVA) was utilized to evaluate the effects of treatment on harvest traits. The model effects were applied K as a fixed effect and block as a random effect and the response variables used were the cumulative harvest data (marketable weight, unmarketable weight, total weight, and yellow shoulder frequency, severity, and weight).
The M3, MM, and SME tests produced similar results in the estimation of soil K levels; they were very highly correlated (see Table 4.10). As a result, our data do not support the contention that the combination of the SME test with a field soil test will result in increased soil nutrient prediction strength, compared to either test used on its own. However, the combination of the two soil tests was originally recommended for high tunnel soils under continuous production for over three years (Grubinger, 2010; Hoskins, 2013). Because our experimental sites do not meet the proposed age requirement, our data could not evaluate this hypothesis.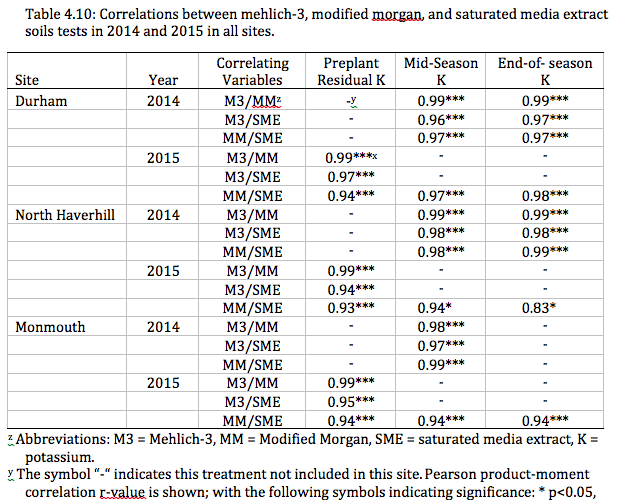
However, similar research in the same locations is still underway and both North Haverhill, NH and Monmouth, ME will be entering their fourth season of continuous high tunnel production, qualifying them for the recommended soil test combination according to Grubinger (2010) and Hoskin’s (2013) hypothesis. It is anticipated that the hypothesis can be more adequately tested in the next year of research. It should be noted that these conclusions only apply to soil K and the effects of soil testing on nitrogen and phosphorous have not been evaluated. Due to the variability between soil dynamics, what applies to soil K may not apply to soil N or P and further research should be carried out to address these elements.
A significant interaction existed between applied K and yellow shoulder-affected fruit weight in North Haverhill, NH and yellow shoulder frequency and severity Monmouth, ME in 2015 (Monmouth data are shown in Table 4.13, below). In addition, increasing levels of applied K showed decreasing frequency of yellow shoulder affected fruit in the total harvested fruit. These data support conclusions made by Hartz et al. (1999; 2005), who found that applied K affects tomato fruit yield and yellow shoulder in field settings. However, because our data indicates yellow shoulder presence at frequencies of over 14% in Durham, NH, 55% in North Haverhill, NH, and 63% in Monmouth, ME regardless of soil K levels, the management of this disorder through soil K alone is impractical and likely not plausible. These data support also support conclusions made by Hartz et al. (1999; 2005), who stated that while K does affect tomato yellow shoulder, the addition of other materials (gypsum) or factors such as temperature, light, or cultivar have a greater affect on yellow shoulder in tomato that K applications alone. The high rates of yellow shoulder in 2015 compared to the complete absence of the disorder in 2014 suggests that selecting cultivars possessing the uniform green trait (Picha, 1987) or using shade cloth (Gent, 2004) is a far easier and more effective method for the control of yellow shoulder disorder.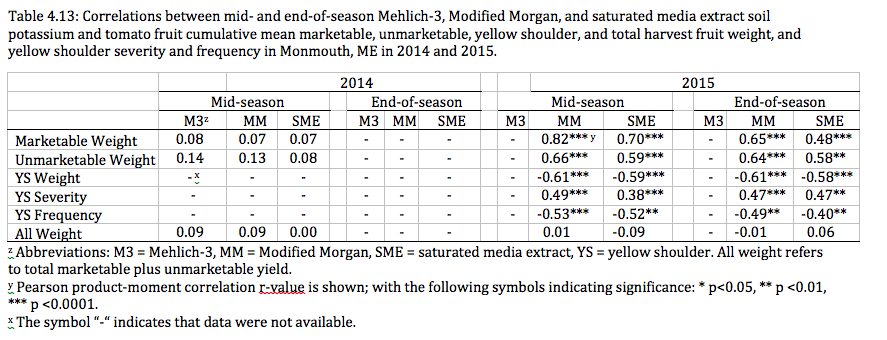
A yield response to applied K was seen in North Haverhill, NH and Monmouth, ME. A significant yield response to increasing soil K was seen in Monmouth, ME in 2015 when soil K had been significantly drawn down (see Figure 4.2, below). As a result of this data and the significant correlations between marketable weight and MM soil K, it can clearly be seen that K has the potential to affect yield. This relationship that K is essential in tomato fruit production is well supported in the literature (Ahktar et al., 2010; Fontes et al., 2000; Hartz et al., 2005; Lachover, 1972; Serio et al., 2007).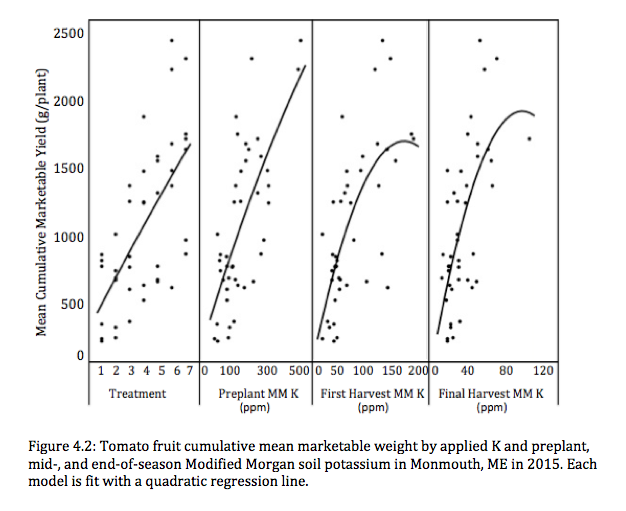
Tomato yield response to applied K is more likely to occur when preplant soil K is low (Ahktar et al., 2010; Fontes et al., 2000) or completely controlled (Serio et al., 2007), but less likely when preplant soil is moderate to high, even when K is applied through fertigation and is highly soluble (Hartz et al., 1999; 2005). This indicates that precisely evaluating preexisting soil K is essential for proper fertility applications. However, precise soil K measurement can be difficult because many factors effect soil K dynamics such as the soil temperature and moisture levels (Schaff and Skogley, 1982; Sparks and Huang, 1985), presence of competitive cations (Gieseking and Jenny, 1936), soil texture class and buffering capacity (Ninh et al., 2009), preexisting soil saturation of K, and equilibrium between soil K phase-types (Brady and Weil, 2007; Sparks, 1987).
To address these variables in potassium dynamics, Beckett (1964) developed the quantity-intensity (Q/I) soil K testing methodology, but the difficulties in methodology and cost had historically limited the ability to include Q/I with commercial soil testing (Davis et al., 1996). However the quantity-intensity methods, which measure exchangeable K (quantity) and soil solution K (intensity) are very similar to the proposed combination of the MM soil test (quantity) and the SME test (intensity) by Hoskins (2013) and Grubinger (2010). This proposed methodology could be of great benefit because most soil labs capable of both testing protocols and neither are cost-prohibitive (Grubinger 2010).
While our data did show a relationship between applied K and yield, critical soil K levels for high tunnel tomato production could not be determined. Yield did not increase with soil K until a critical level was reached, where yield no longer increased in response to increasing soil K. Because of this, precise K fertility recommendations for high tunnel tomato production in the Northeast cannot be made.
A possible explanation for the lack of a clear yield curve response to soil K could lie in the potential for luxury K consumption by tomatoes. End-of-season soil K levels in all treatments, regardless of applied K amount, decreased throughout the two experimental seasons to similar levels. This indicates the potential for plants in the higher applied K treatments to have taken up more potassium than plants in the lower applied K treatments with no clear yield-curve response seen. Evidence exists to assume that soil K levels were not low enough in any treatment to limit yield and that luxury K consumption took place.
All petiole sap K measurements from both years and all treatments were above field tomato sufficiency levels and most were above greenhouse tomato sufficiency levels determined by Hochmuth (1994). The excessive petiole sap K levels suggests that the tomato plants were growing in soils overly-saturated in K, even though soil K levels fell below optimum soil K according to the University of Maine’s interpretations of the M3, MM, and SME K levels. This discrepancy indicates the potential for field or greenhouse petiole sap K sufficiency levels determined by Hochmuth (1994) to not apply to high tunnel tomato; or for the in-field petiole sap K protocol utilized in the experiment to not accurately reflect petiole sap K uptake. To potentially increase the accuracy of this method, it is recommended that multiple petioles per sample be taken so that a composite sample can be evaluated, instead of relying on a single sample as in our protocol. In future experiments, we will be using plant tissue testing in lieu of petiole tests, for increased accuracy.
Both soil K testing and petiole sap K testing showed potential to predict yield and yellow shoulder patterns. In Monmouth, ME, the preplant MM soil test in 2015 was the only soil-sampling period whose soil K levels could predict yellow shoulder frequency, severity, and weight with significant probability. Preplant soil samples are usually taken in the early spring with plenty of time to adjust K for optimal yield or quality, this test can be of great benefit to growers and recommended as a potential tool to manage tomato yield and quality. A relationship existed between the end-of-season petiole sap K levels and yellow shoulder frequency, severity, and weight, as well as marketable and unmarketable weight. However, critical petiole sap K levels for yellow shoulder frequency, severity, and weight, or marketable and unmarketable weight could not be established because there were no clear yield-curve relationships with petiole K and because yellow shoulder was observed at high frequency and severity regardless of petiole K. In addition, the ability to predict yield and quality response at the end-of-season does not provide a grower any chance to improve soil K levels if petiole sap K tests suggest deficiency. As a result, the use of in-field petiole sap K measuring can not be recommended to growers as a reliable practice in managing high tunnel tomato fertility, as it relates to yield and quality.
In summary, the M3, MM, and SME soil test K levels were highly correlated in diverse soils with less than three years of continuous production. While the combination of either field soil test with the SME test will not increase the prediction strength of soil K for recent high tunnels, this research will be continuing and two out of the three experimental sites will be entering their fourth year of continuous high tunnel production.
In addition, critical soil K levels for maximizing tomato yield and quality could not be identified in high tunnel production systems because of a lack of a clear yield-curve response to applied organic K fertility. This is likely due to the complications in soil K dynamics and compounded by uncontrollable variables such as varying soil structure, buffering capacity, preplant K saturation, and soil K phase-type equilibria between experimental sites. It is recommended that further research studying the effects of applied K fertility should not only consider preplant soil K, but also soil texture class and buffering capacity when comparing experimental sites.
Despite these complications, preplant M3, MM, or SME soil K levels were identified as potential useful predictors for high tunnel tomato yield and quality and in-field petiole sap K levels were not. Soil K did have a significant effect on marketable yield and the yellow shoulder disorder, but further research should be done to better understand the extent of its effects and other interacting variables.
The results can impact current production practices and future research directions in several ways. The results did not indicate a clear relationship between soil and yield response and yellow shoulder incidence. As a results, it can be known that growers managing decreased yields or increased yellow shoulder should not rely solely on potassium fertility. The results also indicate a significant correlation between the M3, MM, and SME tests for soil K. As a result, the combination of the M3 or MM tests with the SME test likely does not improve soil nutrient prediction ability for K and does not justify their combination by soil testing labs for soil K.
Education & outreach activities and participation summary
Participation summary:
The findings of this project were part of the author's M.S. thesis in Plant Biology from the University of New Hampshire titled "Year-round management of high tunnel production systems: spinach and tomato". In addition, findings from this project were presented at the 2015 American Society for Horticultural Science annual meeting (New Orleans, Louisiana, 4-7 August 2015) as a poster presentation (Eatonetal_ASHS), and at the 2016 CCA meeting of Northern New England (Portsmouth, New Hampshire, 3-4 February 2016) as an oral presentation (cca presentation 2016). This work was also presented at the following grower meetings:
- Tomato growers' roundtable, Albion ME, July 2015 (20 growers and extension educators)
- Research twilight meeting at the NH Agricultural Experiment Station, Durham NH, June 2015 (10 growers, 10 extension professionals)
- Research twilight meeting at the Grafton County Farm, North Haverhill, NH, September 2014 (15 growers).
Project Outcomes
At this time, clear economic implications from this study can not be realized. The main reason is due to the fact that soil K critical levels could not be defined. Without soil K critical levels, optimal fertilizer amounts or expected yields are unknown, making it difficult to estimate production expenses or yield revenue. Our results did indicate that the combination of the SME test with field soil tests may not improve soil K prediction ability and may not be necessary. As a result, if a grower opts to exclude the SME test in the high tunnel testing package, the costs savings are negligible and would not largely affect farm finances.
Farmer Adoption
At this time, the majority of findings from this research are more applicable to researchers and soil testing labs. Researchers can build upon the soil nutrient calibration framework that our research has provided and apply it to additional soil nutrients. Soil analytical labs can re-assess high tunnel soil testing packages that utilize the combination of a field soil test with the SME test. However, our research did find that the management of yellow shoulder disorder can not be solely influenced by potassium and that other factors such as variety and temperature/light may have a stronger affect on the disorder. This information, which was presented at the 2016 CCA meeting of Northern New England, can be immediately adopted by farmers to improve their high tomato production systems.
Areas needing additional study
This research has helped highlight that the complexities of testing soil K and its affects on tomato production. While high tunnel soil K critical levels could not be fully recalibrated in high tunnel soils at this time, future research will focus on this goal. In addition, this research has helped lay the framework for recalibration studies for other essential soil nutrients such as nitrogen and phosphorous in high tunnel tomato. In addition, this research has confirmed that soil K is not the only factor involved in yellow shoulder development.
A significant outcome of this work was the preparation and funding of a new SARE R&E project, LNE 15-343, Improving nutrient and pest management in high tunnel tomato production. This graduate student grant laid the foundation for this collaboration across states, and we are now continuing (and expanding upon) this work in order to develop research-based best practices relation to managing pests and nutrients in high tunnel tomato production.