Final report for GNE16-129
Project Information
The main purpose of this project is to estimate the nesting densities of an economically-important native crop pollinator as part of a broader effort to understand the value of pollination from wild bees for farmers. Combining genetic approaches, geographic information systems (GIS) and field experimentation I 1) estimate on-farm nest densities of the common eastern bumblebee (Bombus impatiens), 2) examine whether landscape pattern or management practices explain differences in nest densities and wild bee communities between farms and 3) demonstrate how differences in pollinator community responses translate into economic benefits via changes in crop yield. Despite their ecological and economic importance, surveying bumblebee populations is challenging. Novel genetic techniques have begun to allow more rigorous estimates of nesting density. For the first time, I connect these techniques with economic analyses to relate nesting densities and blueberry yields in Vermont. I found that farm management and landscape pattern interactively affect native bee communities (i.e. visitation, abundance and diversity) but not nest density. We also found that visitation by wild pollinators, but not nest density, are important to blueberry production, affecting both the quantity and quality of crops. My findings support long-term sustainability of specialty crop agriculture by increasing growers’ ability to better manage pollinators for improved crop yield.
Objective 1 This objective focuses on the question: Do perennial berry farms differ in the nest density of an important crop pollinator? To answer this question I have:
• Collected B. impatiens workers from each farm site during the 2016 summer field season.
• Extracted DNA from specimens.
• Genotyped extracted DNA using B. impatiens specific microsatellite markers
• Estimated colony density with maximum-likelihood algorithms (COLONY)
Objective 2 This objective focuses on the question: What are the effects of landscape pattern and farm practice on wild bee communities and bumblebee nest density? To answer this question I have:
• Used GIS to characterize landscape composition and configuration
• Created a continuous index farm management intensity
• Explored the relationship between landscape pattern, farm management and wild bee communities
Objective 3 This objective focuses on the question: Do differences in nesting density and wild bee visitation translate into differences in yield? To answer this question I have:
• Performed pollen limitation experiments at multiple farms to determine how much farms would benefit if pollinators were more abundant. I then compare multiple measures of berry quantity and quality under ambient pollination conditions to an experimentally supplemented treatment.
• Estimated the productivity of each farm, in berries per ha, under ambient pollination conditions. Combined these yield estimates with experimental results to estimate the yield deficit resulting from pollen limitation and converted yield deficit to forgone revenue
• Explored the relationship between nesting density, wild bee visitation and farm yields
Conserving wild pollinators populations on farms reduces environmental and economic risks for farmers and is therefore a critical part of sustainable agriculture. The demand for agricultural pollination services is rising (1) and wild pollinator visitation is increasingly expected to safeguard against crop yield instability (2). Wild bee communities complement the activity of honeybees and ensure pollination for many economically important crops. Often wild bees are more efficient pollinators because they frequent more flowers and successfully transfer more pollen. When compared to honeybees, for example, bumblebees in blueberry farms have a greater visitation rate and deposit more pollen per flower visit (3). Wild bees, such as B. impatiens, are also active over a range of climate conditions (4) and temporal scales (5), and therefore provide pollination insurance in the face of climate change. Bumblebees are the dominant pollinator of many wild and crop plants, yet many species are threatened by agricultural intensification.
The rationale of the proposed research is that obtaining measures of bumblebee nest density will inform conservation and management actions that aim to promote viable populations of this important crop pollinator. In spite of their ecological and economic importance, measuring bumblebee population size remains elusive. As social insects, bumblebee nests are made up of many worker-sisters with a single reproductive individual, the queen. Determining population viability (i.e. the number of reproductives) requires estimates of nest density, but data typically collected document abundance patterns of individuals. The problem with abundance surveys is that the individuals observed in a given area may represent multiple nests or the same nest. Put another way, is the number of bees pollinating a farm the result of a few large nest or several small nests?
Determining nest density is an issue of conservation concern and farm productivity. Research suggests that farm management activities such as wild flower plantings may improve yields because restoration promotes pollinator abundance and crop visitation. It is unknown whether increased floral availability supports more bumblebee nests or simply contributes to larger colony size (6). It is important from a conservation perspective to understand the discrepancy between colony growth and larger-scale patterns of nest density. From an agricultural perspective it is critical to understand whether management actions actually support sustainable populations of pollinators. Farms with greater nest density spread the risk of colony failure and benefit from pollination services that are robust to local disturbance. Managing for nest density means pollination services will be derived from multiple sources, and more resilient to environmental change.
Supporting and promoting wild bees such as bumblebees has the potential to increase the economic benefits farmers receive from pollination. It is well understood that landscape and management factors influence bumblebee abundance. A previous SARE funded project (GN11-028) looked at the effects of landscape composition on nesting density in an annual crop, yet this study neither evaluated the effects of farm management nor performed any economic analysis. What remains untested is whether landscape pattern, as well as farm management, have a similar effect on nest density, and whether variation in nest density between farms translate into differences in crop productivity. My research aims to address four gaps in our knowledge of bumblebee population research: 1) Is nest density strongly related with observed levels of abundance? 2) Are there landscape factors that explain differences in nest density between farms? 3) Are there management factors that explain differences in nest density between farms? 4) How are crop yields influenced by landscape pattern, management factors, and nest density? Answering these questions is critical to understanding what measures farmers can take to sustain populations of bumblebees in agricultural landscapes.
The proposed research provides new information and addresses, in economic terms, a specific need of farmers. Our ongoing research has demonstrated that Vermont blueberry farms are pollinator-limited, meaning that some farm’s yields could be improved if more pollinators were present. My research connects agricultural landscapes, bumblebee populations and yield gaps in a novel and previously unreported way. I employ a combination of genetic and GIS techniques, thereby advancing the science of measuring pollinator populations in agricultural landscapes. Understanding the relationship between nest density and farm practices and/or landscape pattern informs management recommendations to farmers who are in need of a suite of tools to maintain diverse and healthy pollinator communities.
REFERENCES
1. I. Koh et al., Modeling the status , trends , and impacts of wild bee abundance in the United States. Proc. Natl. Acad. Sci. 113, 140–145 (2016).
2. L. a Garibaldi et al., Wild pollinators enhance fruit set of crops regardless of honey bee abundance. Science. 339, 1608–11 (2013).
3. S. K. Javorek, K. E. Mackenzie, S. P. Vander Kloet, Comparative pollination effectiveness among bees (Hymenoptera: Apoidea) on lowbush blueberry (Ericaceae: Vaccinium angustifolium). Ann. Entomol. Soc. Am. 95, 345–351 (2002).
4. R. Rader, J. Reilly, I. Bartomeus, R. Winfree, Native bees buffer the negative impact of climate warming on honey bee pollination of watermelon crops. Glob. Chang. Biol. 19, 3103–3110 (2013).
5. I. Bartomeus et al., Climate-associated phenological advances in bee pollinators and bee-pollinated plants. Proc. Natl. Acad. Sci. U. S. A. 108, 20645–9 (2011).
6. N. M. Williams, J. Regetz, C. Kremen, Landscape-scale resources promote colony growth but not reproductive performance of bumble bees. Ecology. 93, 1049–1058 (2012).
Cooperators
- (Researcher)
- (Researcher)
Research
Obj. 1 Use population genetics to estimate bumblebee nest density in agricultural landscapes.
Study System – My study system consists of 15 highbush blueberry Vaccinium corybosum L. farms. Blueberry acreage ranges from <0.5 ha to 3.6 ha with a median field size of 1.1 hectares. Land cover in the region is spatially heterogeneous; residential exurban areas and small-scale agriculture are interspersed with second-growth forests dominated by maple (Acer spp.), birch (Betula spp.) and beech (Fagus grandifolia). Agriculture in the region is a mix of pastureland and grain production, along with smaller fruit and vegetable operations. Few farms (n=3) in our study stock hives and reliable pollination for Vermont berry growers is therefore largely dependent on native bee visitation.
Study Organism – The common eastern bumblebee Bombus impatiens is an abundant and important native pollinator of highbush blueberry. It is one of 10 bumblebee species that are responsible for 70% of observed visits (Nicholson et al. 2017). It is also very abundant at farm sites throughout the state, with B. impatiens specimens composing 15% of our previously collected specimens. Bombus impatiens queens emerge in the early spring and forage until sufficient resources have been gathered to establish a nest. After nest establishment, Bombus queens switch to worker production and start producing genetically similar sister-workers who perform all foraging activities for the nest. In our observations of blueberry we typically start to observe workers foraging at the beginning of June; I therefore concentrated our collection effort during this time.
Genetic Sample Collection – I collected B. impatiens workers in the first two weeks of June. From the center of each farm, I searched for bumblebee workers in the area of a circle with radius 300 m. I divided the circle into quarters, and search each part for 15 min to maximize the detection of unique colonies present on each farm. I immediately marked and store collected specimens in 100% ETOH to preserve DNA. I collected specimens until 120 individuals or 6 hours of collection time were reached. This sampling effort is similar to those in reported literature and should be a sufficient amount of genetic material (Drs. Shalene Jha and Jamie Strange, personal communication).
Molecular Methods – I extracted DNA using a Chelex protocol. I used simple sequence repeats (SSRs) for B. impatiens in a multiplex reaction at 10 polymorphic microsatellite loci (B96, B124, BL11, BL15, BT10, BT28, BT30, BTERN01, BTMS0062, BTMS0081). I genotyped specimens with polymerase chain reactions (PCR). PCRs runs were 10 L in volume and contained 2 μL of template DNA, 1.4 mM MgCl2, 0.6 mM of each dNTP, 0.4 U of Taq polymerase, and <0.2 μM of four primers (forward primers labelled with VIC, NED, FAM and PET dyes, Applied Biosystems®). Samples were denatured at 95 °C for 3:30 min, followed by 31 cycles of 95 °C for 30 s, 55 °C annealing for 75 s and 72 °C for 45 s; followed by a final extension step at 72 °C for 15 min. I visualized PCR products on an ABI 3730xl capillary DNA sequencers at the Utah State University Center for Integrated BioSystems using an internal size standard (GeneScan LIZ 500, Applied Biosystems®). I scored fragment sizes using Geneious® version 10.0.
Estimating Nest Density – Based on individual’s multi-locus genotypes I estimated the number of nests at each site using maximum likelihood sibship reconstruction in COLONY version 2.0 (Carvell et al., 2012; Lepais et al., 2010; Wang, 2004). I carried out a medium run with full‐likelihood precision and a conservative genotyping error rate of 5% based on our results of regenotyping 10% of randomly selected individuals and scoring errors. I assumed a monogamous mating system for males and females, therefore allowing the assignment of full‐siblings. To ensure convergence of results in the sibship reconstructions, each site was analyzed three times, each with a different random number seed, and I took the average number of unique nest groups.
Obj. 2 Identify landscape pattern and farm practices that explain differences in wild bee communities and nest density between farms
Landscape Classification – I used the 2011 National Land Cover Dataset (NLCD 2011) to quantify landscape composition and configuration within radii of 1000 m and 2000 m centered on each blueberry field. All fields in this study are at least 1 km apart. To determine landscape composition surrounding each farm, for each radius, I quantified the proportion of natural area, here defined as the combined area of wetlands, grasslands, shrub and scrublands, mixed forests, deciduous forest and evergreen forest.
Farm Management Quantification – We quantified differences in farm management by creating an agricultural intensity index that included measures of pesticide use, mowed area and grain crop area. To quantify pesticide use across farms, we adapted the environmental impact quotient (Kovach et al., 1992) to develop a pesticide use index based on known impacts to bees. Pesticide use indices have been used with multiple arthropod taxa (Dormann et al., 2007) and this approach is well documented for native bees (Park et al., 2015). We obtained pesticide identity and use information directly from farmers for each managed crop, and if precise application rates were unknown we used the regionally suggested rates for each reported crop. We further captured differences in agricultural intensity by quantifying the extent of grain crops (corn and soy) and mowed areas on and adjacent to study farms. Rather than arbitrarily weight management variables based on perceived impact to bee populations, we scaled each variable from 0 to 1 and reduced these continuous variables through principle componen ts analysis (PCA). We use the first principle component score (45% of the overall variation), scaled from 0 to 1, as our agricultural intensity index (AII).
Pollinator observations – I sampled each farm at least three times during four weeks of blueberry bloom, under suitable flight conditions for bees (clear to hazy skies, temperature above 15 °C, and wind speeds less than 3 m/s). For each farm sample, I selected 4 bushes haphazardly from among those in bloom. At each bush, I observed pollinator activity within a 1m2 frame of flowering branches for 10 min. I recorded the number of individual bees that visited at least one flower, and the number of flowers each individual visited. Identifying bees consistently is difficult on the wing, so I assigned observed individuals to 8 morphospecies groups. From these pollinator observations, we estimated the mean visitation rate on each farm. We defined visitation rate as the number of flower visits/1 m2 /10 min. Following each observation period, we sampled pollinator diversity via 10-min aerial netting along one 20-bush transect at each site. Transect walks provided bee species richness data, while observations measured bee abundance and the potential supply of pollination services.
Statistical Analysis – I perform all statistical analyses in R v.3.3.1 (R Development core Team 2015). We used linear mixed effects models to analyze the effect of landscape composition and configuration, farm management and their interaction on nest density, average native bee visitation rate, abundance and diversity. We included year as a random effect in all models. For each main model, we constructed a null model with all fixed effects variables removed and compared AIC values between the two models. As a goodness-of-fit measure we calculated a log likelihood ratio test between fitted and null models. To compare the influence of visits by different morphospecies groups on pollen limitation, we fit exponential models for each group independently (analogous to Fig. 1A), using seed set as the response variable.
Obj. 3 Evaluate pollination services for a perennial berry crop
Pollinator supplementation Experiments – To estimate the magnitude of pollen limitation, I conducted pollen supplementation experiments. In a subset of nine study farms, I randomly selected 10 blueberry bushes of the same variety (Bluecrop) and of similar size, branching pattern, and age. Preceding bloom, I selected four branches that were similar in sun exposure, length and number of flower clusters. I assigned each branch randomly to one of two treatments: “open pollination” to measure production under ambient pollination; and “hand pollination”, with supplemental pollen applied to flower stigmas by hand. I then counted the number of unopened flowers on each experimental branch. Approximately 1 month later I counted the number of fruit on clusters to determine proportion fruit-set. I collected berries from clusters as they ripened and brought them to the lab to be weighed. Comparison between hand and open-pollinated flower clusters allowed for estimation of the amount of fruit set and yield attributable to insect visitation.
Per Farm Yield Estimation – During the 2016 summer field season I extended our yield experiments by determining per farm yield estimates. On each of the 9 farms included in the pollen limitation study I selected another 10 Bluecrop bushes. On each selected bush, I counted the number of fruit bearing branches. I then randomly selected four branches and count all immature fruit on each branch. I then counted the number of bushes per farm. I calculated per farm estimates of yield as: (berries/branch) • (branches/bush) • (bushes/farm). This value is an estimated number of berries per farm, which I converted into kg using an empirically determined average berry weight.
Economic Analysis – I estimated economic effects of pollen limitation on blueberry production, by comparing expected yields under conditions of ambient and full pollination. I defined yield deficit (Yd) as the yield expected under full pollination (as estimated by hand treatments), minus yield under ambient pollination conditions (as estimated by open treatments):
Yd =((berry/ha )×((FSh/FSo ))×Mh)-((berry/ha )×Mo)
where Mh and Mo are the average berry weight from hand- and open-pollinated treatments for each farm, respectively, and FSh and FSo are the average fruit set from hand- and open-pollinated treatments for each farm, respectively. I converted kilograms of berries into revenue by multiplying mass by the price reported by the 2015 NASS New England Fruits and Vegetables Report ($7.48/kg)
Statistical Analysis – We used mixed effect models with wild bee visitation as a fixed effect and year as a random effect. To explore the shape of each relationship, we fit both linear and negative exponential (i.e., Limitation = a * e (−b * Visits)) models. We then compared each model to a null model with the fixed effect of wild bee visitation removed, using log-likelihood ratio tests (following a χ2 distribution). To compare the influence of visits by different morphospecies groups on pollen limitation, we fit exponential models for each group independently (analogous to Fig. 1A), using seed set as the response variable.
Obj. 1 Use population genetics to estimate bumblebee nest density in agricultural landscapes.
I reprocessed 10% of individuals because they failed to express fully at all loci. I removed BL15 because this loci did not amplify well, leaving nine loci for analysis. I then retained samples only if data were available from a minimum of six microsatellites. After reprocessing samples and cleaning data, genotyping success was high (96% of 1790 individuals retained), yielding 113 samples on average per farm, not including the two sites with < 130 samples (64 and 82 individuals were analyzed).All farms contained sister pairs of B. impatiens workers. From the distribution of resampled colonies per site at the subset of nine sampled farms, I found on average 70% of workers belonged to colonies with a single representative. The average estimated number of nests per site was 76 ± 2.8.
Obj. 2 Identify landscape pattern and farm practices that explain differences in wild bee communities and nest density between farms
I observed native bee visitation to assess the supply of pollination service provided to blueberry growers. Across 15 farms, 84 wild bee species were observed visiting highbush blueberry, almost a third of bee species recorded in Vermont. I found that native bee communities responded consistently to landscape pattern at the larger spatial scale, and bee visitation rate (r2 = 0.51, P < 0.001), abundance (r2 = 0.55, P < 0.001) and estimated species richness (r2 = 0.31, P < 0.001) increased with the proportion of natural area at this scale (Fig. 1).
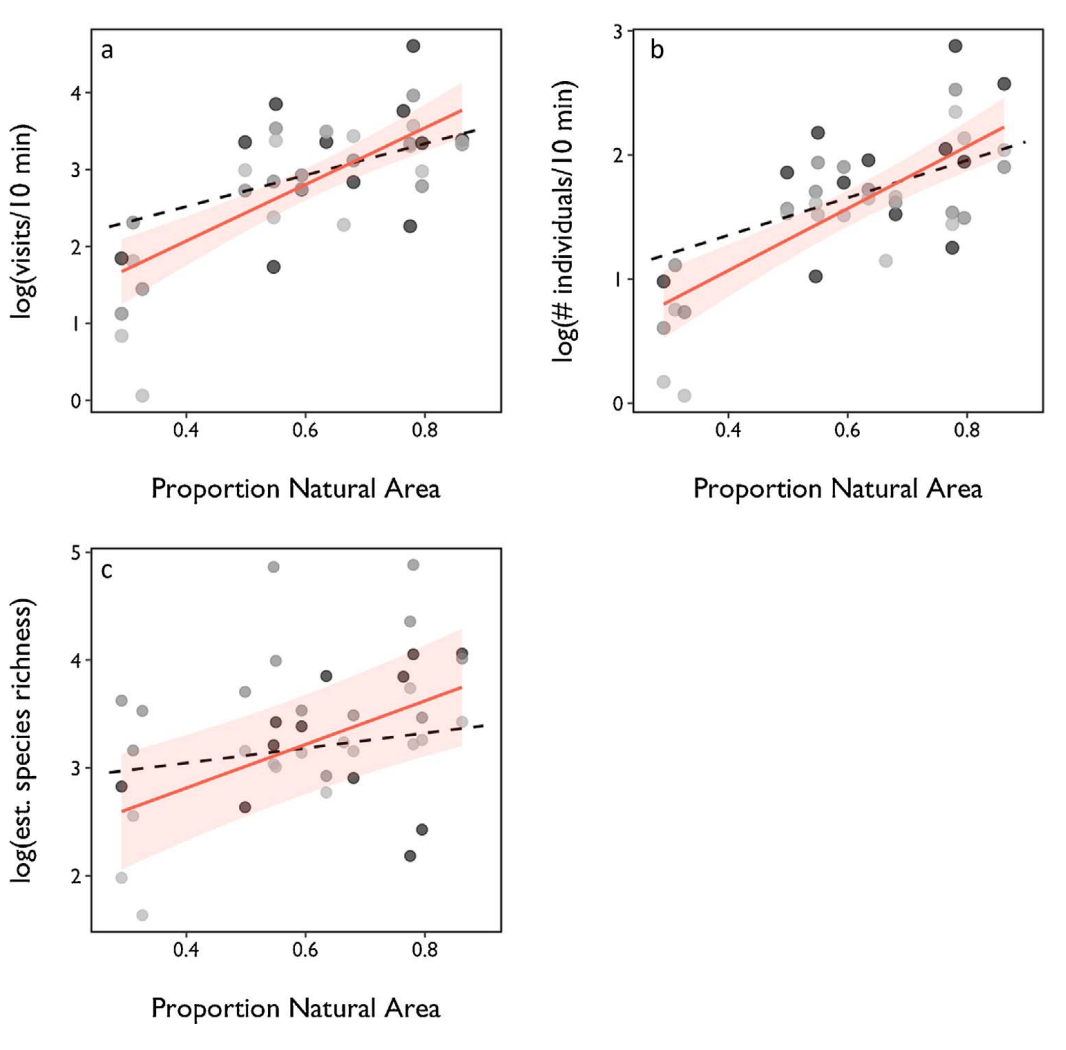
Fig. 1 Effect of proportion natural area on native bee (a) visitation rate (b) abundance and (c) species richness. Points and model fit with 95% confidence intervals for the amount of natural area at the 2000 m scale shown for each of three sampling years (red line and shading). Model fit (black dashed line) for 1000 m scale is also depicted (points not shown). Results are from mixed effects models with year as a random effect. (For interpretation of the references to colour in this figure legend, the reader is referred to the web version of this article.)
Wild bee visitation (r2 = 0.19, P = 0.004), abundance (r2 = 0.16, P = 0.011) and species richness (r2 = 0.14, P = 0.018) declined with increasing agricultural intensity. Moreover, bee communities and the pollination services they provide are influenced by interactions between local management and landscape pattern. I found a significant interaction between our AII and proportion natural area on visitation rate (7.44 ± 2.29 (interaction slope estimate ± standard error), t = 3.25, P = 0.002), native bee abundance (3.42 ± 1.51, t = 2.26, P = 0.030) and estimated species richness (6.166 ± 2.15, t = 2.86, P = 0.007). I visualize this interaction as a surface of predicted visitation, abundance and richness values bounded by a convex hull containing all observed combinations of proportion natural area and AII (Fig. 2).
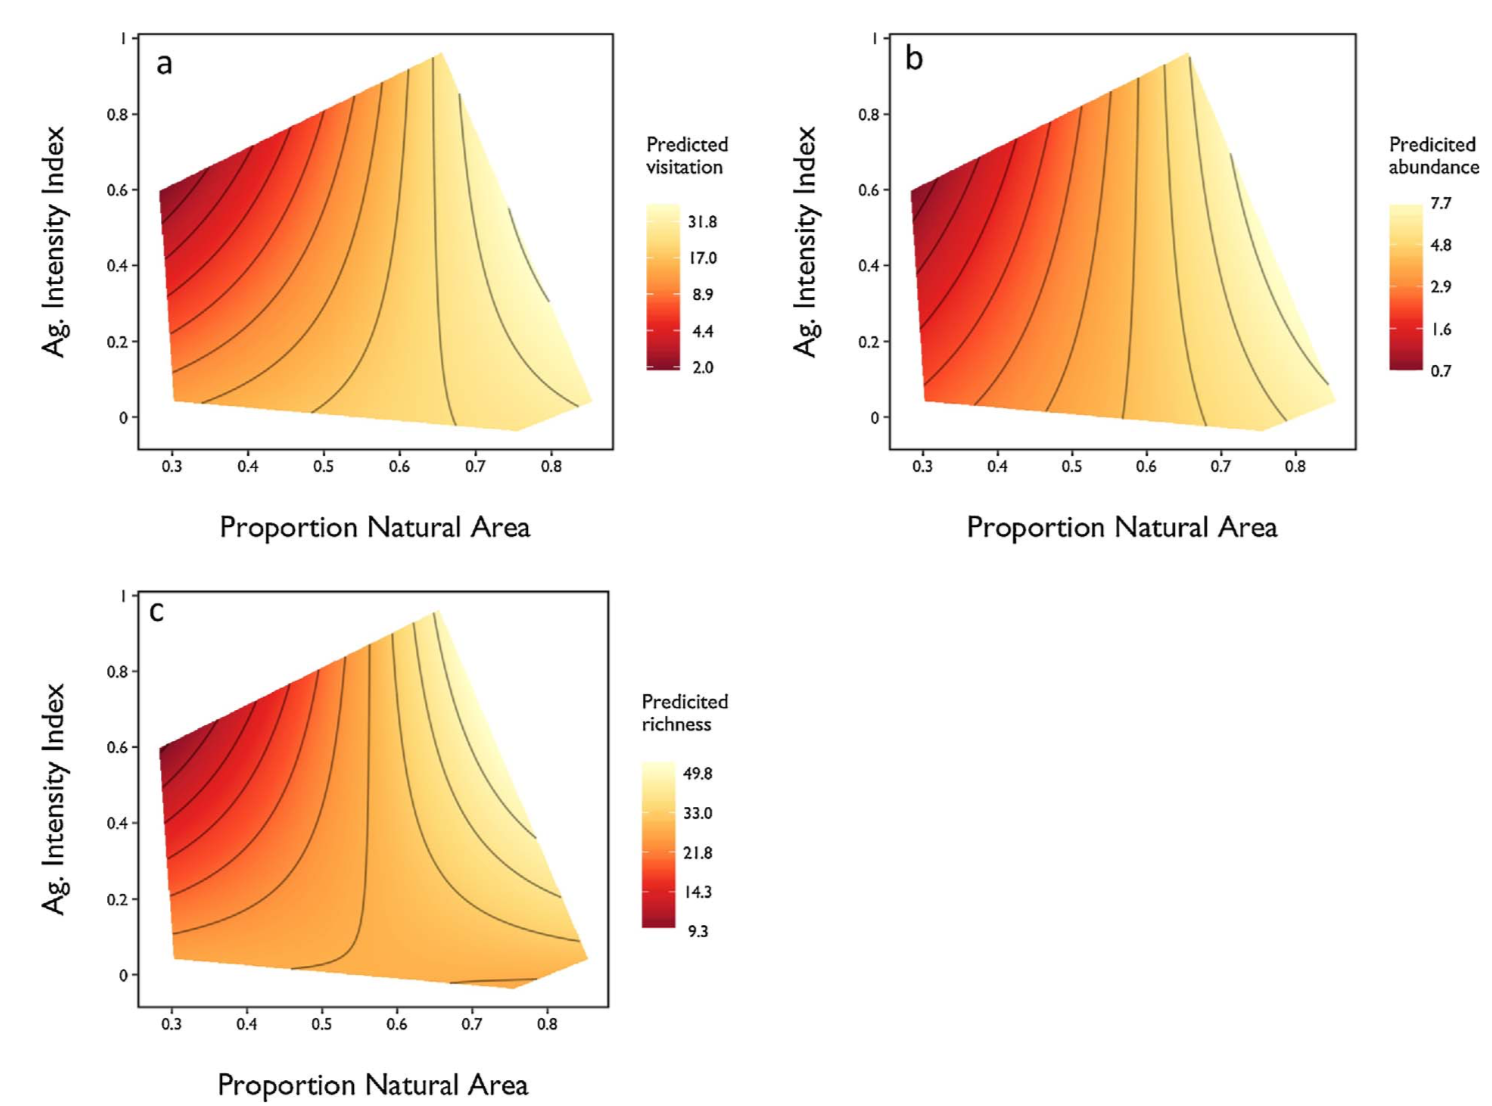
Fig. 2 Response of native bee (a) visitation, (b) abundance and (c) estimated species richness to the interaction of agricultural intensity and the amount of natural area within 2000 m of farm sites. Data are fitted values derived from final mixed effects models and log-transformed. Contour lines indicates areas of similarity.
For the subset of nine blueberry farms where colony density estimates were performed I did not observe a strong relationship between proportion natural area (1km: t = -0.24, P > 0.05; 2km: t = -0.25, P > 0.05) agricultural intensity (t = -1.07, P > 0.05), or their interaction with estimated nest density (1km: t = 1.41, P > 0.05; 2km: t = 1.16, P > 0.05) (Fig. 3).
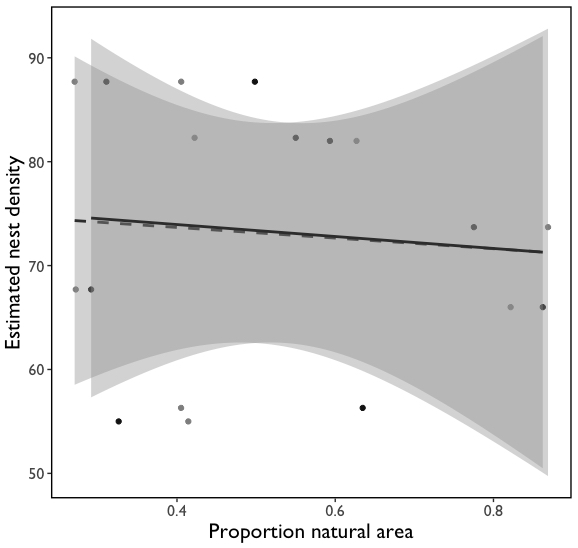
Fig. 3 Effect of proportion natural area on Bombus impatiens nest density. Model fits are for 2000 m (black points; black line) and 1000 m scales (gray points; dashed line).
Obj. 3 Evaluate pollination services for a perennial berry crop
Blueberry production improved with increasing visitation by wild bees. Pollen limitation for seed set diminished exponentially as bee visitation increased (Fig. XX), and pollen limitation for fruit mass and fruit set diminished linearly as bee visitation increased (Fig. 4).
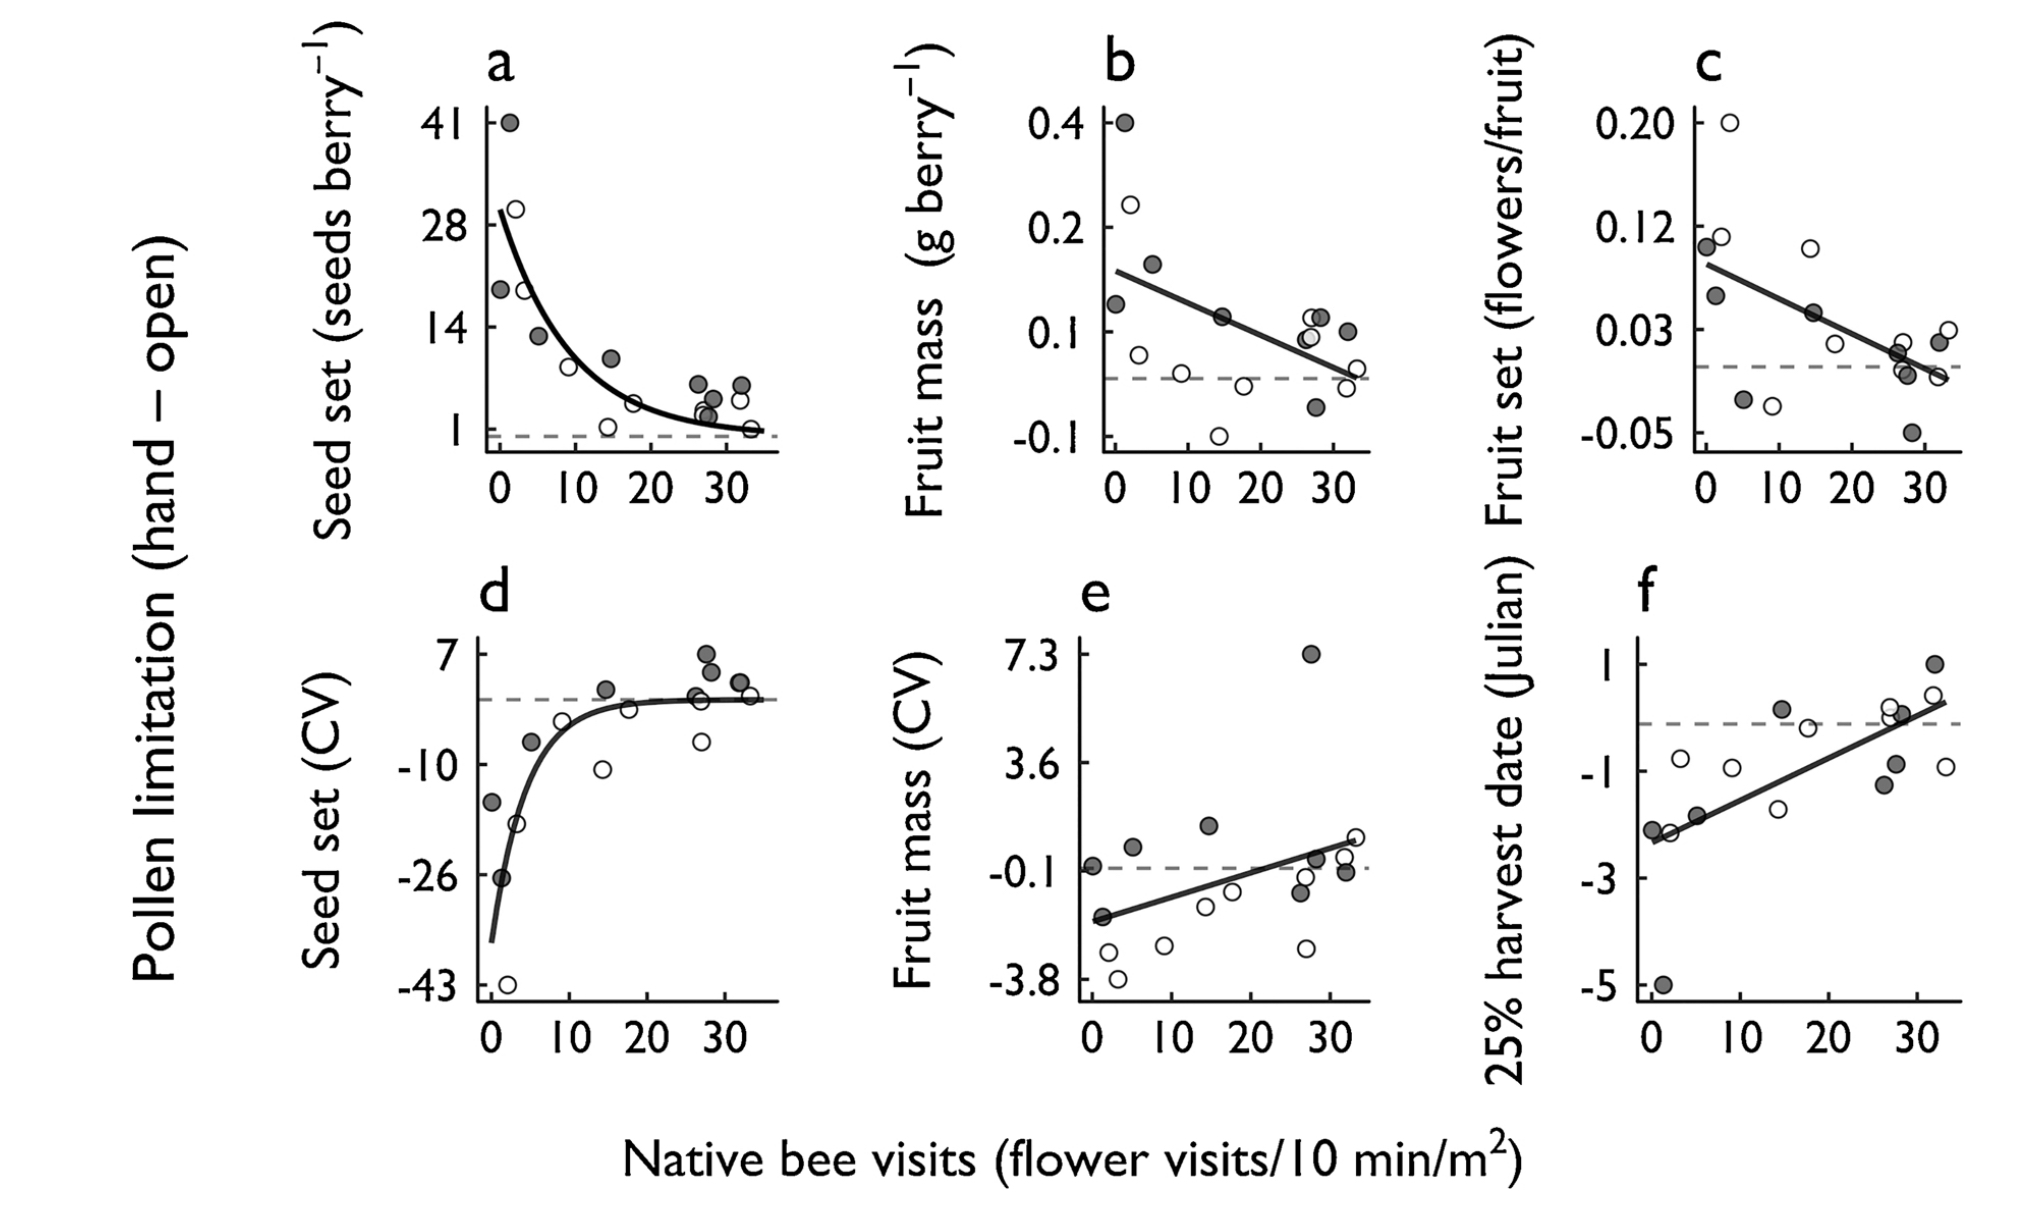
Fig. 4 Effects of wild bee visitation on pollen limitation for blueberry production and quality. Panels depict pollen limitation (i.e., hand pollination treatment – open treatment) for six key variables. A: Seed set; B: Fruit mass; C: Fruit set; D: coefficient of variation (CV) of seed set; E: coefficient of variation (CV) of fruit mass; F: date on which 25% of berries had been harvested. White symbols: 2014; grey symbols: 2015. Dashed horizontal lines indicate no pollen limitation, where open and hand treatments are equivalent. Curves are fit to pooled data from both years. All curves fit data significantly better than null models (Log-likelihood ratio tests); exponential curves are presented if they fit data significantly better than linear fits (Log-likelihood ratio tests).
We find that visitation rates by “Bombus (queen)” and “Black bees (big)” are most strongly related to reductions in pollen limitation (Fig. 4). “Bombus (worker)”, “Black bees (slender)”, and “Black bees (tiny)” also show significant negative exponential relationships (Fig 5).
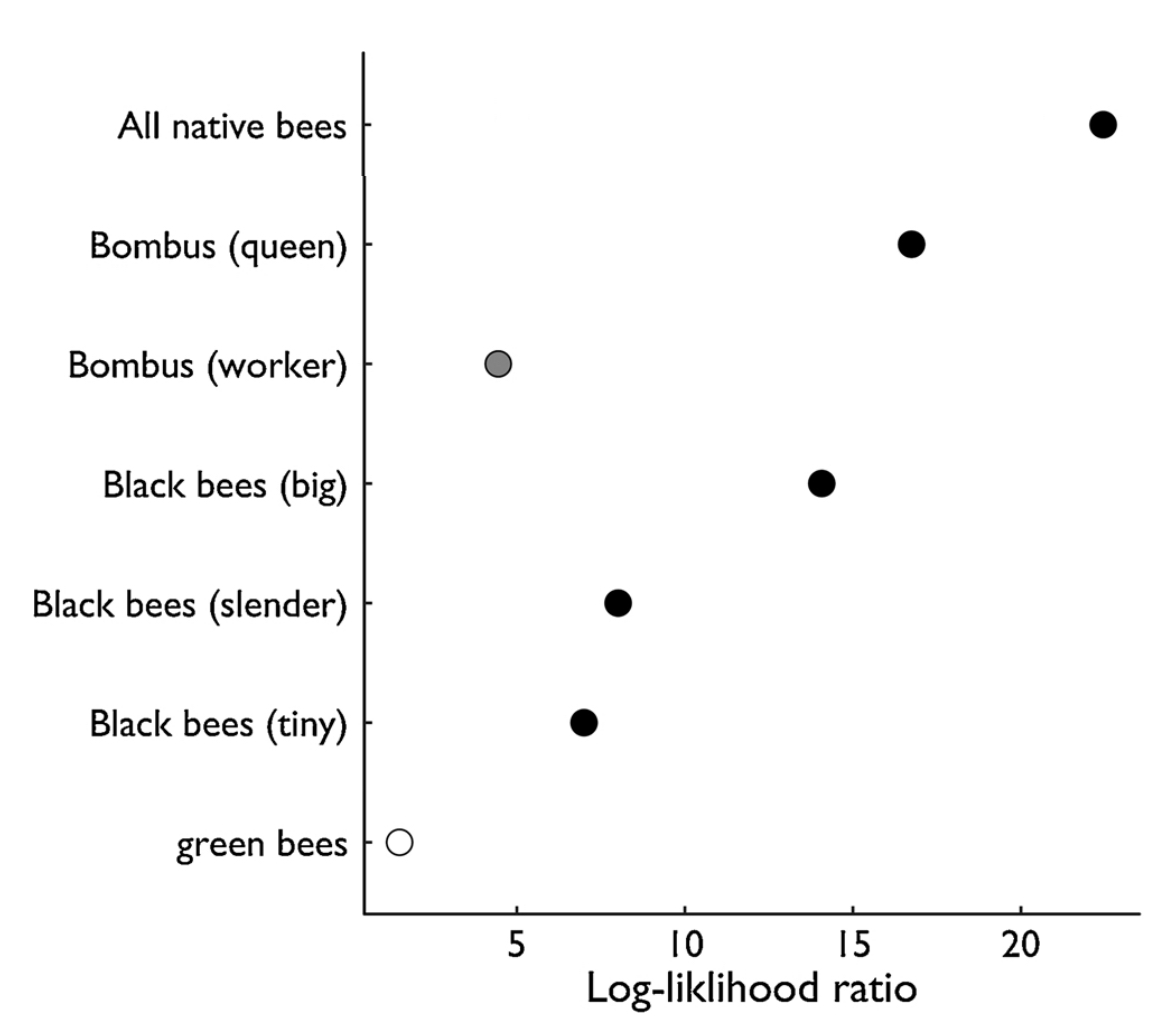
Fig. 5 Relationships between seed set and different bee groups. Symbols represent the fit of exponential models relating pollen limitation on seed set to visitation rate for each morphospecies group. Fit is measured with log-likelihood ratios comparing exponential and null models (see methods). Open symbols: ns; grey p < 0.05; black: p < 0.01.
Farms also varied widely in the economic effects of pollen limitation on yield. we estimate that pollen limitation reduced yield, and therefore revenue, between 1% (on Farm #6) and 36% (on Farm #9) (Fig. 6). Farms also varied widely in baseline yield (i.e., assuming open pollination treatment), due to differences in densities of bushes/ha, canes/bush, and berries/cane. At Farm #9, for example, high baseline yield combined with a large pollen limitation resulted in an expected loss of annual revenue of almost $137,000. We estimate more modest costs for other farms: from $461 on Farm #6 to $27,722 on Farm #3.
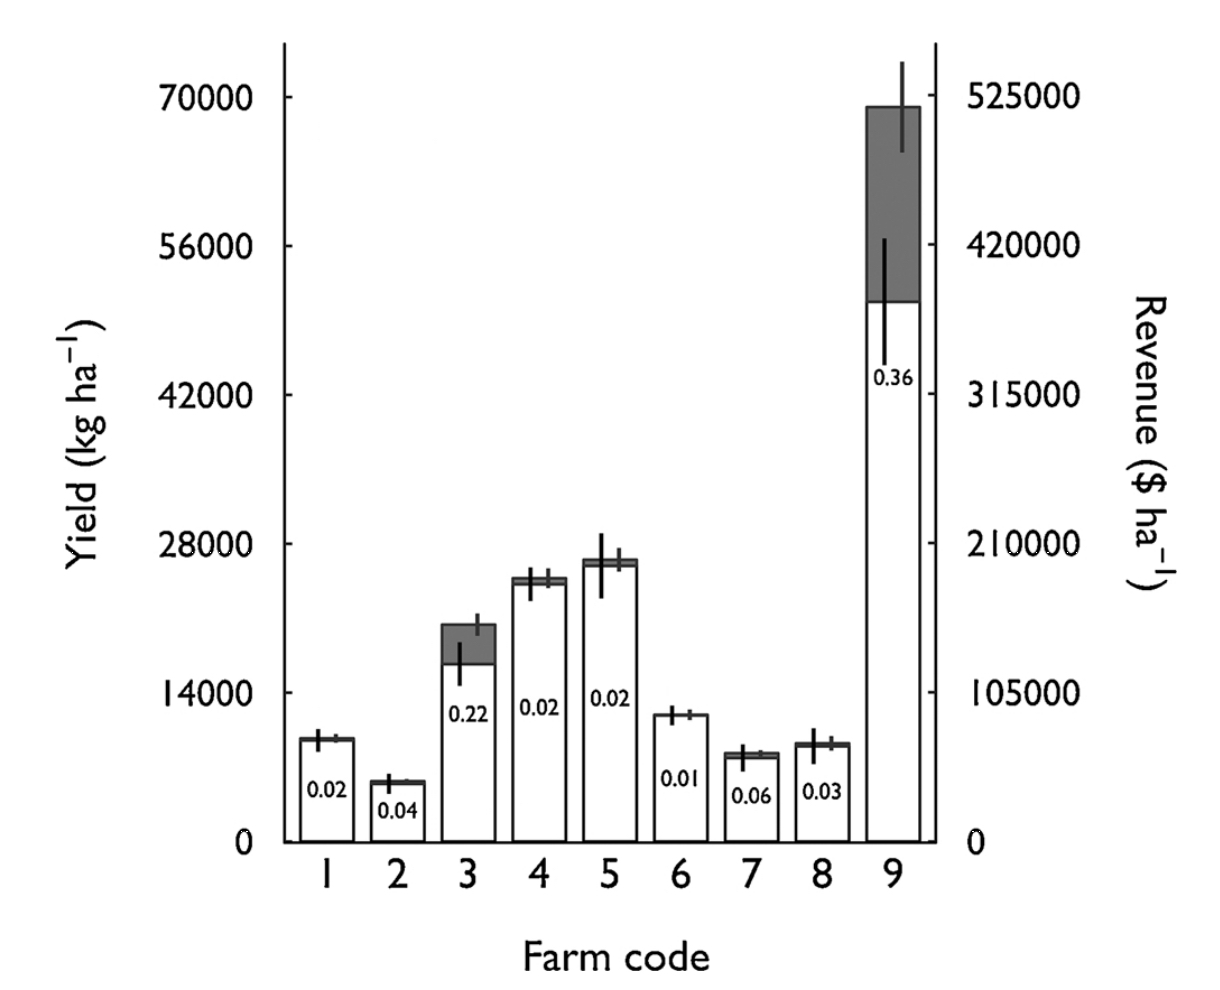
Fig. 6 Effects of pollen limitation on blueberry yield and revenue for each farm. Yield estimates combine fruit set and fruit mass effects. White bars represent potential yield with ambient pollination (i.e., open pollination treatment). Grey bars represent added yield expected if pollen limitation is eliminated (i.e., hand pollinated treatment). The ratio of grey to white bars is the proportional increase expected (indicated by the number within each white bar). Error bars represent +- 1SD and are calculated independently for ambient and deficit portions of bars. White bars vary among farms due to differences in planting density, pruning, and other management factors.
We do not observe a significant effect of nest density on metrics of pollen limitation (seed set, fruit mass, ripening time etc.) or yield (yield deficit: t = -1.11, P > 0.05; Fig. 7).
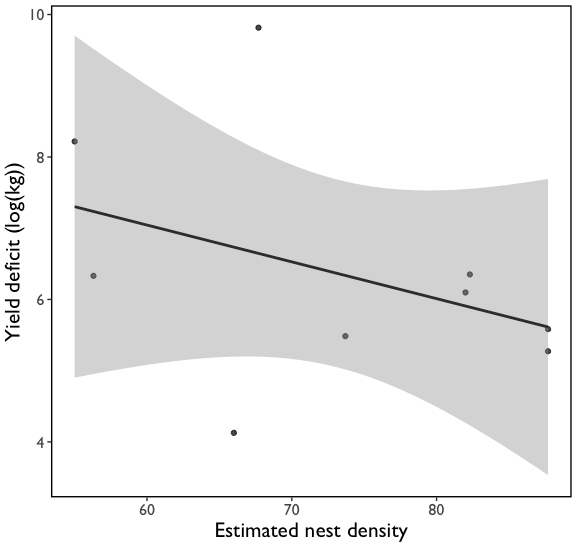
Fig. 7 Effect of Bombus impatiens nest density on blueberry yield deficit.
Bee diversity, abundance and visitation were higher on farms where less intensive practices were employed, and were positively correlated with proportion of natural area in the surrounding landscape. Moreover, farm management and landscape pattern interact such that the negative effects of intensive agriculture on native bee communities are compounded by landscape simplification.
I did not observe an effect of management or landscape pattern on nesting density. Unlike community level variables, population measures (e.g. nest density) may be more influenced by local scale patterns and processes, such as floral resource availability. Research using population genetics has shown that colony density changes between spring and summer, and that nest survival between these periods is influenced by the availability of local floral resources (Goulson et al., 2010). Other works shows that floral resource availability improves inter-annual survival of bumblebee colonies, with a greater survival of family lineages in landscapes with a greater proportion of spring floral resources (Carvell et al., 2017). Future analyses should examine the importance of temporally sustained floral resources for bumblebee nesting density.
Our findings indicate that wild pollinators are important to blueberry production, affecting both the quantity and quality of crops. Visits by wild bees lead to higher yields, more uniform berries, and faster ripening times. The magnitude of pollen limitation varies widely among farms, however, as does the economic benefit of alleviating it. Conserving wild pollinator communities within working landscapes can therefore improve bottom lines for farmers, but these improvements will benefit some farmers more than others.
Specifically, I found that visits by wild bees also improved fruit uniformity and ripening time. The relationship for uniformity of seed set was strong and exponential, showing a clear and saturating biological response to pollination. Uniformity of fruit mass also improved with wild bee visits, but showed a linear and weaker relationship. Berry uniformity can influence market price, with a premium placed on large and consistent berries (Gilbert et al., 2014). Visits by wild bees also advanced harvest by roughly 2 days for the most pollen limited farms. Harvest timing can be important to growers to lengthen harvest season and reach markets earlier (Klatt et al., 2014). A difference of two days is unlikely to have a substantial economic effect in this case, but it is evidence that pollination affects more than yields.
We did observe that visitation by most morphospecies groups significantly reduced pollen limitation (Fig. 4), visitation rates by two groups in particular showed the strongest effects: “Bombus (queens)” and “Black bees (big)”. These species were the most frequent visitors to blueberry flowers (Nicholson et al., 2017) and are known to be among the most effective at transferring pollen.
I did not find a strong relationship between Bombus nest density and yield. This result underscores two important aspects of pollination services research: visitation rate is a better predictor of pollination change and pollinator diversity is important for yields. Our other findings show that visitation rate is a strong predictor of various metrics of blueberry production. The fact that we did not observe a strong relationship with the nest density of a single species and blueberry production is also not surprising given research showing that crop pollination is best supported by diversity of species.
Education & outreach activities and participation summary
Participation summary:
In March 2019 I organized and hosted a berry farmer information exchange at UVM. Over 20 farmers and berry growers were in attendance. The Gund Institute's Taylor Ricketts gave opening remarks on pollinator conservation and sustainable agriculture in Vermont. I presented results from our research into wild bee community ecology and pollination economics. Emily May from the Xerces Society presented on establishing pollinator habitat and what agricultural programs (e.g. EQUIP, SHIP, CRP) can support planting efforts.
This work was highlighted in public press articles, UVM news and on local television. Part of this work was also featured in an UVM Extension across the fence video, which can be viewed here:
https://www.youtube.com/watch?v=PDNQl42p4U8
Two related academic articles have been published from this work (Nicholson_2017 Nicholson_Ricketts_2019)
Project Outcomes
This research sheds light on a central issue in agricultural sustainability: can management actions simultaneously support farm productivity and biodiversity. My results show the economic importance of managing agricultural landscapes to support wild pollinators. I found that pollinator visitation increased with increased natural land cover surrounding farms, reduced intensity of farm management, and the interaction between these factors. I then showed that these increased pollinator visits can improve the quantity and quality of crops and can increase revenues. I did not find similar relationships with nesting density, however, underscoring the importance of assessing pollination services at the community-level, rather than at population-levels.
I gained several new skills and deepened my awareness of issues around measuring populations in agricultural settings. The molecular techniques I used to estimate nest density were a set of new methods for me, as I have never genotyped organisms at this scale before. I was greatly aided by many of the undergraduates I mentored over the course of this project and by colleagues, specifically Drs. Tripodi and Strange. I can imagine using these new skills to ask more questions about how agricultural management affects populations. I think this is an exciting research frontier as well because to date crop pollination research has largely focused on how groups of bees species (i.e. communities) respond to land use, less is known about effects on populations of individual species. I look forward to leveraging the data gained from this research to answer further population-level questions.
On an academic note, two related publications have coincided with my progress on this project. The first (Nicholson et al. 2017 Agriculture, Ecosystems & Environment) has established the analyses necessary to answer the questions proposed in Objective 2. The second (Nicholson & Ricketts, 2019 Agriculture, Ecosystems & Environment) develops the methods and analyses necessary to complete Objective 3.
I have also gained valuable collaborators directly as a result of the opportunities provided me by this NE-SARE grant. My time at the USDA-ARS Logan “bee lab” was incredibly valuable; I expanded my network of bee researchers and learned how my data fits into larger national assessments of bumblebee population genetics. With graduate students at other land grant institutions I will be involved in a project that explores the drivers and impacts of bumblebee nest density across three important growing regions of the US.
While our results indicate the economic benefits of enhancing pollination, any economic decision must compare benefits to costs. Restoring flower strips, nesting habitats, or hedgerows will bear establishment costs (e.g., soil preparation, seeding), maintenance costs (e.g., weeding, mowing), and opportunity costs (i.e., revenue that could have been earned from that same land). Estimating these costs for Vermont farms is beyond the scope of this study, but restoration costs in Michigan blueberry farms have been estimated at roughly $2400 over five years (Blaauw and Isaacs, 2014). For all but one of the Vermont farms studied here, expected benefits of relieving pollen limitation for five years exceed these costs. Because both costs and benefits are likely to vary widely among farms, farm-specific studies and recommendations are needed to best inform decisions.