Final report for GNE17-142
Project Information
Spring bees are an important component of biodiversity in agricultural landscapes and, in our study region, essential pollinators for high value crops like tree fruit. Many farmers, landowners, and conservation practitioners are increasingly interested in how farmland can be designed and managed for wild bees. However, accessible guidelines are very sparse for growers on how and where to implement pollinator practices in terms of abiotic and biotic factors at both local and landscape scales. At 33 sites in the Finger Lakes region of New York, we used a comprehensive plant survey paired with two years of wild bee collections and topographic and land use information to study how wild bees respond to multiple dimensions of site and landscape quality.
Through this study, we learned that landscape quality strongly influences wild bee communities, even in relatively complex, mixed use landscapes like our study region. The landscape surrounding a site also determined which site-level variables were correlated with higher bee abundance. Based on the larger landscape context, it is essential to identify which type of local management will be the most beneficial. Growers and land managers have limited ability to influence landscape quality, but tractable changes to site-level management of nesting and floral resources can increase wild bee abundance. Through continued dialogue with farmers, we expect our research will inform more successful management of wild bees to support both crop pollination and biodiversity on and around farms.
To develop clear guidelines that farmers can use to design optimal pollinator habitat, we selected 33 sites in the greater Ithaca region, New York across forest, agricultural, wetland, successional, and developed habitat typical of Northeast US agricultural landscapes. Within each of these sites, we completed Objectives 1-3.
- Assess plant species abundance, richness, and floral area (to be completed with existing data from collaborators)
- Document bee species abundance and richness.
- Measure soil moisture, fertility, and organic matter content.
Using the data from these objectives, we completed the following analytical objectives:
- Identify how biotic and abiotic factors define a 'quality landscape' for wild bees, including landscape floral area, landscape composition and configuration, insecticide risk, topography, and distance to water.
- Within low and high quality landscapes, determine the relative contribution of local abiotic factors, plant diversity, and site-level floral resources in explaining wild bee diversity and abundance.
My project focuses on integrating multiple abiotic and biotic factors to predict spatial patterns of wild bee biodiversity in agricultural landscapes. The purpose of this research is to 1) address fundamental knowledge gaps about drivers of wild bee diversity, specifically how the quantity and diversity of floral resources, proximity to water, and soil conditions interact to dictate wild bee diversity at local and landscape scales, and 2) formulate practical guidelines for farmers in implementing pollinator conservation plantings.
Biodiversity conservation is a fundamental tenet of sustainable and organic agriculture, both for its intrinsic value and the ecosystem services provided by a diverse flora and fauna. More than 90% of flowering plants and nearly 75% of major crops benefit from animal pollination. For many important pollinator-dependent crops in the Northeast, such as apple, pumpkin, watermelon, and blueberry, wild bees are more efficient pollinators than managed honey bees and are responsible for a majority of pollination services for these crops. Globally, higher wild bee diversity translates to higher fruit set of many pollinator-dependent crops, regardless of honey bee abundance.
In agricultural landscapes, adjacent natural and semi-natural habitats host a majority of the available plant species and provide crucial food resources (nectar and pollen), water, and nesting sites, as well as shelter from pesticides for pollinators. Loss of semi-natural habitat reduces floral and nesting resources available for bees, and loss of high quality nutritional resources decreases bees’ resilience to other stressors like pathogens or pesticides. The potentially synergistic effects of habitat loss/degradation and pesticide use means that agricultural landscapes can be high-risk environments for bees.
In response to these challenges, many farmers, landowners, and conservation practitioners are increasingly interested in how farmland can be designed and managed for wild bees. Indeed, farmers can receive government conservation payments for managing surrounding wildlife habitat and planting field borders, hedgerows, shelterbelts or wildflower meadows for pollinators. While there is some evidence that the recommended plant mixes can attract diverse bee communities, supplementing with specific plant species or mixes does not reliably improve pollinator outcomes.
Landscape context appears to be critical for determining if these plantings are successful: for example, the amount and arrangement of habitat in the landscape (heterogeneity and connectivity) is crucial for pollinator movement and access to resources, and is positively correlated with higher bee abundance and diversity worldwide. Studies in Europe found that ignoring the context surrounding pollinator plantings can decrease the benefits of these plantings so that there is no detectable difference between conservation and control sites.
Environmental context for pollinator conservation practices has typically been defined in terms of local plant diversity, landscape heterogeneity, and connectivity, but abiotic site conditions (such as soil quality) can also influence plant nutritional quality and pollinator visitation, and local water features provide important resources for bees. Thus, it is critical that conservation practices for pollinators take into account both biotic and abiotic context. However, accessible guidelines are very sparse for growers on how and where to implement pollinator practices in terms of abiotic and biotic factors at multiple scales. In my proposed research, I will identify the relationships among local abiotic factors, landscape context, and plant and pollinator communities to help create predictive models that can be used by land managers to optimize placement of new pollinator habitat.
Cooperators
- (Researcher)
- (Researcher)
- (Researcher)
- (Researcher)
Research
Objective 1: Plant species richness, abundance, and floral area was measured by Iverson et al (in preparation) in the greater Ithaca region, New York in 2015 and 2016. Iverson et al. surveyed 144 sites across 20 habitat types (including forest edge, dry oak forest, conifer and mixed forest, row crop, hedgerow, shrub wetland, emergent wetland, roadside ditch, etc.) that span 5 macro-habitat classes (forest, agriculture, wetland, successional, and developed). The number of sites for each habitat type ranged from 3-20 based on the plant community variability, with a median of 5 sites/habitat type. Plant communities were sampled with a half scale Modified Whittaker plot sampling design. This sampling method quantifies plant abundance as percent ground cover in 10 0.5m2 quadrats and species richness in a 500m2 plots. Iverson et al. also measured floral area for all species flowering at the time of each site visit. With multiple observations of each habitat type at different times of the year, Iverson et al generated a floral area database for all major flowering plant species within each habitat. By combining the empirical flora area data with plant flowering time drawn from regional flora references, they generated floral area curves for each site and habitat type.
From Iverson et al's floral area curves, we calculated seven metrics to summarize the floral resources at each site, season-total floral area, minimum floral area, maximum floral area, floral area coefficient of variation, and spring, summer, and fall floral area. We generated two versions of each floral area metric, one that represents the floral area of all plants, and the second that only includes plant species that interact with insect pollinators.
Objective 2: We measured bee species richness and abundance using 12oz. Solo polystyrene plastic cups as bee bowls according to the protocol of a long-term bee monitoring program in our region. We filled fluorescent blue, fluorescent yellow, and white bee bowls with 50:50 mix of propylene glycol and water and placed them at the height of dominant vegetation for 7-14 days of sampling. We arranged bee bowls in 100m transects in visible areas, alternating bowl color with 10 meters between each bowl, for a total of 9 bowls per site. We sampled wild bees at 33 field sites of 7 habitat types (forest, forest edge, floodplain forest, old field, roadside ditch, mixed vegetable farm, and apple orchard) that span a range of semi-natural to agricultural land use. From Iverson et al. plant sampling locations, we selected bee sampling sites based on landowner willingness to participate in our study and distance between sites. To ensure we were sampling independent bee communities at each site, We chose sampling locations that were at least 1km from all other sites, a distance greater than the mean foraging range of a typical mid-Atlantic wild bee community (Kammerer et al 2016).
We sampled bees in late April and again in mid-July, guided by peak floral abundance in forest, wetland, and successional habitat. During sampling we recorded the number of cup traps that were cracked, tipped over, or otherwise compromised at each site. We present all abundance results as bees per successful trap, to adjust for lower sampling effort at sites where traps cracked or fell over. After collection, bee specimens were stored in 70% ethyl alcohol solution until pinning and sorting. We washed, pinned and identified bee specimens, to species, when possible, with taxonomic assistance from collaborators, including Dr. David Biddinger (Penn State Center for Pollinator Research), and Dr. Rob Jean (Environmental Solutions & Innovations, Inc.). We sorted specimens in the Nomada bidentate group to morpho-species, as this group is poorly resolved in existing taxonomic keys. Also, we could not reliably identity to species some Lasioglossum specimens (n=50) which were damaged during collection or processing. We excluded these specimens from richness analyses that required species-level identification.
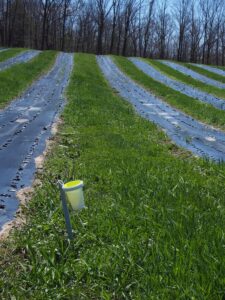
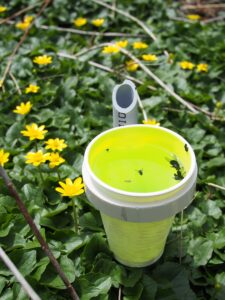
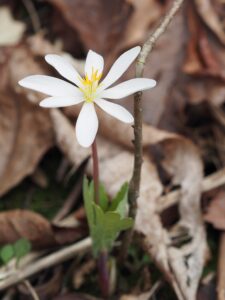
Figure 1: Left, a yellow bee bowl sampling bees at an organic vegetable farm. Center, wild bees captured in bee bowl at a floodplain forest site. Right, spring flowering bloodroot (Sanguinaria canadensis) in a forested patch within a crop farm.
Objective 3: In May 2018, we collected soils at each of the bee sampling sites. Along the bee sampling transect, we collected five soil samples with a bucket auger to a depth of 9-18 cm, depending on rock and moisture content of subsoil. Shallower soil cores (9-12cm) were taken at sites with very rocky or wet (floodplain habitat) subsoil due to sampling constraints. Also, wild bee nesting would likely be inhibited by very high rock content or completely saturated subsoils, so we considered the shallower sampling depth representative of the most favorable zone for soil nesting wild bees. At two locations along the bee transect, we collected three undisturbed soil cores (0-3 cm, 4-6 cm, and 7-9cm deep) with a slide hammer soil core sampler (Soilmoisture Equipment Corp, Goleta, CA) to quantify bulk density. Due to above described sampling constraints, we were only able to sample 2 bulk density soil cores deep at some locations, but the number of cores was recorded for each sample. Bulk density cores at all depths were combined for processing and analysis.
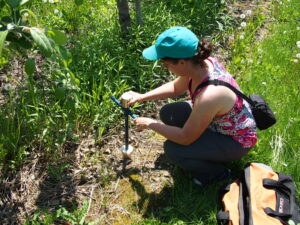
Figure 2: Kammerer Allen collecting a soil core to measure bulk density in an apple orchard near Geneva, NY.
After collection, we measured the wet mass of all soil samples, then dried them at 60 degrees C for five days, or until the mass did not decrease. We sent the bucket auger samples to the Penn State Agricultural Analytics lab and they measured pH, P, K, Mg, Ca, Zn, Cu, S, total nitrogen by combustion, percent organic matter, and percentage sand, silt, and clay via standard laboratory methods (https://agsci.psu.edu/aasl/soil-testing/soil-methods). We calculated soil bulk density of each sample as the total dry mass of bulk density cores divided by the volume of the sampling cylinder multiplied by the number of cores. To identify patterns across the 14 soil characteristics we measured, we used a principal components analysis. We conducted the analysis using the prcomp function in R on centered and scaled soil variables.
Objective 4: To describe the land cover surrounding our bee sampling locations, we used a high-resolution map of land cover in the Ithaca, NY region created by Iverson et al (in prep). Iverson et al utilized a regional 1m resolution dataset of land cover (Chesapeake conservancy) to differentiate impervious surface, trees, and low vegetation. Then, they resolved more detailed natural and agricultural habitats, by combining the Chesapeake layer with a regional natural habitat map (The Nature Conservancy Northeast Habitat map) and the USDA Cropland Data Layer (2018), respectively. They also added a 'roadside ditch' habitat class by creating a 3m buffer around roads in rural areas.
From this high-resolution land cover map, we calculated landscape composition and configuration within 1km of each of our sampling sites. We grouped similar land cover classes to form six metrics of landscape composition; percentage of the landscape in agriculture, forest, successional, wetlands, water, and developed habitats. We also calculated six metrics of landscape configuration to represent the aggregation, shape, and diversity of habitat patches around our sampling sites. Specifically, using the landscapemetrics package, version 1.4.2, in R, we calcuated edge density (ed), Shannon diversity of land cover classes (shdi), Simpson diversity of land cover classes (sidi), mean perimeter-area ratio (para_mn), variation in nearest neighbor distance (enn_cv), and interspersion and juxtaposition (iji) indices.
In addition to land cover metrics, we also calculated insecticide toxic load, distance to water, and topography, and included these factors in our analyses. To represent risk to wild bees from insecticide application to agricultural crops, we calculated the Douglas et al (in prep) insecticide toxic load index. We generated the Douglas et al (in prep) index using our high-resolution land cover maps and insecticide data from 2014, as this is the most recent year with a complete, publically-available national dataset of insecticide application. To differentiate riparian sites very close to water, we calcuated the minimum distance from our sampling locations to water (streams, rivers, ponds, or lakes). We used the National Hydrography Dataset (2019) for New York state to identify water features closest to our sampling sites. Lastly, we included topographic information to represent the micro-climate at each of our sites. We calculated elevation, slope, and aspect at each sampling site from the 1/3 arc-second (approximately 10m) resolution USGS National Elevation Dataset (2019). We conducted all geospatial data manipulation and analysis in the R statistical and computing language.
We used random forest machine learning models to identify the most important landscape variables and examine relationships between landscape variables and wild bee abundance. Random forest models are robust to correlated predictors and can represent complex, non-linear relationships, which we expected might occur in our dataset. We tuned random forest models using 10-fold cross validation repeated three times, varying the number of trees and variables at each tree split. We used the random forest model from the ranger package in R, tuned the model with the caret package, and generated accumulated local effects plots with the iml package to examine our results. Lastly, we identified 'low', 'medium', and 'high' quality landscapes by dividing the predicted bee abundance into three groups. We identified breakpoints in the predicted bee abundance using Jenks Natural Breaks classification in the BAMMtools package in R.
Objective 5: Like objective 4, here, we used random forest machine learning models to identify the most site variables within low, medium, and high quality landscapes in our dataset, and examine relationships between site quality and wild bee abundance. See Objective 4 for details of random forest implementation.
Objective 1: At 144 sites in the Finger Lakes, NY region, Iverson et al (in prep) documented 639 species from 325 genera and 107 plant families. From these data, combined with plant phenology information, we calculated site and landscape-level floral area over the growing season at each of our 33 sites. For all of the floral area metrics (total, minimum, maximum, coefficient of variation, and season-total floral resources), we found that site and landscape-level floral resources were not correlated (Figures 3 and 4). This indicates that locations with poor site-level floral resources are sometimes situated in landscapes with abundant resources (and vice versa). 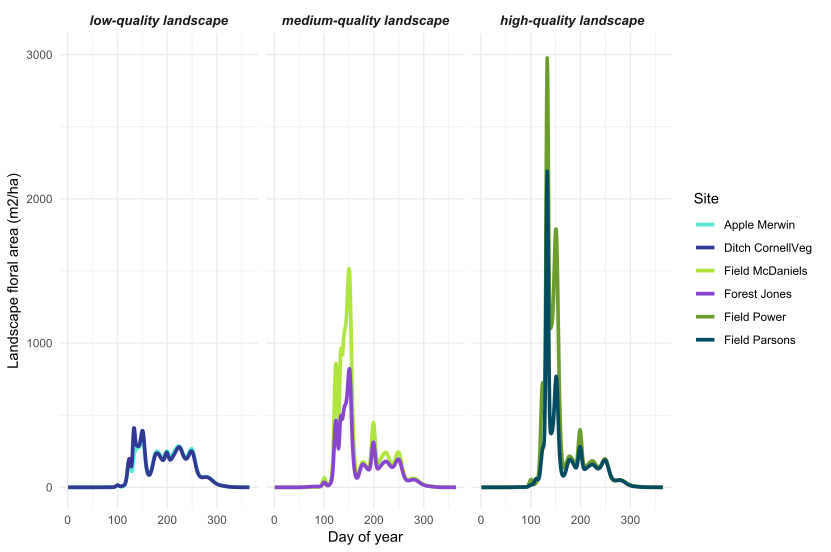
Figure 3: Landscape-level floral area over the growing season in the Finger Lakes, NY region. From a larger set of 33 sites, we selected two example sites in low, medium, and high quality landscapes (see Objective 4 for how we determined landscape quality).
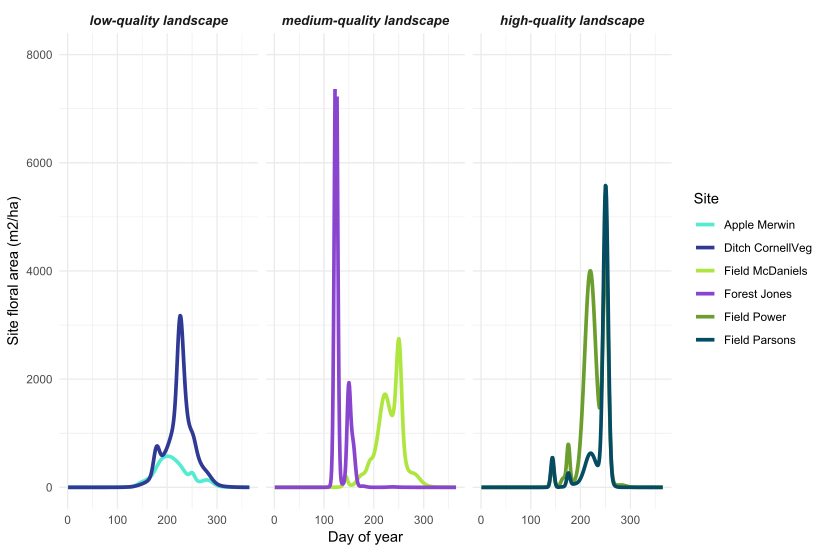
Figure 4: Site-level floral area over the growing season in the Finger Lakes, NY region. From a larger set of 33 sites, we selected two example sites in low, medium, and high quality landscapes (see Objective 4 for how we determined landscape quality).
Objective 2: In two years of sampling, we collected approximately 3000 wild bees. We are still identifying specimens, so these results area based on the 2318 specimens we have identified. For our random forest analyses, we used only specimens from the spring sampling periods, as these data were more complete than the summer collection. Most of the remaining, unidentified specimens are in the genus Lasioglossum, which were highly abundant during the summer months.
Of the 2318 identified specimens, we collected 1118 bees in 2018 and 1200 in 2019, with an average of 69.8% of the bees collected in the spring (although we expect this to decrease when we include all of the summer-sampled Lasioglossum specimens). We collected 85 species in 20 genera, with an average of 52 species sampled in spring and 33 during the summer. Andrena, Ceratina, and Lasioglossum were the three most abundant genera, which is largely driven by high abundance of Andrena carlini, Ceratina calcarata, and Lasioglossum leucozonium, the three most abundant species.
We observed substantial differences in wild bee abundance and richness among the habitat types (Figures 5 and 6). In the spring, old fields had many more bees than any other habitat types. After old fields, floodplain forests, roadside ditches, and remnant forests had the highest highest wild bee abundance. Similarly, in the spring, floodplain forests and old fields supported the highest number of bee species. However, species richness was less variable among habitats than abundance of wild bees. In the summer, bee abundance did not vary as much among habitat types. Of the seven habitat types we sampled, roadside ditches and mixed vegetable farms had the highest bee abundance in the summer. Interestingly, in the summer, old fields supported more species of wild bees than roadside ditches or mixed vegetable farms, even though these habitats had higher abundance.
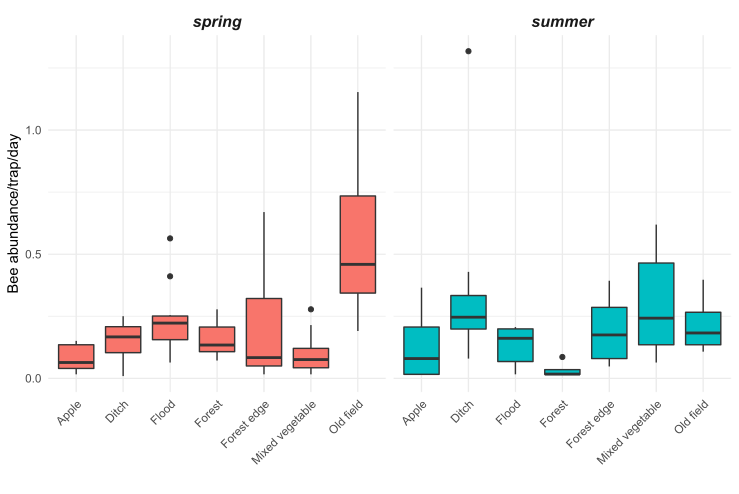
Figure 5: Bee abundance per day per trap at 33 sites of seven habitat types in the Finger Lakes region, NY.
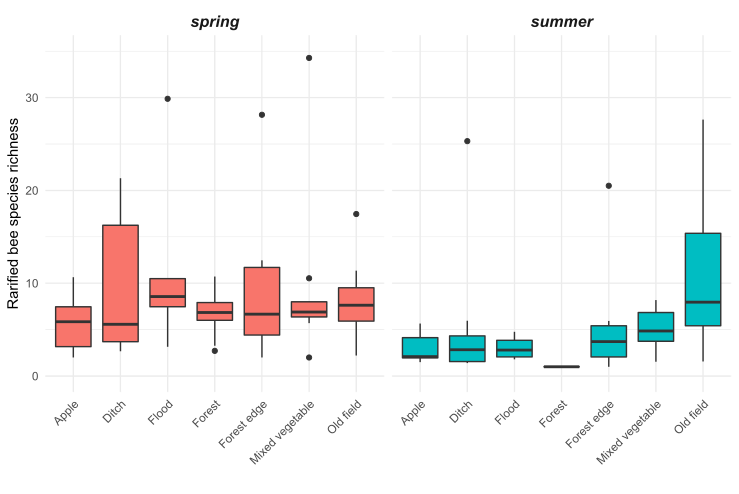
Figure 6: Estimated species richness of wild bees at 33 sites of seven habitat types in the Finger Lakes region, NY.
Objective 3: We found significant variation in soil characteristics between the site and habitat types we sampled. There were two main gradients in our soil dataset revealed by the principal components analysis (Figure 7). Explaining 27.5% of the variation in our soil data, the first principal component was correlated with soil texture (percent sand, silt, and clay). Roadside ditches had sandier soil than any of the other habitat types, except some floodplain forest samples. All of the other habitat types had loam to silt-loam soil. Interestingly, soil texture was highly variable between floodplain forests, with soil texture in this habitat encompassing the full range of texture classes represented at all other sites. The second principal component explained 19.5% of the variation in soil characteristics, and was associated with several soil fertility variables. Specifically, some vegetable farm and orchard samples had much higher potassium, phosphorus, copper, and zinc content than the other habitats, likely due to fertilizer or manure application to support crop growth. Forested sites were most highly correlated with higher total nitrogen in the soil, probably due to high organic matter content from leaf litter accumulation.
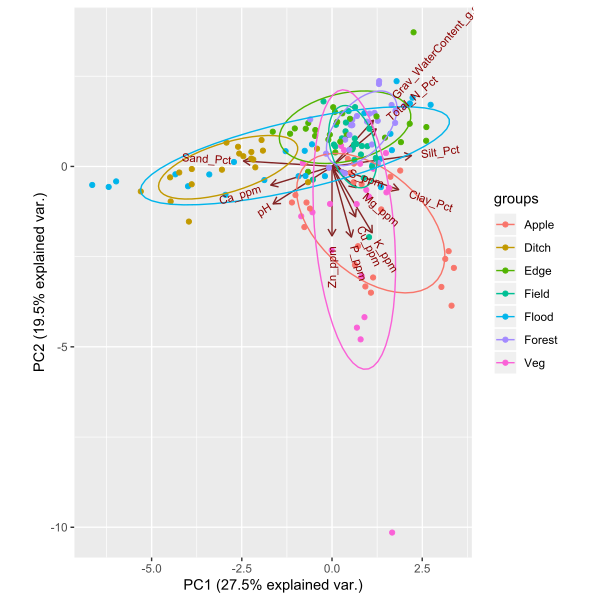
Figure 7: Principal components ordination plot of soil characteristics at 33 sites in the Finger Lakes region, NY. Sample colors correspond to the following habitat types: 'apple'= apple orchard, 'ditch' = roadside ditch, 'edge' = forest edge, 'field' = old field, 'flood' = floodplain forest, 'forest' = mesic upland remnant forest, and 'veg' = mixed vegetable farm.
Objective 4: Using only landscape predictors, including floral area, composition, configuration, distance to water, and topography, we were able to explain 45.2% of the variation among sites in spring abundance of wild bees. Of all 32 landscape variables that we evaluated, the floral area coefficient of variation (CV), percentage of the landscape in wetlands, and percentage of the landscape in water were the most important. These three variables alone explained 42% of the variation in spring bee abundance.
Wild bee abundance in the spring was higher at sites with a higher floral area coefficient of variation, or more variable floral resources in the landscape around the bee sampling location (Figures 8 and 3). High floral area CV was caused by very high peaks in spring floral area (Figure 3, high-quality landscapes), such that the floral area CV was highly correlated with maximum floral area. Even in high-quality landscapes, early season floral resources appear to be highly variable, with short bursts of flowering followed by dramatic declines in floral resources. But, wild bees present in the spring seem to be able to take advantage of even short pulses of flowers because sites with higher peaks in landscape floral resources had higher bee abundance. This result suggests that, even in the best landscapes, nectar and pollen produced by flowers does not far exceed the bees' ability to gather it. In other words, wild bee foraging potential is not saturated such that they cannot respond to large pulses of flowers.
We also found that bee abundance increased with more wetland and water area in the landscapes. The potential of plant communities in wetlands and around small water features to support wild bees has received little research attention. But, from our data, these habitats are among the most important semi-natural habitats for wild bee communities. We hypothesize that wetlands and the aquatic-terrestrial interface support wild bees by providing floral resources. Most wild bees in our region are ground nesting and do not nest in water-logged soils, so, at present, we do not think wetlands provide significant area for nesting.
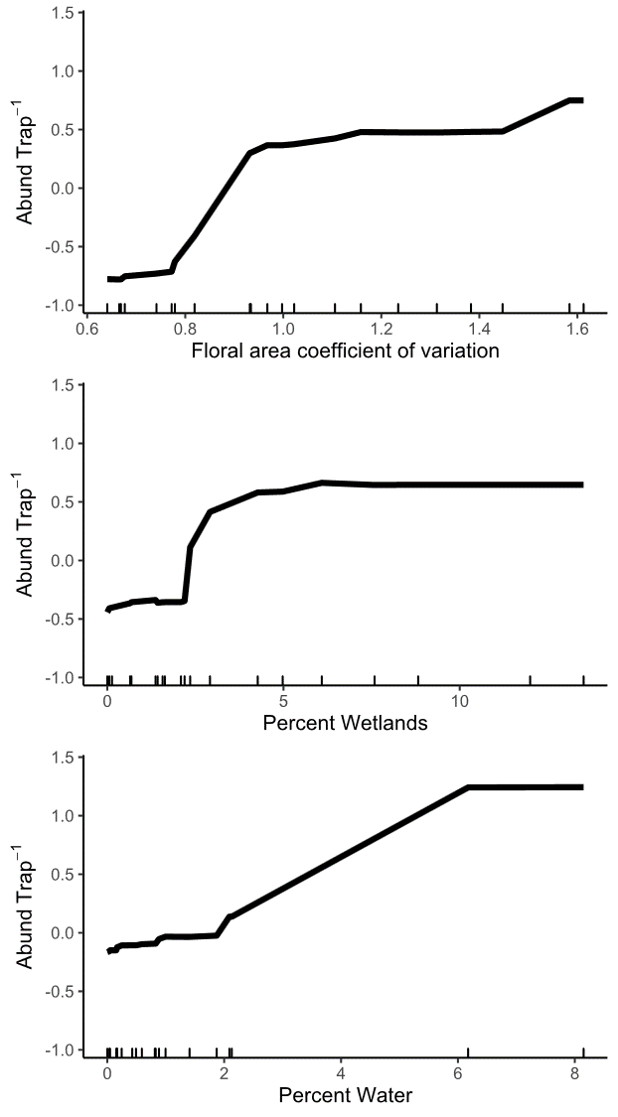
Figure 8: Relationship between wild bee abundance and the three most important predictor landscape variables identified by a random forest analysis. The y axis of all three panels shows the change in wild bee abundance per trap (mean abundance set to zero), rather than absolute abundance values.
Using the random forest model, we predicted wild bee abundance per trap and used these data to classify our sites as 'low', 'medium', and 'high' quality landscapes (Figure 9). Unfortunately, we had very few sites with high quality landscapes, so we combined medium and high quality landscape classes for Objective 5 analyses.
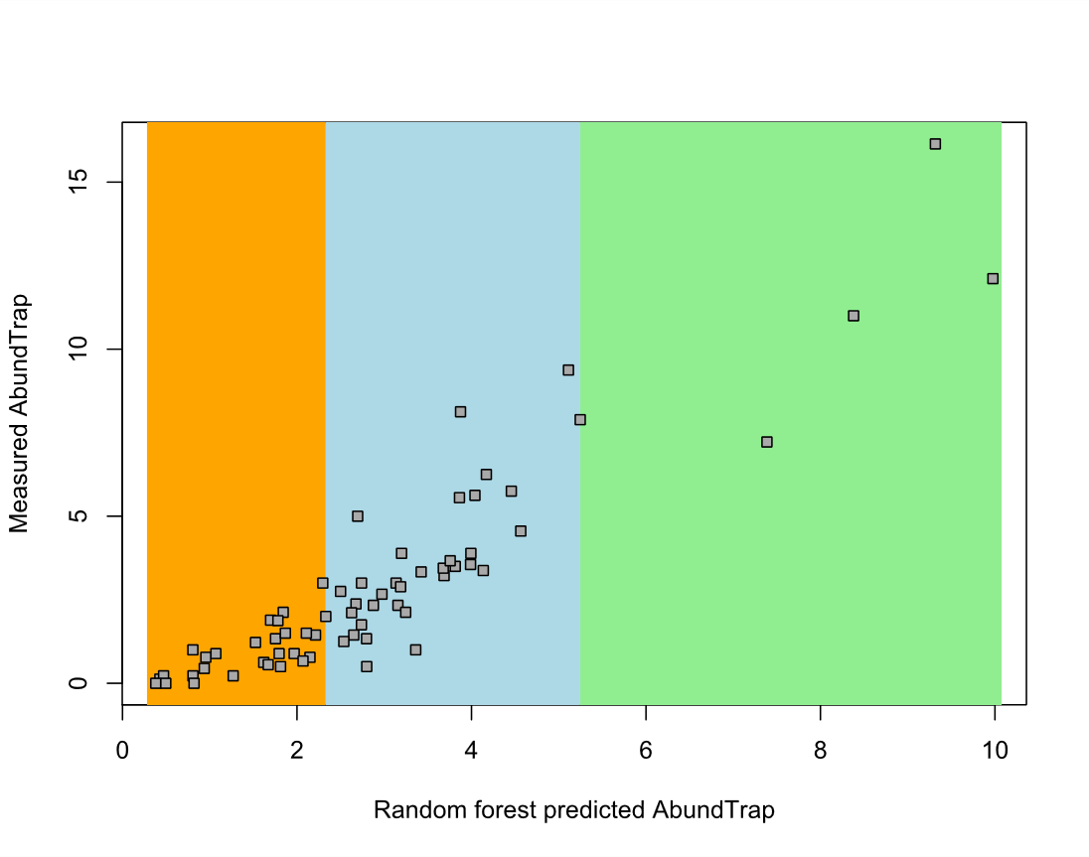
Figure 9: Wild bee abundance measured at 33 sites in the Finger Lakes, NY region vs. random forest-predicted bee abundance. The orange rectangle identifies sites that we classified as having a 'low' quality landscape, blue is 'medium' quality, and green is 'high' quality. We used these classifications to identify important site-level variables in low vs. medium quality landscapes (Objective 5).
Objective 5: When we analyzed site-level variables in low and medium quality landscapes, we found that the most important site characteristics vary depending on landscape context. In low quality landscapes, all three of the most important site-level variables were soil characteristics (Figure 10), but in medium quality landscapes, site floral area was correlated with wild bee abundance (Figure 11). Specifically, in low quality landscapes, wild bee abundance was highest when soil phosphorus levels less than about 25 ppm. Sites with siltier soil (greater than 30%) also had higher abundance of spring bees. We also documented a slight decrease in bee abundance with increasing pH, but do not consider the effect large enough to be biologically relevant. We hypothesize that soil characteristics are more important for wild bees in low quality landscapes because, in these locations, suitable nest sites are more limited. Some wild bees prefer to nest in looser, sandier soil, so a high-clay soil could inhibit nesting. High soil fertility can also shift plant community composition towards grasses and, for the remaining forbs, promote vegetative growth over flowering.
In medium quality landscapes, wild bee abundance increased with higher spring-total and maximum floral area available at each site. Interestingly, both of these floral area variables represent only insect pollinated plants, while the most important landscape-level metrics of floral area included flowers from all plants. We think this might indicate that, within landscapes of similar quality, wild bees are preferentially foraging on the high-quality plants we traditionally think of as 'insect pollinated.' This would lead to higher bee abundance at sites with more floral area of insect pollinated plants. But, in all landscapes, wild bees are using wind pollinated trees, likely because they provide such large amounts of floral resources when other flowers are scarce.
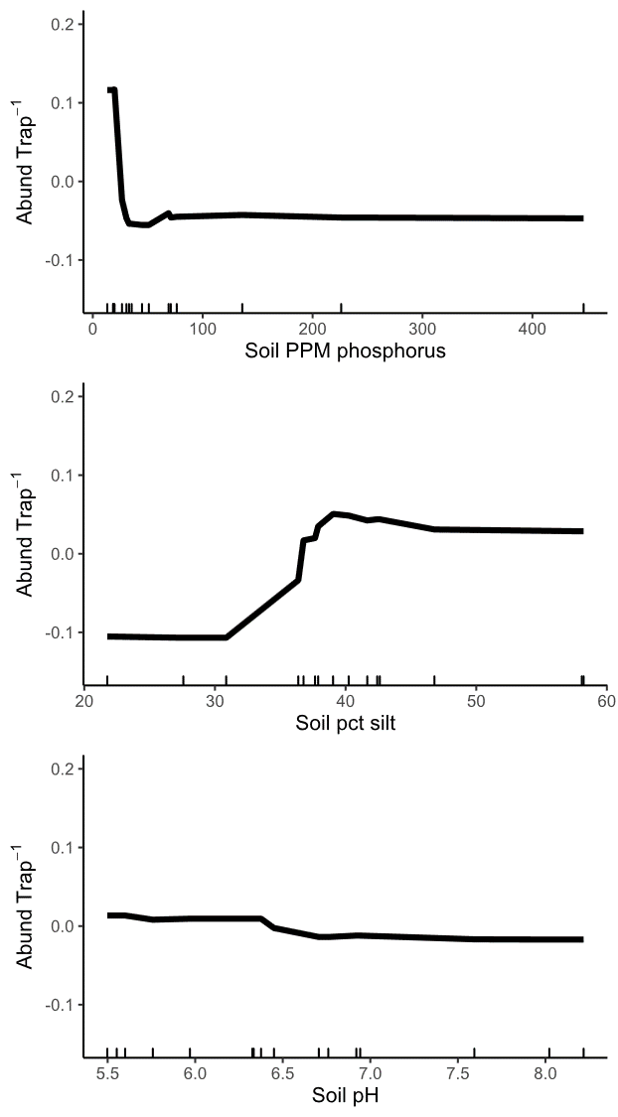
Figure 10: Relationship between wild bee abundance and the three most important site variables in low quality landscapes. The y axis of all three panels shows the change in wild bee abundance per trap (mean abundance set to zero), rather than absolute abundance values.
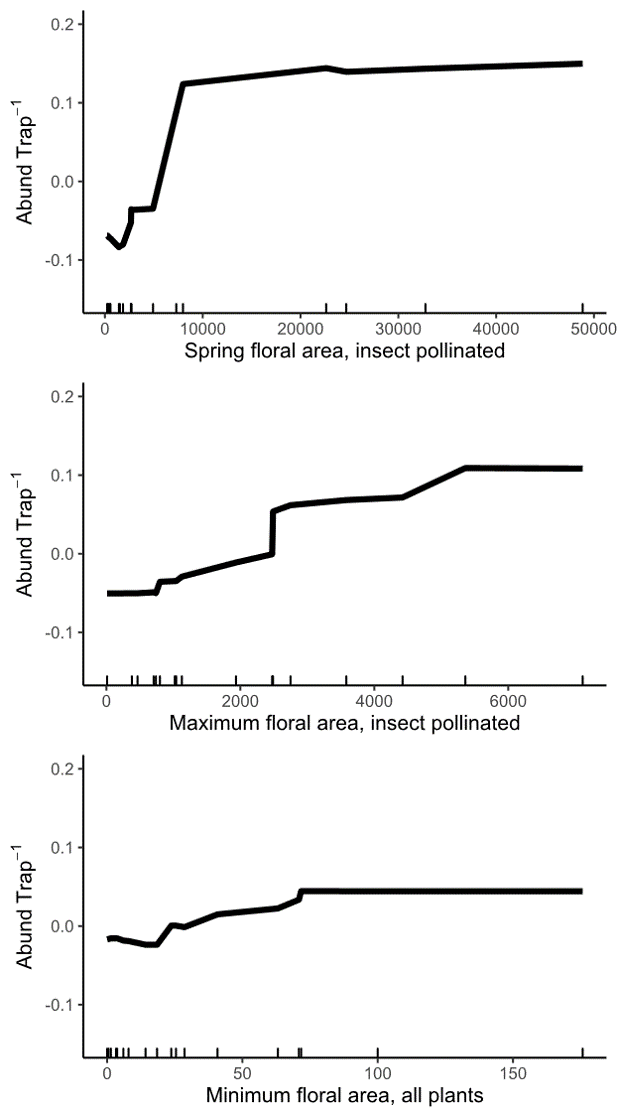
Figure 11: Relationship between wild bee abundance and the three most important site variables in medium and high quality landscapes. The y axis of all three panels shows the change in wild bee abundance per trap (mean abundance set to zero), rather than absolute abundance values.
Spring bees are an important component of biodiversity in agricultural landscapes and, in our study region, essential pollinators for high value crops like tree fruit. Through this study, we learned that landscape quality strongly influences wild bee communities, even in relatively complex, mixed use landscapes like the Finger Lakes region of New York, USA. Specifically, landscapes with significant area of spring flowering trees, wetlands, and water features supported more spring bees. The landscape surrounding a site also determined which site-level variables were correlated with higher bee abundance. In low quality landscapes, managing some areas for improved bee nesting is our best recommendation to increase the abundance of spring bees. Specifically, removing vegetation and avoiding excess fertilization of areas with silty or sandy soil are most likely to support spring bees. In medium to high quality landscapes, we recommend adding flowering plants to provide pollen and nectar resources. We discovered that site-level management of nesting and floral resources can increase wild bee abundance, but, based on the larger landscape context, it is essential to identify which type of local management will be the most beneficial.
Education & outreach activities and participation summary
Participation summary:
We are still analyzing results for this project, so have not yet included any specific results from this project in outreach presentations. However, we plan to target farmers and landowners, NRCS and Xerces conservation staff, and pollinator researchers through our interactive pollinator landscape assessment website (www.beescape.org), presentations at farmer and scientific society meetings, and peer reviewed publications.
One of the key outreach materials from this project will be a high-resolution landscape quality map for the Finger Lakes region, which will be incorporated into Beescape (www.beescape.org). To disseminate our research findings, we partnered with Azavea, a geospatial technology company based in Philadelphia, PA to create Beescape, an interactive web map that allows users to analyze the quality of their landscape for bees. During the first phase (2019-2020), Beescape is primarily for beekeepers seeking to compare the quality of the landscapes surrounding their apiaries, but in the second phase, we plan to expand the target audience to include farmers, conservation professionals, and landowners.
Beescape characterizes landscape quality for bees in terms of floral resources, nesting resources, and a novel pesticide index and makes these indices publicly available to beekeepers, farmers, researchers, or any other interested parties. During phase one, I generated all of the index maps on Beescape, and my research is guiding our work in phase two. The floral resource index currently included in Beescape is based on expert opinion assessments of habitat quality for wild bees. My research demonstrated that quantitative estimates of floral area based on high-resolution land cover data and field vegetation surveys are much better predictors of wild bee abundance. In the next phase of Beescape, we will use these results to update the floral resource index to be more relevant for beekeepers and land managers.
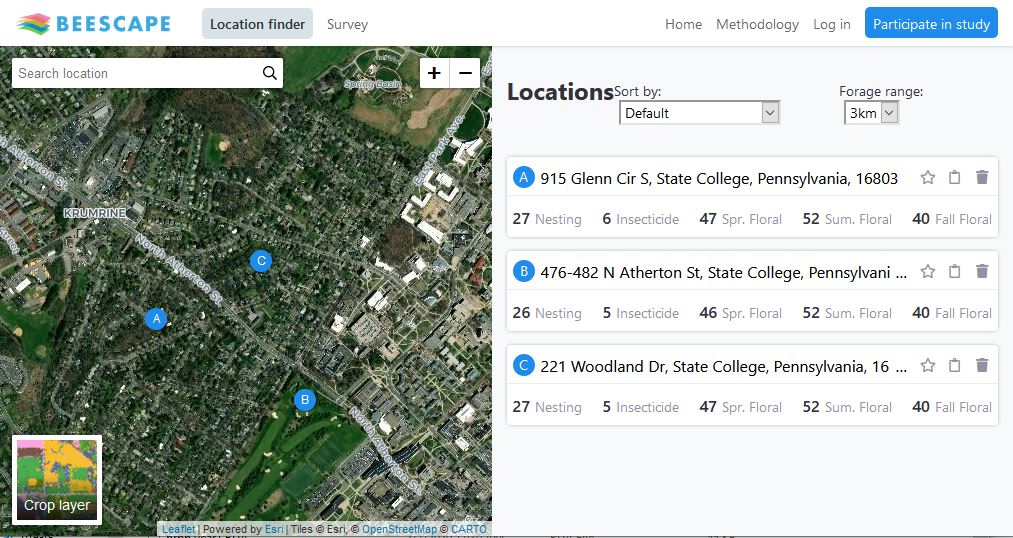
Figure 4: Screenshot of the Beescape (www.beescape.org) interactive portal
During year one of the project, I presented my work at the Penn State Center for Pollinator Research annual symposium and Pennsylvania Beekeepers Association Meeting in State College, PA. In year two, I presented at the US landscape ecology association meeting in Fort Collins, CO, International Pollinator Conference in Davis, CA and national Entomological Society of America meeting in St. Louis, MO. At the national Entomological Society Meeting, I co-organized and presented in a symposium on "How to speak for the pollinators: using big data to manage and conserve pollinator communities."
Project Outcomes
The U.S. National Strategy to Promote the Health of Honey Bees and Other Pollinators set a goal to restore or enhance 7 million acres by 2020, and federal agencies, farmers, and land owners need practical guidelines in deciding where and how to achieve this goal. The results of my research will be used to formulate best practices for farmers, conservation professionals, and researchers to design effective, site-specific conservation practices to support and restore diverse wild bee communities and pollination services in agricultural landscapes. For example, if my results support the expectation that sites close to water features have higher plant and wild bee diversity, choosing to preserve or enhance forest fragments surrounding streams would likely influence pollinator diversity more than conservation of similar forest patches without water. Effective guidelines for how to implement pollinator conservation will improve the return on investment for government conservation programs, supporting diverse wild bee communities essential for crop and wild plant pollination across the Northeast.
Through this project, Dr. Grozinger and I developed a new collaboration with some researchers at Cornell University and St. Lawrence University. Dr. Aaron Iverson, an assistant professor at St. Lawrence University conducted an extensive plant community survey across the Finger Lakes region surrounding Ithaca, NY. We have started collaborating with Dr. Iverson and Scott McArt at Cornell University and are surveying bee diversity at a subset of the sites where Dr. Iverson and colleagues quantified the plant community. This allows us to leverage an incredibly detailed, rich dataset of plant diversity and floral area across the greater Ithaca region to study how bee diversity responds to plant community characteristics as well as soil and local abiotic factors.