Final report for GNE17-148
Project Information
The Maryland Winter Cover Crop Program (MWCCP) subsidizes adoption of winter cover crops by farmers with over $20 million of funding per year. It is not feasible to evaluate the program by measuring biomass at every field enrolled in the program, so we conducted a pilot study to use remote sensing to estimate performance. This study consisted of joining two data sources: a database of enrollment in the MWCCP (provided by the Maryland Department of Agriculture) and satellite imagery biomass estimates.
Farms in Talbot County enrolled in the Program from 2005-2011 had their geospatial extents collected along with their management plans (n=9,384); these fields represented 85,273 hectare-years. Satellite imagery over this region was collected at two critical timings during winter: in December-January, representing fall growth and crop dormancy, and in March, representing spring growth prior to termination. The dormancy-onset estimate served as a surrogate for measuring soil N prevented from leaching into the Chesapeake Bay, which is the stated goal of the MWCCP. The at-termination estimate provided information about other ecosystem services that could potentially be provided by cover crops. A calibration dataset had been used to develop equations to predict cover crop biomass from the Normalized Difference Vegetation Index in the same region (n=224), through our collaboration with the USGS and USDA-ARS Remote Sensing Laboratory.
The calibration dataset contained 107 unique management factor levels (combinations of 6 categorical variables), while the remote imagery represented farms with 390 unique management factor levels. These factors were highly unbalanced, with many levels having less than 10 observations, while some levels had over 600 observations. Log-transformed linear models were used to estimate each coefficient and its standard error for the calibration dataset, which provided informative priors for the remote dataset. However, for factor levels that did not appear in the calibration dataset, a larger sample population (i.e. pooling multiple levels) had to be used for the prior, increasing the variance of the estimate. This procedure was conducted hierarchically, first pooling commodity program, then previous cash crop, then establishment method, then planting date category, and finally species (the final variable, sample timing, was always used). Using these priors, a Bayesian generalized linear mixed model was fit, using year as a random effect, and the management factors as main effects. Coefficients ranged from 64.1 to 2,453 kg ha-1 and explained over half of the variance in the raw data (median pseudo-R2: 0.538, 95%CI: 0.531-0.546).
Similar to the model used to estimate biomass, we also examined how the incentive structure provided by the MWCCP provides a return-on-the-dollar relative to actual performance. This model estimated N content in the biomass at winter dormancy, and estimates were then scaled by incentives paid, to represent kilograms of N prevented from leaching per dollar spent. This model explained about half the variance in the data (median pseudo-R2: 0.491, 95%CI: 0.482-0.499), with estimates ranging from 0.0163 to 0.2788 kg N $-1.
Our conclusion from these findings is that management decisions are not made randomly nor in a vacuum; growers choose cover crop management strategies that are compatible with their cash crop plans. Cash incentives thus may be a powerful tool for driving adoption of cover crops, but insufficient to change behaviors that are constrained by field conditions.
1) Connect existing datasets to develop a model that predicts cover crop biomass (as estimated from satellite imagery) based on agronomic management (as reported to the Maryland Department of Agriculture by farmers) as a function of thermal time (as calculated from historical weather data).
2) Develop a return-on-investment (ROI) index that scales cover crop biomass to the incentives paid to growers and evaluate each agronomic management category based on performance on this index.
Loss of nitrogen to ground water represents a significant water quality concern. Cover crops are one of the primary mechanisms for scavenging residual fall soil inorganic nitrogen and are being promoted in the Chesapeake Bay watershed to conserve water resources. Beginning in 2005, the Maryland Agricultural Water Quality Cost-Share Program has incentivized farmers to adopt cover crops through direct payments. Payments are structured in a tiered system whereby management affects payment (i.e., species choice, planting date and method, fertilizer source, and field history). State stakeholders are interested in quantifying the success of the program. A study area of farms was identified on the Eastern Shore of Maryland in Talbot, Queen Anne's, and Caroline Counties within the Choptank River Watershed; biomass was collected from 2005-2011 at two points each season: winter dormancy, and prior to cover crop termination. The farms in the study planted cereal rye (Secale cereale L., 23%), wheat (Triticum aestivum L., 46%), and barley (Hordeum vulgare L., 25%), with less than 6% of the study sites planting other cover crops, following corn (Zea mays L., 72%), soybeans (Glycine max (L.) Merr., 25%), or vegetables (3%). These data were used to calibrate vegetative indices for ongoing analysis of satellite imagery (2005-present), which is used to estimate performance of cover crops across those counties.
Cooperators
- (Researcher)
- (Researcher)
Research
The data were collected from two primary sources:
- satellite imagery at field-scale resolution, used to calculate cover crop biomass estimates from NDVI for Talbot County and some adjoining parts of the Lower Choptank River watershed
- enrollment database of the Maryland Department of Agriculture, listing management practices and geospatial references for each farmer in the program
A polygon of interest was identified on the Eastern Shore of Maryland, and all farms within that area that were enrolled in the Program from 2005-2011 were spatially digitized. Enrollment records listed their their management plans (n=9,384); these fields represented 85,273 hectare-years. Two sampling dates were targeted: in December-January, representing fall growth and crop dormancy, and in March, representing spring growth prior to termination. Satellite imagery was collected at each of these times each year of the study. Previous work generated a calibration dataset of paired imagery and ground-truthed biomass in the same area (n=224), which was used to predict cover crop performance from the Normalized Difference Vegetation Index. The calibration dataset represented 107 management factor levels (unique combinations of 6 categorical variables). The remote imagery collected for this study consisted of farms with 390 unique management factor levels. These factors were highly unbalanced, with many levels having less than 10 observations, while some levels had over 600 observations.
Log-transformed linear models were used to estimate each coefficient and its standard error from the calibration dataset, which provided informative priors for the remote dataset. A pooling procedure was conducted for factor levels that did not appear in the calibration dataset or were not recorded. For each variable that was unavailable, a larger sample population was used for the prior, consisting of all levels of that variable. This increased the variance of the estimate. This procedure was conducted hierarchically, first pooling commodity program, then previous cash crop, then establishment method, then planting date category, and finally species (the final variable, sample timing, was always used). These estimates were then used as Bayesian priors to fit a generalized linear mixed model. Year was coded as a random effect, and the management factors as main effects. Thermal time (growing degree days, for example) from planting to sampling was encoded into planting date category (fixed), and year (random), so it could not be examined independently as a variable.
Additional details and diagrams describing the methods used are shown in the poster linked below.
DavisBW_MarylandCoverCrop_Methods
The dominant species used in the program in Talbot County was winter wheat, representing ~80% of fields enrolled. A majority of fields were enrolled following corn (~58%) and soybeans (~38%). Planting dates were approximately evenly divided among the three payment categories of the program (Early, Standard, and Late). A majority of fields were planted using no-till drilling (~51%). The dominant method of termination was by herbicide application in the spring (~62%).
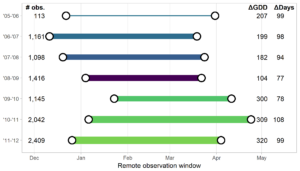
While the number of calendar days between sampling times were consistent at approximately 100 days each year, the number of accumulated growing degree days (base 4.4°C) between the winter and spring observations ranged from 104 to 320.
We found that the biomass data could be well-explained by a model that used 6 management variables as categorical factors, explaining over half of the variance in the raw data (median pseudo-R2: 0.538, 95%CI: 0.531-0.546). Coefficients for cover crop biomass ranged from 64.1 to 2,453 kg ha-1. However, there was a wide range of estimates for uncertainty in these predictions, where the span of the 95%CI ranges from 28.4 to 3525 kg ha-1.
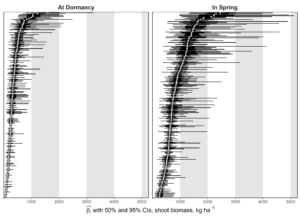
Table of biomass estimates and 95%CI for agronomic management categories (CSV)
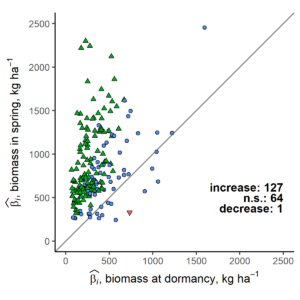
When comparing biomass coefficient estimates for the same combination of management factors between winter and spring sampling, we found that approximately 2/3 of them represented a significant contrast (i.e. growth occurred between winter and spring), while ~1/3 were not significant.
The model of N content in the biomass explained about half the variance in the data (median pseudo-R2: 0.491, 95%CI: 0.482-0.499). Coefficients ranged from 2.33 to 69.0 kg N ha-1, with the magnitudes of 95%CIs ranging from 1.14 to 134 kg N ha-1. When scaling these estimates by the cash incentives paid, we calculated a return-on-investment index representing kg of N scavenged per dollar spent on the program. Since the stated purpose of the program is to prevent N from leaching over winter, we only include estimates from the winter sampling event in the figure below.
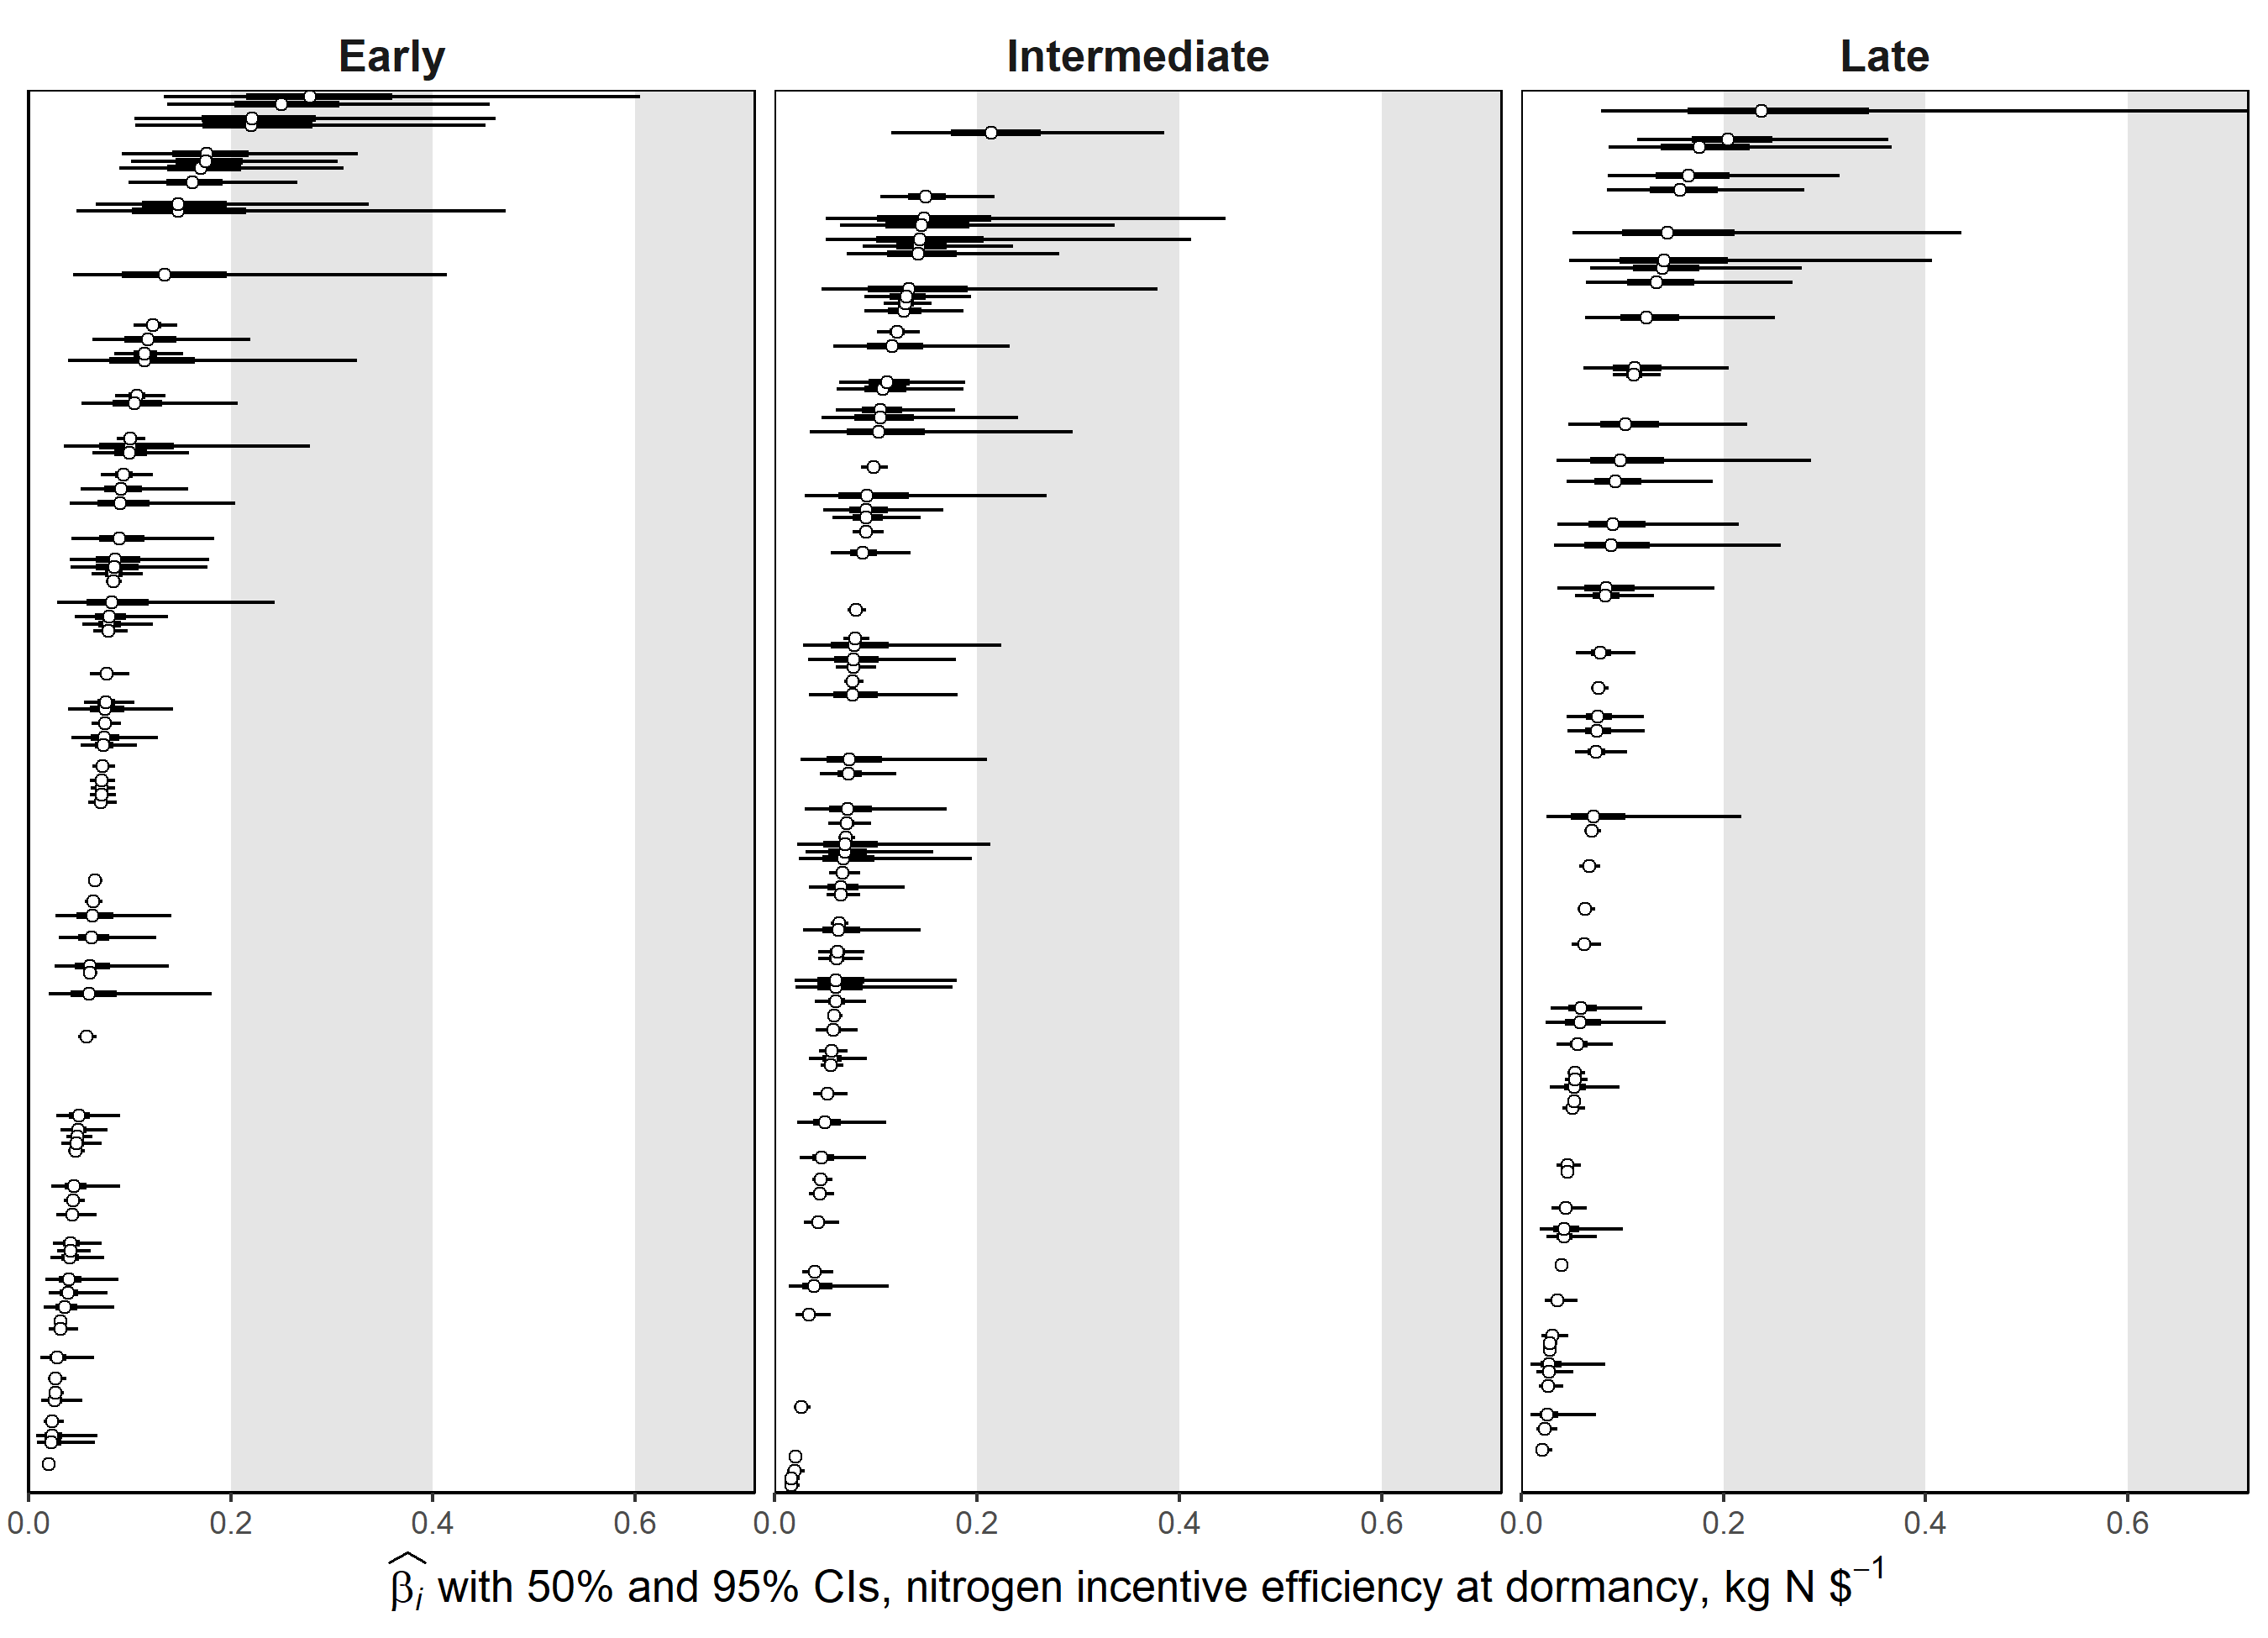
Table of ROI estimates and 95%CI for agronomic management categories (CSV)
The interactions of the management factors preclude us from making strong statistical statements about any particular main effect or practice, but there are some broad conclusions from this study. Conventional tillage is generally associated with greater biomass accumulation than broadcast or aerial seeding. This is not surprising, as good seed-soil contact is necessary for a strong crop stand. Grass species had generally similar performance among them, and planting date was not strongly associated with performance. We hypothesize two possibilities for planting date: that early-planted cover crops may be winter-damaged, since they have progressed to later phenological stages by onset of hard freezes; and that earlier planting may be associated with marginal land, rather than highly-productive agricultural fields.
We found that the distributions of ROI were similar across the two commodity programs. An option that existed during the study period allowed growers to enlist cash crop fields that had winter cover in the program (primarily wheat). This option was subject to fertilization restrictions, and was accompanied by a lower subsidy. The estimates of N scavenged per dollar spent were similarly distributed between this option and traditional, unharvested cover crops.
Likewise, the distributions of ROI were similar between planting dates (early, standard, and late) and cover crop species. While there are incentive bonuses for earlier planting and use of cereal rye, these bonuses appear to be proportional to the actual N scavenged at the winter sampling. The policy implication is that the program is well-structured, with incentives approximately commensurate to performance in this study area.
Our conclusion from these findings is that management decisions are not made randomly nor in a vacuum; growers choose cover crop management strategies that are compatible with their cash crop plans. Cash incentives thus may be a powerful tool for driving adoption of cover crops, but insufficient to change behaviors that are constrained by field conditions.
Education & outreach activities and participation summary
Participation summary:
The outreach conducted in 2017 on this project was a pair of talks at the Northeast Cover Crop Council's Annual Meeting, held in Ithaca NY. Approximately 30 people attended the talks, a combination of growers, extension agents, and researchers. These talks presented the data available for the project, our plans for analysis, and initial findings.
The outreach activities in 2018 were two talks at the American Society of Agronomy, and a PhD entrance seminar at the Department of Environmental Science and Technology at the University of Maryland. These talks discussed our methodology for the project, with a particular focus on the statistical challenges associated with this data. The methods presented were used to illustrate both the value of this dataset and this project, as well as provide an outline for Bayesian mixed models to researchers in other areas of agriculture and sustainability. There is a digital poster version of these talks attached below. Approximately 45 people attended the three talks.
Digital poster: Bayesian Estimation with Unbalanced Data in the Maryland Cover Crop Program (PDF)
In addition to these in-person presentations, this work is the subject of an upcoming journal article, currently in preparation. The estimates and findings from this study will be used as part of a suite of data that provide the back-end of interactive online decision support tools for farmers. Those websites are under active development, and will help farmers understand the factors that drive the performance of their cover crop plantings in terms of species choice, seeding rates, and economic returns.
Project Outcomes
While this study will not directly affect farmers, it will be useful as a data source for future sustainable agriculture projects.
The biomass and ROI estimates will be available to regulators at the Maryland Department of Agriculture to understand both variance of performance, as well as which management strategies are associated with high or low performance. Adjusting payment incentives is a policy decision that accounts for many factors, but this provides the opportunity to consider actual performance in the program on the Eastern Shore as one of those factors.
These data will also be useful for researchers for model validation and calibration, meta-analyses, decision support tools, and as priors in their own Bayesian modeling work. The intensity of cover crop research in the mid-Atlantic region means that such opportunities will be both frequent and high-impact.
Our primary educational finding is that traditional statistical approaches are not sufficient for medium and large datasets like those in this study. While theoretically sound, ANOVA-style analyses result in far too many coefficients and multiple comparison tests to be straightforwardly interpreted. The Bayesian approach de-emphasizes p-values and significance testing in favor of simply presenting coefficients for factor levels in context, with their CIs.
The implication for sustainable agriculture is that as we move forward with collecting ever more data in on-farm settings, we need to be planning for how to collect calibration data as well. By having training data to use for setting Bayesian priors, we can put real-world data into context. In situations where you have few observations, you can then estimate variance to better understand conditions on that farm.
This will be a useful tool for recruiting and maintaining grower-researcher relationships, as we will be able to provide feedback from studies that are more closely tailored to each grower's fields.
At the outset of this project, we aimed for several additional objectives. For example, we intended to link cover crop performance to spatial variability within the study area, in particular soil types, textures, and drainage. Unfortunately, we found that the unbalanced nature of the management variables, as well as the large number of factor levels, meant that any such analysis would be confounded and biased. While this was a large dataset, it does not represent truly "Big Data", and that is the next frontier in agricultural sustainability.
Small component studies are often performed with 2-5 site-years and 3-5 field replicates at university experiment stations; these can validate biological theory and direct future research, but inferring to larger populations is a challenge. Medium-size landscape studies like this one provide evidence to support those experiments, but are limited by the natural variation observed in study populations. Larger surveys are needed to refine our understanding of how sustainable practices interact with each other, soils, and climate.