Final report for GNE17-154
Project Information
The purpose of this project is to develop an alternative nitrogen (N) fertilizer from agricultural waste products: pyrolyzed manure (manure biochar) and the liquid fraction of screw-pressed dairy manure. In repurposing waste nutrients as crop fertilizers, we aim to prolong the sustainability of the dairy industry as well as field-crop production in New York through improved resource stewardship, reduced environmental degradation, and lower overhead costs. We propose a method for adsorbing ammonia (NH3) and ammonium (NH4+) from slurry onto manure biochar and wood biochar, relying on carbon dioxide (CO2) to enhance NH3 and NH4+ retention.
The first aspect of this project involved mechanistic experiments evaluating the N adsorption potential on two types of biochars, ash-rich human solid waste biochar (HSW biochar) and wood biochar (oxidized and unoxidized), through exposure to NH3, readily volatilized from lagoon slurry, and CO2. As we were also interested in potential applications of this technology to the waste management sector, we conducted preliminary experiments using pyrolzed human solid waste. Preliminary results suggest up to 10% N enrichment per unit weight oxidized wood biochar (ox wood biochar) through mono-layer NH3 gas adsorption. Multi-layer adsorption of CO2 and NH3 was anticipated to increase N loading through a surface-acidifying effect of CO2, which enhances surface affinity for NH3. Adsorption kinetics of ox wood biochar exposed to NH3 followed by CO2 revealed continued, albeit diminishing NH3 uptake after each CO2 treatment, averaging 5.9 mmol NH3 g-1 for the first NH3 exposure event, and 3.5 and 2.9 mmol NH3 g-1 for the second and third events. Significantly lower NH3 adsorption was observed on HSW biochar compared to ox wood biochar. The high ash fraction in HSW biochar, characteristic of manure biochars, specifically potassium (K), hindered NH3 uptake compared to wood biochar.
For the second aspect of the project, we created N-enriched soil amendments from the liquid and solid (pyrolyzed) fractions of screw-pressed dairy manure as well as from wood biochar, and determined their effect on crop growth in a greenhouse trial. Wood biochar added together with urea fertilizer promoted the greatest plant growth and plant N uptake compared to urea fertilizer alone, pointing to the effectiveness of biochar in retaining N in soil. Ammonia adsorption on wood biochar exposed to NH3+CO2, 11.3 mg N g-1, was comparable to N uptake on commercial sorbents such as zeolites and clays. While manure biochar was less effective than wood biochar in promoting plant N uptake, similar plant-available N (KCl-extractable), NH4 and NO3, were measured between manure and wood biochars, 3.36 g kg-1 versus 3.1 g kg-1, respectively. Furthermore, the ash fraction of manure, rich in potassium (K), and phosphorus (P), provides additional plant-essential nutrients in addition to N. Accordingly, the NPK nutrient value from a 5 megagram per hectare application of manure biochar sorbed with CO2+NH3 is equivalent to approximately 350 USD of synthetic fertilizer costs. This new technology has potential to mitigate waste management problems among New York dairy farmers while promoting sustainable, resourceful agronomy among grain farmers.
- To determine the relative N-loading potential between ash-rich manure biochars and wood biochar, before and after oxidation. We will use human solid waste for our mechanistic work due to our parallel interest in N-sorbing technologies in the human waste management sector.
H1: Different mechanisms are expected to drive NH3 sorption between biochar types. We expect ox wood biochar to facilitate more and stronger NH3 adsorption due to increased proportion of oxygenated functional groups and greater surface area. The high ash content of human waste biochar may be more favorable to precipitation of plant-available ammonium salts such as NH4HCO3.
- To determine the most effective method for enriching manure and wood biochars with plant-available N, whether multi-layer adsorption of NH3 and CO2, or immersion in the liquid fraction of screw-pressed dairy manure.
H2: We hypothesize sequential exposure of biochars to NH3 followed by CO2 will facilitate greater N loading than immersion in manure slurry. Ammonia forms hydrogen bonds with surface functional groups similar to water. Thus, biochar hydration through immersion in slurry may inhibit chemisorption of NH3.
- To test the effectiveness of N-enriched biochar amendments in a greenhouse trial with horticultural crops in improving plant growth and plant nitrogen-use efficiency (NUE) compared to synthetic N fertilizer.
H3: We expect greater NUE in treatments with biochar, whether N-loaded biochar or biochar added with synthetic N, due to retention of mobile NH4, facilitating prolonged uptake.
Sustainability through resourceful waste management
Nitrogen (N) management is a major challenge in agricultural systems, its procurement and disposal costing farmers thousands of dollars annually. Rural septic systems are also a source of nutrient leachate which could be utilized in the farming sector. The shift toward sustainable farming highlights the need for opportunistic waste management able to transform waste nutrients into fertilizers. Dairy manure excretion in NY alone averages 12,821,616 tons per year (1,2). Containing approximately 64,108 tons N, 38,465 tons P2O5, 44,876 tons K (3), these excreted nutrients are sufficient to fertilize the state’s corn production (4,5). The benefits incurred by transforming dairy waste and even septic waste into agronomic inputs extend to dairy farmers and grain farmers alike in NY state; a farmer growing 200-acres of corn spends $28,000/year for fertilizer (6), while a dairy farmer with 550 cows spends $27,000/year for manure storage (7). To couple these processes, new technologies for recycling waste products back into crop nutrient inputs are necessary.
Nitrogen fertilizer comprises 30% of crop production costs (7), yet only 50% of applied N (NH4+, NO3-) is taken up by plants (8). Leaching of NH4+ and nitrate (NO3-), as well as volatilization of ammonia (NH3) and nitrous oxide (N2O), are common loss pathways, causing eutrophication of surface waters, groundwater contamination, and volatilization of greenhouse gases (9). Further research toward the development of slow-release N fertilizers may address this problem.
Technologies for N removal from liquid manure
The physical separation of manure into solid and liquid fractions (slurry) significantly lowers N leaching from the solid fraction (10,11); approximately 4400 mg NH4-N L-1 is conserved in the slurry after separation (10). Technologies such as solid-liquid separation of manure are a first step in efficient re-use of waste nutrients (12). However, while manure separation and storage are efficient for offsetting nutrient runoff in early spring, N2O emissions from stored slurry have been reported (13,14). A technology is necessary for removing N from stored slurry and converting it into a fertilizer.
Zeolites have proven effective for NH4+ and NH3 adsorption (15,16), but access to mined natural zeolites may be limited and expensive in certain regions (17). Other more readily available sorbents include paper (18) and straw (19), yet low surface area and surface charge of both materials limit sorption capacity. Another option combining the high adsorption potential of zeolites with the resource availability of straw and paper is pyrolyzed biomass, or biochar. Pyrolysis transforms ordinary feedstocks such as straw, woody shrubs, and manure solids into highly porous, surface-functionalized adsorbents (20). Biochar adsorption capacity for charged species such NH4+ or phosphate (PO43-) (21,22,23) as well as uncharged organics such as phenolic compounds found in plastics, dyes, and pesticides (24,25,26) varies with feedstock and pyrolysis temperature (27,28). Heterogeneity in biochar properties poses major challenges toward product development and application. Yet it also broadens the potential for custom-made sorbents targeting specific compounds from specific environments (30,31). Further research should investigate biochar sorbents from dairy manure digestate able to adsorb waste N from lagoon slurry.
Most of the literature on biochar sorbents refer to plant-derived feedstocks (21,29,32,36,37). Yet the push to find solutions to manure waste from concentrated livestock feeding operations (CAFOs) has led researchers to investigate the utility of manure-derived biochars for agriculture (38) or for use in pollutant remediation (39). Woody biochars have a higher surface area and lower ash content compared to animal manures (27), advantageous properties in promoting surface adsorption on charged groups or nutrient removal through occlusion in pores. The high ash content in manure biochars is conducive toward a third mechanism of nutrient removal from aqueous solutions, precipitation of metals with ash in the biochar matrix (31).
Between woody biochar and poultry litter biochar, Jassal et al. (2015) found that factors such as CEC, pH, O/C ratio, and ash content showed no correlation to N adsorption (40); both types of biochars sorbed 35-38 mg N g-1 from urea ammonium nitrate solutions. In another study, pelleted digestate pyrolyzed at 500°C removed 30% P from dairy lagoon effluent (41). This sorbed P in digestate biochar pellets was plant-available, primarily in water-extractable forms. Another study reported on the superior capacity of dairy manure compared to rice husk biochar in removing heavy metals Pb, Cu, Zn, and Cd. They state that precipitation with anions CO32- and PO43- in the digestate biochar was the primary mechanism of metal removal (42). Yet of the reviewed literature, only Streubel et al. (2012) utilized the solid fraction of screw-pressed dairy manure to remove waste nutrients, specifically P, from the liquid fraction. Further work is necessary to develop similar sorbents able to remove N from the liquid fraction of screw-pressed dairy manure.
Adsorption of NH4+ and NH3 onto biochar increases with surface area, microporosity, surface pH, and surface charge (11,29,43,44). Surface area comprises an upper limit for non-specific monolayer adsorption (45) while functional groups determine the effective surface area chemically interacting with NH3 or NH4+ (19,23). Hestrin et al. (2019) found that the total N content of pyrolyzed wood oxidized with hydrogen peroxide (H2O2) increased by 9% (w w-1) after exposure to NH3 (32) through both physisorption and chemisorption. Physisorbed N is plant available in the short-term, while chemisorbed N is covalently bonded, only becoming plant-available through mineralization.
Nitrogen-enriched biochar as an alternative fertilizer
Few studies report on the plant-availability of N-sorbed biochar and its improved N-use-efficiency (NUE) over mineral fertilizer alone. Taghizadeh-Toosi et al. (2012 a,b) demonstrated the plant-availability of NH3-loaded biochar. They first succeeded in adsorbing 15NH3 from cow urine onto woody biochar, which was then taken up by ryegrass amended with 15NH3-loaded biochar (33,34). Mandal et al. (2016) report increased NUE of wheat by 24-76% when amended with urea fertilizer and biochar versus urea alone. Both types of biochar, macadamia shell and poultry litter, reduced NH3 volatilization by 70% compared to urea alone, mitigating N losses and increasing the pool of available N to plants (35).
While surface charge, acid-base interactions, and electrostatics drive N uptake by biochar made from woody feestocks, precipitation of N salts such as ammonium bicarbonate (NH4HCO3) is a more likely mechanism for N removal by ash-rich dairy manure digestate biochar. Moreover, NH3 loading via NH4HCO3 precipitation may exceed monolayer surface adsorption to multi-layered sorption through intermittent exposure to carbon dioxide (CO2) (46). Recent work has demonstrated that exposure of biochar to NH3 re-functionalizes surfaces with amine groups (32) which are then able to adsorb CO2 (46,47,48). The incorporation of CO2 molecules may further enhance NH3 retention through the formation of ammonium bicarbonate. No research has probed the bonding mechanisms and extent of N loading onto biochar through sequential adsorption of NH3 and CO2 with the end goal of developing an NH4HCO3 -intercalated biochar fertilizer with greater crop NUE than synthetic N (35).
Much of the literature on this subject pertains to removal of CO2 in aqueous NH3 solutions (49,50). McLeod et al. (2015) used hydrophobic, hollow, fiber membranes to funnel CO2 out of a methane stream into aqueous NH3. However, they were interested in forming large NH4HCO3 crystals on membrane surfaces able to detach easily upon rinsing to regenerate membranes and the NH3 solution (51). Our interests lie rather in capturing the entire mixture of NH4HCO3 -intercalated biochar for use as a mineral-organic, slow-release fertilizer. The intimate association between the first layer of chemisorbed NH3 on biochar surfaces and NH4HCO3 precipitates projecting further out from the surface is expected to provide both long-term and immediately available N.
Cooperators
- (Researcher)
- (Educator and Researcher)
Research
- Mechanistic work on ammonia adsorption on biochars
Preparation of ammonia sorbents
For our mechanistic studies, two types of feedstock, maple wood chips (Acer rubrum) and human solid waste (HSW), were converted into NH3 sorbents through pyrolysis at 500°C. We were interested in applying N-removal technology for waste management purposes in regions lacking proper sanitation, and so utilized HSW biochar for this.
HSW was collected from Fresh Life latrines in Nairobi, Kenya, in which sawdust was not provided as a cover material. Raw HSW was sun-dried to a gravimetric water content below 30% (Kern PCB 2500, Kern & Sohn GmbH, Balinger, Germany). Maple (Acer rubrum L.) wood chips were obtained from Robinson Lumber sawmill in Owego, New York. Feedstocks were pyrolyzed under argon at 500 °C for 30 min in a modified muffle furnace (Fisher Isotemp Model 126, Thermo Fisher Scientific, Waltham, MA). The resulting materials were ground and sieved to a particle size range of 149-850 µm.
Pyrolyzed maple wood was oxidized in H2O2 at a ratio of 1.6:10 g mL-1 for 25 days, rinsed in deionized water (DIH2O), and dried at 60 °C (ox wood biochar). Pyrolyzed HSW (HSW biochar) was not oxidized. Both types of biochars were degassed at 150 °C for 12 hours under vacuum on a porosimeter (ASAP 2020, Micromeritics, Norcross, GA).
Experimental procedure
Samples of ox wood biochar and HSW biochar were exposed to pure NH3 (10 atom% (AT%) 15N/14N, Sigma Aldrich, St. Louis, Mo) and pure CO2 (10 AT% 13C/12C, Sigma Aldrich, St. Louis, Mo) within a thermogravimetric analyzer (TGA; Q50 EGA furnace, TA instruments) at 30 °C in different sequences described below, and outlined in Table 1. Sample mass and temperature were recorded every 4.6 seconds. Using both elemental stoichiometry and the mass change with adsorption was important for accurately determining N and C uptake, as adsorption of the relatively heavy 16O from CO2 alters the original weight of the material with respect to the sorbing atom of interest, N or C.
The microbalance used to monitor sample mass was continually flushed with argon (Instrument grade, Airgas, Ithaca, NY). Purge lines for NH3 and CO2 were routed through an external mass flow controller (MFC; MKS 247D 4-channel, MKS Instruments Andover, MA) directly into the TGA furnace. Flow rates were lowered to 1 L min-1 through the microbalance and 9 mL min-1 through the furnace to minimize static charging of samples. A 100-μL platinum pan was used for all experiments. Before exposure to CO2 or NH3, samples were degassed a second time within the TGA under argon at 105 °C for 30 min. The argon purge continued at 30 °C until achieving a stable weight. The weight of adsorption during gas exposure within the TGA (gadsorption) was calculated as the difference between the average of the final 10 minutes during the final argon purge (gfinal) and the average of the final 10 minutes of the initial argon purge prior to CO2 or NH3 exposure (ginitial) (Equation 1).
Equation 1
![]()
Five types of gas exposure regimes were employed in triplicate: 1) ox wood biochar not exposed to gas, 2) ox wood biochar exposed to 15NH3 for one hour (ox wood biochar NH3), 3) ox wood biochar exposed to 15NH3 for one hour followed by 13CO2 for one hour followed by 14NH3 for one hour followed by 12CO2 for one hour followed by 15NH3 for one hour followed by 13CO2 for one hour (ox wood biochar NH3+CO2), 4) HSW biochar not exposed to gas, 3) HSW biochar exposed to 13CO2 for one hour followed by 15NH3 for one hour (ox wood biochar CO2+NH3) (Table 1). For all samples, between each gas exposure event, the TGA furnace was purged with argon for one hour to prevent residual CO2 and NH3 from reacting and precipitating in flow lines.
Material characterization
Heat of adsorption
The effect of amine functional groups on CO2 uptake of HSW biochar and ox wood biochar exposed to NH3 was determined by measuring the heat of adsorption of CO2 before and after exposure to NH3. Proposed bonding structures are presented in Figure S1 in the supplementary material. Samples were exposed to (unlabeled) CO2 followed by (unlabeled) NH3 for one hour each within a TGA at 30 °C. CO2 adsorption isotherms were then measured at three temperatures: 0, 25, and 35 °C (Model-ASAP 2020, Instrument Corp., Norcross, GA). To assure clean sample surfaces for isotherms, samples were degassed twice at 150 °C for 12 hours under dinitrogen gas (N2), first on the degas port and subsequently on the sample port (52). For isotherms at 0 °C, sample tubes were immersed in ice water. Heating jackets were used for isotherms at 25 °C at 35 °C. The instrument was set in manual mode to control the temperature.
Enthalpic profiles showing the isoteric heat of adsorption (HOA; Hads) as a function of quantity of adsorbed gas (q) at a given temperature and pressure (P, T) were calculated for ox wood biochar and HSW biochar with the Clausius Clapeyron equation (Equation 2) (MicroActive software, Version 4.06 (9f8ab05), Micromeritics Instrument Corp., Norcross, GA).
Equation 2
![]()
![]()
Adsorption kinetics
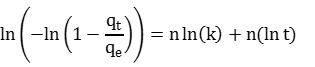
The Avrami fractional order kinetic model (Equation 3) was used to describe adsorption of CO2 and NH3 onto ox wood biochar and HSW biochar:
Equation 3
![]()
The model describes measured CO2 sorption (qt) over time (t) as a logarithmically-increasing function of the equilibrium adsorption (qe), the rate parameter (kA), and the exponent (nA). Originally developed to model phase transitions and crystal growth, the Avrami model has been recently applied to describe CO2 adsorption onto amine-functionalized surfaces (53,54). We also evaluated its performance for modeling NH3.
We inversely solved for shape parameters kA and nA through regression using Equation 4, the linearized version of Equation 3. Equilibrium CO2 adsorption at 30 °C was equated to the maximum CO2 uptake during an adsorption isotherm at 25 °C. Equilibrium NH3 concentrations were equated to the maximum NH3 uptake extrapolated from measured data, using a log function. All model parameters describing CO2 and NH3 adsorption kinetics on our materials are presented in Table S1.
Equation 4
Fourier transform infrared spectroscopy
Functional group chemistry was analyzed with attenuated total reflectance Fourier-transform-infrared-spectroscopy (ATR-FTIR) on a Vertex 70 FTIR spectrometer (Bruker Corp., Billerica, MA) equipped with a deuterated L-alanine-doped triglycine sulfate (DLaTGS) detector. Powdered samples were automatically scanned 64 times in the mid-infrared region from 4000 to 550 cm-1 with a resolution of 4 cm-1. An atmospheric compensation algorithm was applied to spectra to remove water vapor interference and instrumental drift. Spectra were baseline corrected using the rubber-band method followed by a min-max normalization according to Equation 5, where x are unnormalized spectral counts, min(x) are minimum counts values per spectra, max(x) are maximum counts per spectra, and z are normalized counts. Atmospheric correction was performed using OPUS 7.2 (Bruker Corp., Billerica, MA) while normalization was carried out in R studio (55).
Equation 5
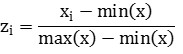
To determine changes in functional group chemistry between unexposed “control” samples, ox wood biochar and HSW biochar, and samples exposed to NH3 or NH3+CO2, difference spectra were calculated. For the difference method, samples exposed to NH3 or NH3+CO2 are normalized relative to minimum and maximum values of respective control samples. Wavenumber assignments and functional group assignments are taken from ref. 56.
Isotope ratio mass spectrometry by combustion
Total NH3-N and CO2-C uptake were determined using isotope ratio mass spectrometry (IRMS), based on total C and N stoichiometry, AT% 13C/12C and AT% 15N/14N ratios, and changes in sample mass before and after gas exposure. Total 12,13C and 14,15N of samples were measured by combustion on an isotope ratio mass spectrometer (Thermo Finnigan MAT Delta Plus, Thermo Electron Corporation, Waltham, MA) coupled to an elemental analyzer (NC2500, Carlo Erba, Egelsbach, Germany). Subsamples from each treatment were ground and weighed into tin capsules. To assure complete combustion, less than 0.5 mg of sample was mixed with 3-fold greater weight of vanadium pentoxide (Sigma Aldrich, St. Louis, MO).
Nitrogen and C uptake were calculated according to Equation 6 (shown for N), relying on the 15,14N and 13,12C AT% of samples before and after gas exposure, and the AT% of gas cylinders.
Equation 6
![]()
X-ray photoelectron spectroscopy
Carbon, N, and O bonding structures on particle surfaces were determined using X-ray photoelectron spectroscopy (XPS). While the probing depth for XPS is approximately 10 nm, electrons reaching detectors are from the first few atomic layers. Measurements were carried out at the Environmental Molecular Sciences Laboratory of the Pacific Northwest National Lab (EMSL-PNNL) using a Physical Electronics Quantera Scanning X-ray Microprobe (Physical Electronics a division of ULVAC PHI).
The XPS instrument used a focused monochromatic Al Kα X-ray (1486.7 eV) source for excitation and a spherical section analyzer and has a 32-element multichannel detection system. The X-ray beam was incident normal to the sample and the photoelectron detector was at 45 ° off-normal. High energy resolution (narrow scan) spectra were collected using a pass-energy of 69.0 eV with a step size of 0.125 eV. For the Ag 3d5/2 line, these conditions produced a full-width-half-maximum (FWHM) of 0.92 eV ± 0.05 eV. The binding energy (BE) scale is calibrated using the Cu 2p3/2 feature at 932.62 ± 0.05 eV and Au 4f7/2 at 83.96 ± 0.05 eV. To minimize charging, low energy electrons at ∼1 eV, 20 μA and low energy Ar+ ions were sputtered over the samples.
Narrow scan spectra for the C1s, N1s, and O1s core-level regions were deconvoluted with Gaussian and Lorentzian functions after Shirley background subtraction (CasaXPS, version 2.3.19PR1.0). Narrow scan spectra were also used for quantifying C, N, and O elemental ratios, incorporating relative sensitivity factors derived under extant XPS operating conditions pertaining to the instrument transmission function and source angle corrections. Potassium (K) concentration was quantified using wide-scan data.
Spectra and associated functional group chemistry of five standard compounds, ammonium carbonate ((NH4)22+CO32-), ammonium bicarbonate (NH4+HCO3-), urea, proline, and valine helped inform BE ranges for C, N and O bonds during deconvolution and peak-fitting of experimental samples (Figure S2, Tables S2and S3), along with online and published literature (57,58,59,60). For deconvolution, the FWHM of curves within each spectrum were constrained to be equal. Spectra for standards and experimental samples were calibrated through charge-referencing of the C1s carbon (C-C, C=C) peak at 294.6 eV.
2. Greenhouse trial using cow manure-derived fertilizer
Creating biochar amendments through nitrogen enrichment
Two biochars were used for the growth trial, pine wood biochar (wood biochar) and dairy manure biochar. Wood biochar was purchased from a pine factory in California and provided by Green Tree Garden Supply (Ithaca, NY). Screw-pressed dairy manure solids (99%; called ‘solid fraction’) were collected from a farm in upstate New York on April 2018 and charred in a modified muffle furnace with a rotating paddle at 500°C for 30 minutes. We then sieved both biochars to below 2 mm particle size. The liquid fraction of pressed dairy manure containing 3% solids (slurry) separated from screw-pressed dairy manure was also collected. The slurry was sieved with a 425 μm mesh sieve to remove remaining solids, and stored under refrigeration at -4°C.
Wood biochar and manure biochar were enriched with N through two methods: (1) repeated, sequential exposure to NH3 and CO2 and (2) immersion in the slurry. For the first method, 200 grams of biochar were loaded in a large, 4 L Buechner funnel positioned upright in a truncated PVC column within a drying oven at 30°C. Gas flow through the biochar-filled funnel was through a silicone tube (4 mm diameter) connected at the tip of the funnel to the gas inflow lines. A metal pie pan covered the funnel top and the funnel-pie tin interface sealed shut with parafilm.
Wood biochar was first exposed to NH3 gas, generated by pumping air at 4.72 x 10⁻⁴ m3 s-1 through an Erlenmeyer flask containing 1 L of a 2M NH4OH solution (pH 12.43) kept on a hot plate at 30°C. A silicon stopper plug wrapped in parafilm sealed the Erlenmeyer. After one hour, NH3 flow ceased, and the valve was switched to allow for CO2 flow for an hour from a cylinder of pure CO2 (Instrument grade, Airgas, Ithaca, NY). This process was repeated three times (wood biochar NH3+CO2). We reversed the order of gas exposure for manure biochar, first CO2 then NH3, also for three hours (manure biochar CO2+NH3). After gas treatment, biochars were homogenized by manual mixing.
For the second N-enrichment method, biochars were immersed in the sieved slurry for 1.5 hours at a ratio of 143 g: 1 L. The biochar-slurry suspension was contained in a large 3 L glass beaker on a hot plate at 30 °C. After the immersion period, the suspension was sieved again through a 425 μm mesh sieve to remove residual liquid. Biochars were dried at 80 °C for two days in a drying oven. We did not expose slurry-treated biochars with CO2.
To control for both N-enrichment methods explained, urea fertilizer was added with each biochar, wood biochar and manure biochar. Urea ‘1x’ treatments contained N equaling the N uptake on wood biochar after exposure to CO2 and NH3 (Table 2). Data for urea amendments presented in Table 2 did not include the full set of total N analyses; we used a larger set of data to calculate the final total N content of wood biochar CO2+NH3 presented in Table 3.
Chemical analysis of amendments
Following the creation of two replicate sets of four N-enriched biochar amendments: wood biochar treated with NH3+CO2, dairy manure char treated with NH3+CO2, wood biochar immersed in slurry, and solid-fraction dairy manure char immersed in slurry, each amendment type was thoroughly mixed and stored in 2-quart glass jars sealed with a metal lid wrapped in parafilm. Subsamples of amendments were milled with a ceramic mortar and pestle and analyzed for total C and N analysis by combustion (Elementar; vario EL cube, Langenselbold, Germany). Non-milled amendment subsamples were extracted with 2M KCl at a ratio of 0.1 g mL-1 g (char mL-1 KCl) and tested for NH4 and NO3 through a colorimetric method on an auto-flow analyzer (AA3 HR AutoAnalyzer, Seal Analytical, Mequon, WI).
Non-milled amendment samples were analyzed for plant-available and total elements. Plant-available nutrients were extracted using a Mehlich-III solution at ratio of 0.1 g mL-1. Total elemental analysis was conducted on 0.5 g of unmilled biochar amendments spiked with 0.25 mg L-1 yttrium as an internal standard. Samples were dissolved in perchloric acid (3 mL) and nitric acid (7 mL) at 180°C, dried down to ~ 0.5 mL, and brought to up to a volume of 25 mL with water. Both Mehlich-III extracts and digestate solutions were analyzed by inductively-coupled plasma optical emission spectroscopy (ICP-OES; Spectro Arcos, Ametek Materials Analysis, Kleve, Germany).
Greenhouse trial to evaluate amendment
Mulch & Soil Council grow test with biochar amendments
A six-week growth trial was conducted to test amendment performance according to a modified version of the Mulch & Soil Council growth test (2018) (61). Three plants were grown in a peat and coconut coir potting mix (TH6, Theriault and Hachey Peat Moss Ltd., Baie Sainte-Anne, New Brunswick Canada) in square pots 0.3 L by volume to which biochars were added. Wood biochar amendments were added at 10% by pot volume according to its bulk density, while manure biochar amendments were added at an equivalent carbon ratio as wood biochar. This resulted in unequal mass and nutrients additions between wood biochar and manure biochar. To correct for the increased nutrient addition with manure biochar compared to wood biochar, 0.62 grams of nutrient powder comprised of pure chemical reagents (Table S4) was added to all non-manure biochar treatments based on the Mehlich-III extractable nutrient content of manure biochar.
After all pots were filled with the pre-determined potting soil, biochar, and/or nutrient solutions and N fertilizer, five seeds were planted in each pot. Seedlings were thinned after two weeks, and the germination rate recorded for each pot. Pots in which no seeds germinated received seedlings from replicate pots of the same treatment in which more than one seed germinated.
Nitrogen fertilizer response curve
The N-fertilizing potential of biochar amendments was interpolated from an N-response curve measured from plants grown with urea fertilizer (Urea 99% reagent grade, Sigma Aldrich). Five urea application rates were tested based on the increase in total N on wood biochar after sequential exposure to NH3 followed by CO2 (Table 2): (1) 1.5 times the N increase of wood biochar after NH3 and CO2 exposure (1.5x) = 52.65 mg N pot-1, (2) the equivalent N-application rate as the N increase of wood biochar (1x) = 35.10 mg N pot-1, (3) half of the N increase (0.5x) = 17.55 mg N pot-1, (4) one quarter of the N increase (0.25x) = 8.78 mg N pot-1, and (5) no added fertilizer (0x). In addition, wood biochar and manure biochar were added with urea (1x) to determine the effect of biochar on fertilizer-N availability.
Irrigation
All plants were irrigated daily with reverse osmosis water to 90% of field capacity, determined gravimetrically. The field capacity of TH6 media amended with wood biochar or manure biochar was calculated as the amount of water remaining in a 0.3-L PVC cylinder filled with soil after saturation and draining overnight. Irrigation was lowered from field capacity by 10% to prevent leachate during the experiment.
At day one of the experiment, to overcome the natural hydrophobicity of the peat and coir-based potting mix and biochars, all pots were placed in trays of water filled to 25% volume of the pot height to allow water to imbibe from the bottom-up. From day two of the experiment until day 12, pots were misted from the top daily. After day 12, after germination, pots were weighed to determine the amount of water needed to reach 90% of field capacity. A description of the thirteen potting mixtures and irrigation amounts is provided in the supplementary information (Table S5).
Harvest and analyses
All plants were harvested after forty days and wet shoot and root biomass recorded. Shoots were cut at the soil surface, and roots were excavated from each pot. The most root-dense portion of the potting mix was separated from the bulk soil, and loose soil shaken off. Roots were isolated from the potting media via washing and sieving. Dry root and shoot biomass were determined after drying at 65°C for three days. Soil was dried at 105°C for three days. Total C and N contents in shoots and roots were determined by dry combustion (Elementar; vario EL cube, Langenselbold, Germany). Soils were extracted with Mehlich-III following the experiment to determine changes in available nutrients. The pH of each potting mixture was measured before and after the growth trial in a water suspension of 1 g amendment in 20 mL water.
For each of three plant types (marigold = i1, tomato = i2, radish = i3) and biomass type (roots = j1, shoots = j2), the percent increase in biomass and N uptake across four replicates (k = 1:4) of amended plants relative to the average of four replicates of unamended plants for the same plant and biomass type was calculated according to Equation 7,
Equation 7
![]()
Nitrogen-fertilizer equivalency of biochar amendments
The N-fertilizer equivalency of amendments was calculated based on the difference in dry yield between plants grown with urea alone and plants grown with biochar amendments. Using market prices for mineral fertilizers, we calculated the replacement value of the plant-available N, P, and K in amendments.
Statistics
Data analysis was carried out using RStudio (55). Graphs were created using the ggplot2 package (62). The kinetics of CO2 and NH3 adsorption were modeled using the non-linear regression function nls(). Least squares of treatment means (LS means) were calculated using the emmeans package (63) through the lm command. Order-independent p values determined with the Student-t test were adjusted using Tukey’s method for comparing a family of five estimates at the α = 0.05 threshold. Compact letter displays of pairwise comparisons for a significance level of p < 0.05 were created using the cld command from the package multcompView (64). Type I analysis of variance (ANOVA) using an order-dependent F test was also carried out within the emmeans package using the anova command. All mention of ‘significant differences’ refers to probability of observing an F ratio greater than 0.05 given the null hypothesis, Pr(>F), or a p value < 0.05.
Results:
1. Mechanistic studies of ammonia and carbon dioxide adsorption
Thermodynamics and kinetics of adsorption
The CO2 HOA of native HSW biochar was 24% greater than that of native ox wood biochar, 55.1 (kJ mol-1) vs. 44.4 (kJ mol-1), falling above the chemisorption threshold of 50 (kJ mol-1) (65). After exposure to NH3, the CO2 HOA of ox wood biochar increased to 51.0 (kJ mol-1), demonstrating the effectiveness of newly-incorporated amine groups from NH3 exposure for chemisorbing CO2. For HSW biochar, exposure to CO2 followed by NH3 had little effect on the CO2 HOA, which increased by only 0.56% (Figure 1A).
Thermograms of the weight of gas adsorption in ox wood biochar NH3+CO2 showed a monotonic increase with repeated exposure to NH3 followed by CO2 (Figure 1B, Figure S3). Regular argon purges lowered the weight, but never to the stable, degassed weight. The end weight of ox wood biochar NH3+CO2, exposed to three cycles of NH3 (1hr) followed by CO2 (1 hr) (Table 1), was 14% greater than the degassed weight. The weight increase in ox wood biochar was of a similar magnitude after each CO2 exposure interval, and was 4.6-fold greater than in HSW biochar, 4.8% (w w-1) vs. 1.03% (w w-1). Exposure of ox wood biochar to NH3 had a greater effect on sample weight than exposure to CO2, but the magnitude of weight increase with NH3 exposure decreased with repeated exposure, from 8.9% (w w-1) after the first exposure to 5.5% (w w-1) after the third exposure. Gravimetrically-measured NH3 adsorption to HSW biochar was 2.4-fold less (3.7 % w w-1) than in ox wood biochar after the first exposure (Figure 1C,D, Figure S3B,C).
The Avrami rate coefficient for CO2 adsorption on ox wood biochar, k, had similar values, 0.021-0.025 (s-1) between exposure intervals, while for NH3, k sharply decreased from 0.053 to 0.004 (s-1) between the first and second intervals (Table S1). The magnitude of exponent n was lower than unity for the first and third CO2 exposure events, creating a fit closer to first-order kinetics, as the curve shape is not sensitive to exponent values between 0.1-1, but takes on an increasingly-pronounced S-shape as values increase above 1. The shelf-like curve and low n describing NH3 adsorption on ox wood biochar resemble high affinity ‘H-curves’ (Figure 1C, Figure S3C) (66) rather than S-shaped kinetics aptly captured with the Avrami model. Nevertheless, a good fit of the Avrami model to CO2 and NH3 adsorption in HSW biochar was observed (Figure 1D, Figure S3B).
Isotope ratio mass spectrometry
Total N uptake, calculated using Equation 6and relying on combined IRMS and TGA data, was 1.6-fold greater in ox wood biochar repeatedly exposed to CO2 after NH3 (ox wood biochar NH3+CO2) than ox wood biochar only exposed to NH3 (ox wood biochar NH3), 46.43 (mg g-1) vs. 28.40 mg g-1. Furthermore, N uptake was 11.7-fold greater in ox wood biochar compared to HSW biochar exposed to one interval of CO2+NH3 (3.97 mg g-1) (Table 1). Ox wood biochar exposed to three intervals of NH3+CO2 also took up greater C compared to HSW biochar, 21.93 (mg g-1) vs. 4.04 (mg g-1) despite lower CO2 HOA and lower total N content and associated amine groups (Figure 1A, Table 4). The molar ratio of N/C uptake in ox wood biochar was 1.81 mol N/ mol C, while that in HSW biochar was only 0.80 mol N/ mol C.
Spectroscopic investigation of the nitrogen and carbon bonding environment
FTIR
Containing 4% (w w-1) total N, HSW biochar is enriched in organic N even before exposure to NH3. The adsorption peak at 1040 cm-1 in the HSW biochar spectra confirms the presence of amines (56) (peak #7 in Figure 2A, Table 5) which contribute to surface alkalinity, HSW biochar having a pH of 10.34 in water (Table S6). We have ruled out silicon or clay minerals as the interpretation for this peak, contrary to ref. 67 and ref. 68 for animal manures and compost teas; HSW was freshly collected from waste buckets and had not been mixed with soil or residual plant material. Moreover, no silicon was detected in wide-scan XPS spectra of milled HSW biochar while a prominent N peak was evident (Figure S4). We have also ruled out ethers or primary alcohols (C-O stretch), which are more common in woody biochars (69). Furthermore, ref. 16 interpret a peak at 1082 cm-1 as NH3 adsorbed to Lewis acid sites in oxidized graphene.
We expected high affinity between the basic amine surface functional groups in HSW biochar and CO2, the central C atom of which behaves as a Lewis acid in binding with the free electron pair on N in amine functional groups (70,71). In contrast to HSW biochar, ox wood biochar has an acidic pH (3.8 in H2O), low total N content (0.8% w w-1), and strong IR absorbance in regions corresponding to acidic functional groups such as carboxyls at 1709 cm-1 (peak #2) and phenols at 1215 cm-1 (peak #6) (Figure 2A, Table 5). High affinity between acidic surface functional groups in ox wood biochar and the Lewis base NH3 was therefore expected.
FTIR difference spectra rather than non-difference spectra provided clearer distinction of chemical changes in ox wood biochar and HSW biochar following exposure to NH3 or NH3+CO2. Following exposure of HSW biochar to CO2+NH3, a decrease in the secondary NH amine bend at 1570 cm-1 (peak #3) and the tertiary aromatic amine CN stretch at 1362 cm-1 was observed in the difference spectrum (peak #5; Figure 2A, Table 5). These amine functionalities are binding sites for CO2. Peak #3 appears right-shifted in the non-difference spectrum for HSW biochar CO2+NH3, causing the dip in the position of peak #3 in the HSW biochar difference spectrum. The appearance of peak #4 at 1435 cm-1 in the HSW biochar CO2+NH3 difference spectrum indicates the presence of NH4+.
Unlike the difference spectrum for HSW biochar CO2+NH3, peak positions #3 and #5 were sharp and prominent for ox wood biochar NH3 and to a lesser degree for ox wood biochar CO2+NH3. In the ox wood biochar non-difference spectrum, peak #3 lies just right of and on the shoulder of the C=C-C aromatic ring stretch peak (1615-1580 cm-1). The shoulder to the left of peak #3 in non-difference spectrum of ox wood biochar NH3 and ox wood biochar CO2+NH3 is likely an overlap of the C=C-C aromatic ring stretch and newly-incorporated amines (NH bend; 1650-1550 cm-1). Also noteworthy is the disappearance of peaks #2 and #6 in ox wood biochar NH3 and ox wood biochar NH3+CO2 non-difference spectra corresponding to carboxylic acid and phenol. These acidic functionalities serve as NH3 binding sites.
XPS
Significant N uptake on ox wood biochar surfaces exposed to NH3 and NH3+CO2 was apparent from the sizable N1s peaks in the XPS spectra collected from exposed samples compared to XPS spectra collected from unexposed ox wood biochar. Pyridinic N at 398.0 – 398.9 eV (peak # 14,15) comprised more than 21% of the curve area in spectra collected from both ox wood biochar NH3 and ox wood biochar NH3+CO2, indicating the formation of heterocyclic N compounds with NH3 exposure (Table 6, Table 7). Additionally, 55.9-60.3% of N forms in these samples were detected as electrostatically-sorbed N (C-O—NH4+) and 12.1-16.8% as NH4+.
The center of the N1s spectrum for ox wood biochar exposed to both NH3+CO2 (399.8 eV) is shifted toward higher energies compared to ox wood biochar exposed to only NH3 (399.3 eV). The contribution of a Gaussian curve representing primary amine compounds (C-NH2, 399-399.5 eV) shifts the N1s curve center for ox wood biochar NH3 to lower energies. Pyridinic N (peak #14,15) and aromatic N bonded to ketone groups at 400.0-400.5 eV (peak #11) comprised over 44% of N in unexposed HSW biochar surfaces. Traces of mineral N as NH4+ were also evident, comprising about 7% of the initial N compounds in HSW biochar. Following exposure of HSW biochar to CO2+NH3, three new features appear: non-aromatic amidic N at 400.5 – 400.9 eV (peak #10), electrostatically-sorbed NH4+ at 399.5 – 400.0 eV (peak #12), and amine-N at 399.0 – 399.5 eV (peak #13).
Carbon 1s peaks were identical for HSW biochar before and after exposure to CO2+NH3, showing a large C=C feature at 284.0 – 285.0 eV (peak #6) and smaller contributions from C-N at 285.0 – 286.0 eV (peak #5) and C-O at 286.0 – 287.0 eV (peak #4). Amide peaks in the C1s energy range (N-C=O, 289.0 – 290.5 eV peak #1) increased by 2.8-fold in HSW biochar CO2+NH3 compared to HSW biochar. Spectral variation in the C1s energy region is more evident in ox wood biochar before and after exposure to NH3 and between ox wood biochar exposed to NH3 and NH3+CO2. The curve associated with the C-N (peak #5) is largest in ox wood biochar NH3, while the higher-energy C=C curve at 288.5 – 288.8 eV (peak #2) is greatest for ox wood biochar exposed to NH3+CO2. The upward slant in O1s peaks for ox wood biochar exposed to NH3 and NH3+CO2 is caused by an increase in C=O functionalities at 531.0 – 531.3 eV (peak # 20) relative to C-O at 532.0 – 533.3 eV (peak #18). Additional features associated with water appeared in HSW biochar CO2+NH3 at 533.5 – 536.0 eV (peak #16) compared to unexposed HSW biochar.
2. Greenhouse study
Preparing amendments
Exposing wood biochar to NH3 and CO2 increased total N by 1.13% points, from 0.75% in unexposed wood biochar to 1.88% (w w-1). No change was observed in the total N content of manure biochar after exposure to CO2 and NH3. Gas exposure significantly increased extractable NH4 in both types of biochars from below 5 to above 3000 mg kg-1. Nitrate was only present in the potting media. Wood biochar consisted almost entirely of carbon, 907.2 mg g-1 (w w-1) while manure biochar contained only 442.8 mg g-1 (w w-1) carbon. Immersion of both biochars in slurry increased their total N content but did not significantly increase the amount of KCl-extractable NH4 and NO3 (Table 3).
Manure biochar contained significantly greater total (acid-digestible) and plant-available (Mehlich-III extractable) Ca, Mg, P by mass than wood biochar (Table 8, Table 9). Calcium comprised more than 15% of manure biochar mass and was less than 1% of wood biochar mass. Significantly greater total micronutrients (B, Cu, Fe, Mn, Zn) were observed in manure biochar compared to wood biochar, 3.14 vs. 0.80 g kg-1, respectively. Total concentrations of heavy metals (Cd, Pb) were also significantly greater in manure biochar compared to wood biochar, 15.26 vs. 3.04 mg kg-1 (Table 8). This trend was reversed for the plant-available fraction of micronutrients, heavy metals, and Al, with wood biochar containing significantly higher concentrations compared to manure biochar. Although less than half of total micronutrients in wood biochar were plant-available, 358.3 out of 804.8 mg g-1 total, plant-available micronutrients in wood biochar were 2.5-fold greater than those in manure biochar (146.1 mg g-1). Furthermore, the plant-available heavy metals were 12-fold greater in wood biochar than manure biochar, reaching 9.8 mg g-1 vs. 0.84 mg g-1, respectively (Table 9).
Growth trial
The positive effect of biochar on plant growth was apparent, as the biomass increase relative to the control was greatest with additions of wood biochar and urea (1x) for shoots (34.4 – 55.8 %) and roots (45.6 – 69.3%) compared to other amendments (Figure 3, Table 10). Wood biochar and urea (1x) was correlated with the greatest shoot mass of marigold (3.1 g pot-1) and tomato plants (4.1 g pot-1), and root mass of marigold (1.2 g pot-1) and tomato plants (0.8 g pot-1) compared to other amendments (Table S7).
A plant-specific response to the manure biochar amendments was observed. The biomass increase in tomatoes grown with either manure biochar CO2+NH3 or manure biochar+urea (1x) relative to the control was 24.0 – 31.1% for shoots and 18.0 – 32.8% for roots (Figure 3, Table 10). Tomato shoots and radish roots growth with manure biochar CO2+NH3 also outperformed all fertilizer treatments by 0.34-1.5 g pot-1 on average (Table S7). Radish root biomass was greatest (4.1 g pot-1) with additions of manure biochar+urea (1x) while radish shoot biomass was greatest (1.3 g pot-1) with 1.5x urea additions (Table S7).
Germination was affected by plant type and amendment, lower with greater nutrient additions for marigold and radish, and higher with highest nutrient additions for tomato. Unamended (0x) and manure biochar-amended marigold and radish had the highest germination rates, 80-90%, while tomato plants amended with the highest urea application rates, 1.5x and wood char, reached 100% germination (Table S7).
Plant biomass did not always increase in response to biochar additions, varying between a reduction by 79.6% and an increase by 86.4%. A significant increase in biomass of amended plants was observed for radish roots and shoots; radish roots grown with manure biochar+urea (1x) had 77.6% greater biomass while radish shoots grown with urea (1.5x) had 73.8% greater biomass than unamended plants. Marigold shoots and tomato shoots and roots grown with wood biochar+urea (1x) had 33.4 – 69.3% greater biomass, significantly higher than unamended plants (Figure 3, Table 10).
pH of potting mix after the trial
After 40 days, the pH of pots amended with manure biochar (7.02 – 7.46) were significantly higher than unamended soil and soil amended with urea (1x and 1.5x) (6.11-6.48) (Table 10). Wood biochar amendments did not significantly increase pH of unamended potting mix, although the pH of pots with wood biochar+slurry (6.47-7.03) were highest among all wood biochar treatments (6.25-6.74).
Nitrogen uptake
The increased biomass growth with additions of wood biochar+urea (1x) corresponded with root N uptake, while the relative increase in N uptake in shoot biomass was greatest for the highest urea additions (1.5x). For all plants, total N uptake was in proportion to N additions, reaching an upper limit of 6.6 g pot-1 for tomato shoots grown with urea alone (1.5x). The increase in N uptake in marigold, radish, and tomato shoots grown with urea (1.5x) relative to unamended plants was 87.4%, 143.8%, and 92.4% respectively. Plant root N uptake did not correlate to N additions, but was greatest with additions of wood biochar+urea (1x) for marigold and tomato plants, increasing by 37.2% and 70.7% above unamended plants. Radish plants amended with manure biochar NH3+CO2 had the greatest root N uptake, 87.9% above unamended radish plans (Table 10, Figure 4, Figure 5).
Between plants which received the same amount of N inputs (urea 1x, manure biochar+urea (1x), wood biochar CO2+NH3, and wood biochar+urea (1x)), all root N uptake was greatest with additions of wood biochar+urea (1x). Shoot N uptake was greatest for radish and tomato with additions of urea alone (1x) while it was highest in marigold plants amended with manure biochar+urea (1x) (Table 10).
Discussion
2. Mechanistic study on CO2-mediated NH3 uptake on biochars
Effects of surface chemistry and surface area on adsorption
Adsorption of NH3 and CO2 caused a non-negligible weight increase in both ox wood biochar and HSW biochar. Gas uptake increased with repeated exposure to both CO2 and NH3, judging by the 4.3-fold mass increase in ox wood biochar NH3+CO2, 14.70 (%w w-1) compared to ox wood biochar NH3, 4.29 (%w w-1) (Table 4). Strong sorption of NH3 on acidic functional groups such as carboxyl C is well-documented in the literature (46,71,72), as is chemisorption of CO2 onto amine functionalized scaffolds (73,74,75,76,77), making both ox wood biochar and HSW biochar ideal materials for layered NH3 and CO2 (CO2 and NH3) adsorption. Surface area played a greater role in facilitating repeated gas uptake on ox wood biochar compared to HSW biochar than surface chemistry. The specific surface area of ox wood biochar was 3.73-fold greater than HSW biochar, 275.7 compared to 74 (m2 g-1) (Table S6).
Altered surface properties with NH3 and CO2 adsorption
The initial surface chemistry in native ox wood biochar promoting high affinity for NH3 included carboxylic, ketone, and phenolic groups. Furthermore, N compounds in ox wood biochar after one hour of NH3 exposure were similar to N compounds after three hours of NH3+CO2. Thus, sequential exposure of ox wood biochar to NH3 and CO2 resulted in an extension of the surface chemistry outwards. We initially expected greater total C and N uptake in HSW biochar through the layered sorption effect of subsequent exposure to CO2 and NH3. Its high initial N content, 4.57% (w w-1) and associated amine groups led us to expect between 1.63 – 3.26 mmol C g-1 or 19.6-39.2 mg C g-1, for CO2 sorption on either primary, secondary, or tertiary amines. If NH3 uptake continued according to the molar C/N uptake ratio (1.2) measured for HSW biochar in Table 4, we would have expected 1.4-2.7 mmol N g-1 or 16.3 – 32.6 mg N g-1. However, the high ash content of HSW biochar (39% w w-1) compared to ox wood biochar (0.7% w w-1) may have impeded access to pore spaces, lowering CO2 uptake to 4.04%, far below expected values (Table S6, Table 4). Thus, while the adsorption strength of CO2 was greater in HSW biochar compared to ox wood biochar, reduced diffusion into pore spaces limited access of CO2 to most amine groups, lowering any expected effect of CO2 exposure on subsequent NH3 uptake.
Furthermore, the residual water in HSW biochar coupled with its high ash content served to ‘consume’ CO2 through the speciation to bicarbonate and subsequent ion pair formation with ash minerals such as K. Oxygen XPS spectra indicated that there were small amounts of H2O in HSW biochar before and after exposure to CO2+NH3, even after degassing, but not in ox wood biochar (Figure 2B, Table 6). Residual water has been shown to catalyze the formation of bicarbonate (78,79,80,81) which can interact with cationic species including NH4+, but may have a higher affinity for divalent ions and K+. The molar ratio of NH3-N vs. CO2 -C uptake in ox wood biochar NH3+CO2 was two-fold greater than HSW biochar CO2+NH3. Taken together, these results suggest that HSW’s high ash content may have reduced NH4+ adsorption following CO2 exposure.
Metal effects on CO2 and NH3 adsorption
The increase in surface K+ concentrations of HSW biochar following exposure to CO2+NH3 is possible evidence of potassium bicarbonate ion pairs precipitating on the surface. XPS data revealed a 2.7-fold increase in the K2p1 peak area of HSW biochar exposed to CO2+NH3 compared to HSW biochar (Figure S5), as well as 8.64% (w w-1) greater total K in HSW biochar CO2+NH3, compared to native HSW biochar (Table S6). While bulk total K+ was not altered by NH3 or CO2 exposure, it is possible that alkali ions within the HSW migrated or “jumped” to fill empty sites, as has been observed for crystalline solids such as glass (82). It is unclear whether the presence of HCO3- created an energetically-favorable circumstance for K+ migration to surfaces, although this is may be the only explanation for the 8.66%-point increase in surface K+ following CO2 and NH3 exposure. Thus, while repeated, sequential NH3 uptake is expected in ox wood biochar NH3+CO2, the nature of CO2 interactions with the ash fraction in HSW biochar restricts repeated, sequential CO2 or NH3 adsorption. Improved adsorption might be possible by leaching the ash fraction from HSW biochar, although rinsing will also lower phosphorus (P), K+, magnesium (Mg2+), and calcium (Ca2+) concentrations, possibly lowering the overall agronomic value of the fertilizer.
In summary, significant sequential adsorption of NH3 followed by CO2 is possible in solid porous sorbents under dry conditions. Sorption kinetics of ox wood biochar demonstrated that surface affinity can switch between NH3 and CO2, allowing for material accretion through repeated chemisorption. Decentralized waste management systems can convert what is normally considered an environmental and human health hazard, untreated HSW and urine, into N-enriched soil amendments. The combination of pyrolysis-based sanitation with CO2 emitted during pyrolysis can create porous sorbents primed for NH3 uptake. Furthermore, the process of material accretion through gaseous chemisorption points to the possibility of growing a fertilizer.
2. Effect of N-enriched biochars on plant growth
Ammonia adsorption on biochar
Ammonia uptake in wood biochar exposed to NH3+CO2, 11.3 mg N g-1, was comparable to N uptake on zeolites, clay, and biochar sorbents immersed in 100 mM NH4 solution, 3.1 – 11.7 mg N (83). Adsorption of N onto wood biochar may have promoted greater root N uptake in plants amended with wood biochar+urea (1x). In the presence of urease, an enzyme ubiquitous in natural systems, urea hydrolyzes into NH3 and protonates to NH4 below pH 8 (84). Both NH3 and NH4 bind to wood biochar through electrostatic and covalent interactions. Greater root colonization of sugar cane and sorghum roots resulted from NH4 adsorption on a variety of sorbents, zeolites, clays, biochar, lowering root-zone NH4 fluxes (83). Thus relying on NH3-sorbed biochar or even biochar added together with synthetic fertilizer has the dual benefit of limiting NH4 leaching while increasing plant NUE. Implementing biochar-based fertilizers provides a solution for dairy and grain farmers in NY state. Dairy farmers are required to lower N and P loading into the Chesapeake Bay (85) while the increased yield and NUE in grain crops grown with biochar should increase farmer profits.
Retention of both NH3 and NH4 on wood biochar is enhanced with oxidation (32, 44,86). Extensive chemical oxidation of wood biochar in 30% hydrogen peroxide (H2O2) increased NH3 uptake by 9 mmol N g-1 compared to unoxidized wood biochar (32). Significantly greater plant biomass and greater 15NH4 uptake was measured in N-fertilized plants amended wood biochar oxidized with H2O2 compared to unoxidized, fresh biochar (87). Greater plant biomass and N uptake could have resulted from wood biochar+urea (1x) or wood biochar NH3+CO2 if wood biochar had been oxidized beforehand. Future implementation of N-sorbed biochar should consider pre-oxidation of wood biochar before the NH3 treatment.
Plant biomass and nitrogen uptake
The lower relative increase in biomass and total N uptake in wood biochar+slurry may have been due to reduced available N in the amendment compared to other wood biochar treatments. Slurry contained similar amounts of total N as wood biochar NH3+CO2 (wood biochar+urea (1x)), 1.84 % vs. 1.88% but resulted in 23-45% less shoot total N compared to wood biochar NH3+CO2 or wood biochar+urea (1x). The plant-availability of organic N in lagoon slurry is time-dependent and varies with manure age and processing. Fresh, uncomposted manure has quicker mineralization rates than aged or composted manure. Up to 18% of organic N in dried, fresh poultry manure was reportedly mineralized within the first 8 weeks of incubation in a silt loam soil, while N was primarily immobilized in aged poultry manure within the first four weeks, with noticeable mineralization occurring after 8 weeks (88). Faster mineralization rates are expected from fresh lagoon slurry, comprised of liquid and particulate organic matter. Pettygrove et al. (2003) determined that 27-44% of total N in fresh lagoon slurry was mineralized after 6 weeks when incubated in a sandy loam soil (89). The low pH of peat-coir potting media, a master variable controlling among many things microbial abundance and diversity, may have slowed slurry-N mineralization rates compared to rates reported for mineral soils (90).
Fertilizer replacement value of amendments
Plant-available (KCl-extractable) NH4 and NO3 increased by 3.1 g kg-1 in wood biochar and by 3.36 g kg-1 in manure char NH3+CO2 (CO2+NH3) treatment (Table 3). Accordingly, the N-replacement value per megagram of biochar, calculated using international fertilizer prices (91,92), was 7.85 USD Mg-1 for wood biochar and 5.51 USD Mg-1 for manure biochar. The added benefit of the high ash content of dairy manure biochar was not evaluated, as equivalent nutrients to the Mehlich-III extractable nutrients in dairy manure biochar were added to all other treatments. Nevertheless, the high P and K value in dairy manure biochar may be advantageous to farmers, providing 1.08 kg P Mg-1 and 9.87 K kg Mg-1 which gives a value of 7.82 USD and 56.65 USD per Mg biochar, respectively (91,92). Thus, the NPK nutrient value from a 5 megagram per hectare application of manure biochar sorbed with CO2+NH3 should contain NPK worth about 350 USD, offsetting synthetic fertilizer costs.
A novel fertilizer has been developed from dairy waste which performs equally well to conventional urea fertilizer. Through pyrolysis, the solid fraction of screw-pressed dairy manure is stabilized against decay, transformed into a porous, ash-rich source of stable carbon. The physio-chemical properties of pyrolyzed dairy manure facilitate adsorption of a volatile waste product of dairy manure lagoons, NH3. This process is enhanced through sequential exposure to CO2. The plant-available N,P,K content of a 5 megagram application per hectare of NH3 and CO2-sorbed pyrolyzed dairy manure is approximately 17 kg N, 5 kg P, 50 kg K and has a nutrient-replacement value of 350 USD.
Wood biochar can also be transformed into an NH3 sorbent. Not only did NH3 and CO2-sorbed wood bicohar contain similar amount of plant-available N as manure biochar, 3.1 vs. 3.36 k kg-1, but promoted greater plant biomass and plant-N uptake than manure biochar or conventional urea fertilizer. Different NH3 sorption mechanisms on low-ash wood biochar versus high-ash manure biochar alter long-term N availability; wood biochar promotes greater chemisorption of NH3 on surface functional groups while the precipitation of NH3-salts is predominant on manure biochar. The drawback of low-ash biochar is the lower amount of plant-essential P and K.
One ideal solution is to combine both types of biochars after exposure to NH3 and CO2. A hindrance to the development of these fertilizer products is access to an industrial–scale pyrolysis unit. There may also be technical difficulties in capturing volatilizing NH3 from dairy manure, although one solution is installment of a biochar filter over the atmosphere of a liquid manure holding tank. Further engineering is needed to scale up the proof of concept reported in this research to wide-spread treatment of NY state dairy waste. This research nevertheless demonstrates the feasibility of converting dairy manure waste into a dry, granular fertilizer, an outcome expected to significantly reduce pollution from manure waste while lowering the carbon footprint of NY state farmers by providing alternatives to commercial fertilizers.
Education & outreach activities and participation summary
Participation summary:
We have written a journal article summarizing our research findings which will be submitted for publication after revisions.
We have also collaborated with GreenTree Garden Supply on this project and will continue to discuss with them how to convert this proof-of-concept into a marketable product.
Project Outcomes
The plant-available N,P,K content of a 5 megagram application per hectare of NH3 and CO2-sorbed pyrolyzed dairy manure is approximately 17 kg N, 5 kg P, 50 kg K and has a nutrient-replacement value of 350 USD. This product can indeed offset the need for chemical fertilizers, but requires further work to determine transport and application costs.
Sorption of NH3 onto wood biochar is partially through strong adsorption; N forms generated on biochar surfaces are not immediately plant-available, but require months of incubation in soil to degrade, behaving as a long-term fertilizer.
Through our collaboration with GreenTree Garden Supply, we became aware of the potential to develop an actual fertilizer product. The need to transfer academic research into the public sphere was made very clear to me throughout this project. I also became aware of the scale of dairy manure waste in NY state, and the need to find alternative solutions to storage in lagoons.
This project was more focused on research and development than outreach. Part of the issue was the novelty of the project- we did not feel that the level of work and our results were sufficient to 'roll out' a product to farmers. However, the collaboration with GreenTree will facilitate future opportunities to reach farmers as we work together to develop a marketable product.